Abstract
Selected reaction monitoring mass spectrometry (SRM-MS) is a sensitive and accurate method for quantification of targeted proteins in biological specimens. However, the sample throughput and reliability of this technique is limited by the complexity of sample preparation, as well as instrumentation and data processing. Modern robotic equipment allows for rapid and accurate processing of large number of samples and makes SRM-MS assay applicable in epidemiological studies. Herein, we describe an automated sample processing platform developed in the context of an SRM-MS protocol for the assay of complement factor H protein and its variants in human plasma. We report detailed performance data on plasma digestion, sample cleanup and optimized robotic handling implemented on a Biomek® NXp Workstation. Method validation was assessed with isotopically labeled peptide standards and had high reproducibility of intra-day assay (CVs from 2.7 to 17.5% with median CV of 5.3%) and inter-day assay (CVs from 4.8 to 17.6 with median CV of 7.2%) for all peptides.
Keywords: Absolute quantification, Automated sample preparation, Heavy isotope-labeled peptides, Reproducibility, SRM
Selected reaction monitoring (SRM), also known as multiple reaction monitoring (MRM), is a targeted mass spectrometry method for the accurate quantification of peptides and proteins [1]. SRM has advantages over antibody- or aptamer-based assays that rely upon the recognition of large epitopes because it can distinguish variants and isoforms of proteins that cannot be recognized by antibodies or aptamers. In addition, many proteins can be multiplexed into a single SRM assay with most peptides detected at attomole levels of quantification and in most cases with <20% coefficient of variation [2, 3].
High-quality SRM data requires a highly reproducible sample preparation strategy and the development of a carefully designed and optimized SRM assay. Attempts to improve SRM measurement precision have largely focused on variability of instrumental stability and SRM assay performance [3–5]. However, more recently it has been widely recognized that the length and complexity of sample preparation are important limits to throughput and reproducibility of this technique. This is especially true when hundreds or even thousands of samples have to be processed rapidly and accurately across multiple plates over a period of months such as in large-scale longitudinal studies. Many steps in the SRM workflow can be a source of variation. Often little attention is paid to the variability determined by the sample preparation workflow although these parameters are of utmost importance to determine an experimental design with sufficient statistical power to distinguish disease–specific protein concentrations [6].
Handling samples with robotic technology can substantially reduce variability that is introduced in the different steps of sample preparation [7, 8]. Current platforms can perform automated sample dilution, denaturation, reduction, alkylation, trypsin digestion, and semi-automated solid-phase extraction of samples for proteomic analyses. In the context of a study exploring the relationship between complement factor H (CFH) protein and its variants in human plasma and the risk of macular degeneration, we developed an automated robotic protocol aimed at minimizing sample handling variability in a workflow for SRM. In this paper, we present the robotic sample handling protocol implemented on the Biomek® NXp station (Beckman Coulter) and provide data on performance in terms of reliability and repeatability.
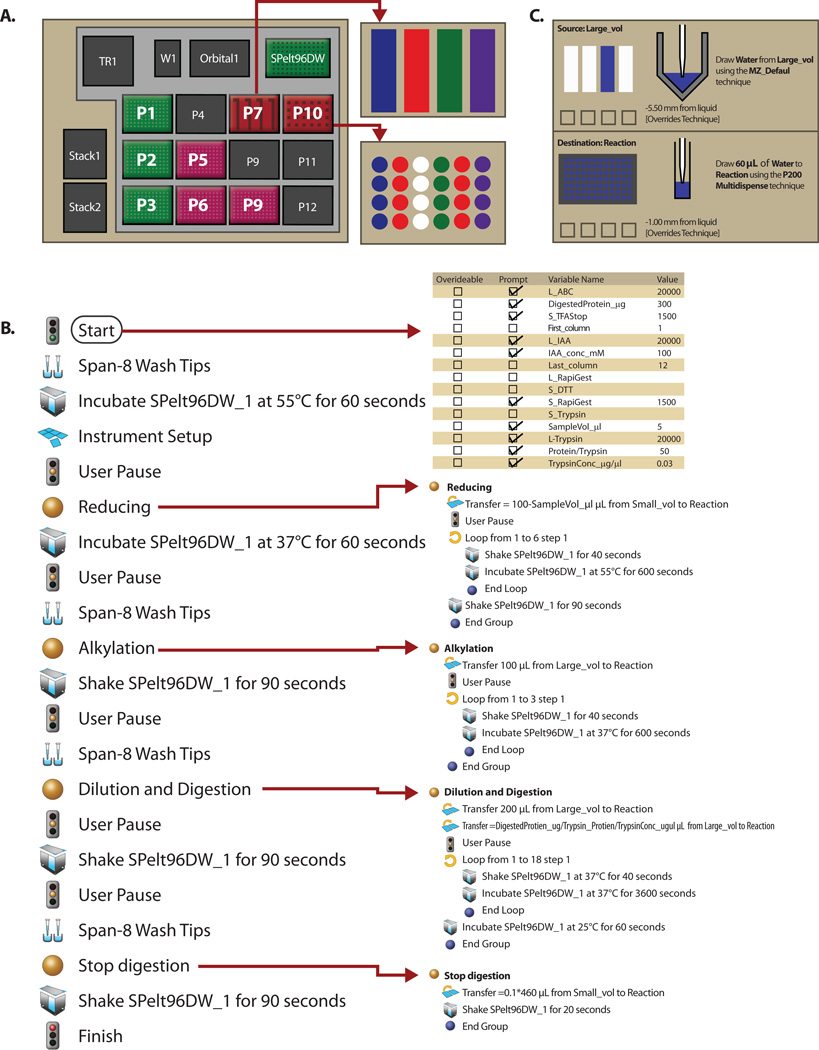
Fig. 1 illustrates the details of robotic sample digestion workflow. In the layout of the Biomek® NXp station deck is shown in Fig. 1A. 250 µl tips were placed at stations P1, P2 and P3; P50 µl tips were placed at P5, P6 and P9. Reagents were stored in reservoirs located in P7 and P10. A 96-well polypropylene deep reaction plate was placed at Spelt96DW for sample reaction. Each reaction plate consisted of 8 replicates of the Quality Control (QC) plasma and 88 plasma samples. The QC plasma was the matrix-matched pooled plasma from 200 real study samples [9] which was used for monitoring the entire workflow variability and plate-to-plate quality of assay results. Acceptance of data depended on the QC samples being successfully quantified within predefined limits. Using Biomek software, adjustments for parameters, such as incubation time, temperature, vortexing and spinning, were scheduled using the flexible definition of specific-prescriptive software packages. At the start-up point of the programming procedure, input was required for several check variables that were involved in tip techniques and calculation of reagent volumes transferred from the reagent reservoir to the reaction plate. In addition, specialized steps were also scheduled by different software functions, e.g. integrated pump purging air from the lines, alerts to desired temperatures, and placing/removing plate cover sheet prior to the next step. The workflow of automated sample digestion is shown in Fig. 1B. Briefly, plasma sample were thawed directly on the day of analysis and were centrifuged at 14,000 × g for 15 min at 4°C. Cleared fractions were manually transferred with a loading tip into a fresh 1.5 ml polypropylene tube, discarding insoluble aggregates and the upper layer of floating lipids. This procedure was sufficient to eliminate the confounding influence of lipids in downstream protein separation procedures [10]. After delipidation, 5 µl of delipidated plasma was manually added into the reaction plate at station Spelt96DW using reverse pipetting technique to improve accuracy in the absolute quantification of plasma data [11], and then 95 µl of 0.1% (w/v) RapiGest (Waters Corp., Milford, MA) containing 100 mM Tris-HCl, pH=8.0, and 100 mM dithiothreitol (Sigma-Aldrich, Oakville, ON) were added and incubated at 55°C for 1 h for denaturation and reduction. The reduced samples were then alkylated for 30 min at room temperature in dark with 100 mM iodoacetamide (Sigma-Aldrich) to a final concentration of 50 mM. After alkylation, 60 µl of 50 mM ammonium bicarbonate was added to the sample to achieve a 460 μl of digestion volume and, subsequently, trypsin/LysC mix (Promega, Madison, WI) was added at an enzyme-to-substrate ratio of 1:50. Digestion was carried out for 18 h at 37 °C, and terminated with 10% trifluoroacetic acid (Fisher Scientific, Hampton, NH), to a final concentration of 1%. All procedures were programmed and automatically performed unless otherwise mentioned. To achieve the best accuracy and precision, all the reagents were aspirated 5.5 mm from below the liquid surface of the reagent reservoir and dispensed 1.0 mm from below the liquid surface of the reaction well using override-tip technique (Fig. 1C). Acidified tryptic digests were cleaned up with 96-well SPE plate (Phenomenex, Torrance, CA) according to manufacturer’s instruction. A 96-well plate vacuum manifold (Waters) was used for all desalting procedures to provide uniform peptide wash, retention and elution. Loading acidified sample onto prepared SPE plate was a manual process (repeating 4 times). The elution reagents were evaporated to dryness and the residues were manually reconstituted with 100 µl of 0.1% formic acid containing a concentration-balanced mixture of synthesized heavy isotope-labeled peptides (SISs) as an internal standard. HPLC and mass spectrometry condition were shown in Supporting Information.
Figure 1. Workflow of automated sample preparation with Biomek® NXp Laboratory Automation Workstation.
A successful SRM-based analysis depends on the accurate execution of a number of diverse technical steps in the process. To assess the contribution of the automated sample preparation to overall variability generated by a typical SRM workflow, we chose to break the SRM-based protocol pipeline into two critical technical components that are commonly believed to contribute to variability in the assay: technical component I (sample dilution, denaturation and reduction, alkylation, trypsin digestion and solid-phase extraction) and technical component II (LC system, spiking amount of SISs, column carryover, autosampler stability, interference and binary solvents). Sources of technical variation in a typical SRM workflow are illustrated in Supporting Fig. S1. The independent evaluation of these variations has major implications for the experimental design of a SRM study because these variations could reduce statistical power [6].
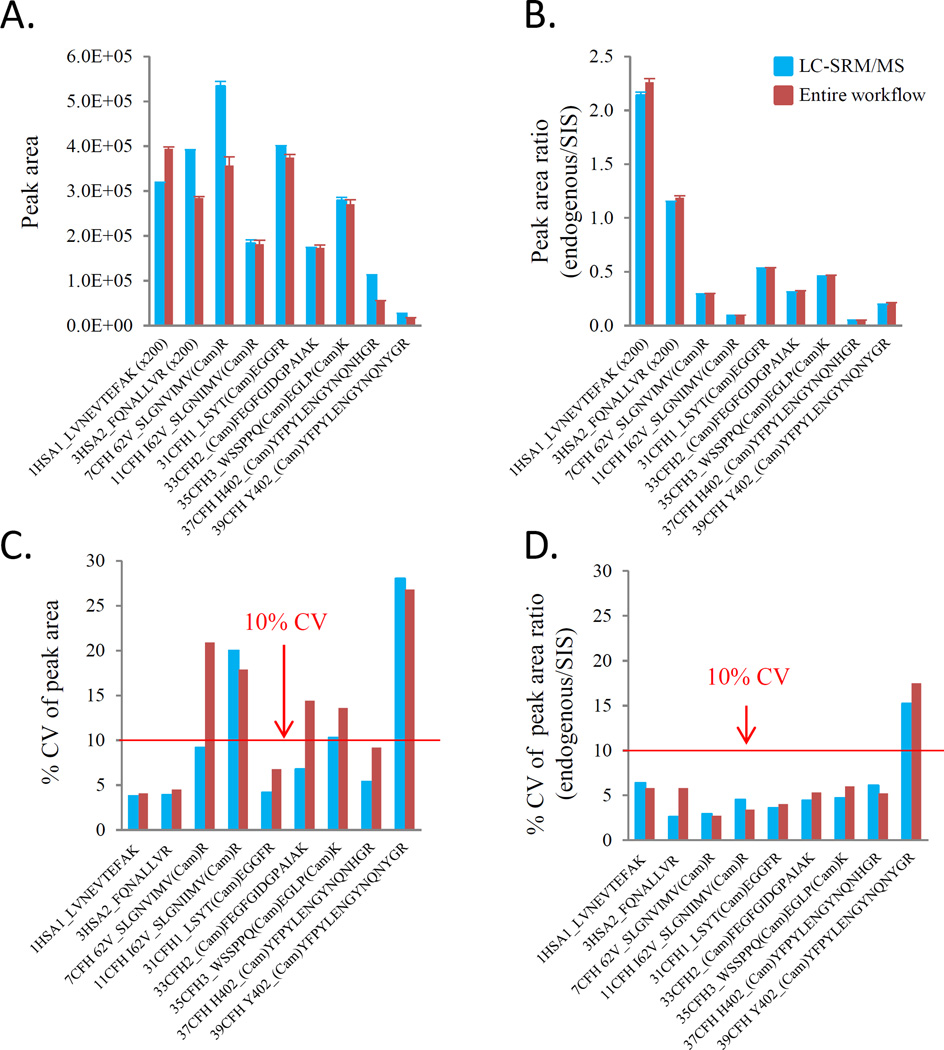
Fig. 2 shows signal abundance of corresponding peptides and difference in absolute signals between two technical components (Fig. 2A). Measurement of the absolute peak areas in 15 individual SRM assay analysis resulted in >10% CVs for 5 out of 9 peptides, and CVs >20% for 3 out of 9 peptides (Fig. 2C). As expected, when the natural peptide peak areas were normalized against SIS peptide peak areas for comparison, the signal differences between two technical components were effectively reduced (Fig. 2A vs. Fig.2B) and analytical precisions were dramatically improved (Fig. 2C vs. Fig. 2D). This finding suggests that reproducibility improvement could be obtained by incorporating an internal SIS strategy. An optimal concentration of SIS to add to digested plasma can reduce the SRM analytical variation by maximizing the linear range of the SRM assay and generating high-quality signal [4]. The spiking of the heavy standards is expected to remove most of the variability induced by the mass spectrometric measurements from run to run. Our optimal concentration of SIS spiked to tryptic digests has shown that analytical variations were decreased with increased SIS spiking concentration (Supporting Information Fig. S2A). For instance, when SIS concentration was increased from 20 to100 fmol/µl, CVs, as percent of the standard deviation to the mean, were reduced by 3.1–10.7% (Supporting Information Fig. S2B). All peptides, except for human serum albumin (HSA), were able to match the peak areas from the natural peptides by giving a peak area ratio below 1.0 (Fig. 2B). This suggests that 100 fmol/µl as SIS spiking concentration to add to digests was sufficient to permit reproducible SRM measurement. Note that we did not make an additional increase in the spiking amount of HSA standard peptides, still maintaining at 20 fmol/µl, because HSA was used here just as the control peptides for monitoring digestion processing and column carryover, not for quantitation purpose. Comparison between two technical component variations revealed a median CV of 5.3% for overall variation and 4.5% for technical component II variation that excluded variation due to sample preparation, indicating that in the current study the majority of variations in the SRM-MS assay was from the SRM assay rather than the automated sample processing. Further analysis indicated that the variation derived from the automated sample preparation contributed only 15.1% of the overall variation, whereas a substantial part of overall variation (84.9%) comes from the SRM assay variability.
Figure 2. Sources of variation in SRM-based quantitation analysis.
Freshly thawed aliquots of pooled QC samples were digested with Biomek NXP workstation (n=15). After desalting, a mixture of concentration balanced SIS peptides was added. For overall variation (technical component I), LC-SRM/MS analysis was performed for individual digests in triplicate injections to evaluate intra-day (plate-specific) overall variation. For the variation associated with LC-SRM/MS replicates (technical component II), 15 individual digests were pooled and then LC-SRM/MS analysis was performed in 20 consecutive injections with a blank between injections. The study design evaluated each peptide with three different transitions. A. absolute signal response (peak area); B. relative signal response (endogenous/SIS ratio); C. %CV of absolute response; D. %CV of relative response (endogenous/SIS ratio). Variation associated with the automated sample preparation was defined as [(1 – component II variation/ component I variation)*100].
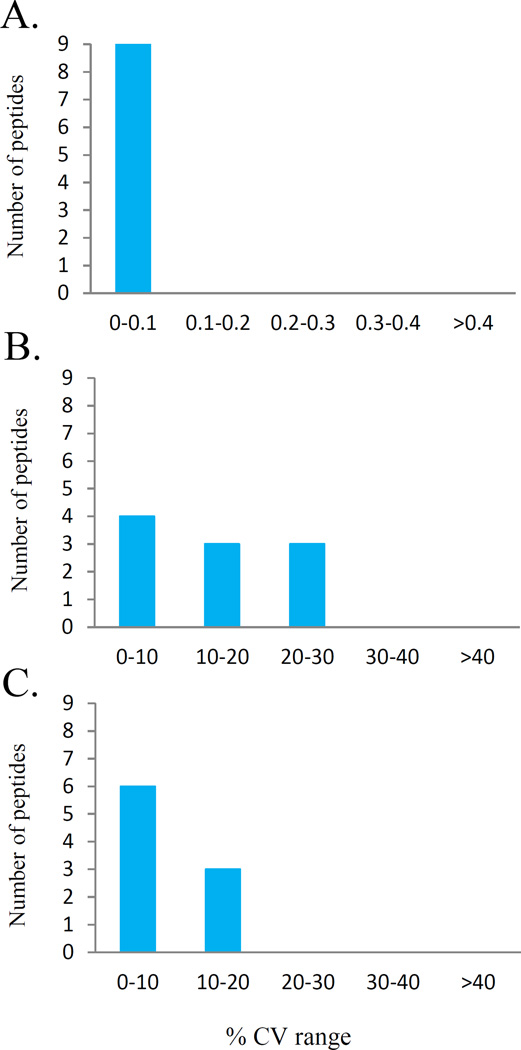
The analytical variability was further tested by measuring the variation observed when a QC sample was prepared independently across 4 different plates (7–8 QC digests per plate), thus determining the inter-day (between-run, plate-to-plate) variability. Fig. 3 demonstrates that inter-day CVs of retention time (RT) ranged from 0 to 0.032%, with a median CV of 0.03% for all 9 peptides. This suggests that retention time within 3 months was very accurate across all SRM runs (Fig. 3A). The inter-day CVs of the absolute response (peak area) is shown in Fig. 3B. The relative response (peak area/SIS ratio) is shown in Fig. 3C, in which CVs ranged from 4.8 to 17.6%, with a median CV of 7.2% for all 9 peptides. Result suggests that all peptides have acceptable levels of inter-day precision (CV<20%) after normalizing peak area against peak area of corresponding SIS.
Figure 3. Analytical inter-day reproducibility.
The CV frequencies of 9 peptides assays analyzed independently across 4 different reaction plates (7–8 individual digests per plate) over a course of 3 months are shown with A. retention time; B. absolute signal (peak area); and C. relative response normalized against the concentration-balanced SIS mixture (endogenous/SIS ratio).
An absolute quantitative SRM assay requires a comparison with a reference, external concentration response curve. Three approaches have been reported to address calibration of peptide concentration in complex matrices [12]. In the approach we used, we had increased quantities of light-SIS peptide mixture with a certified purity > 95%, resulting in concentration ranges from 0.244 to 500 fmol/µl by two-fold dilution series which were added to the QC plasma digests prior to SPE. After SPE, the SIS peptide mixture was added to the digests and a blank digest (without light-SISs) at a final concentration of 100 fmol/µl for 7 SIS peptides. This calibration standard provided the ideal assay condition because the calibration samples and the study samples have similar overall composition. All the calibration graphs with line fitting correlation coefficient R are shown in Supporting Information Fig. S3. Ideally, the expected results is that the lowest concentration point yields the desired acceptable level of both precision (<20% CV) and accuracy (100±20%) [13]. We observed that the calibration standards had excellent linearity within the measured range from15.62 to 500 fmol/µl and R2 > 0.99 for all targeted transitions. The accuracy of calibration curves ranged from 93.7 to 118.4% (average of 100.9 with Std. Dev 5.9%) at the peptide level. The list of SRM transitions, peptides sequences and optimized parameters determined on 5500 Qtrap system in Supplementary Table S1. The concentrations of CFH peptides and its variant peptides in the pooled QC plasma are shown in Supporting Information Fig. S4. In contrast to the results from manually prepared QC digests (n=16), automated sample preparation exhibited smaller intra-assay variation in CFH protein (the average of 3 CFH peptides), e.g. 1.34 µM with 2.3% CV in plate 1 vs. 1.51µM with 4.2% CV (S4B, right) and CFH variant (the average of 4 CFH variants), e.g. 0.91 µM with 4.7% CV in plate 1 vs. 0.85 µM with 6.9% CV (S4B, left).
In conclusion, this automation of sample preparation workflow is a major advance in absolute quantitative proteomics not only by increasing sample throughput, but also more importantly minimizing the variability introduced by person-by-person or lab-to-lab manual handling during the assay.
Supplementary Material
Acknowledgments
This research was supported by the Intramural Research Program of the NIH on Aging, and NIH grants RO1 EY024596, RO1 AG027012 and R56 AG052973, the joint King Khaled Eye Specialist Hospital and Wilmer Eye Institute Research Grant Program.
Footnotes
The authors declare no conflicts of interest.
References
- 1.Fu Q, Chen Z, Zhang S, Parker SJ, Fu Z, Tin A, Liu X, Van Eyk JE. Multiple and selective reaction monitoring using triple quadrupole mass spectrometer: preclinical large cohort analysis. Methods Mol. Biol. 2016;1410:249–264. doi: 10.1007/978-1-4939-3524-6_15. [DOI] [PubMed] [Google Scholar]
- 2.Kuzyk MA, Smith D, Yang J, Cross TJ, Jackson AM, Hardie DB, Anderson NL, Borchers CH. Multiple reaction monitoring-based, multiplexed, absolute quantitation of 45 proteins in human plasma. Mol. Cell. Proteomics. 2009;8:1860–1877. doi: 10.1074/mcp.M800540-MCP200. [DOI] [PMC free article] [PubMed] [Google Scholar]
- 3.Domanski D, Percy AJ, Yang J, Chambers AG, Hill JS, Freue GV, Borchers CH. MRM-based multiplexed quantitation of 67 putative cardiovascular disease biomarkers in human plasma. Proteomics. 2012;12:1222–1243. doi: 10.1002/pmic.201100568. [DOI] [PubMed] [Google Scholar]
- 4.Kuzyk MA, Parker CE, Domanski D, Borchers CH. Development of MRM-based assays for the absolute quantitation of plasma proteins. Methods Mol. Biol. 2013;1023:53–82. doi: 10.1007/978-1-4614-7209-4_4. [DOI] [PubMed] [Google Scholar]
- 5.Lange V, Picotti P, Domon B, Aebersold R. Selected reaction monitoring for quantitative proteomics: a tutorial. Mol. Systems Biol. 2008;4:1–14. doi: 10.1038/msb.2008.61. [DOI] [PMC free article] [PubMed] [Google Scholar]
- 6.Levin Y. The role of statistical power analysis in quantitative proteomics. Proteomics. 2011;11:2565–2567. doi: 10.1002/pmic.201100033. [DOI] [PubMed] [Google Scholar]
- 7.Palandra J, Weller D, Hudson G, Li J, Osgood S, Hudson E, Zhong M, Buchholz L, Cohen LH. Flexible automated approach for quantitative liquid handling of complex biological samples. Anal. Chem. 2007;79:8010–8015. doi: 10.1021/ac070618s. [DOI] [PubMed] [Google Scholar]
- 8.Guryca V, Roeder D, Piraino P, Lamerz J, Ducret A, Langen H, Cutler P. Automated sample preparation platform for mass spectrometry-based plasma proteomics and biomarker discovery. Biology. 2014;3:205–219. doi: 10.3390/biology3010205. [DOI] [PMC free article] [PubMed] [Google Scholar]
- 9.Harris TB, Launer LJ, Eiriksdottir G, Kjartansson O, Jonsson PV, Sigurdsson G, Thorgeirsson G, Aspelund T, Garcia ME, Cotch MF, Hoffman HJ, Gudnason V. Age, Gene/Environment Susceptibility-Reykjavik Study: multidisciplinary applied phenomics. Am. J. Epidemiol. 2007;165:1076–1087. doi: 10.1093/aje/kwk115. [DOI] [PMC free article] [PubMed] [Google Scholar]
- 10.Fu Q, Garnham CP, Elliott ST, Bovenkamp DE, Van Eyk JE. A robust, streamlined, and reproducible method for proteomic analysis of serum by delipidation, albumin and IgG depletion, and two-dimensional gel electrophoresis. Proteomics. 2005;5:2656–2664. doi: 10.1002/pmic.200402048. [DOI] [PubMed] [Google Scholar]
- 11.Medina FCV, Peck C, Bensinger TA. Improved method for using Eppendorf pipettes for accurate delivery of blood. Clin. Chem. 1977;23:1188–1189. [PubMed] [Google Scholar]
- 12.Campbell J, Rezai T, Prakash A, Krastins B, Dayon L, Ward M, Robinson S, Lopez M. Evaluation of absolute peptide quantitation strategies using selected reaction monitoring. Proteomics. 2011;11:1148–1152. doi: 10.1002/pmic.201000511. [DOI] [PubMed] [Google Scholar]
- 13.Neagu M, Constantin C, Tanase C, Boda D. Patented biomarker panels in early detection of cancer. Recent Patents Biomarkers. 2011;1:10–24. [Google Scholar]
Associated Data
This section collects any data citations, data availability statements, or supplementary materials included in this article.


