

Abstract
Medullary thyroid cancer (MTC) is a tumor highly resistant to chemo‐ and radiotherapy. Drug resistance can be induced by epigenetic changes such as aberrant DNA methylation. To overcome drug resistance, we explored a promising approach based on the use of 5‐aza‐2′‐deoxycytidine (AZA), a demethylating agent, in combination with the mTOR inhibitor everolimus in MTC cells (MZ‐CRC‐1 and TT). This combined treatment showed a strong synergistic antiproliferative activity through the induction of apoptosis. The effect of everolimus and/or AZA on genome‐wide expression profiling was evaluated by Illumina BeadChip in MZ‐CRC‐1 cells. An innovative bioinformatic pipeline identified four potential molecular pathways implicated in the synergy between AZA and everolimus: PI3K‐Akt signaling, the neurotrophin pathway, ECM/receptor interaction, and focal adhesion. Among these, the neurotrophin signaling pathway was most directly involved in apoptosis, through the overexpression of NGFR and Bax genes. The increased expression of genes involved in the NGFR‐MAPK10‐TP53‐Bax/Bcl2 pathway during incubation with AZA plus everolimus was validated by western blotting in MZ‐CRC‐1 cells. Interestingly, addition of a neutralizing anti‐NGFR antibody inhibited the synergistic cytotoxic activity between AZA and everolimus. These results open a new therapeutic scenario for MTC and potentially other neuroendocrine tumors, where therapy with mTOR inhibitors is currently approved.
Keywords: 5‐aza‐2′‐deoxycytidine, everolimus, medullary thyroid cancer, mTOR, neurotrophin pathway, NGFR
Abbreviations
- AZA
5‐Aza‐2′‐deoxycytidine
- BDNF
brain‐derived neurotrophic factor
- CI
combination index
- DEGs
differentially expressed genes
- DRI
dose reduction index
- FDR
false discovery rate
- MTC
medullary thyroid cancer
- NGF
nerve growth factor
- NT‐3
neurotrophins‐3
- NT‐4/5
neurotrophins‐4/5
- NT‐6
neurotrophins‐6
- PARP
poly(ADP‐ribose) polymerase
- PF
potentiation factor
- PI
propidium iodide
- SAM
significance analysis of microarray
- SEM
structural equation modeling
- SPIA
signaling pathway impact analysis
1. Introduction
Medullary thyroid cancer (MTC) is a neuroendocrine tumor originating from parafollicular C cells, and it is highly resistant to chemo‐ and radiotherapy (Vitale et al., 2001). The hyperactivation of the PI3K/Akt/mTOR cascade has a relevant role in the pathogenesis and progression of MTC. In fact, most of the pro‐oncogenic effects of RET and RAS mutations are modulated by the activation of PI3K/Akt/mTOR pathway (Lyra et al., 2014; Manfredi et al., 2015). Few preliminary studies showed promising antitumor effects of mTOR inhibitors, such as everolimus, in MTC (Druce et al., 2012; Faggiano et al., 2012; Heilmann et al., 2016; Lim et al., 2013). A recent phase II study, assessing efficacy and tolerability of everolimus on tumor progression in patients with advanced thyroid cancer, showed stable disease in five (71%) of seven patients with MTC and a low toxicity profile for everolimus (Schneider et al., 2015).
Although everolimus has been reported to inhibit cell proliferation and angiogenesis in several human tumors, long‐term treatment with mTOR inhibitors can be frustrated by the induction of resistance. Moreover, the anticancer effect of everolimus may be limited because of the intrinsic lack of inhibition on mTORC2 and the activation of survival pathways in cancer cells (Chan and Kulke, 2014). On this basis, anticancer treatment with everolimus as monotherapy may not be optimal, supporting the rationale for a combined treatment approach with other targeted agents.
Epigenetic alterations, including dysregulated protein acetylation and DNA methylation, affect gene expression and contribute to tumorigenesis in several tumors (Hervouet et al., 2013; Walenkamp et al., 2014), including MTC (Vitale et al., 2016). PI3K/Akt/mTOR pathway is frequently deregulated in several malignancies through epigenetic alterations (Goel et al., 2004). Epigenetic alterations appear to be also implicated in the development of resistance to mTOR inhibitors (Bihani et al., 2015; Juengel et al., 2012). In fact, histone deacetylase inhibitors are able to resensitize renal carcinoma cells to mTOR inhibitors (Bihani et al., 2015; Juengel et al., 2012, 2014). However, most of the epigenetic mechanisms of resistance to mTOR inhibitors, particularly those concerning aberrant DNA methylation, remain poorly defined.
In this article, we have explored a novel approach to potentiate the antitumor activity of everolimus, based on the use of 5‐aza‐2′‐deoxycytidine (AZA), a well‐established demethylating agent, in MTC.
2. Materials and methods
2.1. Cell lines and reagents
Everolimus and AZA were kindly supplied by Novartis Pharma (Basel, Switzerland) and Sigma‐Aldrich (St. Louis, MO, USA), respectively. Both drugs were dissolved in DMSO and stored at −20 °C. Human MTC cell lines (MZ‐CRC‐1 and TT) were provided from Prof. Lips (Utrecht, the Netherlands). Both cell lines were cultured at 37 °C and 5% CO2 in F‐12 with Kaighn's modification medium supplemented with 10% fetal bovine serum, 2 nm glutamine, and 105 U·L−1 penicillin/streptomycin. HEK‐293 (ATCC) human embryonic kidney cell line was cultured at 37 °C and 5% CO2 in DMEM high glucose medium, without sodium pyruvate, supplemented with 10% fetal bovine serum, 2 nm glutamine, and 105 U·L−1 penicillin/streptomycin.
2.2. Cell viability assessment
MTC cells were plated in 96‐well plates (3 × 10⁴ cells per well) and treated with various concentrations of compounds (range 10−1–102 nm for everolimus, 10−3–105 nm for AZA). Cells growing in drug‐free medium and vehicle‐treated were used as control. After 3 days, medium and drugs were replaced. After 6 days, viability of cells was measured by the MTT assay (3‐(4,5‐dimethylthiazol‐2‐yl)‐2.5‐diphenyltetrazolium), as previously described (Vitale et al., 2012). Under the same conditions, the in vitro toxicity of everolimus and AZA at synergistic concentrations was examined through MTT assay in HEK‐293 cells.
2.3. Drug combination studies
MTC cells were seeded in 96‐well plates with medium without and with everolimus and/or AZA at different concentrations. After 3 days, medium and compounds were refreshed. Cell viability was evaluated after 6 days of treatment using MTT assay. Three combinations were tested for each schedule: equiactive doses of the two agents (IC50), higher relative doses of everolimus (IC75 of everolimus/IC25 of AZA), and higher relative doses of AZA (IC25 of everolimus/IC75 of AZA). Assessment of synergistic interaction between drugs was made with calcusyn software (Biosoft, Ferguson, MO, USA). Combination index (CI) values of < 1, 1, and > 1 are suggestive of synergy, additivity, and antagonism, respectively (Chou and Talalay, 1984; Chou et al., 1994). We also evaluated the dose reduction index (DRI), providing the magnitude of how much the dose of each drug in a synergistic combination may be reduced at a given effect level compared with the doses of each drug alone; the potentiation factor, defined as the ratio of the IC50 of either everolimus or AZA alone to the IC50 of everolimus and AZA in combination.
2.4. Cell cycle analysis
Cells were plated in six‐well plates (3 × 10⁵ cells/well) in duplicate with medium without (control group) and with everolimus and/or AZA. After 3 days, medium and drugs were refreshed. After 6 days, cells were collected, stained with propidium iodide (PI) (Sigma‐Aldrich), and analyzed using a FACScalibur flow cytometer (Becton Dickinson, Erembodegem, Belgium) and cellquest pro Software, as previously described (Vitale et al., 2007).
2.5. Flow cytometric analysis of apoptosis
Cells were plated in six‐well plates and incubated with everolimus and/or AZA, as reported in the section of cell cycle analysis. After 6 days of treatment, cells were collected and stained with Annexin V‐FITC (BD Pharmingen, San Diego, CA, USA) and PI, and all samples were analyzed with FACScalibur, as previously reported (Vitale et al., 2006).
2.6. Western blot
MZ‐CRC‐1 cells were plated in six‐well plates and incubated with everolimus and/or AZA, as previously reported. After 6 days of treatment, cells were scraped, washed in PBS, and resuspended in RIPA lysis buffer. Lysates were centrifuged, and protein analysis was conducted on supernatant. Cell extracts (50 μg per lane) were separated on NuPage 4–12% Bis/Tris Gels and transferred with iBlot System (Life Technologies, Carlsbad, CA, USA). Membranes were blocked with 5% milk TBS‐T and incubated with specific antibodies overnight at 4 °C: anticaspase‐3 and poly(ADP‐ribose) polymerase (PARP), anticleaved caspase‐3 and PARP, anti‐Bcl2, anti‐Bax, anti‐mTOR, anti‐phospho‐mTOR (Ser2448), anti‐4E‐BP1, anti‐phospho‐4E‐BP1 (Ser 65), anti‐MAPK10, anti‐phospho‐MAPK8/9/10 (Thr183/Tyr185), anti‐phospho‐p53 (Ser15) (Cell Signaling Technology, Beverly, MA, USA), and anti‐NGFR (Sigma‐Aldrich). Blots were detected by the Luminata Forte ECL Kit (Millipore, Darmstadt, Germany) after incubation with HRP‐conjugated mouse and rabbit secondary antibodies (dilution 1 : 1000 for anti‐MAPK10, anti‐phospho‐MAPK8/9/10 and anti‐phospho‐p53; 1 : 5000 for anticaspase‐3; and 1 : 10 000 for other antibodies) and then exposed to X‐ray film. Bands of interest were quantified through imagej software version 1.47 (Wayne Rasband, NIH, Bethesda, MA, USA). Results were normalized against the level of actin expression in each sample, and the intensities of the bands were expressed as arbitrary units when compared to those of the untreated cells.
2.7. Gene expression profiling
MZ‐CRC‐1 cells were seeded in six‐well plates and treated with everolimus and/or AZA, as previously reported. After 6 days, total RNA was extracted using Trizol Reagent (Life Technologies) and purified by RNeasy Mini Kit (Qiagen, Hilden, Germany). Amplification‐grade DNase I (Life Technologies) was used to eliminate residual genomic DNA from RNA samples. Samples with an A260/A280 ratio falling in the range 1.8–2.1 were used for experiments.
The Illumina TotalPrep RNA Amplification Kit (Ambion, Foster City, USA) was employed using 200 ng of total RNA as starting material. Labeled cRNA (750 ng) was hybridized to human HT‐12 v3 BeadChip arrays (Illumina, San Diego, CA, USA) according to the manufacturer's recommendation. Fluorescent images were obtained with a BeadArray reader and processed with the beadscan software (Illumina, San Diego, CA, USA).
2.8. Microarray gene expression analysis
Significance analysis of microarray was employed to identify differentially expressed genes (DEGs) by comparing the expression value of each gene between every group of treatment vs the untreated control, as previously described (Tusher et al., 2001). All the delta values were selected in order to provide a false discovery rate < 0.05. Once determined the DEGs, the next step was to discover which biological pathways were associated with the list of DEGs through signaling pathway impact analysis (SPIA) (Tarca et al., 2009), an algorithm of third generation that takes in consideration not only the identity of the genes but also the topology of the pathway. These aspects were reported by the probability values: pPERT (reflecting the amount of perturbation measured in each pathway) and pNDE (probability of obtaining a number of DEGs on the given pathway at least as large as the observed one). These two types of evidence, pPERT and pNDE, were finally combined into one global probability value, pGFdr, which was used to rank the pathways and to test the research hypothesis that the pathway was significantly involved in the condition under the study. To refine the SPIA, a downstream analysis based on the structural equation modeling (SEM) was performed (Pepe and Do, 2015; Pepe and Grassi, 2014). The method consists in the understanding how the DEGs, source of perturbation, propagated the perturbation in the biological network composed by the significant pathways. The module was obtained by the detection and fusion in a unique model of all directed shortest paths that put in communication the DEGs present in the significant pathways. This allowed (a) to overcome the limits of the classical pathway analysis that considers the pathways as separate entities and (b) to detect the biological network where the drug modules are searched.
2.9. DNA preparation and infinium methylation 450K array
MZ‐CRC‐1 cells were plated in six‐well plates and treated with everolimus and/or AZA, as previously reported. After 6 days, total DNA was extracted using the DNeasy Blood & Tissue Kit (Qiagen). Quality control and quantification of DNA were performed before and after bisulfite conversion. DNA was quantified with NanoDrop (NanoDrop Products Thermo Scientific, Wilmington, DE, USA) and by fluorometric reading (Quant‐iT™ PicoGreen® dsDNA Assay Kit); quality was assessed by visualization of genomic DNA on 1% agarose gel electrophoresis. Only nonfragmented DNA samples with a concentration higher than 50 ng·μL−1 were subsequently processed. The genomic DNA was treated with sodium bisulfite using the EZ DNA Methylation Kit™ (Zymo Research, Irvine, CA, USA); the technique requires only 500 ng of input DNA. Four microliters of bisulfite‐converted DNA were used for hybridization on Infinium HumanMethylation 450K BeadChip, according to Illumina's standard protocol. Data were acquired through Illumina HiScan SQ scanner. Image intensities were extracted using genomestudio software v2010.3 (Illumina). The methylation score for each CpG site was represented as β‐values according to the fluorescent intensity ratio between methylated and unmethylated probes. β‐Values may range between 0 (completely unmethylated) and 1 (completely methylated). Illumina Methylation 450K raw data were analyzed using the rnbeads analysis software package (Assenov et al., 2014). Sites overlapping SNPs were firstly removed from the analysis as well as probes on sex chromosomes. Probes and samples of highest impurity were removed from the dataset using the Greedycut algorithm. We have considered every β‐value to be unreliable when its corresponding detection P‐value was not below the threshold (T = 0.05). The background was subtracted using the methylumi package (method ‘noob’). The signal intensity values were normalized using the SWAN normalization method, as implemented in the minfi package (Aryee et al., 2014). The ‘Shapiro.test’ function provided in the R package ‘stats’ was applied to test normality among variables. The ‘kruskal.test’ function provided in the R package ‘stats’ was used to test differences among treated and untreated groups for all nonparametric data. DunnTest provided in the R package ‘dunn.test’ has been applied as post hoc test.
2.10. Statistical analysis
All experiments were performed at least three times. Statistical differences among groups were first evaluated by the ANOVA test, followed by post hoc test (Newman–Keuls). A P value < 0.05 was considered significant. The values reported in the figures represent the mean ± standard error of the mean. For statistical analysis, graphpad prism 5.0 was used (GraphPad Software Inc., La Jolla, CA, USA).
3. Results
3.1. Pharmacological combination between everolimus and AZA on cell proliferation
In MZ‐CRC‐1 cells, the combination of everolimus and AZA was highly synergistic when either of the two drugs was used with lower concentrations of everolimus (IC25 everolimus:IC75 AZA) or with equitoxic concentrations (IC50 everolimus:IC50 AZA) (Table 1, Fig. 1). The DRI50 (DRI calculated for 50% cell survival) was 8.8 for everolimus and 101 for AZA (when drugs were used at IC25 everolimus:IC75 AZA) and 4.3 for everolimus and 590 for AZA (at equitoxic concentrations) (Table 1).
Table 1.
Combination index (CI), dose reduction index (DRI), and potentiation factor (PF), according to the different cytotoxic ratio of everolimus (EV) and 5‐aza‐2′‐deoxycytidine (AZA) combination in MZ‐CRC‐1 and TT cell lines after 6 days of treatment
| Cell line | Cytotoxic ratio | ED50 (nm) | CI50 a | DRI50 b | PFc | Interpretation | |||
|---|---|---|---|---|---|---|---|---|---|
| EV | AZA | EV | AZA | EV | AZA | ||||
| MZ‐CRC‐1 | EV‐AZA (50 : 50) | 12.4 | 35.6 | 0.2 | 4.3 | 5.9 × 10² | 1.8 | 1.1 × 10³ | Strong synergism |
| EV‐AZA (25–75) | 2.1 | 1.4 × 10² | 0.1 | 8.8 | 1.0 × 10² | 10.4 | 2.8 × 10² | Strong synergism | |
| EV‐AZA (75–25) | 1.3 × 10² | 3.2 × 10⁻¹ | 2.3 | − | − | − | − | Antagonism | |
| TT | EV‐AZA (50 : 50) | 9.2 | 3.4 × 10⁻¹ | 1.3 | − | − | − | − | Antagonism |
| EV‐AZA (25–75) | 1.2 | 8.0 | 0.7 | 1.5 | 6.4 × 10² | 6.1 | 11 | Synergism | |
| EV‐AZA (75–25) | 91.1 | 1.2 × 10⁻³ | 17 | − | − | − | − | Antagonism | |
CI50 was calculated for 50% cell survival (ED50) by isobologram analyses performed with calcusyn software.
DRI was calculated in case of synergism. It represents the order of magnitude (fold) of dose reduction obtained for ED50 effect in combination setting as compared to each drug alone.
PF was calculated in case of synergism as the ratio between the IC50 of either everolimus or AZA alone and the IC50 of everolimus or AZA in combination setting.
Figure 1.
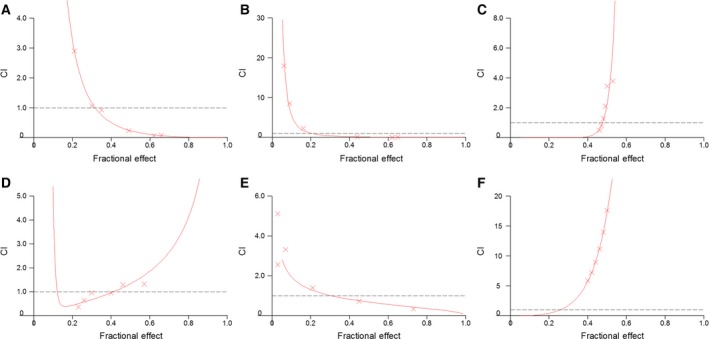
Evaluation of synergism between everolimus (EV) and 5‐aza‐2′‐deoxycytidine (AZA) in medullary thyroid cancer cells by isobologram analysis. These experiments were performed with MTT assay. Combination index (CI)/fractional effect curves were elaborated with the dedicated software calcusyn (developed by Chou and Talalay) as described in Materials and methods. Curves show the CI vs the fraction of medullary thyroid carcinoma cells MZ‐CRC‐1 (A–C) and TT (D–F) affected by the EV/AZA combinations at 50 : 50 (A/D), 25 : 75 (B/E), 75 : 25 (C/F) cytotoxic ratios. CI represents the assessment of synergy induced by drug interaction. In detail, CI values of < 1, 1, and > 1 indicate synergy, additivity, and antagonism, respectively. Each point (represented in graph by x‐mark) is the mean of at least four different replicates. The statistical significance of each point was evaluated with ANOVA, and the derived P values were always less than 0.01.
In TT cells, a synergistic activity was similarly detected when lower concentrations of everolimus were adopted (IC25 everolimus:IC75 AZA), while antagonistic effects were observed with relatively higher concentrations of everolimus (IC75 everolimus:IC25 AZA) (Table 1, Fig. 1).
The optimal results (lowest CI values) were obtained when the two drugs were used at lower doses of everolimus in MZ‐CRC‐1 cells. Therefore, we have performed subsequent experiments using 2.1 nm (IC25) of everolimus and/or 1.4 × 10² nm (IC75) of AZA in MZ‐CRC‐1 cells.
3.2. In vitro toxicity assessment
The effect of drug combination on the cell viability of HEK‐293 cell line, derived from human embryonic kidney cells, was evaluated through MTT assay to roughly predict the toxicity profile of both everolimus and AZA in a noncancer cell model. Combined treatment with everolimus and AZA, at concentrations showing synergistic antiproliferative activity in MZ‐CRC‐1 cells, inhibited viability of HEK‐293 cells (−25%) to a lesser extent than that detected in MTC cells (−54%) (Fig. 2A). Moreover, we did not observe any change in morphology of HEK‐293 cells after treatment with everolimus and AZA compared to untreated control (Fig. 2B).
Figure 2.
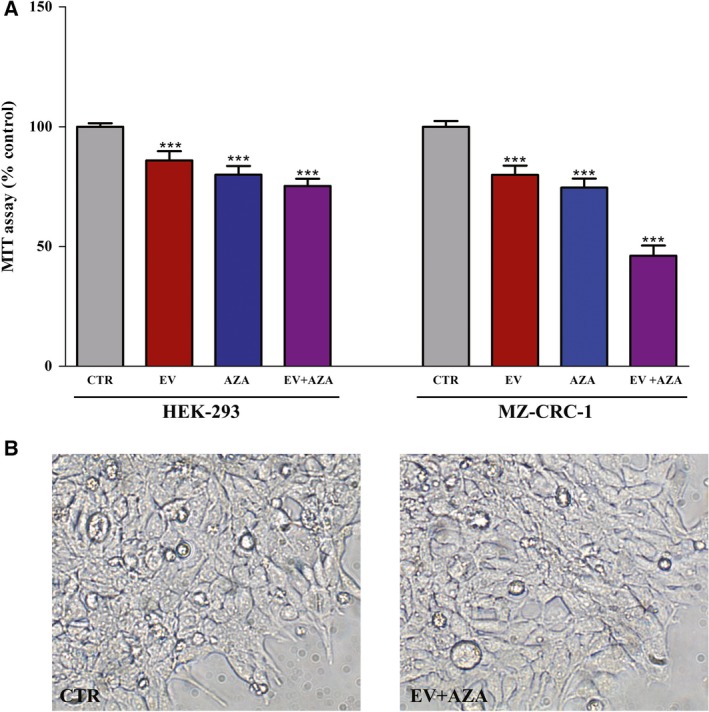
In vitro toxicity profile of everolimus (EV) and 5‐aza‐2′‐deoxycytidine (AZA). Cells were treated for 6 days with EV (2.1 nm) and/or AZA (1.4 × 10² nm). (A) The cytotoxicity was measured by MTT cell viability assay in HEK‐293 and MZ‐CRC‐1 cell lines. (B) The morphology of HEK‐293 cells was determined after 6 days of exposure to drug‐free medium (CTR) and EV plus AZA. Images were captured using a phase‐contrast microscopy at × 20 magnification. ***P < 0.001.
3.3. Effects of everolimus and AZA on cell cycle
AZA alone slightly, but significantly decreased cell population in G0/G1 phase (−6% vs untreated control, P < 0.05) and increased cell number in G2/M phase (+23% vs untreated control, P < 0.01), suggesting a cell cycle arrest in G2/M phase (Fig. 3). Everolimus alone significantly decreased cells percentage in both S (−24% vs untreated control, P < 0.05) and G2/M phase (−15% vs untreated control, P < 0.05). This effect was comparable to that observed during the synergistic combination of everolimus plus AZA (S phase: −27% vs untreated control, G2/M phase: −14% vs untreated control, both P < 0.05, Fig. 3).
Figure 3.
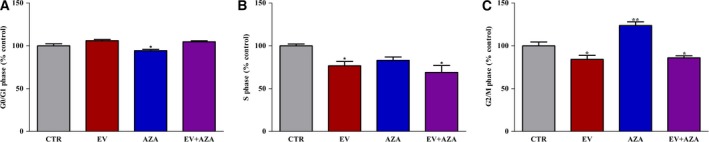
Cell cycle distribution, detected by FACS analysis, in propidium iodide‐stained MZ‐CRC‐1 cells after 6 days of treatment with 2.1 nm everolimus (EV) and/or 1.4 × 10² nm 5‐aza‐2′‐deoxycytidine (AZA). Control values have been set to 100%. *P < 0.05 **P < 0.01.
3.4. Effects of everolimus and AZA on apoptosis
Everolimus did not change the percentages of early apoptotic and late apoptotic/necrotic cells compared with the untreated control. AZA induced a statistically nonsignificant increase in the population of late apoptotic/necrotic cells. Interestingly, the AZA/everolimus combination significantly increased the percentage of early apoptotic (+35% vs control, P < 0.05) and late apoptotic/necrotic (+90% vs control, P < 0.001) cells (Fig. 4A).
Figure 4.
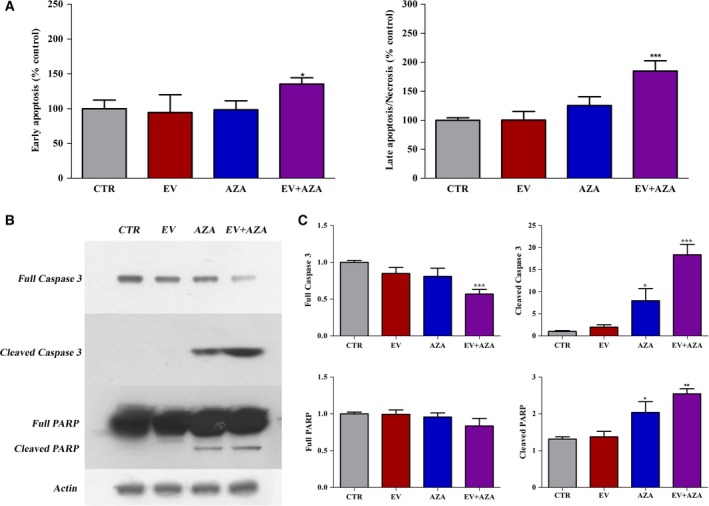
Effects of 2.1 nm everolimus (EV) and/or 1.4 × 10² nm 5‐aza‐2′‐deoxycytidine (AZA) on apoptosis in MZ‐CRC‐1 cells after 6 days of incubation. (A) Flow cytometry with Annexin V and propidium iodide. Values of early apoptotic cells and late apoptotic/necrotic cells were expressed as percentage compared with the untreated control. (B) Representative western blot analysis of apoptotic markers (full and cleaved forms of caspase 3 and PARP). Actin was used as a loading control. (C) Quantification of western blot analysis from at least three independent experiments. *P < 0.05; **P < 0.01; ***P < 0.001.
Western blot analysis of key executioners of apoptosis, such as caspase‐3 and PARP, further confirmed these data (Fig. 4B,C). After 6 days of treatment, the AZA/everolimus combination significantly increased caspase‐3 degradation, resulting in increased expression of cleaved caspase‐3 and decreased expression of full caspase‐3. A moderate increase in cleaved caspase‐3 has been detected after AZA alone. Similarly, the activity of PARP was moderately stimulated after 6 days of treatment with AZA, and its combination with everolimus enhanced again this effect. No significant changes in caspase‐3 activity and PARP cleavage were detected after the incubation of MZ‐CRC‐1 cells with everolimus alone.
3.5. Effects of everolimus and AZA on mTOR activation
No detectable impact on total mTOR and 4E‐BP1 protein levels has been observed during incubation with everolimus and/or AZA in MZ‐CRC‐1 cells (Fig. 5). Everolimus alone significantly reduced both mTOR and 4E‐BP1 phosphorylation. A similar effect has been observed after everolimus in combination with AZA, while AZA alone did not significantly affect this process (Fig. 5).
Figure 5.
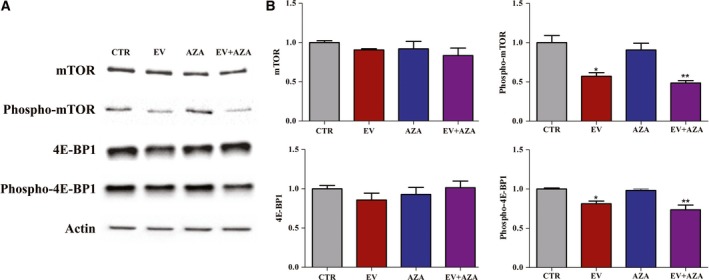
Effects of 2.1 nm everolimus (EV) and/or 1.4 × 10² nm 5‐aza‐2′‐deoxycytidine (AZA) on protein expression of total and phosphorylated mTOR and 4E‐BP1 in MZ‐CRC‐1 cells after 6 days of incubation. (A) Representative western blot analysis. Actin was used as a loading control. (B) Quantification of western blot analysis from at least three independent experiments. *P < 0.05; **P < 0.01.
3.6. Gene expression analysis
To clarify the molecular bases for synergy between these two compounds, gene expression profiles with or without everolimus and/or AZA treatment were evaluated in MZ‐CRC‐1 cells. Following treatment with everolimus or AZA alone, 72 DEGs (Table S1) and 16 DEGS (Table S2) were identified, respectively. On the other hand, 74 DEGs were identified following incubation with everolimus and AZA (Table S3).
On each list of DEGs, a pathway analysis was performed with SPIA, which calculated the statistical significance of pathways by considering their topology and the expression levels of their genes. Only for the comparisons between everolimus vs control and AZA/everolimus combination vs control, significant pathways were detected (Tables 2 and 3). The significant pathways modulated after everolimus treatment (Table 2) were PI3K‐Akt signaling pathway and complement and coagulation cascades. SPIA revealed four significant pathways in the group treated with the synergistic AZA/everolimus combination (Table 3): PI3K‐Akt signaling, neurotrophin signaling pathway, ECM/receptor interaction, and focal adhesion.
Table 2.
Significant pathways associated with treatment with everolimus by SPIA in MZ‐CRC‐1 cells
| Pathway name | pPERT | pNDE | pGFdr |
|---|---|---|---|
| PI3K‐Akt signaling pathway | 0.066 | 0.0013 | 0.036 |
| Complement and coagulation cascades | 0.493 | 0.0005 | 0.048 |
pPERT, probability of observing a total accumulated perturbation of the pathway more extreme than expected by chance; pNDE, probability of obtaining a number of DEGs in the given pathway at least as large as the observed one; pGFdr, false discovery rate for the global P‐value from the combination of pPERT and pNDE.
Table 3.
Significant pathways associated with treatment with everolimus plus AZA by SPIA in MZ‐CRC‐1 cells
| Pathway name | pPERT | pNDE | pGFdr |
|---|---|---|---|
| PI3K‐Akt signaling pathway | 0.102 | 0.0002 | 0.0178 |
| Neurotrophin signaling pathway | 0.689 | 0.0002 | 0.0308 |
| ECM/receptor interaction | 0.115 | 0.0013 | 0.0308 |
| Focal adhesion | 0.199 | 0.0018 | 0.0415 |
pPERT, probability of observing a total accumulated perturbation of the pathway more extreme than expected by chance; pNDE, probability of obtaining a number of DEGs in the given pathway at least as large as the observed one; pGFdr, false discovery rate for the global P‐value from the combination of pPERT and pNDE.
The module network obtained by the fusion of the four significant pathways in the group treated with the AZA/everolimus combination is described in Fig. 6. Edges represent interactions between two genes. The list of genes in the module is reported in Table S4. All the DEGs reported in Fig. 6 were overexpressed compared to the untreated control. The SEM multigroup analysis was performed comparing the covariance matrices implied by the model for the treatment data against the control data. The likelihood ratio test had a P‐value of 0.002, confirming that the module was differentially regulated between the groups. The perturbed connections identified in this module are reported in Table 4.
Figure 6.
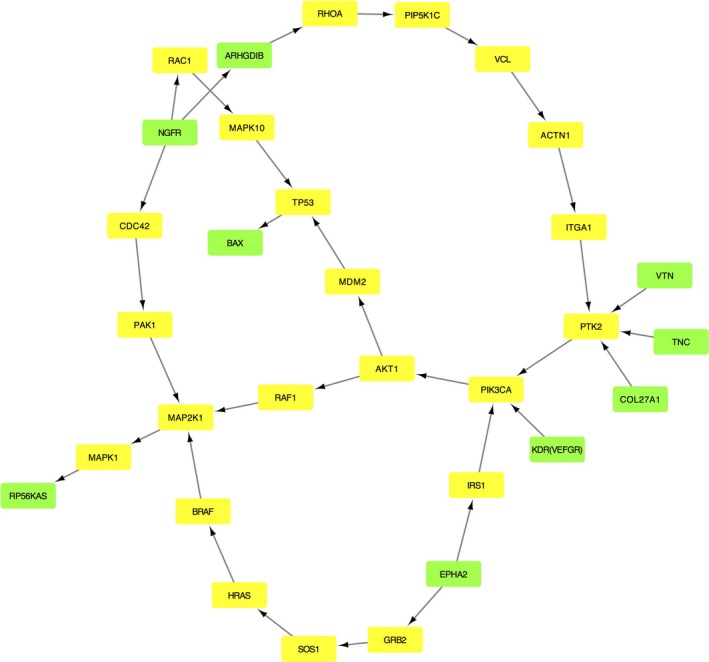
Perturbed pathway module in the group treated with everolimus and 5‐aza‐2′‐deoxycytidine. The green nodes are the DEGs, and the yellow nodes represent the non‐DEGs microarray genes that connect the DEGs. Edges represent interactions between two genes.
Table 4.
Perturbed connections in the everolimus plus AZA module compared to the untreated control. The estimation of the strength connection and P‐value for ‘control’, ‘everolimus plus AZA’, and the ‘difference between everolimus plus AZA vs control’ are reported. We have only included the connections where a statistically significant P value has been observed for the ‘difference between everolimus plus AZA vs control’
| Path | Type of process | Control | Everolimus + AZA | Difference | |||
|---|---|---|---|---|---|---|---|
| Estimate | P value | Estimate | P value | Estimate | P value | ||
| MDM2→TP53 | Inhibition | 0.8271 | 0.0001 | −0.9864 | 0.0022 | −1.8135 | 0.0000 |
| NGFR→ARHGDIB | Binding/association | 0.8935 | 0.0001 | 2.7208 | 0.0001 | 1.8273 | 0.0125 |
| EPHA2→IRS1 | Activation | −0.5077 | 0.0079 | 0.3521 | 0.2699 | 0.8598 | 0.0208 |
| PIP5K1C→VCL | Indirect | −0.6464 | 0.0237 | 0.3072 | 0.0001 | 0.9536 | 0.0013 |
| VCL→ACTN1 | Binding/association | −0.0985 | 0.8827 | 2.4853 | 0.0002 | 2.5839 | 0.0062 |
| ITGA1→PTK2 | Binding | −0.3282 | 0.0206 | 0.1908 | 0.2790 | 0.5190 | 0.0218 |
| NGFR→RAC1 | Activation | −0.9042 | 0.0180 | 0.5223 | 0.0155 | 1.4265 | 0.0012 |
| RAC1→MAPK10 | Indirect | 0.0499 | 0.6359 | 0.5799 | 0.0001 | 0.5300 | 0.0033 |
| NGFR→CDC42 | Activation | 0.2736 | 0.3068 | −1.0567 | 0.0001 | −1.3303 | 0.0004 |
| PAK1→MAP2K1 | Phosphorylation | 0.4008 | 0.0018 | −0.0669 | 0.0998 | −0.4678 | 0.0005 |
Considering the perturbed edges (Table 4), the links between the NGFR and BAX are found to be significant and intriguing because they are involved in the process of apoptosis (Fig. 6). NGFR was overexpressed during exposure to the AZA/everolimus combination compared to untreated control. In the same condition, the activation of RAC1 (mediated by NGFR) and the indirect interaction RAC1/MAPK10 were found to be stimulated (Table 4). It has been previously reported that the activation of MAPK10 (JNK3), mediated by NGFR/RAC1, can induce apoptosis through the increased expression of TP53 and BAX (Aloyz et al., 1998; Kenchappa et al., 2010). Although in our model the path TP53→BAX was not significantly perturbed during incubation with the AZA/everolimus combination, an increase in BAX expression was detected during synergistic treatment.
The same procedure was applied for the two pathways (Table 2) previously identified during everolimus treatment. The directed shortest paths between the DEGs in the significant KEGG pathways generated the module reported in Fig. S1. The list of genes in the module is described in Table S5. SEM was used to verify whether globally the strength of connections was statistically different between control and everolimus in the assessed modules, but significant differences were not detected (P‐value: 0.1144). Therefore, additional analyses were not performed.
An enrichment analysis based on Disease Ontology terms was performed on the genes selected in the module related to the treatment with ‘everolimus plus AZA’ (Fig. 7). Twenty‐four of 25 identified terms were tumors.
Figure 7.
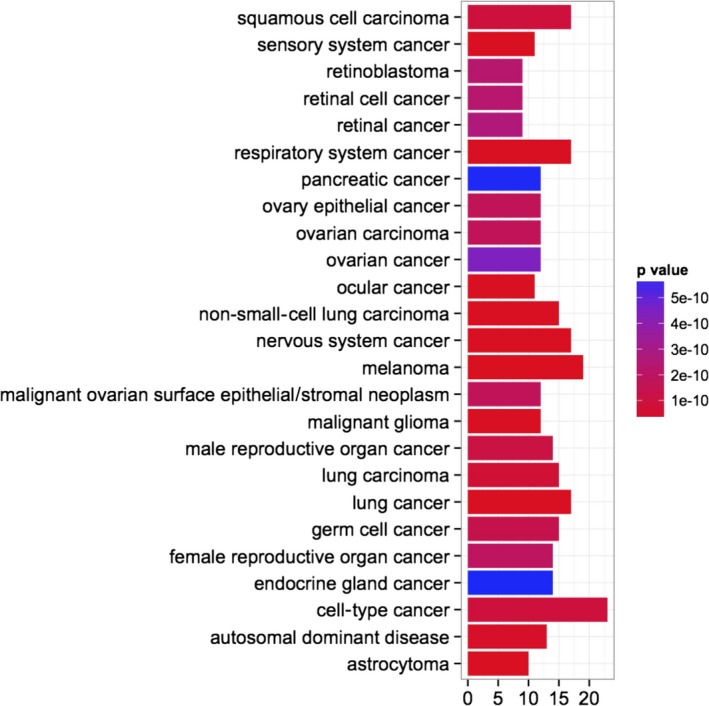
Disease Ontology enrichment analysis for the genes selected in the significant perturbed module, in the group treated with everolimus and 5‐aza‐2′‐deoxycytidine.
3.7. Validation of gene expression data
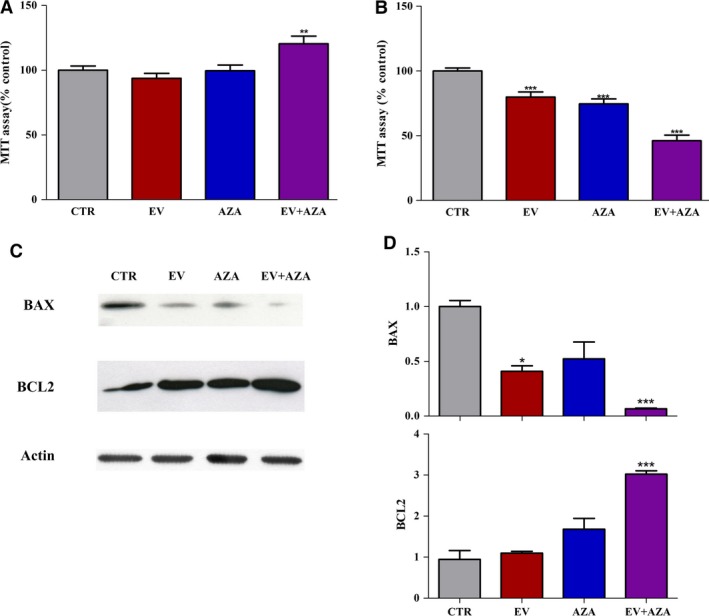
From the final model of perturbed biological pathways during concomitant incubation with AZA/everolimus combination (Fig. 6), NGFR‐MAPK10‐TP53‐Bax/Bcl‐2 pathway was selected for further analysis on the basis of its strict interaction and modulation of apoptosis, and assessed by western blot (Fig. 8). Indeed, in our system, apoptosis was the cell death mechanism responsible for the synergistic cytotoxic activity of everolimus plus AZA.
Figure 8.
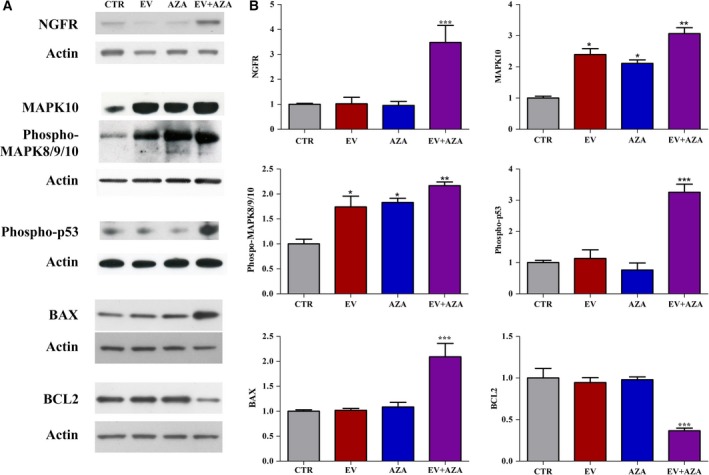
(A) Representative western blot analysis of NGFR, MAPK10, phosphorylated MAPK8/9/10, phosphorylated p53, Bax, and Bcl‐2 performed in MZ‐CRC‐1 cells without (CTR) or after incubation with 2.1 nm everolimus (EV) and/or 1.4 × 10² nm 5‐aza‐2′‐deoxycytidine (AZA). Actin was used as a loading control. (B) Quantification of western blot analysis from at least three independent experiments. *P < 0.05; **P < 0.01; ***P < 0.001.
A significant increase in NGFR expression has been observed exclusively after 6 days of treatment with the synergistic combination of everolimus plus AZA in MZ‐CRC‐1 cells compared to untreated cells (Fig. 8). Everolimus and AZA alone and in combination increased the protein expression of MAPK10 and phosphorylated MAPK8/9/10; these effects were more pronounced with the combined treatment. In addition, a significant increase in phosphorylated p53 was observed only after incubation with everolimus and AZA combination (Fig. 8). The proapoptotic and antiapoptotic Bax and Bcl‐2, respectively, represent the key proteins involved in mitochondrial pathway of apoptosis. Western blot analysis showed that only the synergistic combination of everolimus plus AZA significantly increased Bax with a concomitant decrease in Bcl2 expression, while there was no significant change in the expression of these proteins after the exposure of MZ‐CRC‐1 cells to everolimus or AZA alone (Fig. 8).
To verify that the synergistic antitumor activity observed during AZA/everolimus coincubation was indeed due to the increased expression in NGFR, we assessed the effects of both drugs alone or in combination on MZ‐CRC‐1 cell proliferation and protein expression of Bax and Bcl‐2 after 6 days of treatment, in the presence or absence of a neutralizing antibody raised against NGFR (Fig. 9). The concomitant incubation with blocking NGFR antibody counteracted the cytotoxic activity of everolimus and AZA alone, and induced a moderate stimulation in cell proliferation after treatment with AZA/everolimus combination (+20% vs control, P < 0.01, Fig. 9A). In a parallel set of experiments performed without the incubation with neutralizing antibody against NGFR, the more potent antiproliferative activity after incubation with everolimus plus AZA has been confirmed compared to single drugs (Fig. 9B). During concomitant incubation with neutralizing antibody against NGFR, everolimus plus AZA induced a significant decrease in Bax and increase in Bcl‐2 expression, while these effects were mild with each drug alone (Fig. 9C,D).
Figure 9.
Effect of 2.1 nm everolimus (EV) and/or 1.4 × 10² nm 5‐aza‐2′‐deoxycytidine (AZA) on cell proliferation in MZ‐CRC‐1 cells (A, B) and protein expression of Bax and Bcl‐2 (C, D) after 6 days of treatment, in the presence (A, C, D) or absence (B) of neutralizing antibody against NGFR (1 : 250). (C) Representative western blot analysis. Actin was used as a loading control. (D) Quantification of western blot analysis from at least three independent experiments. *P < 0.05; **P < 0.01; ***P < 0.001.
3.8. Effects of everolimus and AZA on DNA methylation profile
Methylation levels of genes identified in the perturbed everolimus plus AZA module (Fig. 6 and Table S4) were extrapolated from genome‐wide methylation analysis using the Infinium HumanMethylation 450K BeadChip array performed in MZ‐CRC‐1 with or without treatment with everolimus and/or AZA. The array covers 769 probes for these selected 31 genes. Methylation levels for these genes were found to be significantly different among groups (P = 3.6 × 10⁻⁵) (Fig. S2A). A significant reduction in DNA methylation levels has been observed after incubation with AZA alone, similar to that observed after AZA plus everolimus compared to untreated control. The incubation with everolimus alone did not significantly modify DNA methylation levels. These data were confirmed through the density plot showing methylation‐level distributions of untreated and treated samples (Fig. S2B). A similar trend has been observed for NGFR and MAPK10, both methylated genes involved in the NGFR‐MAPK10‐TP53‐Bax/Bcl‐2 pathway (Fig. S2C).
4. Discussion
Aberrant promoter methylation of tumor suppressor genes plays a relevant role in the initiation and progression of cancer. In addition, it is being increasingly recognized that aberrant DNA methylation seems to be involved in the development of drug resistance through transcriptional suppression of genes implicated in drug metabolism, apoptosis, cell cycle control, and other biological processes (Hervouet et al., 2013). Taking into consideration that DNA methylation is a reversible event unlike genetic mutations, the use of demethylating agents has been recently proposed as a new therapeutic strategy in cancer. Several reports demonstrated the capability of AZA to overcome resistance to chemotherapeutic and biological agents in tumors (Oronsky et al., 2014; Vijayaraghavalu et al., 2013; Zhang et al., 2009). This was encouraging, given that AZA is clinically used for patients with acute myeloid leukemia and myelodysplastic syndromes.
In the current study, combination analysis, based on the Chou–Talalay's method, definitely demonstrated that AZA combined with everolimus was more effective in inhibiting cell proliferation than each agent alone in MTC cells. This cytotoxic activity was highly synergistic through a potent induction of apoptosis in MZ‐CRC‐1 cells, which was the cell line most resistant to everolimus alone. However, in TT cells, combined treatment exhibited both synergistic and antagonistic effects on cell proliferation inhibition, depending on the concentration of the drugs. In MZ‐CRC‐1 cells, while everolimus or AZA alone was barely effective in apoptosis induction, the AZA/everolimus combination doubled the fraction of MTC apoptotic cells compared to untreated controls. Cell cycle analysis showed that everolimus decreased the percentages of MZ‐CRC‐1 cells in G2/M and S phases, but the combination with AZA did not potentiate this effect. Interestingly, the concentrations of AZA and everolimus adopted in vitro for the synergistic antiproliferative activity can be readily achieved in vivo with acceptable risk benefit (van Groeningen et al., 1986; O'Donnell et al., 2008). In addition, the in vitro toxicity of this combination appeared to be moderate. The cytotoxic activity of everolimus and AZA was lower in HEK‐293 cells, a human embryonic kidney normal cell line, compared to that observed in MZ‐CRC‐1 cells. This is very promising in terms of safety and tolerability for future clinical trials.
Synergistic antiproliferative activity between AZA and everolimus was not related to a direct effect on mTOR activation. In fact, AZA was unable to potentiate the inhibitory activity of everolimus on both mTOR and 4E‐BP1 phosphorylation in MZ‐CRC‐1 cells.
Gene expression analysis revealed potential molecular mechanisms implicated in the synergy of AZA and everolimus in MZ‐CRC‐1 cells. We adopted an innovative bioinformatic pipeline based on SPIA and SEM, recently validated by one of us (Pepe and Grassi, 2014), that allowed us to investigate pathway modules, considering not only deregulated genes but also the connections between the perturbed ones. Several key regulatory genes modulated by the combined treatment of AZA plus everolimus were identified by this approach: PI3K‐Akt signaling, neurotrophin signaling pathway, ECM/receptor interaction, and focal adhesion. Interestingly, all these pathways have a critical role in the regulation of both proliferation and migration/invasion of tumor cells. In addition, a Disease Ontology enrichment analysis, performed on these selected genes, identified 25 biological terms. Twenty‐four of 25 identified terms were tumors, including endocrine gland cancer. The only noncancer item was ‘autosomal dominant disease’. These data further support the pivotal roles of these pathways in the development and progression of MTC. Indeed, MTC is a neuroendocrine tumor and MZ‐CRC‐1 cells harbor the multiple endocrine neoplasia type 2B RET‐M918T mutation, transmitted in this disease as an autosomal dominant trait (Santoro et al., 1995).
A perturbed pathway module, associated with the combined treatment of everolimus plus AZA, was generated by the detection and fusion of all shortest paths that put in communication the DEGs (Fig. 6). In this network, the ‘neurotrophin signaling pathway’ appeared to exert a direct influence on the apoptotic machinery through the overexpression of NGFR and the activation of MAPK10‐TP53‐Bax pathway. Neurotrophins are a family of proteins involved in differentiation, plasticity, and survival of neurons and modulate several functions of the neuroendocrine/immune system (Fiore et al., 2009). This family includes nerve growth factor (NGF), brain‐derived neurotrophic factor (BDNF), neurotrophins‐3 (NT‐3), neurotrophins‐4/5 (NT‐4/5), and neurotrophins‐6 (NT‐6). Biological activity of these factors is mediated through the activation of Trk tyrosine kinase receptors (TrkA, TrkB, and TrkC) and NGFR (also known as p75 neurotrophin receptor, p75NTR) (Skaper, 2012). In our study, gene expression analysis confirmed the induction of apoptosis through the upregulation of Bax. Bax is a proapoptotic protein antagonized by the antiapoptotic Bcl‐2. The ratio of Bax to Bcl‐2 expression represents a cell death switch, which determines the susceptibility of cells to an apoptotic stimulus. Indeed, a selective decrease in Bax/Bcl‐2 expression represents a common mechanism of drug resistance in tumor cells (Indran et al., 2011). We have found a selective increase in the expression of Bax/Bcl‐2 ratio, validated through WB analysis, exclusively after treatment with AZA and everolimus. This effect seems to be associated with the upregulation of NGFR, which has been described to be a tumor suppressor gene in several tumors (Dimaras and Gallie, 2008; Jin et al., 2007; Khwaja et al., 2004, 2006; Kuchler et al., 2011; Kuner and Hertel, 1998; Wang et al., 2014; Yang et al., 2015; Yuanlong et al., 2008), and consecutive activation of MAPK10 and p53.
Although the specific role of NGFR in the tumorigenesis and progression of MTC is unknown, neurotrophin signaling pathway appears to be involved in both preneoplastic thyroid C cell hyperplasia and MTC progression through Trk receptors (McGregor et al., 1999). In fact, a cross‐talk between the signal pathways mediated by the Ret proto‐oncogene and Trk receptors has been described (Esposito et al., 2008; Peterson and Bogenmann, 2004).
The concomitant incubation with blocking NGFR antibody counteracted the cytotoxic activity of everolimus and AZA alone, and induced a moderate stimulation in cell proliferation and a decrease in Bax/Bcl‐2 ratio expression after treatment with AZA plus everolimus compared to control. This effect could be explained by the block of the proapoptotic pathway mediated by NGFR, while the survival pathways remained activated. These data confirmed that the NGFR overexpression plays a main role in the synergistic cytotoxic activity of these two compounds. Although the mechanism by which the expression of NGFR significantly increased during incubation with everolimus and AZA remains unclear, in colorectal cancer it has been recently reported that NGFR expression was silenced by promoter methylation and that the overexpression of this gene significantly inhibited cell proliferation, invasion and stimulated cell apoptosis (Yang et al., 2015). In our model, the overexpression of NGFR appears not to be related to a direct epigenetic effect on NGFR gene. In fact, during incubation of MZ‐CRC‐1 cells with AZA, we found a significant decrease in DNA methylation levels of NGFR, comparable to that observed after everolimus plus AZA, while NGFR expression increased exclusively after combined treatment.
Intriguingly, the synergistic cytotoxic activity of everolimus/AZA combination was more relevant in MZ‐CRC‐1 (harboring RET‐M918T mutation) than in TT (harboring RET‐C634W mutation) cells (Table 1). We cannot exclude that the type of RET genetic alteration may have a role in the different antitumor activity observed in both cell lines. In fact, Gild et al. (2013) demonstrated that oncogenic RET regulates mTOR activity in MZ‐CRC‐1 and TT cell lines. Combined incubation with RET and mTOR inhibitors (AST487 and INK128, respectively) at low concentrations cooperated to inhibit mTOR signaling and cell growth, through the induction of apoptosis, in both MTC cell lines. In addition, a recent study found that methylation profiles relate closely to RET mutational status in MTC, and the most distinctive methylome was observed for RET‐M918T‐positive tumors (Mancikova et al., 2017).
In conclusion, we described for the first time a synergistic cytotoxic activity combining AZA with everolimus in MTC. This effect occurred through the overactivation of NGFR‐MAPK10‐TP53‐Bax/Bcl‐2 pathway and the induction of apoptosis. These data provide a new therapeutic scenario in MTC and probably in other neuroendocrine tumors, where therapy with everolimus is currently approved.
Author contributions
GV, AMDB, LJH, MC and LP conceived and designed the project; AD, DG, ESG, MOB, GG, MCC, GG and GM acquired the data; GV, AD, DP and DG analyzed and interpreted the data; GV, AD, DP and DG wrote the manuscript.
Supporting information
Fig. S1. Perturbed pathway module in the group treated with everolimus.
Fig. S2. (A) Box‐and‐whisker‐plots showing global methylation levels measured in 769 probes within 31 genes, selected from the perturbed module reported in Figure 6, in MZ‐CRC‐1 cells without (CTR) or with everolimus (EV) and/or 5‐aza‐2′deoxycytidine (AZA). (B) Density plot showing methylation level distributions of treated and untreated samples. (C) Box‐and‐whisker‐plots showing global methylation levels of NGFR, MAPK10, TP53, BAX and BCL2 genes in treated and untreated samples.
Table S1. Differentially expressed genes (DEGs) following incubation with everolimus vs untreated control identified by Significance Analysis of Microarray (SAM), using a delta value of 0.46. Fold change (FC).
Table S2. Differentially expressed genes (DEGs) following incubation with AZA vs untreated control identified by Significance Analysis of Microarray (SAM), using a delta value of 0.102. Fold change (FC).
Table S3. Differentially expressed genes (DEGs) following incubation with everolimus plus AZA vs untreated control identified by Significance Analysis of Microarray (SAM), using a delta value of 0.46. Fold change (FC).
Table S4. Genes in the perturbed everolimus plus AZA module. The gene ID, the gene symbol and if the gene is DEG (1) or not DEG (0) are reported.
Table S5. Genes in the perturbed everolimus module.
Acknowledgements
Novartis Farma (Origgio, Italy) supplied freely everolimus; we thank Dr. Maurizio Spinello (Novartis Farma) for major contribution to all the administrative and operational aspects concerning the supply of everolimus. This study was funded by the Italian Ministry of Education, University and Research (Grant Number: FIRB RBAP11884M), to GV and MC. The study was partially supported by funds of the Ricerca Corrente of Istituto Auxologico Italiano, Milan, Italy (code: 05C205_2012), to GV, and MIMOmics Grant of the European Union's Seventh Framework Programme (Grant Number: 305280).
References
- Aloyz RS, Bamji SX, Pozniak CD, Toma JG, Atwal J, Kaplan DR and Miller FD (1998) p53 is essential for developmental neuron death as regulated by the TrkA and p75 neurotrophin receptors. J Cell Biol 143, 1691–1703. [DOI] [PMC free article] [PubMed] [Google Scholar]
- Aryee MJ, Jaffe AE, Corrada‐Bravo H, Ladd‐Acosta C, Feinberg AP, Hansen KD and Irizarry RA (2014) Minfi: a flexible and comprehensive Bioconductor package for the analysis of Infinium DNA methylation microarrays. Bioinformatics 30, 1363–1369. [DOI] [PMC free article] [PubMed] [Google Scholar]
- Assenov Y, Müller F, Lutsik P, Walter J, Lengauer T and Bock C (2014) Comprehensive analysis of DNA methylation data with RnBeads. Nat Methods 11, 1138–1140. [DOI] [PMC free article] [PubMed] [Google Scholar]
- Bihani T, Ezell SA, Ladd B, Grosskurth SE, Mazzola AM, Pietras M, Reimer C, Zinda M, Fawell S and D'Cruz CM (2015) Resistance to everolimus driven by epigenetic regulation of MYC in ER+ breast cancers. Oncotarget 6, 2407–2420. [DOI] [PMC free article] [PubMed] [Google Scholar]
- Chan J and Kulke M (2014) Targeting the mTOR signaling pathway in neuroendocrine tumors. Curr Treat Options Oncol 15, 365–379. [DOI] [PMC free article] [PubMed] [Google Scholar]
- Chou TC, Motzer RJ, Tong Y and Bosl GJ (1994) Computerized quantitation of synergism and antagonism of taxol, topotecan, and cisplatin against human teratocarcinoma cell growth: a rational approach to clinical protocol design. J Natl Cancer Inst 86, 1517–1524. [DOI] [PubMed] [Google Scholar]
- Chou TC and Talalay P (1984) Quantitative analysis of dose‐effect relationships: the combined effects of multiple drugs or enzyme inhibitors. Adv Enzyme Regul 22, 27–55. [DOI] [PubMed] [Google Scholar]
- Dimaras H and Gallie BL (2008) The p75 NTR neurotrophin receptor is a tumor suppressor in human and murine retinoblastoma development. Int J Cancer 122, 2023–2029. [DOI] [PubMed] [Google Scholar]
- Druce M, Chung TT, Grozinsky‐Glasberg S, Gross DJ and Grossman AB (2012) Preliminary report of the use of everolimus in a patient with progressive medullary thyroid carcinoma. Clin Endocrinol (Oxf) 77, 154–155. [DOI] [PubMed] [Google Scholar]
- Esposito CL, D'Alessio A, de Franciscis V and Cerchia L (2008) A cross‐talk between TrkB and Ret tyrosine kinases receptors mediates neuroblastoma cells differentiation. PLoS One 3, e1643. [DOI] [PMC free article] [PubMed] [Google Scholar] [Retracted]
- Faggiano A, Ramundo V, Dicitore A, Castiglioni S, Borghi MO, Severino R, Ferolla P, Crino L, Abbruzzese A, Sperlongano P et al (2012) Everolimus is an active agent in medullary thyroid cancer: a clinical and in vitro study. J Cell Mol Med 16, 1563–1572. [DOI] [PMC free article] [PubMed] [Google Scholar]
- Fiore M, Chaldakov GN and Aloe L (2009) Nerve growth factor as a signaling molecule for nerve cells and also for the neuroendocrine‐immune systems. Rev Neurosci 20, 133–145. [DOI] [PubMed] [Google Scholar]
- Gild ML, Landa I, Ryder M, Ghossein RA, Knauf JA and Fagin JA (2013) Targeting mTOR in RET mutant medullary and differentiated thyroid cancer cells. Endocr Relat Cancer 20, 659–667. [DOI] [PMC free article] [PubMed] [Google Scholar]
- Goel A, Arnold CN, Niedzwiecki D, Carethers JM, Dowell JM, Wasserman L, Compton C, Mayer RJ, Bertagnolli MM and Boland CR (2004) Frequent inactivation of PTEN by promoter hypermethylation in microsatellite instability‐high sporadic colorectal cancers. Cancer Res 64, 3014–3021. [DOI] [PubMed] [Google Scholar]
- van Groeningen CJ, Leyva A, O'Brien AM, Gall HE and Pinedo HM (1986) Phase I and pharmacokinetic study of 5‐aza‐2′‐deoxycytidine (NSC 127716) in cancer patients. Cancer Res 46, 4831–4836. [PubMed] [Google Scholar]
- Heilmann AM, Subbiah V, Wang K, Sun JX, Elvin JA, Chmielecki J, Sherman SI, Murthy R, Busaidy NL, Subbiah I et al (2016) Comprehensive genomic profiling of clinically advanced medullary thyroid carcinoma. Oncology 90, 339–346. [DOI] [PMC free article] [PubMed] [Google Scholar]
- Hervouet E, Cheray M, Vallette FM and Cartron PF (2013) DNA methylation and apoptosis resistance in cancer cells. Cells 2, 545–573. [DOI] [PMC free article] [PubMed] [Google Scholar]
- Indran IR, Tufo G, Pervaiz S and Brenner C (2011) Recent advances in apoptosis, mitochondria and drug resistance in cancer cells. Biochim Biophys Acta 1807, 735–745. [DOI] [PubMed] [Google Scholar]
- Jin H, Pan Y, He L, Zhai H, Li X, Zhao L, Sun L, Liu J, Hong L, Song J et al (2007) p75 neurotrophin receptor inhibits invasion and metastasis of gastric cancer. Mol Cancer Res 5, 423–433. [DOI] [PubMed] [Google Scholar]
- Juengel E, Dauselt A, Makarevic J, Wiesner C, Tsaur I, Bartsch G, Haferkamp A and Blaheta RA (2012) Acetylation of histone H3 prevents resistance development caused by chronic mTOR inhibition in renal cell carcinoma cells. Cancer Lett 324, 83–90. [DOI] [PubMed] [Google Scholar]
- Juengel E, Nowaz S, Makarevi J, Natsheh I, Werner I, Nelson K, Reiter M, Tsaur I, Mani J, Harder S et al (2014) HDAC‐inhibition counteracts everolimus resistance in renal cell carcinoma in vitro by diminishing cdk2 and cyclin A. Mol Cancer 13, 152. [DOI] [PMC free article] [PubMed] [Google Scholar]
- Kenchappa RS, Tep C, Korade Z, Urra S, Bronfman FC, Yoon SO and Carter BD (2010) p75 neurotrophin receptor‐mediated apoptosis in sympathetic neurons involves a biphasic activation of JNK and up‐regulation of tumor necrosis factor‐alpha‐converting enzyme/ADAM17. J Biol Chem 285, 20358–20368. [DOI] [PMC free article] [PubMed] [Google Scholar]
- Khwaja F, Allen J, Lynch J, Andrews P and Djakiew D (2004) Ibuprofen inhibits survival of bladder cancer cells by induced expression of the p75NTR tumor suppressor protein. Cancer Res 64, 6207–6213. [DOI] [PubMed] [Google Scholar]
- Khwaja F, Tabassum A, Allen J and Djakiew D (2006) The p75(NTR) tumor suppressor induces cell cycle arrest facilitating caspase mediated apoptosis in prostate tumor cells. Biochem Biophys Res Commun 341, 1184–1192. [DOI] [PubMed] [Google Scholar]
- Kuchler J, Hartmann W, Waha A, Koch A, Endl E, Wurst P, Kindler D, Mikeska T, Goodyer CG, Buttner R et al (2011) p75(NTR) induces apoptosis in medulloblastoma cells. Int J Cancer 128, 1804–1812. [DOI] [PubMed] [Google Scholar]
- Kuner P and Hertel C (1998) NGF induces apoptosis in a human neuroblastoma cell line expressing the neurotrophin receptor p75NTR. J Neurosci Res 54, 465–474. [DOI] [PubMed] [Google Scholar]
- Lim SM, Chang H, Yoon MJ, Hong YK, Kim H, Chung WY, Park CS, Nam KH, Kang SW, Kim MK et al (2013) A multicenter, phase II trial of everolimus in locally advanced or metastatic thyroid cancer of all histologic subtypes. Ann Oncol 24, 3089–3094. [DOI] [PubMed] [Google Scholar]
- Lyra J, Vinagre J, Batista R, Pinto V, Prazeres H, Rodrigues F, Eloy C, Sobrinho‐Simoes M and Soares P (2014) mTOR activation in medullary thyroid carcinoma with RAS mutation. Eur J Endocrinol 171, 633–640. [DOI] [PubMed] [Google Scholar]
- Mancikova V, Montero‐Conde C, Perales‐Paton J, Fernandez A, Santacana M, Jodkowska K, Inglada‐Pérez L, Castelblanco E, Borrego S, Encinas M et al (2017) Multilayer OMIC data in medullary thyroid carcinoma identifies the STAT3 pathway as a potential therapeutic target in RETM918T tumors. Clin Cancer Res 23, 1334–1345. [DOI] [PubMed] [Google Scholar]
- Manfredi GI, Dicitore A, Gaudenzi G, Caraglia M, Persani L and Vitale G (2015) PI3K/Akt/mTOR signaling in medullary thyroid cancer: a promising molecular target for cancer therapy. Endocrine 48, 363–370. [DOI] [PubMed] [Google Scholar]
- McGregor LM, McCune BK, Graff JR, McDowell PR, Romans KE, Yancopoulos GD, Ball DW, Baylin SB and Nelkin BD (1999) Roles of trk family neurotrophin receptors in medullary thyroid carcinoma development and progression. Proc Natl Acad Sci U S A 96, 4540–4545. [DOI] [PMC free article] [PubMed] [Google Scholar]
- O'Donnell A, Faivre S, Burris HA 3rd, Rea D, Papadimitrakopoulou V, Shand N, Lane HA, Hazell K, Zoellner U, Kovarik JM et al (2008) Phase I pharmacokinetic and pharmacodynamic study of the oral mammalian target of rapamycin inhibitor everolimus in patients with advanced solid tumors. J Clin Oncol 26, 1588–1595. [DOI] [PubMed] [Google Scholar]
- Oronsky B, Oronsky N, Knox S, Fanger G and Scicinski J (2014) Episensitization: therapeutic tumor resensitization by epigenetic agents: a review and reassessment. Anticancer Agents Med Chem 14, 1121–1127. [DOI] [PMC free article] [PubMed] [Google Scholar]
- Pepe D, Do JH (2015) Estimation of dysregulated pathway regions in MPP+ treated human neuroblastoma SH‐EP cells with structural equation model. BioChip J 9, 131–138. [Google Scholar]
- Pepe D and Grassi M (2014) Investigating perturbed pathway modules from gene expression data via structural equation models. BMC Bioinformatics 15, 132. [DOI] [PMC free article] [PubMed] [Google Scholar]
- Peterson S and Bogenmann E (2004) The RET and TRKA pathways collaborate to regulate neuroblastoma differentiation. Oncogene 23, 213–225. [DOI] [PubMed] [Google Scholar]
- Santoro M, Carlomagno F, Romano A, Bottaro DP, Dathan NA, Grieco M, Fusco A, Vecchio G, Matoskova B, Kraus MH et al (1995) Activation of RET as a dominant transforming gene by germline mutations of MEN2A and MEN2B. Science 267, 381–383. [DOI] [PubMed] [Google Scholar]
- Schneider TC, de Wit D, Links TP, van Erp NP, van der Hoeven JJ, Gelderblom H, van Wezel T, van Eijk R, Morreau H, Guchelaar HJ et al (2015) Beneficial effects of the mTOR inhibitor everolimus in patients with advanced medullary thyroid carcinoma: subgroup results of a phase II trial. Int J Endocrinol 2015, 348124. [DOI] [PMC free article] [PubMed] [Google Scholar]
- Skaper SD (2012) The neurotrophin family of neurotrophic factors: an overview. Methods Mol Biol 846, 1–12. [DOI] [PubMed] [Google Scholar]
- Tarca AL, Draghici S, Khatri P, Hassan SS, Mittal P, Kim JS, Kim CJ, Kusanovic JP and Romero R (2009) A novel signaling pathway impact analysis. Bioinformatics 25, 75–82. [DOI] [PMC free article] [PubMed] [Google Scholar]
- Tusher VG, Tibshirani R and Chu G (2001) Significance analysis of microarrays applied to the ionizing radiation response. Proc Natl Acad Sci U S A 98, 5116–5121. [DOI] [PMC free article] [PubMed] [Google Scholar]
- Vijayaraghavalu S, Dermawan JK, Cheriyath V and Labhasetwar V (2013) Highly synergistic effect of sequential treatment with epigenetic and anticancer drugs to overcome drug resistance in breast cancer cells is mediated via activation of p21 gene expression leading to G2/M cycle arrest. Mol Pharm 10, 337–352. [DOI] [PMC free article] [PubMed] [Google Scholar]
- Vitale G, Caraglia M, Ciccarelli A, Lupoli G, Abbruzzese A and Tagliaferri P (2001) Current approaches and perspectives in the therapy of medullary thyroid carcinoma. Cancer 91, 1797–1808. [DOI] [PubMed] [Google Scholar]
- Vitale G, de Herder WW, van Koetsveld PM, Waaijers M, Schoordijk W, Croze E, Colao A, Lamberts SW and Hofland LJ (2006) IFN‐beta is a highly potent inhibitor of gastroenteropancreatic neuroendocrine tumor cell growth in vitro. Cancer Res 66, 554–562. [DOI] [PubMed] [Google Scholar]
- Vitale G, Dicitore A, Messina E, Sciammarella C, Faggiano A and Colao A (2016) Epigenetics in medullary thyroid cancer: from pathogenesis to targeted therapy. Recent Pat Anticancer Drug Discov 11, 275–282. [DOI] [PubMed] [Google Scholar]
- Vitale G, van Eijck CH, van Koetsveld Ing PM, Erdmann JI, Speel EJ, van der Wansem Ing K, Mooij DM, Colao A, Lombardi G, Croze E et al (2007) Type I interferons in the treatment of pancreatic cancer: mechanisms of action and role of related receptors. Ann Surg 246, 259–268. [DOI] [PMC free article] [PubMed] [Google Scholar]
- Vitale G, Zappavigna S, Marra M, Dicitore A, Meschini S, Condello M, Arancia G, Castiglioni S, Maroni P, Bendinelli P et al (2012) The PPAR‐gamma agonist troglitazone antagonizes survival pathways induced by STAT‐3 in recombinant interferon‐beta treated pancreatic cancer cells. Biotechnol Adv 30, 169–184. [DOI] [PubMed] [Google Scholar]
- Walenkamp A, Crespo G, Fierro Maya F, Fossmark R, Igaz P, Rinke A, Tamagno G, Vitale G, Oberg K and Meyer T (2014) Hallmarks of gastrointestinal neuroendocrine tumours: implications for treatment. Endocr Relat Cancer 21, R445–R460. [DOI] [PubMed] [Google Scholar]
- Wang W, Chen J and Guo X (2014) The role of nerve growth factor and its receptors in tumorigenesis and cancer pain. Biosci Trends 8, 68–74. [DOI] [PubMed] [Google Scholar]
- Yang Z, Chen H, Huo L, Bai Y, Fan X, Ni B, Fang L, Hu J, Peng J, Wang L et al (2015) Epigenetic inactivation and tumor‐suppressor behavior of NGFR in human colorectal cancer. Mol Cancer Res 13, 107–119. [DOI] [PubMed] [Google Scholar]
- Yuanlong H, Haifeng J, Xiaoyin Z, Jialin S, Jie L, Li Y, Huahong X, Jiugang S, Yanglin P, Kaichun W et al (2008) The inhibitory effect of p75 neurotrophin receptor on growth of human hepatocellular carcinoma cells. Cancer Lett 268, 110–119. [DOI] [PubMed] [Google Scholar]
- Zhang YJ, Zhao SL, Tian XQ, Sun DF, Xiong H, Dai Q, Li XQ and Fang JY (2009) Combined inhibition of Dnmt and mTOR signaling inhibits formation and growth of colorectal cancer. Int J Colorectal Dis 24, 629–639. [DOI] [PubMed] [Google Scholar]
Associated Data
This section collects any data citations, data availability statements, or supplementary materials included in this article.
Supplementary Materials
Fig. S1. Perturbed pathway module in the group treated with everolimus.
Fig. S2. (A) Box‐and‐whisker‐plots showing global methylation levels measured in 769 probes within 31 genes, selected from the perturbed module reported in Figure 6, in MZ‐CRC‐1 cells without (CTR) or with everolimus (EV) and/or 5‐aza‐2′deoxycytidine (AZA). (B) Density plot showing methylation level distributions of treated and untreated samples. (C) Box‐and‐whisker‐plots showing global methylation levels of NGFR, MAPK10, TP53, BAX and BCL2 genes in treated and untreated samples.
Table S1. Differentially expressed genes (DEGs) following incubation with everolimus vs untreated control identified by Significance Analysis of Microarray (SAM), using a delta value of 0.46. Fold change (FC).
Table S2. Differentially expressed genes (DEGs) following incubation with AZA vs untreated control identified by Significance Analysis of Microarray (SAM), using a delta value of 0.102. Fold change (FC).
Table S3. Differentially expressed genes (DEGs) following incubation with everolimus plus AZA vs untreated control identified by Significance Analysis of Microarray (SAM), using a delta value of 0.46. Fold change (FC).
Table S4. Genes in the perturbed everolimus plus AZA module. The gene ID, the gene symbol and if the gene is DEG (1) or not DEG (0) are reported.
Table S5. Genes in the perturbed everolimus module.