Abstract
Ovarian cancer is a lethal malignancy that has not seen a major therapeutic advance in over 30 years. We demonstrate that ovarian cancer exhibits a targetable alteration in iron metabolism. Ferroportin (FPN), the iron efflux pump, is decreased, and transferrin receptor (TFR1), the iron importer, is increased in tumor tissue from patients with high grade but not low grade serous ovarian cancer. A similar profile of decreased FPN and increased TFR1 is observed in a genetic model of ovarian cancer tumor initiating cells (TICs). The net result of these changes is an accumulation of excess intracellular iron and an augmented dependence on iron for proliferation. A forced reduction in intracellular iron reduces the proliferation of ovarian cancer TICs in vitro, and inhibits both tumor growth and intraperitoneal dissemination of tumor cells in vivo. Mechanistic studies demonstrate that iron increases metastatic spread by facilitating invasion through expression of matrix metalloproteases and synthesis of IL6. We show that the iron dependence of ovarian cancer tumor initiating cells renders them exquisitely sensitive in vivo to agents that induce iron-dependent cell death (ferroptosis) as well as iron chelators, and thus creates a metabolic vulnerability that can be exploited therapeutically.
Keywords: iron, ferroptosis, ovarian cancer, tumor initiating cells
INTRODUCTION
Ovarian cancer is the fifth leading cause of cancer-related deaths among women in the US(1), and the most lethal gynecologic malignancy (1)(1). Ovarian cancer is a heterogeneous disease composed of multiple subtypes defined both histologically (2) and molecularly (3, 4). High grade serous ovarian carcinoma (HGSOC) is the most common subtype, accounting for over 50% of ovarian malignancies. The 5-year survival-rate of HGSOC patients is a dismal 9–34%(2). Despite an initial response to therapy, most patients develop recurrent, chemoresistant and ultimately terminal disease(5). One strategy to address this problem has been to develop therapies that effectively target tumor initiating cells (TICs), since this subpopulation of cells in the tumor have been linked to the development of recurrence and resistance to therapy in many types of cancer, including ovarian cancer(6, 7).
Although the origin of ovarian cancer TICs remains an area of debate (8), a growing consensus suggests that stem cells derived from fimbria of the fallopian tubules are the precursors of at least some ovarian cancers, particularly HGSOC (9). By isolating stem cells from normal fimbria and transducing them with defined oncogenes, we recently created a model of serous ovarian cancer tumor-initiating cells (TICs) (10). These cells are capable of multipotent differentiation, and tumors derived from these cells share histological and molecular features of HGSOC.
Alterations in iron metabolism, in particular the acquisition and retention of excess iron, contribute to both tumor initiation and tumor growth (11, 12). This observation has spawned diverse approaches to target intracellular iron in anti-cancer therapy including the use of iron chelators and cytotoxic drug conjugates directed to transferrin receptor 1 (TFR1), a protein that mediates iron import(11). Treating cancer cells with agents that induce iron-dependent cell death (ferroptosis (13)) represents a new strategy for turning the excess iron present in cancer cells to therapeutic advantage. In this manuscript we explore whether HGSOC and HGSOC TICs exhibit targetable alterations in iron metabolism.
RESULTS
HGSOC is characterized by consistent alterations in expression of iron-related genes and proteins
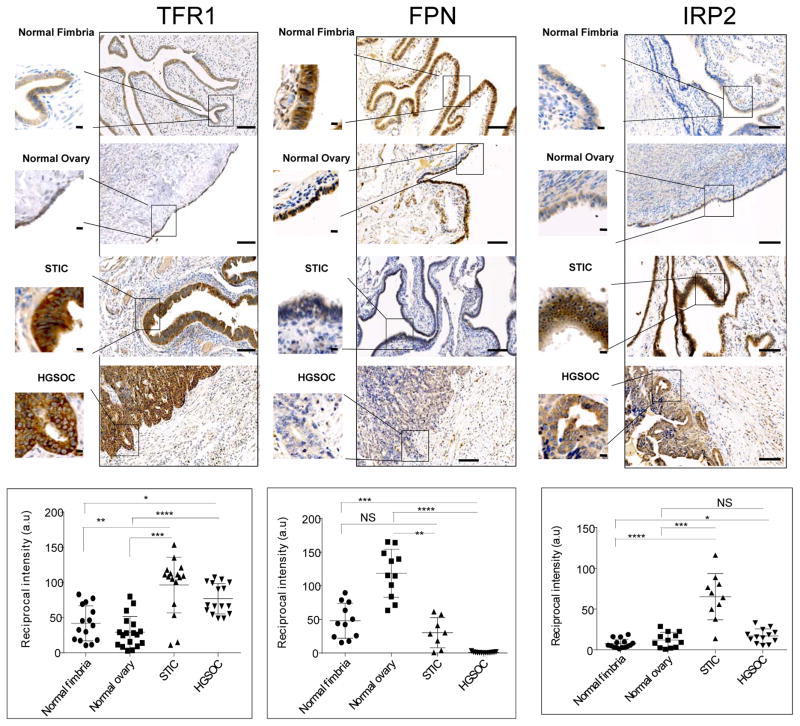
We began by testing whether iron metabolism was altered in HGSOC by assessing levels of transferrin receptor 1 (TFR1) and ferroportin (FPN), proteins that play central roles in iron metabolism by regulating the uptake and efflux of iron, respectively. Immunohistochemistry of normal ovarian epithelium versus tissue from HGSOC patients revealed that TFR1, the iron import protein, was more strongly expressed in malignant than normal ovarian tissue (p =2x10⁻⁷) and that FPN, the iron efflux pump, was substantially decreased in HGSOC when compared to normal ovarian epithelia (p =2x10⁻¹¹) (Fig. 1). Because of growing evidence that serous tubal intra-epithelial carcinoma (STIC) is a precursor lesion of HGSOC(14–16), we next compared normal ovary to STIC. It revealed a similar trend: TFR1 was elevated(p =3x10⁻⁷) and FPN was decreased (p =5x10⁻⁶) in STIC relative to the normal ovary. Since HGSOC is suspected to originate in fimbria, we also compared normal fimbria to HGSOC and again observed increased TFR1 (p =0.0001) and decreased FPN (p =7x10⁻⁷) in cancer (Fig. 1). These results identify a phenotype of increased iron retention in ovarian cancer cells that develops early in the evolution of this disease.
Fig. 1. Proteins that control intracellular iron are altered high grade serous ovarian cancer (HGSOC).
Representative images of immunohistochemical staining of normal fimbria, normal ovary surface epithelia, serous tubal intra-epithelial carcinoma (STIC) and HGSOC stained with antibodies against transferrin receptor 1 (TFR1), ferroportin (FPN) and iron regulatory protein 2 (IRP2). Dot plots represent quantification of staining of tissues collected from 8 patients with HGSOC and 5 with STIC compared to 8 subjects with normal fimbria and 6 individuals with normal ovarian surface epithelium. Images of three to four random fields per slide were quantified. Differences in TRFC (p<0.0001), FPN (p<0.0001 and IRP2 (p<0.01) were statistically significant (one way ANOVA). *p<0.001, **p<5x10⁻⁵, *** p<5x10⁻⁶, ****p<5x10⁻⁷, one tailed t test for individual comparisons. Scale bar 1 mm; inset scale bar 10 μm.
Iron regulatory protein 2 (IRP2) regulates TFR1 and FPN levels post-transcriptionally and is overexpressed in some cancers(17). Since overexpression of IRP2 would lead to an increase in TFR1 and decrease in FPN, we also assessed levels of IRP2 in our samples of normal and malignant ovary (Fig. 1). Although IRP2 was substantially increased in STIC (p =3x10⁻⁸) and was modestly elevated in HGSOC (p =0.0008) when compared to normal fimbria, it was not statistically different in HGSOC versus normal ovary (Fig. 1), suggesting that differences in post-transcriptional regulation of these proteins, and in particular, differences in levels of IRP2 do not account for all of the observed changes in TFR1 and FPN.
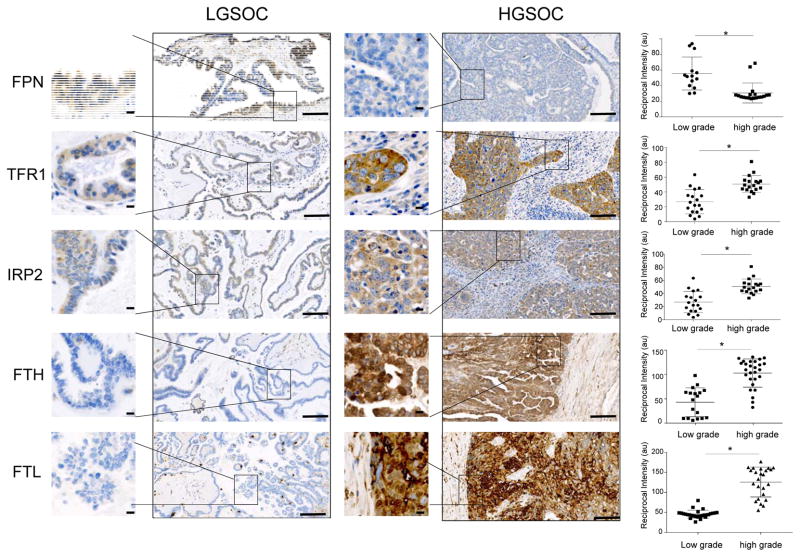
We next tested whether a profile of iron retention was also characteristic of low grade serous ovarian cancer (LGSOC), a less aggressive form of ovarian cancer with a more favorable prognosis that is believed to have a different pathogenesis than HGSOC (18). As shown in Fig. 2, IHC staining for TFR1, FPN and IRP2 revealed that malignant tissue from patients with LGSOC exhibited a staining profile that was quite distinct from HGSOC and more reminiscent of normal tissue, with decreased TFR1 (p =0.001), increased FPN (p =0.0001)and decreased IRP2 (p =5.9x10⁻⁶) relative to HGSOC. We also performed IHC staining for ferritin, an iron storage protein composed of H and L subunits that is translationally induced by iron and frequently used as a marker of elevated intracellular iron (19). Consistent with a picture of excess iron acquisition and retention in HGSOC, staining for either ferritin H or ferritin L demonstrated an increase in HG vs LG ovarian cancer (p =1.6x10⁻⁸) (Fig. 2), as well as in HGSOC vs normal ovary or fallopian tube (Suppl. Fig. 1). Thus, the profile of iron retention that characterizes HGSOC, an ovarian cancer subtype with an especially poor prognosis, does not extend to less aggressive low grade serous ovarian cancer.
Fig. 2. Proteins that control intracellular iron differ in high grade and low grade serous ovarian cancer.
Representative images of immunohistochemical staining of tumor tissues from patients with low grade serous ovarian cancer (LGSOC) and high grade serous ovarian cancer (HGSOC). Proteins stained are ferroportin (FPN), transferrin receptor (TFR1), Iron Regulatory Protein 2 (IRP2), ferritin heavy chain (FTH) and ferritin light chain (FTL). Dot plots show quantification of staining of tissues from 5 patients with LGSOC and 8 patients with HGSOC (3 to 4 random fields from each patient tissue slide). *p<0.002. Scale bar 1 mm; inset scale bar 10 μm.
Iron metabolism is altered in a model of HGSOC tumor initiating cells
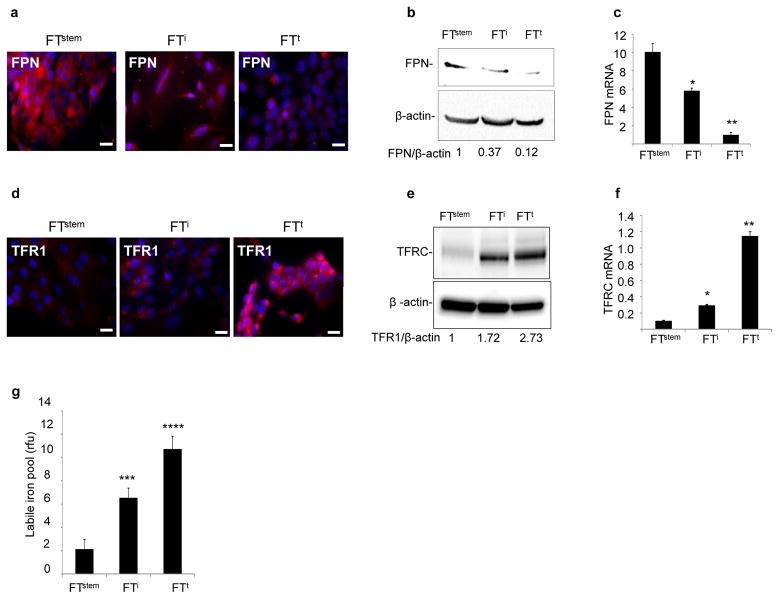
An important clinical problem in ovarian cancer is the development of resistance to chemotherapy, a phenomenon that has been attributed to tumor initiating cells (“cancer stem cells”) resident in the tumor(6, 7, 20, 21). We therefore sought to determine whether alterations in iron metabolism could be detected and potentially targeted in TICs. We used a model of ovarian TIC with limited and defined genetic alterations to help identify specific pathways that drive alterations in iron metabolism (10). This model was created by cloning normal stem cells from human fallopian fimbriae (FTstem cells)(10, 22). We then introduced SV40TAg and hTERT to FTstem cells to create immortalized but non-tumorigenic FTi cells. Finally FTi cells were transduced with c-myc to create fully transformed and tumorigenic FTt cells; these give rise to tumors exhibiting the major hallmarks of HGSOC(10). We tested whether changes in iron metabolism occurred during the transition of these normal FTstem cells to malignant FTt cells. We observed a decrease in FPN, an increase in TFR1, and an increase in metabolically available iron (the labile iron pool (LIP)) in FTi cells expressing hTERT and SV40T; more extensive changes in FPN, TFR1 and the LIP were observed in FTt cells following introduction of c-myc (Fig. 3). Consistent with immunohistochemical staining of ovarian cancer precursor lesions (Fig. 1), these data indicate that perturbations in iron metabolism occur early in the genesis of HGSOC from TICs. They also demonstrate that key elements of the changes in iron metabolism are recapitulated by manipulating p53 and c-myc, two highly prevalent genetic alterations in HGSOC(23, 24).
Fig. 3. Iron metabolism is modified in a genetic model of ovarian tumor initiating cells.
(a,d) Immunofluorescent staining of ferroportin (FPN) and transferrin receptor (TFR1) in normal fallopian tube stem cells (FTstem), immortalized fallopian tube stem cells (FTi) and transformed fallopian tube stem cells (FTt). FPN and TFR1 in red; nuclei in blue. Scale bar 20 μm. (b,e)Cropped images of western blots and quantification of FPN and TFR1 with β-actin as a loading control. (c,f) qRT-PCR of FPN mRNA and TFR1 mRNA in FTstem, FTi and FTt cells. (n) Labile iron pool (LIP) per 1000 cells. *p<0.02, **p<0.0.0007, ***p<5x10⁻⁸; ****p<5x10⁻¹¹.
Ovarian cancer tumor initiating cells exhibit enhanced iron dependence
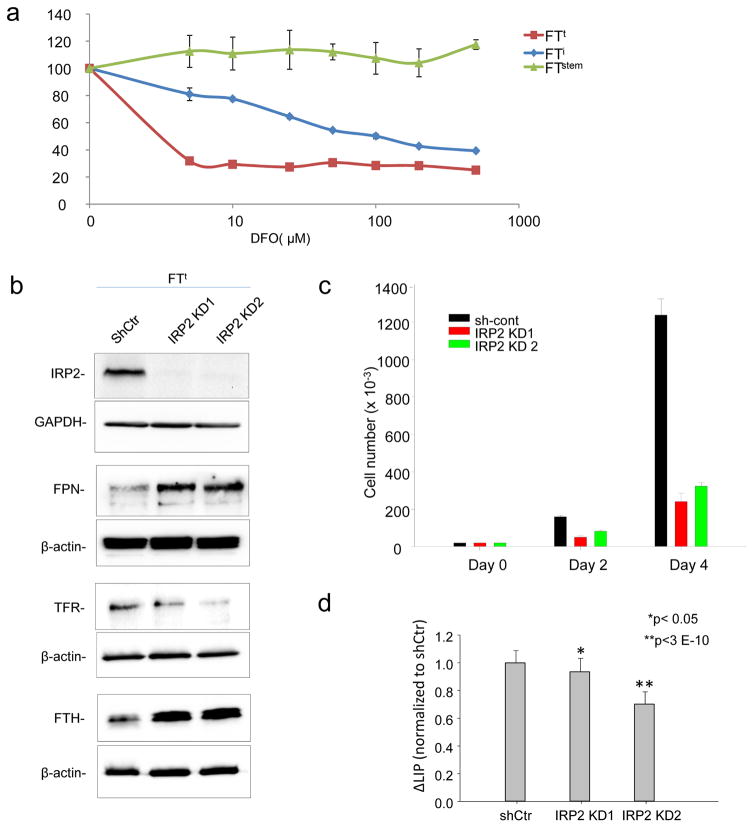
We tested whether the profile of iron acquisition and retention seen in ovarian cancer TICs was a result of an enhanced dependence on iron (“iron addiction”)(25). We treated TICs with desferroxamine (DFO), an iron chelator, and measured effects on viability. FTt cells were remarkably more sensitive to iron chelation than normal stem cells; immortalized cells exhibited an intermediate sensitivity (Fig. 4a). To confirm the sensitivity of TICs to iron depletion using a genetic rather than pharmacologic approach, we knocked down IRP2 in FTt cells. As expected, knockdown of IRP2 decreased TFR1 and increased ferritin and ferroportin, depleting intracellular iron (Fig. 4b,d). Proliferation FTt cells was dramatically inhibited following this genetically-induced reduction in intracellular iron (Fig. 4c), consistent with the sensitivity of these cells to iron depletion by DFO.
Fig. 4. Tumor-initiating cells exhibit increased iron dependence.
(a) Cells were treated for 72 hrs with the indicated concentrations of deferoxamine (DFO) and viability was assessed using an MTS assay. (b) Cropped images of western blots of IRP2, transferrin receptor, (TFR1) ferritin heavy chain (FTH), and ferroportin in FTt cells with knockdown of IRP2 (IRP2 KD1, IRP2KD2) or control shRNA (shCtr). (c) Cell proliferation as assessed by trypan-blue exclusion in FTt cells treated with control shRNA or IRP2 knockdown vectors. d) Labile iron pool in cells with knockdown of IRP2 or control shRNA
An increase in iron efflux decreases the proliferation of ovarian cancer TICs and HGSOC cells
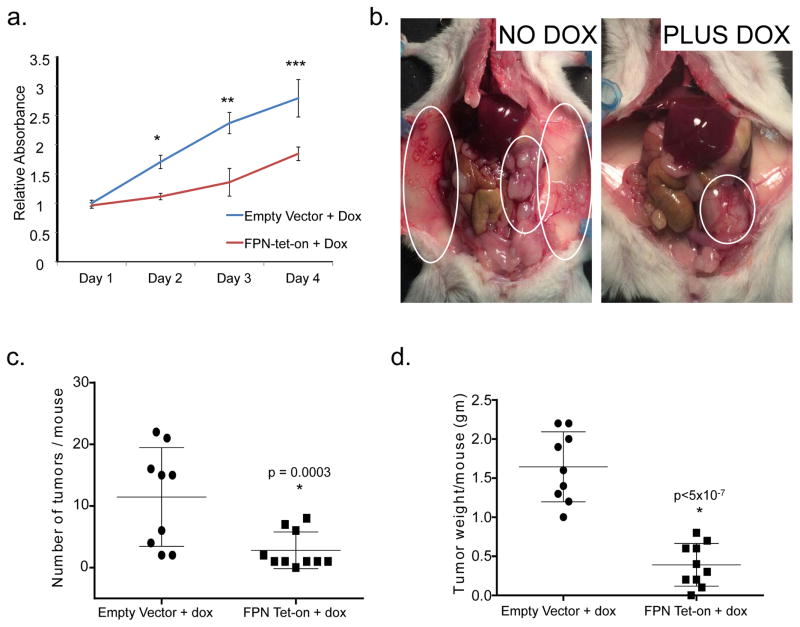
Our next goal was to determine whether changes in iron metabolism are important drivers or merely incidental passengers in growth and dissemination of ovarian cancer. We therefore selected FPN, a protein that was consistently reduced in ovarian cancer tissues (Fig. 1) and TICs (Fig. 3), and assessed the effect of increasing its expression on the proliferation and tumor-forming capability of ovarian TICs using a conditional doxycycline-driven promoter (FPN-tet-on). Overexpression of FPN reduces intracellular iron by enhancing iron efflux, thus enabling us to test the consequences of altered intracellular iron on the proliferation and tumor-forming ability of ovarian cancer tumor-initiating cells. Following induction of FPN with doxycycline, cells exhibited the predicted increase in FPN and decrease in intracellular iron (Suppl Fig. 2). This was accompanied by a significant reduction in cell number (Fig. 5a), indicating that a change in the level of FPN is in itself sufficient to modulate TIC proliferation in vitro.
Fig. 5. Increased iron efflux decreases tumorigenicity and invasion of ovarian cancer tumor-initiating cells.
(a) Cell viability of FTt cells as assayed by MTS assay at indicated time points with and without ferroportin overexpression. Blue line represents control (empty vector with doxycycline), and red line represents FPN-tet-on FTt cells (ferroportin tet on with doxycycline). *p<0.0002, one tail t test. (b) Representative images of mice inoculated IP with FPN-tet-on FTt cells and left untreated (left) or treated with doxycycline (right) for four weeks to induce expression of ferroportin. Untreated mice have a greater tumor burden and wider area of metastasis (circled in white). (c) Quantification of tumor number/mouse and (d) tumor mass/mouse following implantation of tumor cells containing empty vector (n=9) or FPN tet-on (n=10) following 4 weeks of doxycycline treatment.
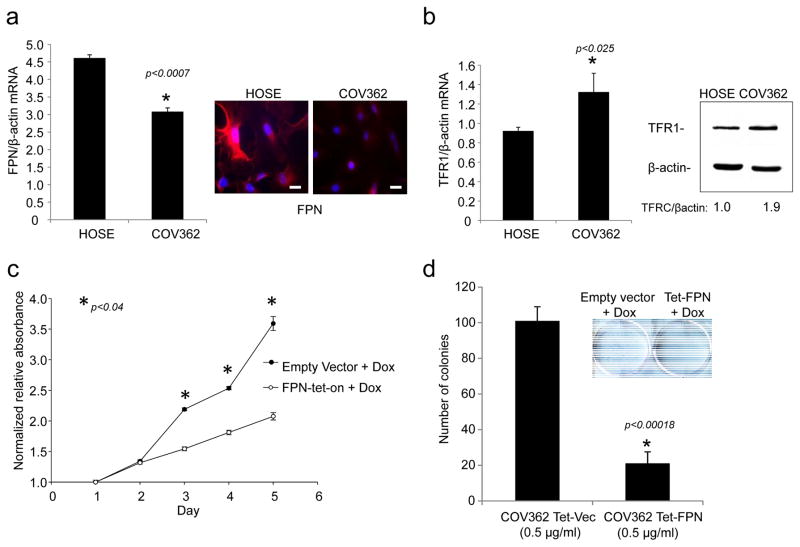
We tested whether cultured cells derived from HGSOC exhibited a similar dependence on iron. We used COV362 cells, an ovarian cancer cell line with mutated p53 and amplified c-myc that is among the top-ranked ovarian cancer cell lines for its similarity in molecular profile to primary HGSOC tumors (26). Like TIC cells, COV362 cells exhibited decreased expression of FPN and increased expression of TFR when compared to normal human ovarian surface epithelial (HOSE) cells (Fig. 6a,b ). Conditional overexpression of FPN (Suppl Fig 3) similarly inhibited proliferation and colony-forming ability of COV362 cells (Fig. 6 c,d). Colony formation was not affected in COV362 cells expressing a dysfunctional mutant of ferroportin (FPN A77D) that exhibits attenuated iron efflux activity(27, 28) (Suppl Fig 4).
Fig. 6. Increased iron efflux reduces proliferation of COV362 ovarian cancer cells.
(a) q-RTPCR of FPN (normalized to βactin) and immunofluorescence staining of FPN in COV362 and HOSE cells: FPN in red; nuclei in blue. Scale bar 20 μm. (b)q-RTPCR of TFR1/βactin in COV362 ovarian cancer cells and HOSE cells; (c) FPN was induced at time 0 by the addition of doxycycline and cell viability assessed at the indicated timepoints by MTS assay; (e) Colony formation of COV362cells with and without ferroportin overexpression was analyzed by crystal violet staining. Colonies from three replicate wells were counted and quantified.
An increase in iron efflux decreases tumor burden and metastatic spread of ovarian cancer TICs in vivo
To assess whether high intracellular iron contributes to tumor growth in vivo, we injected NSG mice intraperitoneally with FTt cells containing FPN-tet-on or empty vector. Mice were treated with vehicle or with doxycycline, and tumors were allowed to grow for 4 weeks before sacrificing the mice. IHC analysis confirmed the induction of FPN in tumors of mice treated with doxycycline (Suppl. Fig. 5). Necropsy revealed widely disseminated tumors in control mice, reminiscent of tumors observed in ovarian cancer patients with advanced disease (Fig. 5b). FPN-overexpressing cells also gave rise to tumors, but the tumor burden and area of metastasis were markedly reduced relative to controls (Fig. 5b–d). Mice injected with tumor cells that did not overexpress FPN also exhibited large blood vessels supplying small and multiple metastases; these were not evident in mice with FPN-overexpressing tumors (Fig. 5b). Quantification revealed a significant decrease in tumor number (p=0.003) as well as a significant decrease in tumor mass (p=4.6x10⁻⁷) in mice whose tumors over-expressed FPN (Fig. 5c–d).
Iron flux through ferroportin affects invasion of ovarian TICs
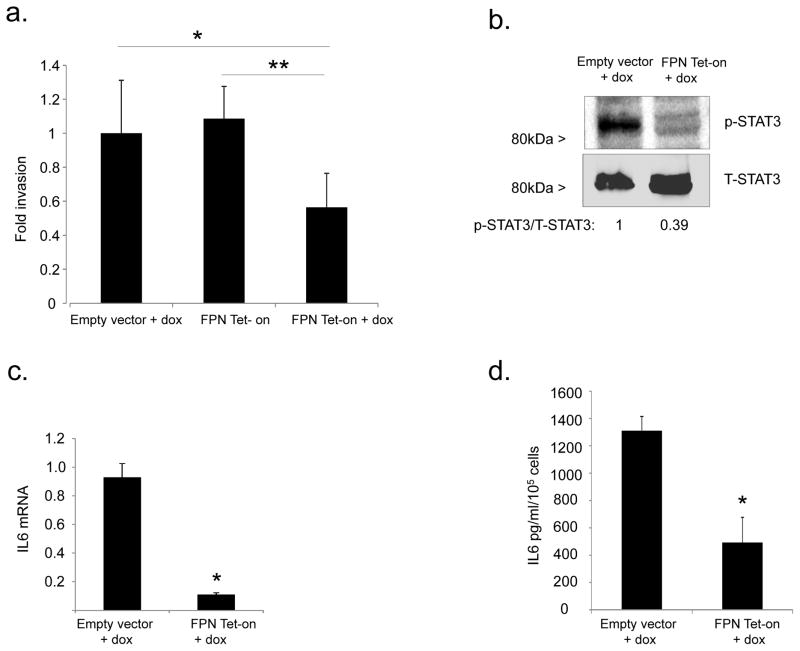
In ovarian cancer, the dissemination of tumor within the peritoneal cavity is frequently the only site of metastasis and a major source of morbidity and mortality. To disseminate, tumor cells must seed at multiple peritoneal sites, a process that requires tumor cell invasion of the peritoneum. Given that overexpression of FPN and attendant reduction of intracellular iron markedly reduced the number of tumors (Fig. 5c), we asked whether iron levels in TICs might directly affect tumor invasion by measuring the invasion of FTt cells following conditional induction of FPN. Because FPN affects cell proliferation (Fig. 5a), we corrected for cell number by comparing the number of cells that migrated through a layer of basement membrane protein to those that migrated through an uncoated porous membrane. Viable cells expressing FPN showed substantially reduced invasion when compared to control (Fig. 7a). Further, expression of MMP2, MMP9, MMP14 and uPA, enzymes that degrade extracellular matrix, were all reduced in TICs following FPN induction (Suppl. Fig. 6). Thus, iron augments not only proliferation, but also invasion of TICs.
Fig. 7. Ferroportin modulates invasion of FTt cells through STAT3 and IL6.
(a) In vitro invasion was measured in a simplified Boyden chamber consisting of two chambers separated by an 8 micron porous filter coated with or without basement membrane extract (BME). Invasion was normalized to migration of the cells in the inserts without the BME coating. *p=0.002; **p=5x10⁻⁵. (b) Western blot analysis of p-STAT3 and total STAT-3 in FTt cells transduced with empty vector (EV) or FPN-Tet-on following 48 hrs exposure to doxycycline. Band intensities were quantified using ImageJ. (c) IL6 mRNA was assessed using qRT-PCR; (d) IL6 was measured in culture supernates following 48 hrs’ exposure to doxycycline. *p≤0.0002.
To understand the mechanism linking iron to invasion, we examined IL6, a cytokine that is elevated in ovarian cancer by a STAT3-mediated pathway, promotes invasion, and contributes to poor patient outcome(29, 30). We found that induction of FPN decreased STAT-3 signaling in FTt cells (Fig 7b) and concomitantly decreased IL-6 mRNA and protein (Fig. 7c,d). Consistent with these results, treatment of cells with the iron chelator DFO also reduced IL6 mRNA (Suppl. Fig. 7). These data suggest that iron accumulation promotes invasion of ovarian TICs at least in part through induction of IL-6.
Targeting the iron addiction of ovarian TICs through ferroptosis
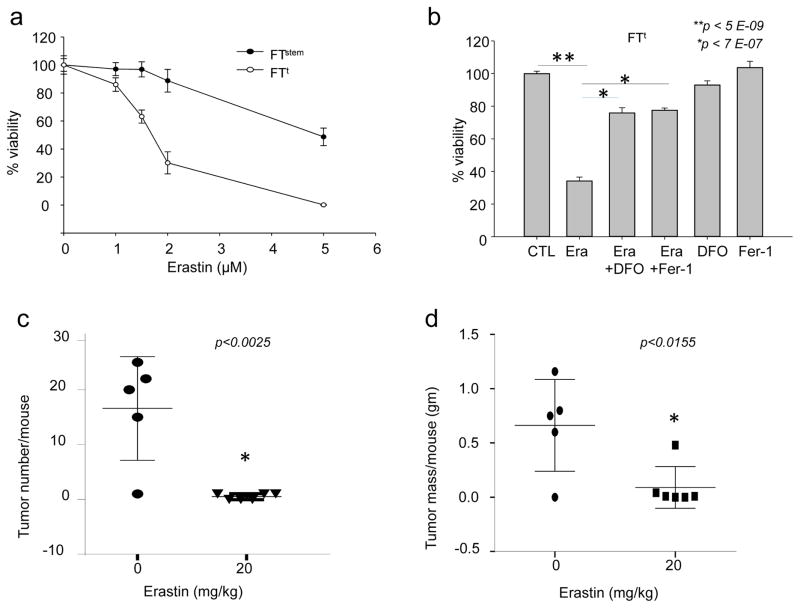
Ferroptosis is a recently recognized morphologically and mechanistically distinct form of cell death distinguished by its dependence on iron (13, 31). Ferroptosis causes cell death through iron-mediated accumulation of lipid ROS (31, 32). Ferroptosis can be induced by small molecules such as erastin (13), and inhibited by specifically designed molecules such as Fer-1 (ferrostatin)(31). We reasoned that the excess iron retained by ovarian cancer TICs might render them susceptible to agents that induce ferroptosis. To test this hypothesis, we measured the effect of treating ovarian TICs and non-cancer stem cells with erastin. To confirm that cell death was proceeding via ferroptosis, we treated cells with two different ferroptosis inhibitors, Fer-1 or DFO. Erastin decreased TIC viability (Fig. 8a), and its effects were rescued by both Fer-1 and DFO (Fig. 8b). TICs were significantly more susceptible to erastin treatment than non-cancer stem cells (Fig. 8a).
Fig. 8. Erastin induces ferroptosis in tumor-initiating cells and reduces tumor number and mass in vivo.
(a) 3000 FTstem and FTt cells were treated with indicated doses of erastin and cell viability assessed 48 hours later. (b) FTt cells were treated for 48 hrs with 2 μM of erastin alone, the combination of 2uM erastin plus 2 μM ferrostatin-1, the combination of 2uM erastin plus 50 uM DFO, ferrostatin alone, or DFO alone and cell viability assessed. (c,d) Mice were injected intraperitoneally with FTt cells and treated for 18 days with either vehicle or 20 mg/kg erastin. The number of tumors/mouse and total tumor mass/mouse were measured in the vehicle-treated group (n=5) and in the group treated with erastin (n=6).
To test whether erastin was similarly effective in vivo, we inoculated NSG mice with FTt cells and treated them with 20 mg/kg erastin daily for 18 days. Erastin treatment produced a marked reduction in both tumor number and mass, indicating that ferroptosis-inducing agents have the potential to successfully target ovarian tumors (Fig. 8c,d).
DISCUSSION
Results presented here demonstrate that iron metabolism is dramatically perturbed in HGSOC tumor tissue. Specifically, tumor tissue is characterized by enhanced iron uptake and retention as evidenced by an increase in the iron importer TFR1, a decrease in the iron efflux pump FPN, and an increase in the iron storage protein ferritin relative to non-tumor tissue (Fig. 1,2; Suppl. Fig. 1). The transition to an “iron-seeking” phenotype appears to be an early event in the development of HGSOC, as evidenced by similar perturbations in serous tubal intra-epithelial carcinoma (STIC) and genetically transformed fallopian stem cells (Fig. 1, 3). Further, our results suggest that tumor cells develop an enhanced dependence on iron, or “iron addiction” that can potentially be targeted both by agents that induce iron depletion (Fig. 4) and by agents that depend on iron for their activity, such as the ferroptosis inducer erastin (Fig. 8).
The changes in iron metabolism we observe in ovarian cancer are not merely incidental events that accompany the transition to malignancy: they make important contributions to the growth and metastasis of the cancer. Thus, reduction of iron in TICs through upregulation of ferroportin reduced tumor burden and spread in mice (Fig. 5).
Our studies of a genetic model of ovarian cancer TICs revealed that key elements of iron addiction in ovarian cancer TICs can be recapitulated by introduction of hTERT, SV40T and c-myc into normal fallopian tube stem cells. Although SV40T is not a human oncogene, its validity as an experimental tool in the study of ovarian cancer has been shown by studies demonstrating that its effects can be mimicked by disabling three of its key targets: p53, pRb and protein phosphatase(33). Mutations in TP53 and c-myc are two of the most prevalent genetic alterations in HGSOC(23, 24). We suggest that both p53 inactivation and c-myc expression contribute to altering iron metabolism in TICs, since changes in iron metabolism (decrease in FPN, increase in TFR1 and increase in LIP) were observed in SV40T-transduced FTi cells and further augmented in FTt cells expressing c-myc.
An iron acquisition phenotype has now been reported in a number of cancers: breast(34, 35), glioblastoma(36), prostate(37), and others(11). Iron is required for proliferation and cell cycle progression, and upregulation of these processes underpins at least some of the enhanced dependence of cancer cells on iron. We observed coordinated expression of IL6, MMPs and invasion in response to changes in iron (Fig. 7, Supp. Fig. 6, 7), suggesting a previously undescribed link between iron acquisition, iron-mediated induction of IL6, attendant metalloprotease induction, and tumor cell invasion. IL6 is a key cytokine in the initiation and progression of ovarian cancer(30, 38), affecting tumor cell growth, proliferation, and angiogenesis, as well as contributing to tumor invasion by upregulation of matrix metalloproteases(39). Iron-mediated upregulation of IL6 is consistent with previous work demonstrating that iron chelators inhibit synthesis of IL6 in pancreatic cancer cells (40), and that exogenous iron induces IL6 in hepatocytes (41). Although details of the pathway linking iron to IL6 are yet to be elucidated, STAT3 may play an important role, since a decrease in STAT3 phosphorylation occurred subsequent to iron depletion by ferroportin induction (Fig. 7), and was similarly decreased by iron chelation(40).
Ferroptosis is a recently discovered iron-dependent mode of cell death(13). Agents that trigger ferroptosis potentially represent a new class of anti-cancer agents, and are currently being explored in both preclinical and clinical studies(42). Iron is required to generate the oxidative stress that characterizes ferroptosis, although the precise role played by iron remains speculative(43, 44). The findings we report here suggest that the enhanced levels of iron required for the growth and invasion of HGSOC (and other cancers) may represent an Achilles heel that can be exploited in cancer therapy.
Our evidence of the vulnerability of TICs to ferroptosis may provide not only a new class of compounds that are effective in ovarian cancer, but also an important new target at which ferroptosis therapy can be directed: tumor initiating cells (“cancer stem cells”). We observed that ovarian cancer TICs exhibited decreased FPN, increased TFR1, and decreased LIP relative to non-cancer stem cells (Fig. 3). This was accompanied by an enhanced sensitivity to erastin, a ferroptosis-inducing agent (Fig. 8). Erastin was also able to profoundly inhibit tumor growth in vivo (Fig. 8). TICs are believed to represent a small pool of treatment-refractory cells that contribute to ovarian cancer drug resistance and recurrence (45). Thus the use of ferroptosis-inducing agents in the treatment of ovarian cancer, either alone or in combination with conventional therapies, has the potential to address this important clinical problem.
MATERIALS AND METHODS
Isolation, immortalization, transformation and growth of fallopian stem cells
Adult fallopian stem cells (FTstem) were isolated from fimbrial tissue obtained from discarded surgical specimens of women undergoing benign procedures and cultured on δ-irradiated 3T3 fibroblast feeder cells as described (10). Immortalized and transformed stem cells (FTi, FTt) were cultured in DMEM (GIBCO) containing 10% FBS (BenchMark). All cells were maintained at 37 °C in a humidified incubator at 7.5% CO2. The FTstem cells thus isolated exhibited long term renewability in vitro and the ability to differentiate into secretory and ciliated type cells. The cells were PAX8 positive (marker for fallopian tube epithelium stem cells), E-cadherin positive (marker for epithelial origin), and Ki67 positive (marker for proliferation). Fallopian stem cells (FTstem) were immortalized by infecting with retrovirus expressing hTERT, and SV40 large T antigen as previously described(10). Immortalized cells were further transformed by c-Myc (10). Immortalized cells are referred to here as FTi cells and transformed cells as FTt. Consistent with the expected properties of tumor-initiating cells, these cells can self-renew, form tumorspheres and as few as two thousand FTt cells were sufficient to form palpable tumors in immunodeficient mice in two weeks, and tumor xenografts demonstrated major hallmarks of HGSOC, such as loss of PAX2 and gain of p53, EZH2 and MUC4 expression, and gene expression profiles similar to HGSOC from human patients (10).
Cell culture
COV362 cells were purchased from Sigma and cultured in DMEM (GIBCO) containing 10% FBS (BenchMark). Cells were STR authenticated and tested for mycoplasma by the vendor through the European Collection of Authenticated Cell Cultures (ECACC). Cells were used within three months of receipt from the vendor and were passaged less than five times before use. Human Ovarian Surface Epithelial (HOSE) cells were purchased from ScienCell Research Laboratories and cultured in Ovarian Epithelial Cell Medium (ScienCell Research Laboratories). All cells were maintained at 37 °C in a humidified incubator at 5% CO2.
Infection and preparation of ferroportin-expressing Ftt and COV362 cells
Human FPN cDNA was amplified using Open Biosystem clone 4823308 (primers shown in Suppl. Table 1) and introduced into the lentiviral tetracycline (tet) inducible vector pLVX-TetOne-Puro (Takara-Clontech, Mountain View, CA). Lentivirus particles were produced by transient cotransfection of the FPN tet-on expression vector and packaging vectors (VSVG, pMDLG, and RSV-REV) into 293T cells (46 ). Viral particles containing control empty vector were prepared similarly. COV362 cells were transduced with viral particles in the presence of 4 μg/ml polybrene (Millipore, Billerica, MA, USA). Infected cells were selected with puromycin (2 μg/ml). Mutant FPN (A77D) (27) was generated by site-directed mutagenesis (46) of wild-type FPN and cloned into the pLVX-TetOne-Puro vector. The mutation was authenticated by DNA sequencing.
Knock down of IRB2 in Ftt cells
IRP2 knockdown was performed using lentiviral shRNAs as described (17).
Real-time RTPCR
Briefly, 200 – 400 ng of RNA was reverse transcribed in a total volume of 50 μl with a reverse transcription reagents kit (Applied Biosystems). To make a standard curve, serial dilutions of RNA from one sample were added to the RT reaction. Aliquots (2 μl) of cDNA were added to a 18 μl reaction mixture containing 10 μl of 2× SYBR® Green PCR Master Mix (BioRad) and 400 nm primers. Absence of DNA contamination was confirmed by performing PCR from cDNA without reverse transcriptase. Primers used for each gene are provided in Supplemental Table 1.
Western blot
Cells were lysed with NP-40 lysis buffer (25 mM tris (pH 7.4), 1% Triton X-100, 1% SDS, 1% sodium deoxy-cholate, 150 mM NaCl, aprotinin (2 μg/ml), 1 mM phenylmethylsulfonyl fluoride) containing complete protease inhibitor cocktail (Roche Diagnostics). Samples were separated by SDS–polyacrylamide gel electrophoresis and transferred to nitrocellulose membranes before being incubated with primary and secondary antibodies. Bands were detected using chemiluminescence (Thermo Scientific). Membranes were probed with antibodies to β-actin (Sigma, Cat# A3854 ), ferroportin (Novus Biologicals, cat# NBP121502 ), transferrin receptor1 (Invitrogen, cat# 13-6890), IRP2 (Santa Cruz, cat# sc-33682), ferritin H (17), p-STAT3 (cell Signaling, cat# 9131S) and STAT3 (cell Signaling, cat#4904S ). Western blots were quantified using ImageJ software.
IL6 ELISA
Cells were seeded in a six well plated in growth media for 24 hours. Conditioned media was collected and viable cells counted. IL6 secretion was measured using a Quantikine IL6 ELISA kit from R & D systems. ELISA results were normalized to number of viable cells at the time of collection of media.
Cell Invasion assay
Cell invasion was conducted by Cultrex® BME Cell Invasion Assay kit by Trevigen in a 96 well plate with or without basement membrane extract (BME) coating on the inserts as per manufacturer’s instructions. Because FPN affects cell proliferation, we corrected for cell number by comparing the number of cells that invaded through basement membrane protein to those that migrated through an uncoated 8 micron porous membrane.
Labile iron pool (LIP Assay)
Calcein acetoxymethyl ester (CA-AM) was obtained from Molecular Probes. The iron chelator, isonicotinoyl salicylaldehyde hydrazone (SIH) (a gift from Dr. P. Ponka, Lady Davis Institute for Medical Research, Montreal, Canada) was prepared as a 50 mM stock solution in dimethyl sulfoxide (DMSO). Briefly, 25,000 – 50,000 cells were cultured in 96-well plates (Black with Clear Bottom purchased from Coring) overnight. Cells were loaded with 2 μM CA-AM for 15 to 30 minutes at 37°C, and then washed with PBS. 100 μM starch-conjugated desferrioxamine (DFO; a generous gift of Biomedical Frontiers, Inc., Minneapolis, MN) was added to cells to remove extracellular iron. Fluorescence was measured at 485 nm excitation and 535 nm emission with a fluorescence plate reader (BioTek Synergy 2). After the fluorescence signal was stabilized, SIH was added at a final concentration of 10 μM to remove iron from calcein, causing dequenching. The change in fluorescence following the addition of SIH (ΔF) was used as an indirect measure of the labile iron pool.
Cell viability
3 × 10³ cells were seeded in 96 well plates and treated with either deferoxamine mesylate (Sigma), erastin (Selleckchem), or ferrostatin-1 (Selleckchem). Cell viability was assessed at 24–72 hours post-treatment using Cell Titer 96 Aqueous (Promega, Madison, WI, USA). For colony forming assays COV362 cells stably transfected with empty vector (VEC), ferroportin (FPN), or mutant ferroportin (Mutant FPN) were treated with and without doxycycline (0.5 μg/ml) and colony formation was analyzed by crystal violet staining. Colonies from three replicate wells were counted and quantified.
Immunohistochemistry
Paraffin-embedded formalin-fixed (PEFF) slides of de-identified human tissues obtained from HGSOC (10 subjects), low grade serous ovarian cancer (10 subjects), STIC (6 subjects), normal oviduct (10 subjects), and normal ovary (10 subjects) were collected from the biorepository of UCHC (IRB IE-08-310-1). Tissues were immunostained with antibodies to human transferrin receptor1 (Invitrogen, cat# 13-6890), ferroportin (47), IRP2 (LSBio, LS-B675 ), ferrtitin H (17), and ferritin L (Abcam, cat# ab69090 ), cytokeratin 7 (abcam, cat# ab9021) and Pax 8 (proteintech, cat# 10336-1-AP ). Relevant IgGs were used as negative controls. Images were acquired using a Zeiss Axio Scan Z1. Images of three to four random fields per slide were taken with 40X objectives using Zeiss Axio Imager A.2 and quantified using the DAB application in the open source Fiji software (ImageJ) was used. Reciprocal intensity was measured by subtracting the mean intensity of the stained area of interest from the maximum intensity (48). For each protein, overall differences in staining intensity between groups were calculated using one way ANOVA and individual comparisons were performed using one tailed t-tests. Variance of individual datapoints is shown in the graphs.
Immunofluorescent staining of cells
Cells were plated in 8-chamber slides (BD Falcon) and incubated with anti-human ferroportin antibody (47) or anti-human transferrin receptor antibody (Invitrogen, cat# 13-6890). Rodamine-Red (Jackson ImmunoResearch, cat# 109-297-003), Alexa fluor 488 (Invitrogen, cat# A11029), and Alexa Fluor 555-conjugated ( Invitrogen, cat# A21429)secondary antibodies were used. Slides were mounted with ProLong Gold anti-fade reagent (Invitrogen). Images were acquired using inverted microscopy (Zeiss Axio Vert.A1).
Animal Ethics Statement
All animal studies were conducted in accordance with the recommendations in the Guide for the Care and Use of Laboratory Animals of the Association for the Assessment and Accreditation of Laboratory Animal Care International (AAALAC). The experiment protocol was approved by the Institutional Animal Care and Use Committee (IACUC) at the University of Connecticut Health Center (protocol # 100881).
Animal Experiments
Female NOD.Cg-Prkdcscid Il2rgtm1Wjl/SzJ mice (NSG; ~ 6 weeks of age) were obtained from Jackson Laboratory. 105 FTt cells containing either the FPN tet-on vector or empty vector were injected intraperitoneally (i.p) (n=10/group). FPN was induced in xenografts by adding 2 mg/ml doxycycline to the drinking water and mice were euthanized after 4 weeks. Group size was based on power calculations and was designed to provide 80% power to detect an effect size of 0.5 gm difference in tumor mass using two-sided t-tests. One control mouse died for unknown reasons during the course of the experiment, thus final group sizes were n=10 for FPN-tet-on and n=9 for empty vector. No surviving mice were excluded from the analysis. For erastin treatment, mice were treated with 20 mg/kg Erastin in 2% DMSO/PBS or vehicle alone beginning one day after tumor cell injection. Treatment was continued at five doses per week for 18 days before mice were sacrificed. Tumors were counted and the weight of all tumors found within the abdomen of each mouse was measured. Planned group size for this experiment was n=10; however, a significant difference in tumor size was observed in a pilot experiment using n=6/group; thus, the planned group size of 10 was not used. A control mouse also died of unknown causes in this experiment; thus final group sizes were n=6 for erastin treatment and n=5 for vehicle control. No surviving mice were excluded from the analysis. Mice were not randomized before allocation into control and treatment groups. Outcome assessments were performed by two unblinded investigators. Differences were calculated using two-tailed unpaired Student t-tests on data that were normally distributed and of equal variance.
Statistical analysis of cell culture experiments
Statistical analyses were performed using Excel or Prism 6 (Graphpad software). All experiments were performed at least three times using a minimum of three replicates/condition in each experiment. Results of representative experiments are shown in the figures. Comparison tests were performed between two groups and statistical significance assessed using two-tailed unpaired Student’s t tests. Statistics are reported as the mean ± standard deviation. Error bars represent standard deviation.
Supplementary Material
Acknowledgments
Supported in part by NIH grants R01 CA188025 (S.V.T) and R01 CA171101 (F.M.T). We thank Tara L. Arvedson (Amgen, Thousand Oaks CA) for a generous gift of anti-ferroportin antibody.
Footnotes
Conflict of interest statement. The authors declare no conflict of interest.
References
- 1.A snapshot of ovarian cancer. [cited 2015 December 21 2015]. Available from: http://www.cancer.gov/research/progress/snapshots/ovarian.
- 2.Vang R, Shih Ie M, Kurman RJ. Ovarian low-grade and high-grade serous carcinoma: pathogenesis, clinicopathologic and molecular biologic features, and diagnostic problems. Adv Anat Pathol. 2009 Sep;16(5):267–82. doi: 10.1097/PAP.0b013e3181b4fffa. Epub 2009/08/25. eng. [DOI] [PMC free article] [PubMed] [Google Scholar]
- 3.Leong HS, Galletta L, Etemadmoghadam D, George J, Kobel M, Ramus SJ, et al. Efficient molecular subtype classification of high-grade serous ovarian cancer. J Pathol. 2015 Jul;236(3):272–7. doi: 10.1002/path.4536. Epub 2015/03/27. eng. [DOI] [PubMed] [Google Scholar]
- 4.Tothill RW, Tinker AV, George J, Brown R, Fox SB, Lade S, et al. Novel molecular subtypes of serous and endometrioid ovarian cancer linked to clinical outcome. Clin Cancer Res. 2008 Aug 15;14(16):5198–208. doi: 10.1158/1078-0432.CCR-08-0196. Epub 2008/08/14. eng. [DOI] [PubMed] [Google Scholar]
- 5.Lengyel E. Ovarian cancer development and metastasis. Am J Pathol. 2010 Sep;177(3):1053–64. doi: 10.2353/ajpath.2010.100105. Epub 2010/07/24. eng. [DOI] [PMC free article] [PubMed] [Google Scholar]
- 6.Landen CN, Jr, Goodman B, Katre AA, Steg AD, Nick AM, Stone RL, et al. Targeting aldehyde dehydrogenase cancer stem cells in ovarian cancer. Mol Cancer Ther. 2010 Dec;9(12):3186–99. doi: 10.1158/1535-7163.MCT-10-0563. Epub 2010/10/05. eng. [DOI] [PMC free article] [PubMed] [Google Scholar]
- 7.Silva IA, Bai S, McLean K, Yang K, Griffith K, Thomas D, et al. Aldehyde dehydrogenase in combination with CD133 defines angiogenic ovarian cancer stem cells that portend poor patient survival. Cancer Res. 2011 Jun 1;71(11):3991–4001. doi: 10.1158/0008-5472.CAN-10-3175. Epub 2011/04/19. eng. [DOI] [PMC free article] [PubMed] [Google Scholar]
- 8.Karst AM, Drapkin R. Ovarian cancer pathogenesis: a model in evolution. J Oncol. 2010;2010:932371. doi: 10.1155/2010/932371. [DOI] [PMC free article] [PubMed] [Google Scholar]
- 9.Ng A, Barker N. Ovary and fimbrial stem cells: biology, niche and cancer origins. Nat Rev Mol Cell Biol. 2015 Oct;16(10):625–38. doi: 10.1038/nrm4056. [DOI] [PubMed] [Google Scholar]
- 10.Yamamoto Y, Ning G, Howitt BE, Mehra K, Wu L, Wang X, et al. In vitro and in vivo correlates of physiological and neoplastic human Fallopian tube stem cells. J Pathol. 2016 Mar;238(4):519–30. doi: 10.1002/path.4649. Epub 2015/09/29. eng. [DOI] [PMC free article] [PubMed] [Google Scholar]
- 11.Torti SV, Torti FM. Iron and cancer: more ore to be mined. Nat Rev Cancer. 2013 May;13(5):342–55. doi: 10.1038/nrc3495. [DOI] [PMC free article] [PubMed] [Google Scholar]
- 12.Torti SV, Torti FM. Ironing out cancer. Cancer Res. 2011 Mar 1;71(5):1511–4. doi: 10.1158/0008-5472.CAN-10-3614. [DOI] [PMC free article] [PubMed] [Google Scholar]
- 13.Dolma S, Lessnick SL, Hahn WC, Stockwell BR. Identification of genotype-selective antitumor agents using synthetic lethal chemical screening in engineered human tumor cells. Cancer Cell. 2003 Mar;3(3):285–96. doi: 10.1016/s1535-6108(03)00050-3. [DOI] [PubMed] [Google Scholar]
- 14.Li HX, Lu ZH, Shen K, Cheng WJ, Malpica A, Zhang J, et al. Advances in serous tubal intraepithelial carcinoma: correlation with high grade serous carcinoma and ovarian carcinogenesis. Int J Clin Exp Pathol. 2014;7(3):848–57. [PMC free article] [PubMed] [Google Scholar]
- 15.Kurman RJ. Origin and molecular pathogenesis of ovarian high-grade serous carcinoma. Ann Oncol. 2013 Dec;24(Suppl 10):x16–21. doi: 10.1093/annonc/mdt463. [DOI] [PubMed] [Google Scholar]
- 16.Dietl J. Revisiting the pathogenesis of ovarian cancer: the central role of the fallopian tube. Arch Gynecol Obstet. 2014 Feb;289(2):241–6. doi: 10.1007/s00404-013-3041-3. [DOI] [PubMed] [Google Scholar]
- 17.Wang W, Deng Z, Hatcher H, Miller LD, Di X, Tesfay L, et al. IRP2 regulates breast tumor growth. Cancer Res. 2014 Jan 15;74(2):497–507. doi: 10.1158/0008-5472.CAN-13-1224. [DOI] [PMC free article] [PubMed] [Google Scholar]
- 18.Gershenson DM. The life and times of low-grade serous carcinoma of the ovary. Am Soc Clin Oncol Educ Book. 2013 doi: 10.14694/EdBook_AM.2013.33.e195. [DOI] [PubMed] [Google Scholar]
- 19.Torti FM, Torti SV. Regulation of ferritin genes and protein. Blood. 2002 May 15;99(10):3505–16. doi: 10.1182/blood.v99.10.3505. [DOI] [PubMed] [Google Scholar]
- 20.Baba T, Convery PA, Matsumura N, Whitaker RS, Kondoh E, Perry T, et al. Epigenetic regulation of CD133 and tumorigenicity of CD133+ ovarian cancer cells. Oncogene. 2009 Jan 15;28(2):209–18. doi: 10.1038/onc.2008.374. Epub 2008/10/07. eng. [DOI] [PubMed] [Google Scholar]
- 21.Kurrey NK, Jalgaonkar SP, Joglekar AV, Ghanate AD, Chaskar PD, Doiphode RY, et al. Snail and slug mediate radioresistance and chemoresistance by antagonizing p53-mediated apoptosis and acquiring a stem-like phenotype in ovarian cancer cells. Stem Cells. 2009 Sep;27(9):2059–68. doi: 10.1002/stem.154. Epub 2009/06/23. eng. [DOI] [PubMed] [Google Scholar]
- 22.Ning G, Bijron JG, Yamamoto Y, Wang X, Howitt BE, Herfs M, et al. The PAX2-null immunophenotype defines multiple lineages with common expression signatures in benign and neoplastic oviductal epithelium. J Pathol. 2014 Dec;234(4):478–87. doi: 10.1002/path.4417. [DOI] [PMC free article] [PubMed] [Google Scholar]
- 23.Baker VV, Borst MP, Dixon D, Hatch KD, Shingleton HM, Miller D. c-myc amplification in ovarian cancer. Gynecol Oncol. 1990 Sep;38(3):340–2. doi: 10.1016/0090-8258(90)90069-w. Epub 1990/09/01. eng. [DOI] [PubMed] [Google Scholar]
- 24.Ahmed AA, Etemadmoghadam D, Temple J, Lynch AG, Riad M, Sharma R, et al. Driver mutations in TP53 are ubiquitous in high grade serous carcinoma of the ovary. J Pathol. 2010 May;221(1):49–56. doi: 10.1002/path.2696. Epub 2010/03/17. eng. [DOI] [PMC free article] [PubMed] [Google Scholar]
- 25.Manz DH, Blanchette N, Paul B, Torti FM, Torti SV. Iron and Cancer: recent insights. Annals of the New York Academy of Sciences. 2016 doi: 10.1111/nyas.13008. in press. [DOI] [PMC free article] [PubMed] [Google Scholar]
- 26.Domcke S, Sinha R, Levine DA, Sander C, Schultz N. Evaluating cell lines as tumour models by comparison of genomic profiles. Nature communications. 2013;4:2126. doi: 10.1038/ncomms3126. [DOI] [PMC free article] [PubMed] [Google Scholar]
- 27.Schimanski LM, Drakesmith H, Merryweather-Clarke AT, Viprakasit V, Edwards JP, Sweetland E, et al. In vitro functional analysis of human ferroportin (FPN) and hemochromatosis-associated FPN mutations. Blood. 2005 May 15;105(10):4096–102. doi: 10.1182/blood-2004-11-4502. [DOI] [PubMed] [Google Scholar]
- 28.Liu XB, Yang F, Haile DJ. Functional consequences of ferroportin 1 mutations. Blood cells, molecules & diseases. 2005 Jul-Aug;35(1):33–46. doi: 10.1016/j.bcmd.2005.04.005. [DOI] [PubMed] [Google Scholar]
- 29.Bast RC, Jr, Hennessy B, Mills GB. The biology of ovarian cancer: new opportunities for translation. Nat Rev Cancer. 2009 Jun;9(6):415–28. doi: 10.1038/nrc2644. [DOI] [PMC free article] [PubMed] [Google Scholar]
- 30.Coward J, Kulbe H, Chakravarty P, Leader D, Vassileva V, Leinster DA, et al. Interleukin-6 as a therapeutic target in human ovarian cancer. Clin Cancer Res. 2011 Sep 15;17(18):6083–96. doi: 10.1158/1078-0432.CCR-11-0945. [DOI] [PMC free article] [PubMed] [Google Scholar]
- 31.Dixon SJ, Lemberg KM, Lamprecht MR, Skouta R, Zaitsev EM, Gleason CE, et al. Ferroptosis: an iron-dependent form of nonapoptotic cell death. Cell. 2012 May 25;149(5):1060–72. doi: 10.1016/j.cell.2012.03.042. [DOI] [PMC free article] [PubMed] [Google Scholar]
- 32.Dixon SJ, Stockwell BR. The role of iron and reactive oxygen species in cell death. Nat Chem Biol. 2014 Jan;10(1):9–17. doi: 10.1038/nchembio.1416. Epub 2013/12/19. eng. [DOI] [PubMed] [Google Scholar]
- 33.Karst AM, Levanon K, Drapkin R. Modeling high-grade serous ovarian carcinogenesis from the fallopian tube. Proc Natl Acad Sci U S A. 2011 May 3;108(18):7547–52. doi: 10.1073/pnas.1017300108. [DOI] [PMC free article] [PubMed] [Google Scholar]
- 34.Miller LD, Coffman LG, Chou JW, Black MA, Bergh J, D’Agostino R, Jr, et al. An iron regulatory gene signature predicts outcome in breast cancer. Cancer Res. 2011 Nov 1;71(21):6728–37. doi: 10.1158/0008-5472.CAN-11-1870. [DOI] [PMC free article] [PubMed] [Google Scholar]
- 35.Pinnix ZK, Miller LD, Wang W, D’Agostino R, Jr, Kute T, Willingham MC, et al. Ferroportin and iron regulation in breast cancer progression and prognosis. Sci Transl Med. 2010 Aug 4;2(43):43ra56. doi: 10.1126/scisignal.3001127. [DOI] [PMC free article] [PubMed] [Google Scholar]
- 36.Schonberg DL, Miller TE, Wu Q, Flavahan WA, Das NK, Hale JS, et al. Preferential Iron Trafficking Characterizes Glioblastoma Stem-like Cells. Cancer Cell. 2015 Oct 12;28(4):441–55. doi: 10.1016/j.ccell.2015.09.002. Epub 2015/10/16. eng. [DOI] [PMC free article] [PubMed] [Google Scholar]
- 37.Tesfay L, Clausen KA, Kim JW, Hegde P, Wang X, Miller LD, et al. Hepcidin regulation in prostate and its disruption in prostate cancer. Cancer Res. 2015 Jun 1;75(11):2254–63. doi: 10.1158/0008-5472.CAN-14-2465. [DOI] [PMC free article] [PubMed] [Google Scholar]
- 38.Dijkgraaf EM, Welters MJ, Nortier JW, van der Burg SH, Kroep JR. Interleukin-6/interleukin-6 receptor pathway as a new therapy target in epithelial ovarian cancer. Curr Pharm Des. 2012;18(25):3816–27. doi: 10.2174/138161212802002797. [DOI] [PubMed] [Google Scholar]
- 39.Zou M, Zhang X, Xu C. IL6-induced metastasis modulators p-STAT3, MMP-2 and MMP-9 are targets of 3,3′-diindolylmethane in ovarian cancer cells. Cell Oncol (Dordr) 2015 Oct 28; doi: 10.1007/s13402-015-0251-7. [DOI] [PubMed] [Google Scholar]
- 40.Lui GY, Kovacevic Z, SVM, Kalinowski DS, Merlot AM, Sahni S, et al. Novel thiosemicarbazones regulate the signal transducer and activator of transcription 3 (STAT3) pathway: inhibition of constitutive and interleukin 6-induced activation by iron depletion. Mol Pharmacol. 2015;87(3):543–60. doi: 10.1124/mol.114.096529. [DOI] [PubMed] [Google Scholar]
- 41.Dai J, Huang C, Wu J, Yang C, Frenkel K, Huang X. Iron-induced interleukin-6 gene expression: possible mediation through the extracellular signal-regulated kinase and p38 mitogen-activated protein kinase pathways. Toxicology. 2004 Oct 15;203(1–3):199–209. doi: 10.1016/j.tox.2004.06.009. [DOI] [PubMed] [Google Scholar]
- 42.Reed JC, Pellecchia M. Ironing out cell death mechanisms. Cell. 2012 May 25;149(5):963–5. doi: 10.1016/j.cell.2012.05.009. [DOI] [PubMed] [Google Scholar]
- 43.Yang WS, SriRamaratnam R, Welsch ME, Shimada K, Skouta R, Viswanathan VS, et al. Regulation of ferroptotic cancer cell death by GPX4. Cell. 2014 Jan 16;156(1–2):317–31. doi: 10.1016/j.cell.2013.12.010. [DOI] [PMC free article] [PubMed] [Google Scholar]
- 44.Yang WS, Stockwell BR. Ferroptosis: Death by Lipid Peroxidation. Trends Cell Biol. 2015 Dec 2; doi: 10.1016/j.tcb.2015.10.014. Epub 2015/12/15. Eng. [DOI] [PMC free article] [PubMed] [Google Scholar]
- 45.Shah MM, Landen CN. Ovarian cancer stem cells: are they real and why are they important? Gynecol Oncol. 2014 Feb;132(2):483–9. doi: 10.1016/j.ygyno.2013.12.001. [DOI] [PMC free article] [PubMed] [Google Scholar]
- 46.Deng Z, Wan M, Sui G. PIASy-mediated sumoylation of Yin Yang 1 depends on their interaction but not the RING finger. Molecular and cellular biology. 2007 May;27(10):3780–92. doi: 10.1128/MCB.01761-06. [DOI] [PMC free article] [PubMed] [Google Scholar]
- 47.Ross SL, Tran L, Winters A, Lee KJ, Plewa C, Foltz I, et al. Molecular mechanism of hepcidin-mediated ferroportin internalization requires ferroportin lysines, not tyrosines or JAK-STAT. Cell metabolism. 2012 Jun 06;15(6):905–17. doi: 10.1016/j.cmet.2012.03.017. [DOI] [PubMed] [Google Scholar]
- 48.Nguyen DH, Zhou T, Shu J, Mao J. Quantifying chroogen intensity in immunohistochemistry via reciprocal intensity. CancerInCytes. 2013;2(1:e) [Google Scholar]
Associated Data
This section collects any data citations, data availability statements, or supplementary materials included in this article.


