Abstract
Fourier transform infrared (FT-IR) microscopy was used to image tissue samples from twenty patients diagnosed with thyroid carcinoma. The spectral data were then used to differentiate between follicular thyroid carcinoma and follicular variant of papillary thyroid carcinoma using principle component analysis coupled with linear discriminant analysis and a Naïve Bayesian classifier operating on a set of computed spectral metrics. Classification of patients’ disease type was accomplished by using average spectra from a wide region containing follicular cells, colloid, and fibrosis; however, classification of disease state at the pixel level was only possible when the extracted spectra were limited to follicular epithelial cells in the samples, excluding the relatively uninformative areas of fibrosis. The results demonstrate the potential of FT-IR microscopy as a tool to assist in the difficult diagnosis of these subtypes of thyroid cancer, and also highlights the importance of selectively and separately analyzing spectral information from different features of a tissue of interest.
Keywords: Fourier transform infrared microscopy, Thyroid carcinoma
1. Introduction
1.1. Biology of thyroid carcinoma
The thyroid is one of the largest endocrine glands in the body, and is responsible for the production of thyroxine (T4) and triiodothyronine (T3), collectively known as thyroid hormone (TH). Through the secretion of TH, the gland modulates the metabolic activity of a diverse array of tissues, increasing oxygen consumption, glucose catabolism, and breakdown of fatty acids in the liver for the synthesis of cholesterol, and these functions are required for maintaining health. The production of TH in the gland occurs at the level of the follicle, the functional unit of thyroid tissue that consist of a thin layer of epithelial cells, designated as follicular cells, surrounding a colloid-filled lumen. These follicular cells are central to the proper endocrine function of the thyroid, and are also affected in a number of thyroid-specific diseases, including cancer.
Carcinoma of the thyroid is the most common endocrine malignancy, accounting for the majority of endocrine cancer-related deaths, and its incidence is on the rise (perhaps due to improved imaging techniques); in 2016 it is estimated that thyroid cancer will account for 3.8% of all new cancer diagnoses in the United States [1]. As is the case with many cancers, early and accurate diagnosis while avoiding over-diagnosis is critical. Diagnosis includes identification of the carcinoma subtype; the two major classes are papillary thyroid carcinoma (PTC, >85% of cases) and follicular thyroid carcinoma (FTCA, 5%–15% of cases) [2].
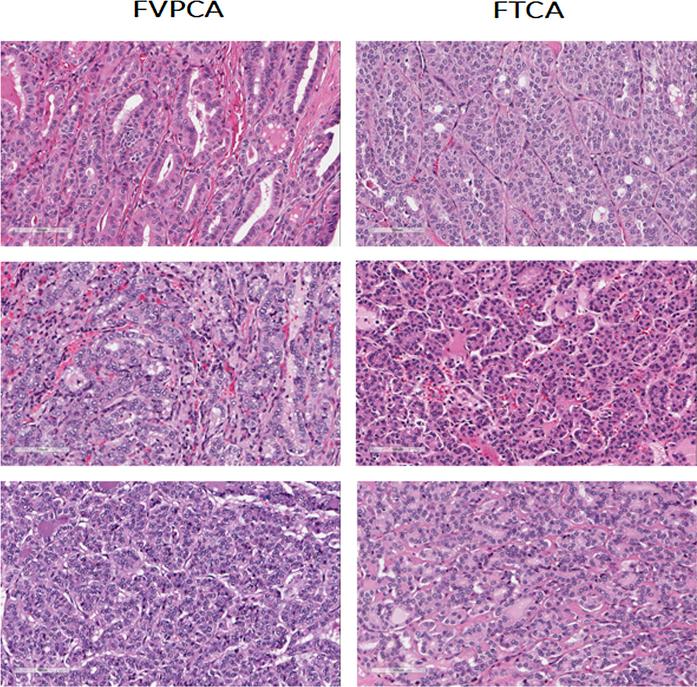
Diagnosis is made by cytological analysis of a fine needle aspirate ordered by a clinician when a malignancy is suspected; however, sensitivity depends on the skill of the technician [3,4]. The presence of thyroid carcinoma is confirmed by a pathologist examining a hematoxylin-and-eosin stained section of a thyroid tissue sample under a light microscope (Fig. 1). The stain allows for distinction of the different components of the diseased tissue, such as follicular cells, fibrosis, and colloid, allowing a trained observer to notice changes in the tissue architecture that may be indicative of disease. In cases where thyroid carcinoma is confirmed, surgical treatment course is either partial (lobectomy) or complete thyroidectomy. Postoperative management varies according to type of carcinoma diagnosed and risk of recurrence estimate.
Fig. 1.
Hematoxylin & eosin stained tissue sections of follicular variant of papillary thyroid carcinoma (FVPCA) and follicular thyroid carcinoma (FTCA), demonstrating the morphological mimicry displayed by FVPCA.
An important limitation in the current diagnostic approach lies in distinguishing FTCA from a special subtype of thyroid carcinoma known as follicular variant of papillary carcinoma (FVPCA). Since its characterization in 1960, there has been much debate and uncertainty concerning the diagnosis of FVPCA, largely due to its morphological mimicry of FTCA [5–7]. FVPCA exhibits a predominantly follicular architecture, while lacking many of the keystone nuclear features necessary to make a PTC diagnosis [5]. However, though its histology mimics that of FTCA (Fig. 1), clinically FVPCA behaves similarly to PTC [8], a tumor that has better survival. The challenge in making a definitive FVPCA diagnosis is further exacerbated by poor inter-reader reliability (one study found only 39% concordance between ten experienced pathologists diagnosing FVPCA vs. FTCA) [5]. Thus it is important to find a supportive method which can improve the diagnosis of this challenging entity, especially as it may help avoid unnecessary total thyroidectomy or secondary surgery [4,8].
1.2. FT-IR tissue imaging
Mid-infrared imaging is a promising tool for deriving chemical information from the tissue samples traditionally used in histopathology. Fourier transform infrared (FT-IR) microscopy applied to tissue imaging uses the unique absorption spectra from the biochemical constituents of a sample to detect changes in key tissue components such as nucleic acids, glycogen, collagen, and other proteins that are indicative of disease processes. By combining this spectral information with the spatial information from microscopy, biochemical changes in different tissue features can be selectively analyzed, rather than collecting spectra averaged indeterminately from diverse tissue components. This process allows the technique to provide insight into diagnosis and disease prognosis. Importantly, FT-IR imaging requires no labels or dyes, and fits into the current clinical workflow in pathology laboratories due to its compatibility with traditional frozen and formalin-fixed paraffin-embedded samples. However, the latter class of samples must be dewaxed, which can be readily conducted according to established protocols [9].
This compatibility means that FT-IR microscopy is well suited to study the spectral and structural features of thyroid carcinomas. A number of recent articles have covered using FT-IR imaging for tissue diagnostics in detail, with some preliminary work exploring thyroid tissue [9–11]. The technique holds promise as an adjunct tool to traditional histopathology for exploring the differences between FTCA and FVPCA. This work investigates the capability of FT-IR to distinguish between these disease types as well as the relative diagnostic value of different components of thyroid tissue in making that distinction.
2. Materials and methods
2.1. Tissue samples
Twenty formalin-fixed paraffin-embedded tissue samples from thyroid lobectomies or total thyroidectomies were obtained from the University of Illinois at Chicago Biorepository. Ten patient samples were diagnosed with FTCA and ten were diagnosed with FVPCA based on the consensus of 3 pathologists (A. K.-B., C. E., and M. S.-S.) who examined H&E stained tissue sections that were imaged using the Aperio ScanScope CS system (Leica Biosystems, Nussloch, Germany). Samples were then sectioned with a microtome at 4 μm thickness and mounted onto IR-reflective low-emissivity glass slides (Kevley Technologies, Chesterland, OH). Prior to scanning, tissue sections were deparaffinized using two five-minute soaks in xylene followed by a five-minute soak in ethanol [9].
2.2. FT-IR imaging
The deparaffinized samples were scanned in reflectance mode on an Agilent Cary 600 series FT-IR microscope system (Santa Clara, CA) using the 15× objective for an effective pixel size of 5.5 × 5.5 μm. Spectra were acquired by averaging 8 co-scans in the range from 3850 cm−1 to 900 cm−1 with a spectral resolution of 4 cm−1.
2.3. Data processing
The acquired FT-IR data was processed using the ENVI-IDL software package. Linear baseline correction was performed on all samples. All regions of interest (ROIs) that were used were drawn manually on the IR image using the adjacent H&E-stained sections as a guide. The data were then used for analysis and classification both as average spectra corresponding to each patient and as spectra corresponding to individual pixels. Average spectra from each patient's ROIs were extracted, normalized to the absorbance at 1651 cm−1, and exported to the Origin software package for analysis with principle component analysis (PCA) and linear discriminant analysis (LDA). A separate validation data set was not used for the LDA analysis; but the number of principal components was limited to avoid overfitting [12].
For pixel-based classification, the patients were split into a training group with 7 representatives of each disease subtype and a validation group with 3 of each disease subtype. The spectral data were converted to a set of 152 pre-defined metrics corresponding to spectral characteristics such as peak height ratios, normal areas, peak area ratios, and centers of gravity [13]. The training data were then exported for use with an algorithm in MATLAB to select metrics best suited to distinguishing between the disease states, and used to train a Naïve Bayesian classifier. The selected metrics were then computed on the validation data, and the resulting metric data was used to validate the classifier.
3. Results and discussion
3.1. Gross ROIs
3.1.1. Approach 1 (analysis of averaged spectra)
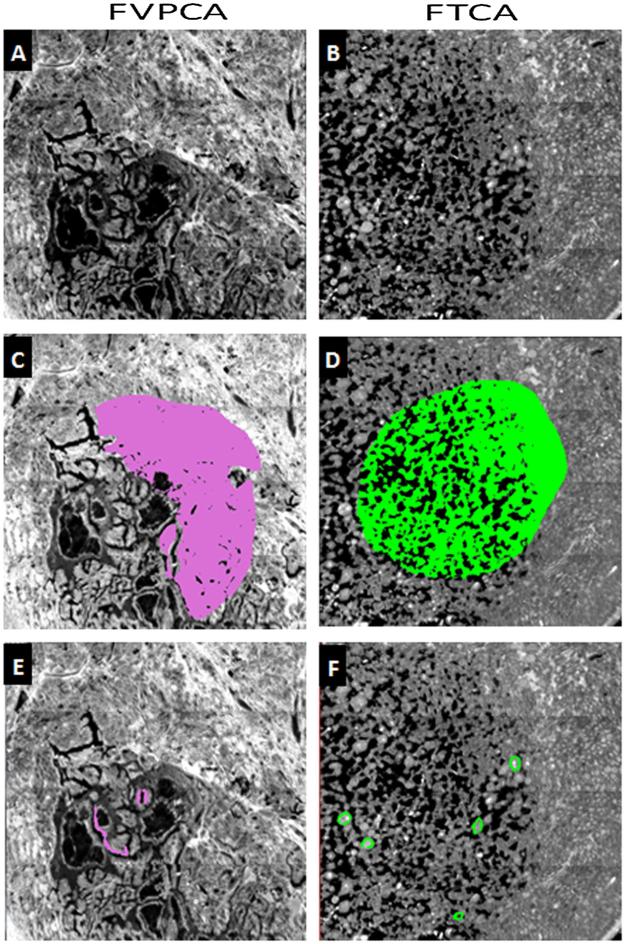
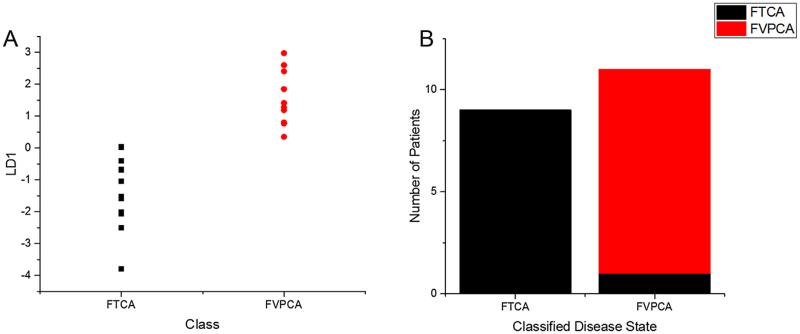
Initial analysis was conducted on spectra acquired from gross ROIs, encompassing large areas of thyroid tissue. The areas selected were rich in follicular epithelium, but also contained significant amounts of fibrosis, colloid, and lymphocytes (Fig. 2). Using each patient's averaged ROI spectrum as an individual data point, it was possible to distinguish between FVPCA and FTCA using PCA-LDA, with only a single patient being misclassified (Fig. 3). The clear separation of disease subtypes suggested the presence of unique spectral differences from the averaged tissue spectra that differentiate these subtypes of thyroid carcinoma.
Fig. 2.
Thyroid tissue from FVPCA & FTCA, imaged with 15× objective, and a spatial resolution of 5.5 × 5.5 μm. (A) & (B): IR image of thyroid tissue using wavenumber 1651 cm−1. (C) & (D): IR image with gross ROIs. (E) & (F): IR image with refined ROIs.
Fig. 3.
Principal component analysis coupled with linear discriminant analysis for subtyping of thyroid carcinomas follicular variant of papillary carcinoma (FVPCA, n = 10) and follicular carcinoma (FTCA, n = 10), using averaged spectra collected from gross ROIs. (A) Linear discriminant 1 plotted against both classes. (B) Classification based on linear discriminant analysis shows one misclassification from FTCA.
3.1.2. Approach 2 (pixel-based analysis)
For the next phase of analysis, the dataset was probed at the pixel level (5.5 μm × 5.5 μm), through conversion to metrics, selection of a refined metric set, and classification with a Naïve Bayesian classifier. The purpose of this step was to investigate whether the spectral differences detected by PCA-LDA arose from biochemical features at the cellular level (follicular cells have a cross-section of approximately 8 μm × 14 μm), or from differences at an aggregate level that were the result of averaging spectra from multiple tissue components (e.g. follicular cells, fibrosis, or colloid) whose relative concentrations in thyroid tissue might differ between FTCA and FVPCA.
However, the results of this pixel-level classification failed to perform significantly better than random chance (data not shown). A random forest classifier using the principle components defined by the training data as metrics was similarly unable to accurately classify the pixels in the validation set (data not shown). This outcome indicated that the spectral differences harnessed by PCALDA to readily distinguish between the disease classes might not have arisen from spectral differences at the pixel level. In other words, the PCA-LDA results leading to accurate patient segregation were not the result of unique chemical signatures for the two diseases at a cellular level.
Instead, a difference in the relative sizes of areas of follicular cells and areas of fibrosis, when averaged into a single indiscriminate ROI, may have created a difference in the average spectra of patients with FVPCA and those with FTCA. While a spectral difference arising in this manner could potentially distinguish between the disease states, it is not as valuable as a spectral difference at the pixel level for a number of reasons. First, the heterogeneity of thyroid neoplasms could mean that the average spectrum would not be consistent when sampling different regions of a single patient's biopsy. Second, a spectral difference depending solely on the relative proportions of epithelium and fibrosis in a sample might be mimicked by other thyroid diseases that are similar only in the ratio of these two tissue components. Finally, this approach would ultimately offer limited insight into the biochemical disease processes at work in FTCA and FVPCA.
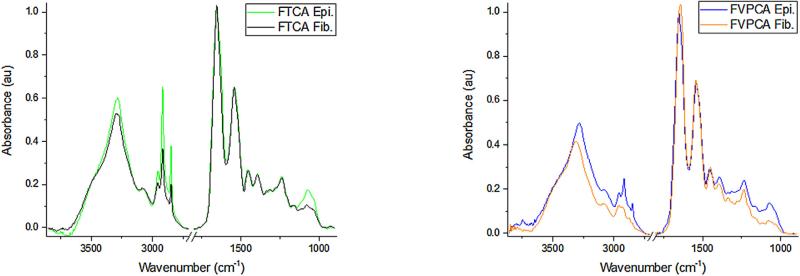
A more consistent pixel-level spectral signature for FTCA and FVPCA might be found in a particular component of thyroid tissue, specifically either the follicular cells or the areas of fibrosis. These tissue components have unique spectral signatures (Fig. 4) that may be affected differently by disease.
Fig. 4.
Averaged spectral signature of epithelium (Epi) and fibrosis (Fib) in FTCA (A) and FVPCA (B).
3.2. Refined ROIs
3.2.1. Approach 3 (independent pixel-based analysis of follicular cells and fibrosis)
In order to search for spectral differences specifically in follicular cells and fibrosis between the variants of thyroid carcinoma, a refined set of ROIs was drawn on the patient samples based on the adjacent H&E-stained sections. These ROIs selected regions of only epithelium and only fibrosis (Fig. 2). Using the same patients for training and validation as with the gross ROIs, a Naïve Bayesian classifier was built and tested in the same manner on the data from the follicular cells alone, this time with stronger results as seen in Fig. 5.
Fig. 5.
Area under the ROC curve analysis (AUC) of FVPCA and FTCA of 0.83, showing that a naïve Bayesian classifier successfully discriminated between both thyroid carcinoma subtypes on a separate validation tissue array.
Given the successful results of the classification on the validation set with an average AUC near 0.83 (accomplished using 7 spectral metrics, listed in Supplemental Table 1), it seems likely that the spectral information from the follicular cells can distinguish between FTCA and FVPCA. When a similar classifier was built to distinguish between the disease states on the basis of the fibrosis spectra alone, classification again failed to perform significantly better than chance. This suggests that the inclusion of fibrosis in the initial ROIs may have been responsible for the poor classification that was observed. This suggests the biochemical features of fibrosis does not lend themselves for discrimination between the two disease entities, and the inclusion of fibrosis in the initial ROIs may have been responsible for the poor classification observed.
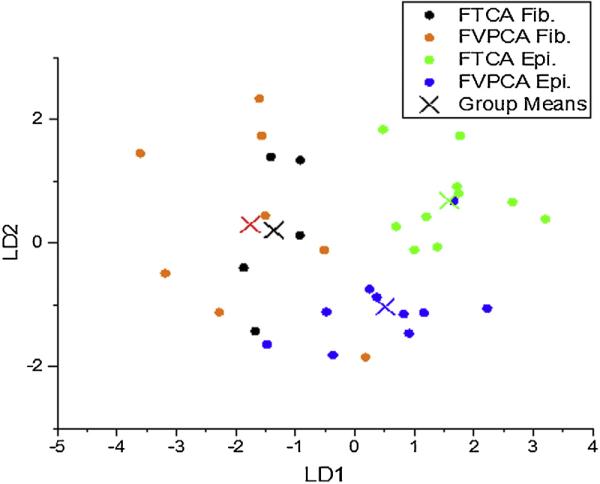
LDA analysis was used to further study the how patients with FTCA and FVPCA differed in terms of the spectra from their follicular cells and the spectra from fibrosis (Fig. 6). Principal components were carefully selected to avoid LDA overfitting [12]. The broad scattering of fibrosis seen in Fig. 6 supports the conclusion that fibrosis holds little diagnostic value for distinguishing between the two disease states studied here, as there was no clear grouping of fibrosis from patients with FTCA and those with FVPCA. The results for spectra from epithelium, however, show well-separated group means for patients with either carcinoma, and in addition, there is minimal overlap between the groups, with the exception of a single patient with FVPCA.
Fig. 6.
Linear discriminant analysis displayed good separation of epithelium derived from spectra between both thyroid carcinoma subtypes, while spectra acquired from regions of fibrosis is spread across carcinoma subtypes.
These results suggest that FT-IR is capable of distinguishing between FTCA and FVPCA when the follicular cells are selectively analyzed. At least for making this diagnosis, no value is seen at present in the spectra from fibrosis.
4. Conclusion
This study serves to demonstrate that FT-IR coupled with appropriate classification methods can discriminate between two subtypes of thyroid carcinoma, FVPCA and FTCA, based on spectral differences in follicular cells. This offers potential as a novel adjunct tool to the current histopathology approach to diagnosis, as this technique does not rely on subjective interpretation or the skills of a highly-trained pathologist. Given that our data was derived from a relatively small patient set, future efforts will look to incorporate a larger patient cohort for further validation, vary the amount of tissue probed per patient, integrate results of other techniques, and investigate further the biochemical differences that separate these and other types of thyroid carcinoma. These investigations may be able to identify specific spectral features to be used reproducibly across FT-IR systems and to form a standard basis for exploration and comparison across thyroid tissue sets, if possible. This may have great clinical relevance as new research contraindicates aggressive treatment for specific subtypes of FVPCA [7].
Furthermore, this work demonstrates the importance of careful ROI selection in spectral tissue imaging. Because these changes are specific to the epithelium, any classification approach must be judicious when selecting areas of interest, due to the differences between the epithelial and fibrotic components of the diseased tissue. The ability to select regions of only follicular cells is unique to imaging approaches, and also highlights the importance of fine spatial resolution. The diagnostic value of collected spectra depends on how specific they are to the cell type or tissue feature of interest. Therefore, any chemical imaging approach to study tissue must consider the tissue's architecture and the scale of its clinically relevant features with relation to the spatial resolution. Advances in FT-IR methods show the feasibility of distinguishing and selecting epithelial cells from other cells in a tissue without pathologist supervision [14].
Finally, although the regions of fibrosis in thyroid tissue demonstrated little value in discriminating between FTCA and FVPCA, they should not be dismissed as irrelevant targets of future investigation. While the thyroid carcinomas are fundamentally cancers of the follicular epithelial cells, the fibrosis is also an important part of the diseased tissue. Stroma may hold value as an important indicator of systemic changes and biochemical alterations which can inform the study of complex disease processes [15].
FT-IR microscopy holds promise as a tool for addressing issues in the field of pathology, both in thyroid and in other organs. In order to maximize the power of this technique, however, both the spatial and spectral elements must be combined with knowledge of tissue structure to selectively analyze the different features of the sample. With this kind of focused, efficient approach, many more of the diagnostic and prognostic possibilities of FT-IR tissue imaging can be realized.
Supplementary Material
Acknowledgments
This work was made possible by tissue samples from the University of Illinois Biorepository and histology and tissue imaging services from the UIC Research Resources Center. This work was supported by the National Institute of Diabetes and Digestive and Kidney Diseases [grant number R21DK103066].
Abbreviations
- FT-IR
fourier transform infrared
- FTCA
follicular thyroid carcinoma
- FVPCA
follicular variant of papillary carcinoma
- PTC
papillary thyroid carcinoma
- PCA
principle component analysis
- LDA
linear discriminant analysis
- TH
thyroid hormone
Footnotes
Appendix A. Supplementary data
Supplementary data associated with this article can be found, in the online version, at http://dx.doi.org/10.1016/j.vibspec.2016.09.014.
References
- 1.Siegel RL, Miller KD, Jemal A. Cancer statistics, 2016. CA: A Cancer J. Clin. 2016;66(1):7–30. doi: 10.3322/caac.21332. [DOI] [PubMed] [Google Scholar]
- 2.Kumar V, Abbas A, Fausto N, Aster J. Robbins and Cotran Pathologic Basis of Disease. 8th ed. Elsevier Inc.; Saunders: 2010. [Google Scholar]
- 3.Lin HS, Komisar A, Opher E, Blaugrund SM. Follicular variant of papillary carcinoma: the diagnostic limitations of preoperative fine–Needle aspiration and intraoperative frozen section evaluation. Laryngoscope. 2000;110(9):1431–1436. doi: 10.1097/00005537-200009000-00003. [DOI] [PubMed] [Google Scholar]
- 4.Pacini F, Schlumberger M, Dralle H, Elisei R, Smit JW, Wiersinga W. The European Thyroid Cancer Taskforce, European consensus for the management of patients with differentiated thyroid carcinoma of the follicular epithelium. Eur. J. Endocrinol. 2006;154:787–803. doi: 10.1530/eje.1.02158. [DOI] [PubMed] [Google Scholar]
- 5.Lloyd RV, Erickson L, Casey M, Lam K, Lohse C, Asa S, Chan J, DeLellis RA, Harach HR, Kakudo K, LiVolsi V, Rosai J, Sebo TJ, Sobrinho-Simoes M, Wenig BM, Lae ME. Observer variation in the diagnosis of follicular variant of papillary thyroid carcinoma. Am. J. Surg. Pathol. 2004;28(10):1336–1340. doi: 10.1097/01.pas.0000135519.34847.f6. [DOI] [PubMed] [Google Scholar]
- 6.Singhal S, Sippel RS, Chen H, Schneider DF. Distinguishing classical papillary thyroid microcancers from follicular–Variant microcancers. J. Surg. Res. 2014;190(1):151–156. doi: 10.1016/j.jss.2014.03.032. [DOI] [PMC free article] [PubMed] [Google Scholar]
- 7.Nikiforov YE, Seethala RR, Tallini G, Baloch ZW, Basolo F, Thompson LDR, Barletta JA, Wenig BM, Al Ghuzlan A, Kakudo K, Giordan TJ, Alves VA, Khanafshar E, Asa SL, El-Naggar AK, Gooding WE, Hodak SP, Lloyd RV, Maytal G, Mete O, Nikiforova MN, Nosé V, Papotti M, Poller DN, Sadow PM, Tischler AS, Tuttle RM, Wall KB, LiVolsi VA, Randolph GW, Ghossein RA. Nomenclature revision for encapsulated follicular variant of papillary thyroid carcinoma: a paradigm shift to reduce overtreatment of indolent tumors. JAMA Oncol. 2016 doi: 10.1001/jamaoncol.2016.0386. [DOI] [PMC free article] [PubMed] [Google Scholar]
- 8.Haugen BR, Alexander EK, Bible KC, Doherty GM, Mandel SJ, Nikiforov YE, Pacini F, Randolph GW, Sawka AM, Schlumberger M, Schuff KG, Sherman SI, Sosa JA, Steward DL, Tuttle RM, Wartofsky L. American thyroid association management guidelines for adult patients with thyroid nodules and differentiated thyroid cancer: the american thyroid association guidelines task force on thyroid nodules and differentiated thyroid cancer. Thyroid. 2015;26(1):1–133. doi: 10.1089/thy.2015.0020. 2016. [DOI] [PMC free article] [PubMed] [Google Scholar]
- 9.Baker MJ, Trevisan J, Bassan P, Bhargava R, Butler HJ, Dorling KM, Fielden PR, Fogarty SW, Fullwood NJ, Heys KA, Hughes C, Lasch P, Martin-Hirsch PL, Obinaju B, Sockalingum GD, Sulé-Suso J, Strong RJ, Walsh MJ, Wood BR, Gardner P, Martin FL. Using fourier transform IR spectroscopy to analyze biological materials. Nat. Protoc. 2014;9:1771–1791. doi: 10.1038/nprot.2014.110. [DOI] [PMC free article] [PubMed] [Google Scholar]
- 10.Zeng XT, Xu YZ, Zhang XQ, Xu Z, Zhang YF, Wu JG, Zhou XS, Ling XF. FTIR spectroscopic explorations of freshly resected thyroid malignant tissues. Guang Pu Xue Yu Guang Pu Fen Xi. 2007;27(12):2422–2426. [PubMed] [Google Scholar]
- 11.Pereira TM, Zezell DM, Bird B, Miljkovć M, Diem M. Characterization of normal thyroid tissue by micro-FTIR spectroscopy. Analyst. 2013;138:7094–7100. doi: 10.1039/c3an00296a. [DOI] [PubMed] [Google Scholar]
- 12.Kelly JG, Trevisan J, Scott AD, Carmichael PL, Pollock HM, Martin-Hirsch PL, Martin FL. Biospectroscopy to metabolically profile biomolecular structure: a multistage approach linking computational analysis with biomarkers. J. Proteome Res. 2011;10(4):1437–1448. doi: 10.1021/pr101067u. [DOI] [PubMed] [Google Scholar]
- 13.Bhargava R, Fernandez DC, Hewitt SM, Levin IW. High throuput assessment of cells and tissues: bayesian classification of spectral metrics from infrared vibrational spectroscopic imaging data. Biochem. Biophys. Acta. 2006;1750:830–845. doi: 10.1016/j.bbamem.2006.05.007. [DOI] [PubMed] [Google Scholar]
- 14.Fernandez DC, Bhargava R, Hewitt SM, Levin IW. Infrared spectroscopic imaging for histopathologic recognition. Nat. Biotech. 2005;23:469–474. doi: 10.1038/nbt1080. [DOI] [PubMed] [Google Scholar]
- 15.Kwak JT, Kajdacsy-Balla A, Macias V, Walsh M, Sinha S, Bhargava R. 2015;5 doi: 10.1038/srep08758. Article No. 8758. [DOI] [PMC free article] [PubMed] [Google Scholar]
Associated Data
This section collects any data citations, data availability statements, or supplementary materials included in this article.


