Abstract
In the present study, well-defined one-dimensional (1D) rod-like strontium vanadate (SrV2O6) was prepared by simple hydrothermal method without using any other surfactants/templates. The successful formation of rod-like SrV2O6 was confirmed by various analytical and spectroscopic techniques. Interestingly, for the first time the dual role of as-prepared rod-like SrV2O6 were employed as an electrochemical sensor for the detection of caffeic acid (CA) as well as visible light active photocatalyst for the degradation of metronidazole (MNZ) antibiotic drug. As an electrochemical sensor, the SrV2O6 modified glassy carbon electrode (GCE) demonstrated a superior electrocatalytic activity for the detection of CA by chronoamperometry and cyclic voltammetry (CVs). In addition, the electrochemical sensor exhibited a good current response for CA with excellent selectivity, wide linear response range, lower detection limit and sensitivity of 0.01–207 µM, 4 nM and 2.064 μA μM−1cm−2, respectively. On the other hand, as-synthesized rod-like SrV2O6 showed highly efficient and versatile photocatalytic performances for the degradation of MNZ, which degrades above 98% of MNZ solution under visible light irradiation within 60 min. The obtained results evidenced that the improvement of rod-like SrV2O6 might be a resourceful electrocatalyst and photocatalyst material in the probable applications of environmental and biomedical applications.
Introduction
In the past few decades, polyphenols are paid great attention in biological, chemical and nutrient fields owing to their extraordinary antioxidant, anti-inflammatory and anti-microbial properties1, 2. Caffeic acid (CA) is one of the polyphenol derivatives which occur in coffee, olive oil, propolis, some fresh vegetables, fruits, cosmetics and red wines3. In CA structure there is two hydroxyl groups is presented, this two hydroxyl groups is significantly contributed to the unique antioxidant properties4. Moreover, CA plays a vital role in human life circle process including the treatment of asthma, immune regulation diseases, allergic reactions, atherosclerosis and other cardiovascular diseases5. Due to its peculiar anti-oxidant properties, it can be act as a carcinogenic inhibitor and also prevents the replication of HIV/AIDS6, 7. In addition, 3 µg of CA can be used as a drug for the treatment of snake poisoning as well as 100 µg of CA can prevent the venous endothelial cells. However, the suitable dosage of CA is listed as 0.3–0.9 g per day and over dosage may causes negative impact to the human beings8. Therefore, the accurate level of CA detection is an important phenomenon to the environment and pharmaceutical formulations. Up to now, different analytical techniques such as chromatography, spectrophotometry, UV-vis spectrophotometry, capillary electrophoresis9–12 and electrochemical sensor have been developed for the detection of CA. Among all, the electrochemical techniques are more adoptable due to its simplicity, low-cost, fast response, practicality, high sensitivity and excellent selectivity13–15.
On the other hand, the release of pharmaceutical wastes such as antibiotics, analgesics, antipyretics, hormones and antimicrobials release into the water and solid environment can causes negative impact to the living things. In specific, metronidazole (MNZ) antibiotic drug which is widely used in the treatment of protozoa, amoebiasis, trichomoniasis and giardiasis16, 17. In addition, MNZ has also been used as an additive in poultry and fish feed industries to remove parasites18. The long-term release of MNZ into the environment can generates carcinogenic and mutagenic diseases to the living things19. However, MNZ has high solubility in water, non-biodegradability and faintly adsorbed on soil environment20, 21. For that reason, the removal of MNZ into the aquatic and soil environment is an important concern to prevent the living organisms. Various techniques have been proposed for the removal of MNZ into the environment including adsorption, biological treatments, ozonation, Fenton, photo-Fenton process and photolysis22. For aforementioned techniques, photocatalysis could offers simple, low-cost and eco-friendly technique for the removal of MNZ into the environment23–33.
Recently, transition metal based vanadates have much attention to the researchers owing to their low-cost, non-toxic in nature and which has been widely used in various potential applications34. In particularly, strontium based vanadates has considerable attention due to their optical, and electrical properties which can be used as an variety of applications including gas sensors, solid state electrolytes, lithium-ion batteries, electrochemical sensor and photocatalyst35, 36. There are several types of mixed oxides based on strontium and vanadium such as SrVO3, Sr3V2O8, Sr2V2O7, Sr3(VO4)2 and SrV2O6 have been reported37–40. However, the electrochemical and photocatalytic properties of SrV2O6 phase reports are scarce until now. Recently, Z. Li et al., reported dandelion-like micro-crystallites and long belt-like nanostructures of SrV2O6 phase synthesized by hydrothermal method in the presence of adipic acid40. It is well known that the interesting photocatalytic and electrochemical behaviors mainly dependent on its morphologies and crystalline nature41, 42. In specifically, low-dimensional nanomaterials such as nanotubes, nanowires, nanoribbons and nanorods have been focused on the concentrated research due to their peculiar properties and its applications in physics and construction of nanoscale devices43. Hence, it is extremely imperative to build up a simple and rapid synthesis procedure for the preparation of SrV2O6 phase with one-dimensional structure as well as high crystallinity under eco-friendly nature.
Herein, we made attempt to synthesize rod-like SrV2O6 through simple hydrothermal treatment followed by the annealing process. The prepared rod-like SrV2O6 was characterized by using X-ray diffraction (XRD), transmission electron microscopy (TEM), scanning electron microscopy (SEM), energy-dispersive X-ray (EDX), UV-Vis diffuse reflectance (UV-DRS), Raman and X-ray photoelectron spectroscopy (XPS). Fascinatingly, the rod-like SrV2O6 displayed a greatly energetic catalyst for the electrochemical determination of CA as well as, it was an efficient visible light photocatalyst for the degradation of MNZ antibiotic in the environmental samples that were briefly investigated with high degradation rate.
Result and Discussion
Characterization of the rod-like SrV2O6
The crystal structure and phase purity of as-prepared SrV2O6 were investigated by using XRD analysis as it shown in Fig. 1(A). From the Fig. 1(A), all the intense diffraction peaks can be indexed to the facets of orthorhombic phase SrV2O6 and well matched with Joint Committee on Powder Diffraction Standards (JCPDS) data [No. 852440]. The calculated lattice parameters are a=9.666, b = 3.680, c = 12.529 Å, with the space group of Pnma. No other extra peaks were detected related to the SrO2 and V2O5, which suggested that high phase purity and the sharp peaks revealed the good crystalline nature of SrV2O6. From the XRD results, the as-synthesized SrV2O6 is in β-SrV2O6 40. Raman spectroscopy is an effective technique to analyze the bonding states and local structure of the as-synthesized rod-like SrV2O6 as it shown in Fig. 1(B). The obtained Raman bands below in the region of 400 and 434 cm−1 which belongs to the O-V-O twisting, rocking and chain deformation vibrations, and δ-VO2 vibrations of SrV2O6, respectively44. The bands at 514 and 655 cm−1 attributed to the V-O-V symmetric stretching vibrations. The sharp and high intensity bands in the region of 800–1000 cm−1 were assigned to the VO2 stretching vibrations45.
Figure 1.
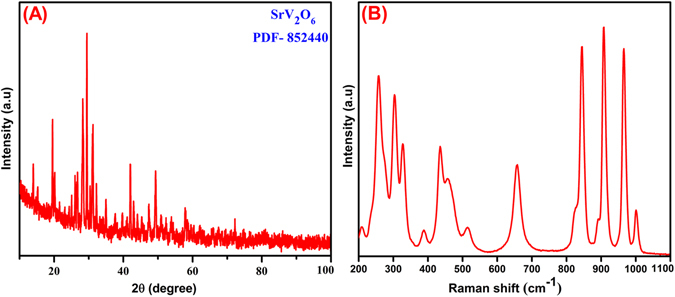
XRD pattern of SrV2O6 (A) and Raman spectrum of SrV2O6 (B).
The surface morphology of the as-synthesized SrV2O6 were observed by SEM analysis as shown in Fig. 2(A). The different magnification of the SEM images (Fig. 2A-C) revealed the presence of large quantity of rod-like structures that is closely arranged with each other. The high magnification SEM images displayed smooth and well defined rod-like morphology and the average diameter is about 90–100 nm. To study the elemental composition, the prepared rod-like SrV2O6 were investigated by using EDX. Figure 2D revealed that the formed rod-like SrV2O6 were composed of strontium, vanadium and oxygen, at the same time no other signals was observed in the EDX spectrum which suggested that the purity of the as-prepared rod-like SrV2O6. The detailed surface morphology and size was further evidenced by TEM analysis as shown in Fig. 3. The TEM image clearly confirmed that the formation of rod-like structure with in the micro-range (Fig. 3A) and also discloses well defined boundaries.
Figure 2.
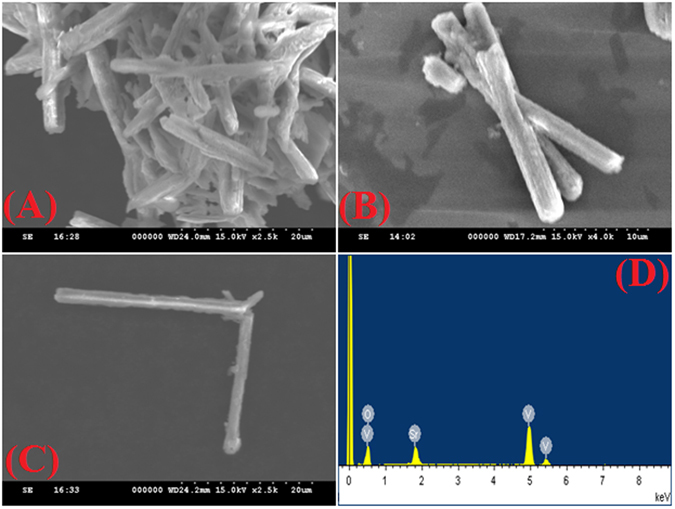
SEM images of SrV2O6 at different magnification 20 µm (A-C) 10 µm (B) and corresponding to EDX spectrum of SrV2O6 (D).
Figure 3.
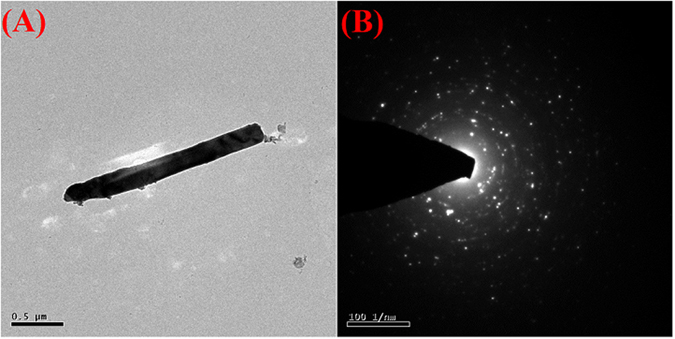
TEM image of SrV2O6 (A) and SAED spectrum of SrV2O6 (B).
The selected area electron diffraction (SAED) pattern (Fig. 3B) apparently visualized that the bright spots which is corresponds to the different orientation planes of SrV2O6 and it was further confirmation for the high crystalline nature. Furthermore, the elemental composition and their distributions were strongly evidenced by elemental mapping analysis as it can be seen in Fig. S1. Elemental mapping portrays the coexistence and uniform distribution of Sr, V and O elements in the rod-like SrV2O6.
Furthermore, the surface composition and their oxidation states were accurately determined by XPS analysis as shown in Fig. 4. The overall XPS survey spectrum (Fig. 4A) displays the presence of Sr, C, V and O elements which is good consistence with EDX report. The presence of C at 284.5 eV might be attributed to the residual hydrocarbon from the XPS instrument. The high-resolution XPS spectrum of Sr delivers the peaks at the binding energies of 133.4 and 134.9 eV, which corresponds to the Sr 3d5/2 and Sr 3d3/2 (Fig. 4B) state respectively, suggesting the existence of Sr2+ oxidation state46. From the Fig. 4C, the intense peaks at 517.2 and 524.08 eV are related to the binding energies of V 2p3/2 and V 2p1/2 spin-orbits, implying that the V5+ oxidation state47. In the enlarged O 1 s spectrum shows the peaks in the range of 529.2 to 531.03 eV could be ascribed to the O2− state in SrV2O6 48.
Figure 4.
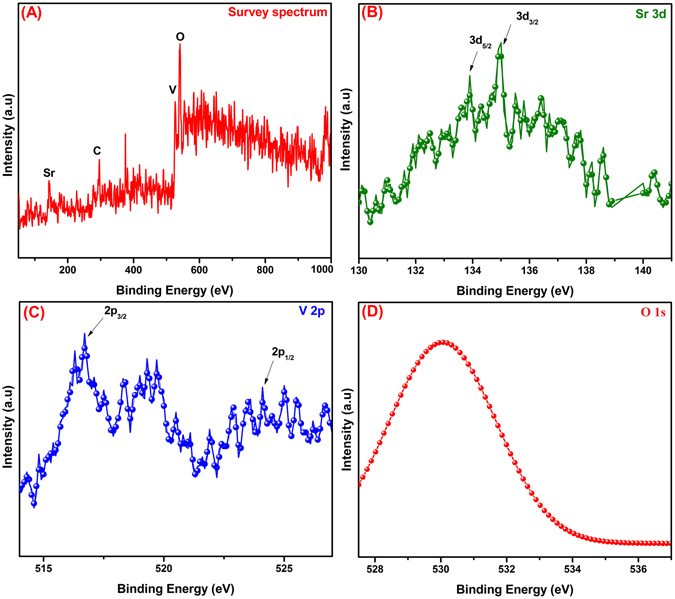
XPS survey spectra of SrV2O6 (A),) High resolution XPS spectra of Sr 3d, V 2p and O 1 s (B–D).
The optical properties and the active light region for the rod-like SrV2O6 were analyzed by UV-visible spectroscopy as illustrated in Fig. 5A. The spectrum exhibited a broad absorption peak from 320 to 550 nm which is corresponded to the bathochromic shift. It was clearly revealed that the rod-like SrV2O6 may active in the visible light region. However, to predict the exact wavelength required for the photocatalytic reaction, the energy gap was calculated using tauc’s equation and is shown in Fig. 5B. The energy gap calculated for the rod-like SrV2O6 is 2.4 eV.
Figure 5.
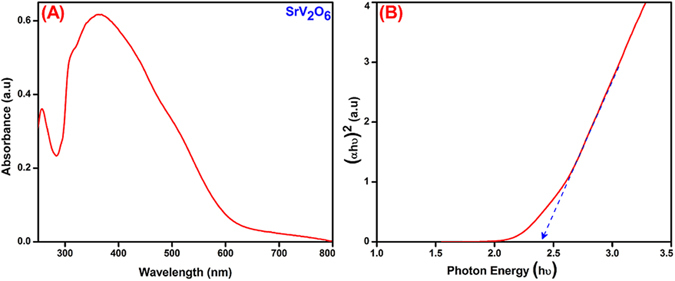
UV-Vis diffuse reflectance spectra (DRS) (A) and Energy gap spectra of rod-like SrV2O6 (B).
The surface area of the catalyst act as significant role in the photodegradation process because of higher surface area of the catalyst can generates higher number of reactive species which results the higher photocatalytic activity of the catalyst27. The N2 adsorption-desorption isotherm analysis was used to identify the specific surface area and porous structure of as-synthesized rod-like SrV2O6 and shown in Fig. 6. From the Fig. 6A, the specific Brunauer-Emmett-Teller (BET) surface area of the rod-like SrV2O6 was determined to be 4.7 m2/g. The average pore-size distribution of rod-like SrV2O6 was derived from Barrett–Joyner–Halenda (BJH) pattern as represented in Fig. 6B. It obvious that rod-like SrV2O6 was contains mesoporous range of 26 nm.
Figure 6.
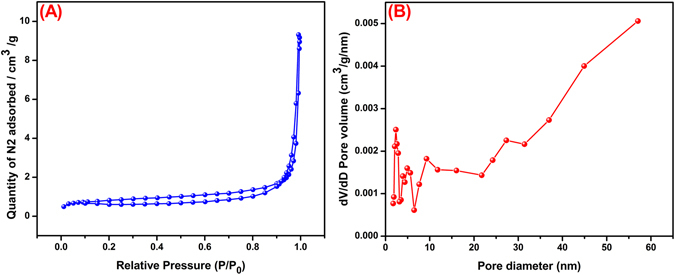
Nitrogen adsorption-desorption isotherms (A) and the pore size distribution plots (B) of rod-like SrV2O6.
Electrochemical performance of CA at SrV2O6 modified GCE
The electrochemical redox performance of CA was studied at various modified and unmodified GCE such as (a) bare GCE (b) SrV2O6/GCE by using CVs in the presence (c,d) and absence (a,b) of 400 µM CA containing 0.1 M KCl at a scan rate 50 mVs−1 (Fig. 7A). The potentials were scanned in the range from 0 to 1.2 V. From the Fig. 7A(a), the unmodified GCE didn’t shows any redox peak current at the potential range from 0 to 1.2 V, which demonstrates that the unmodified bare GCE is not suitable for the detection of CA. At the same time, the presence of CA (Fig. 7A(c,d)), a couple of redox peak was observed for the bare GCE and rod-like SrV2O6 modified GCE at the potential of 0.61 and 0.24 V, 0.57 and 0.27 V, respectively. Figure 7A(c) shows the a pair of weak redox peak was observed at the bare GCE with peak-to-peak separation of (Δ Ep) 338 mV, which is clearly indicating that the redox peaks must me aspects to the electrochemical redox activities of CA. For the rod-like SrV2O6 modified GCE (Fig. 7A(d)), a pair of quasi-reversible redox behavior peak current considerably increased when compared with bare GCE, it’s due to the excellent conductivity and high specific surface area of rod-like SrV2O6. The peak-to-peak separation for CA at SrV2O6/GCE was found as 302 mV. The anodic peak current of CA at SrV2O6/GCE is 3.5 times much higher when compared to the bare GCE. The obtained results suggesting that the synthesized rod-like SrV2O6 possess good interaction ability towards the CA. So, we recommended that the rod-like SrV2O6 is very suitable electrode active material for the sensitive and selective determination of CA in future electrochemical sensor fabrication. On the other hand, increasing the concentrations of CA from 0 to 800 µM the redox peak current was increased gradually (Fig. 7B), which is indicating that the rod-like SrV2O6 possess high catalytic activity towards the CA. The sensitivity and the limit of detection (LOD) are discussed and detailed in the amperometric section.
Figure 7.
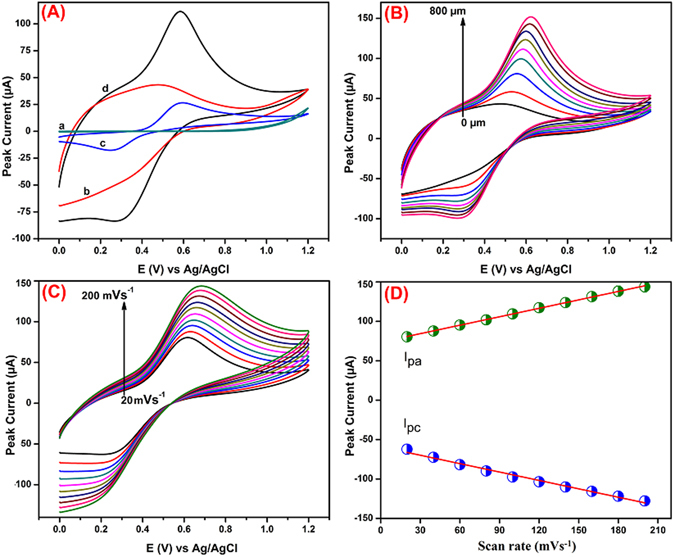
CVs performance of CA at different modified electrodes bare GCE (a) SrV2O6/GCE (b) in the presence (c,d) and absence (a,b) of 400 µM CA containing 0.1 M KCl at a scan rate 50 mVs−1 (A). CVs performance of CA for various concentrations from 0 to 800 µM (B). Different scan rates ranging from 20–200 mVs−1, 400 µM CA using SrV2O6/GCE in the 0.1 M KCl (C). The relation between the peak current vs. scan rate (D).
Effect of scan rate
The CVs for the redox of CA at the rod-like SrV2O6 modified GCE in 0.1 M KCl containing 400 µM CA as shown in Fig. 7C. There was a negative shift in the reduction peak potential and a positive shift in the oxidation peak potential with increase the scan rate from 20 to 200 mVs−1. The anodic and cathodic peak current of CA was also increased with increasing the scan rates from 20 to 200 mVs−1. The linear relationship was plotted between both anodic, cathodic peak currents and scan rates (Fig. 7D) and their linear regression equations can be expressed as follows: I pa (µA) = 0.3575 + 73.7 (mVs−1) with correlation co-efficient R2 = 0.9993; I pc (µA) = −0.3553–59.166 (mVs−1) (R2 = 0.9898) respectively, suggesting that the rod-like SrV2O6 modified electrode process of CA is a typical-adsorption controlled process.
Determination of CA
The amperometric (i-t) technique is a higher sensitivity and better resolution technique when compared with conventional CVs. In order to we used this amperometric technique for the determination of CA. Figure 8A shows the amperogram obtained at the rod-like SrV2O6 modified RDGCE towards the each continuous addition of CA (0.01- 1407 µM). Every addition was injected at the time intervals of 50 s into the continuously stirred 0.1 M KCl with the rotation speed at 1200 rpm. The applied constant working potential of the electrode was held at + 0.58 V. Figure 8A displays that rod-like SrV2O6 modified RDGCE shows a well-defined and rapid amperometric current responses was obtained in various addition of CA concentration with the response time of 5 s, which is clearly indicating that the quick electron movement process was happened in the electrode and electrolyte interface when injecting the CA. The peak currents was increased linearly with increasing the concentration of CA from lower to higher and the peak currents was also linearly increased and reached steady state current. A calibration plot was plotted for the CA concentration vs. anodic peak current (inset: Fig. 8A) and the linear regression equation can be expressed as I p (µA) = 0.4128 [CA (µM)] + 10.713. The amperometric current responses were increased linearly with increasing the CA concentration in the linear range from 0.01 to 207 µM. The limit of detection (LOD) and sensitivity was calculated as 4 nM and 2.064
Figure 8.
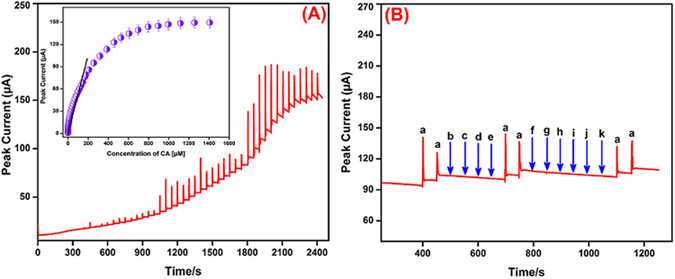
Amperometric (i-t) response at SrV2O6 modified RDGCE upon successive additions of 0.01–1407 µM CA into continuously stirred 0.1 M KCl. Applied potential + 0.58 V (A). At the same working conditions, amperometric response at SrV2O6 modified RDGCE for 50 µM of CA (a) 50 fold excess concentration of biologically co-interfering substances glucose (b), galactose (c), fructose (d), sucrose (e), catechol (f), ferulic acid (g), gallic acid (h), uric acid (i), ascorbic acid (j), dopamine (k) into continuously stirred 0.1 M KCl (B).
µAµM−1cm−2, respectively. The obtained analytical parameters such as linear range and LOD at rod-like SrV2O6 modified RDGCE towards the determination of CA have been compared with previously reported literature and are summarized in Table 1. From the literature results, suggesting that the proposed sensor exhibited good comparable analytical parameters with other reported electrochemical CA sensor. This should be attributed to the excellent electrocatalytic skill of the rod-like SrV2O6 modified RDGCE for the sensitive and selective electrochemical determination of CA.
Table 1.
Comparison of the analytical performance for proposed method with other reported chemically modified electrochemical detection of CA.
| Electrode | Linear range (µM) | LOD (µM) | Ref. |
|---|---|---|---|
| PG/GCE | 9–40 | 3.9 | 49 |
| Plant-peroxidase-chitin/CPE | 20–200 | 2 | 50 |
| Glassy polymeric carbon | 0.9–11 | 0.2 | 5 |
| PbFE | 0.01–0.5 | 0.004 | 51 |
| AuNPs -chitosan/GE | 0.05–2000 | 0.025 | 52 |
| AuNP/GN/GCE | 0.05–50 | 0.05 | 53 |
| Nafion/ER-GO/GCE | 0.01–1.5 | 0.09 | 54 |
| MIS/GE | 0.5–60 | 0.15 | 55 |
| LDHf/GCE | 7–180 | 2.6 | 56 |
| PGE | 0.01–3000 | 0.08 | 57 |
| MWNTs-[BuPy]PF6-CS/GCE | 0.02–7 | 0.005 | 58 |
| Laccase biosensor (LTV-SPE) | 0.5–1300 | 0.52 | 59 |
| Laccase-MWCNT-chitosan/Au | 0.7–10 | 0.15 | 60 |
| Tyrosinase/diazonium/SPGE | 0.3–83 | 0.2 | 61 |
| LuPc2 nanowires/ITO | 60–5000 | 3.12 | 62 |
| Nafion/Tyre/Sonogel-Carbon | 0.08–2 | 0.06 | 63 |
| Glassy polymeric carbon | 96.5–0.1 | 0.29 | 64 |
| Glassy carbon electrode | 10–120 | 0.1 | 65 |
| Rod-like SrV2O6/GCE | 0.01–207 | 0.004 | This work |
Abbreviation: PG-Poly(glutamic acid; GCE-glassy carbon electrode; CPE-carbon paste electrode; PbFE-lead film electrode; AuNPs-colloidal gold nanoparticles; GE-gold electrode; GN-graphene Nanosheets; ER-GO-electrochemically reduced graphene oxide; MIS-molecularly imprinted siloxanes; LDHf-layered double hydroxide film; PGE-pencil graphite electrode; MWCNT- Multiwalled Carbon Nanotubes; [BuPy]PF6-Butylpyridinium Hexafluorophosphate; CS- Chitosan; LTV- Laccase (Trametes versicolor); SPE- Screen printed electrode; Au- Gold sheets electrode; SPGE- Screen printed gold electrode; LuPc2-Lutrium bisphthalocyanine; ITO- Indium tin oxie.
In order to investigate the selectivity of the rod-like SrV2O6 modified RDGCE towards the detection of CA in the presence of various potentially co-interfering substances by amperometric technique. As shown in Fig. 8B, the SrV2O6/RDGCE shows well-defined amperometric current responses towards the each addition of 50 µM of CA (a), at the same time, there is no noteworthy peak current was observed in the presence of 50 fold excess concentration of biologically co-interfering substances such as glucose (b), galactose (c), fructose (d), sucrose (e), catechol (f), ferulic acid (g), gallic acid (h), uric acid (i), ascorbic acid (j), dopamine (k) in a continuously stirred 0.1 M KCl. Further, 50 µM CA addition (a) produced same signal amperometric peak current responses in the presence of aforementioned interfering substances, suggesting that the proposed SrV2O6/RDGCE sensor possessed excellent selectivity. Therefore, it can be used as selective electrochemical sensor for the detection of CA even in the presence of more interfering substances.
Stability, Reproducibility and Repeatability studies
The stability of the electrode is very important factor for the newly developed electrochemical sensor. To examine the stability of the SrV2O6 modified GCE up to 7 days by CVs and stored in 0.1 M KCl when not in use. The modified electrode retained 95.2% of its initial response peak current after 7 days, which suggesting that the SrV2O6 modified GCE had appreciable storage stability of the sensor. The reproducibility of the sensor was also investigated in 3 independent modified electrodes by CVs in the presence of 50 µM CA displays a acceptable reproducibility with the relative standard deviation (RSD) of 3.6%. Furthermore, the proposed electrochemical sensor offered adequate repeatability with an RSD of 3.2% for 10 consecutive repeated measurements in a single modified electrode.
Photocatalytic performance
The photocatalytic performances of rod-like SrV2O6 were evaluated for the degradation of MNZ in aqueous solution under visible light irradiation. Figure 9A portrays the time-dependent UV-vis absorption spectrum of MNZ solution in the presence of rod-like SrV2O6 under visible light irradiation. It was observed that, the intensity of major characteristic peak of MNZ at 318 nm gradually diminished with respect to increasing irradiation time, because of generation of electron-hole pairs. After 60 min of irradiation, the absorption intensity of the peak was almost vanished which implies that the complete degradation of MNZ solution. There was no other discernible new peaks were observed which suggests that the intermediates do not absorb the wavelength of 318 nm. Hence, rod-like SrV2O6 efficiently degraded ~98% of MNZ solution within 60 min under visible light irradiation.
Figure 9.
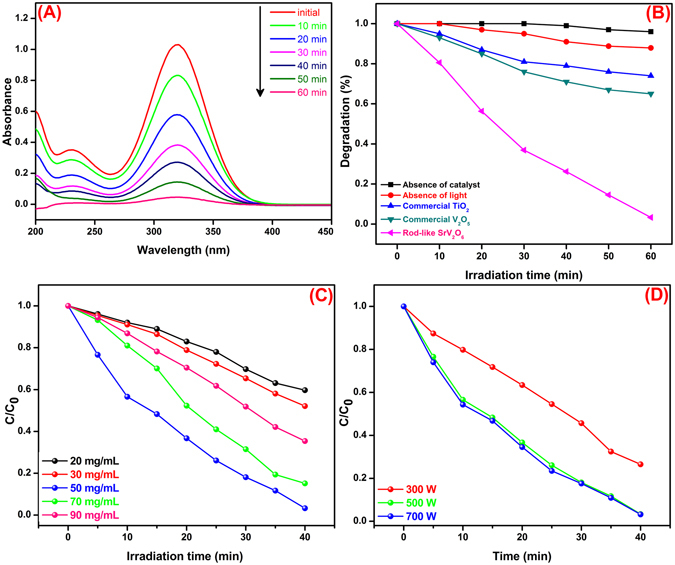
Time-dependent absorption spectrum of MNZ photodegradation (A), Effect of different catalyst dosage (B), Effect of catalyst dosage and (C) Effect of light intensity on the photodegradation of MNZ (D).
For comparison, we assessed the photocatalytic activity of commercial TiO2 and commercial V2O5 under the same identical conditions. Blank tests were also carried out, irradiation in the absence of photocatalyst and photocatalyst alone without irradiation and the results were presented in Fig. 9B. From the Fig. 9B, there was no significant degradation was observed in the absence of photocatalyst which revealed that MNZ is stable under visible light irradiation. The adsorption of the MNZ solution on the surface of the rod-like SrV2O6 photocatalyst was also evaluated and the results represents only 12% of MNZ degradation was achieved. Meanwhile, the commercial TiO2 and V2O5 exhibited the degradation of MNZ is 24 and 32% respectively which clearly proved that the as-synthesized rod-like SrV2O6 possessed superior photocatalytic property against MNZ solution under visible light irradiation.
The photocatalytic degradation efficiency strongly depends on amount of catalyst used in the photocatalytic reaction. Hence, a sequence of experiments was carried out by varying the amount of rod-like SrV2O6 catalyst dosage from 20 to 90 mg/mL while other parameters are kept same and the results are presented in Fig. 9C. As can be seen, the degradation efficiency was increased with increasing amount of catalyst dosage; the degradation efficiency was very high at 50 mg/mL and thereafter considerably decreased. Though, the degradation efficiency was higher when the amount of catalyst dosage is about 50 mg/mL which might be due to the complete consumption of incident light photons striking on the catalyst surface and/or availability of number of active sites at the surface. Beyond 50 mg/mL, the degradation efficiency was decreased which is due to the aggregation of catalyst particles which reduce the interfacial area between the reaction solution and the catalyst. As a result, a number of active sites that reaches on the surface of the catalyst are decreased. In addition, light scattering and high cloudiness were happened which also reduce photodegradation efficiency.
Photodegradation performances were also depending on the light intensity and therefore we evaluated the effect of light intensity for the photodegradation of MNZ and other parameters are kept constant. Figure 9D, demonstrates the increasing of photodegradation performance with increasing the light intensity from 300 W to 500 W. Beyond that, the degradation performances were maintained at constant. Hence, 500 W light intensity is much enough for the photodegradation of MNZ solution.
In order to identify the active involvement of reactive oxidative species (ROS) such as hole (h+), superoxide radicals (O2 .−) and hydroxyl radicals (•OH) in the photodegradation process, the scavenger experiments were carried out. In this study, triethylamine (TEA), benzoquinone (BQ) and n-butanol (n-BtOH) were used as the scavengers for h+, O2 .− and •OH species respectively and the results are shown in Fig. 10A. The •OH scavenger, obviously BtOH strongly inhibited that the photocatalytic reaction proceeded by the active involvement of •OH. In the present study, it was observed that, the addition of n-BtOH and BQ was greatly suppressed which clearly revealed that the active involvement of •OH radical. However, the addition of TEA was slightly decreased the photodegradation rate which may be attributed to the active involvement of O2 .−. Hence, the •OH and O2 .− species plays important responsibility and h+ plays a minor role for the degradation of MNZ solution.
Figure 10.
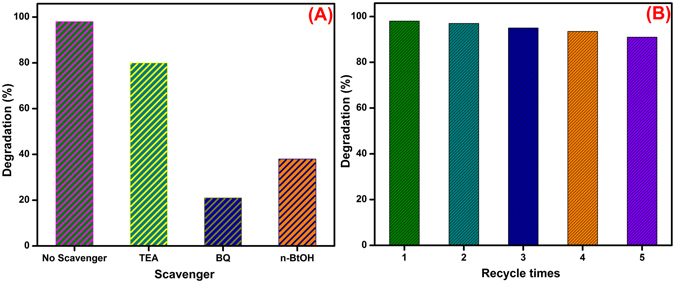
Effect of scavengers on the photodegradation of MNZ and (A) Stability of the rod-like SrV2O6 (B).
Stability
The stability and reusability of the photocatalyst is also extremely pivotal due to its practical applications. Therefore, we evaluated the recycling experiments were conducted for the rod-like SrV2O6 photocatalyst over five repeated cycles under the similar conditions and the results presented in Fig. 10B. It can be seen that, after five recycling runs the degradation efficacy was slightly decreased from 98 to 92%. The slight loss is due to the adsorption of MNZ solution on the surface of the photocatalyst which might be inhibited the generation of reactive species and results in fewer numbers. The results showed that the as-synthesized rod-like SrV2O6 had good stability even after five cycles.
Plausible photocatalytic mechanism for the degradation of MNZ solution
The reaction pathway of the photocatalytic reaction was an important parameter to determine the stepwise progress of the reaction. The photocatalytic degradation of MNZ was followed by the reaction pathway as given below
| 1 |
| 2 |
| 3 |
| 4 |
| 5 |
| 6 |
Under visible light illumination the rod-like SrV2O6 were excited and the electrons (e−) in the valence band is moved to the conduction band (CB) while leaving a hole in the valance band (VB) as illustrated in eq. 1. The e− in the CB and h + in the VB were reacted with the O2 and H2O to produced the paramount important O2 .− (eq. 2) and •OH respectively. Furthermore, O2 .− was further reacted with H+ to form •HO2 and the active ROS was degraded the MNZ pollutant.
Conclusions
In conclusion, rod-like SrV2O6 were successfully developed by a simple hydrothermal method. The prepared rod-like SrV2O6 were characterized by XRD, Raman, SEM, EDX, TEM, XPS, BET and UV-DRS. These techniques were clearly confirmed the structural nature and morphology of the SrV2O6. The entire results are robustly proofed that the as-formed products were pure, without any other impurities. However, the developed rod-like SrV2O6 explored good electrocatalytic activity for the detection of CA even in the presence of glucose, galactose, fructose, sucrose, catechol, ferulic acid, gallic acid, uric acid, ascorbic acid and dopamine. The flexible electrochemical sensor based on SrV2O6/GCE is very helpful for determination of CA and has more advantageous properties such as low LOD, good anti-interference ability, good sensitivity and wide linear response range. Moreover, the as-synthesized rod-like SrV2O6 showed highly efficient and versatile photocatalytic performances for the degradation of MNZ, which degrades above 98% of MNZ solution under visible light irradiation within 60 min. Ambitiously, rod-like SrV2O6 can be used as advanced electrode material as well as photocatalyst for the detection and degradation of CA and MNZ.
Experimental Section
Materials
Strontium nitrate (SrNO3), ammonium metavanadate (NH4VO3), caffeic acid (C9H8O4), glucose, galactose, fructose, sucrose, catechol, ferulic acid, gallic acid, uric acid, ascorbic acid and dopamine were received from Sigma-Aldrich and Alfa Aesar Companies. All other chemicals/reagents are analytical grade were purchased with maximum high purity and used without further purification. All required solution was prepared by using de-ionized (DI) water for the throughout the experiments.
Synthesis of rod-like SrV2O6
In a typical synthesis, 0.5 mM of Sr(NO)3 and 0.3 mM of NH4VO3 were dissolved in 80 mL DI water under vigorous stirring for 1 h and the solution was transferred into 100 mL Teflon-lined sealed stainless steel autoclave at 180 °C for 8 h. Then, the products were collected by centrifugation and thoroughly washed with copious amount of DI water and dried at 80 °C for 6 h. The dried products were annealed at 500 °C for 2 h before further characterization.
Characterization
The powder XRD patterns of the product was recorded on a Bruker D8 Advance X-ray diffractometer with monochromatized Cu-Kα radiation (λ = 1.5418 A0). An accelerating voltage of 40 kV, the emission current of 40 mA and a step size of 0.020 with a step time of 0.5 secs were used. TEM images were recorded on a JEOL JEM-3010 microscope. SEM was recorded using Hitachi S-3000 H electron microscope. EDX spectrum analyzed using HORIBA EMAX X-ACT that was attached with Hitachi S-3000 H scanning electron microscope. UV-vis diffuse reflectance spectra were carried out on a Lambda 750 (Perkin Elmer) spectrophotometer at a wavelength range of 200–800 nm. The Raman spectra of the sample were measured on a Renishaw 1000 Raman microscope system, the excitation source was a He/Ne laser (λ = 633 nm) and the resolution was 2 cm−1. XPS measurements were achieved by a Thermo Scientific ESCA Lab 250 spectrophotometer, and all of the binding energies were calibrated by the C 1 s peak at 284.6 eV. The absorption spectra in the photodegradation procedure were observed by Shimadzu 2100 UV-visible spectrometer. The specific surface area and pore size distribution were determined using the BET (Micromeritics, ASAP 2020 M). All electrochemical measurements were measured using CHI 405a work station in a three conventional electrode system, modified glassy carbon electrode (GCE-surface area 0.07 cm2) as a working electrode, Pt wire as a counter electrode and saturated Ag/AgCl (KCl) as a reference electrode. An amperometric (i-t) measurement was carried out with analytical rotator AFMSRX (PINE instruments, USA) and rotation disc glassy carbon electrode (RDGCE) with working area 0.2 cm2. All the electrochemical measurements were performed at room temperature.
Fabrication of rod-like SrV2O6 on the GCE surface for CA
To fabricate the CA sensor, the GCE was mirror-like polished with 0.05 µm alumina slurry and thoroughly washed with copious amount of DI water. After that, 5 mg/mL of as-prepared rod-like SrV2O6 was redispersed in DI water and sonicated on hour to get the homogeneous suspension. The rod-like SrV2O6 modified GCE was fabricated by a simple drop casting method. An 8 µL suspension of re-dispersed SrV2O6 was drop coated on the GCE surface and it was kept in air oven at ambient temperature. Then, the dried modified GCE was gently washed with DI water to remove the loosely attached molecules on the GCE surface. Then that obtained SrV2O6 modified GCE was used to further electrochemical measurements.
Photocatalytic experiments
The photocatalytic activity of the as-prepared rod-like SrV2O6 was evaluated for the degradation of MNZ aqueous solution under visible light irradiation. In a typical experiment, 50 mg of catalyst was dispersed in 200 mL aqueous solutions of MNZ (20 mg/L). Prior to illumination, the solution mixture was stirred magnetically for 30 min in the dark to ensure that the MNZ attained absorption–desorption equilibrium on the photocatalyst surface. A 500 W tungsten lamp equipped with a UV cut-off filter (λ > 400 nm) was used as the visible light source for the photodegradation reactions and the experimental set up is presented in Fig. S2. At defined irradiation intervals, the aliquots (5.0 mL) of the suspension were collected and centrifuged to separate the photocatalyst particles. The supernatant solution was analyzed by UV-vis spectrophotometer to determine the concentration changes of MNZ. The photocatalytic degradation efficiency was calculated using C/C0, where C is the concentration of MNZ solution at certain irradiation time (t) while C0 is the adsorption/desorption equilibrium concentration of MNZ (t = 0).
Electronic supplementary material
Acknowledgements
This project was supported by the Ministry of Science and Technology of Taiwan (Republic of China).
Author Contributions
R.K. and J.V.K. has designed the work and prepared the manuscript. R.K., J.V.K., P.S. and V.S. has did the all experiments and S.M.C., V.M. was supervised the work and organized the manuscript. All authors are contributing to wrote the manuscript.
Competing Interests
The authors declare that they have no competing interests.
Footnotes
Electronic supplementary material
Supplementary information accompanies this paper at doi:10.1038/s41598-017-07423-1
Publisher's note: Springer Nature remains neutral with regard to jurisdictional claims in published maps and institutional affiliations.
Contributor Information
Shen-Ming Chen, Email: smchen78@ms15.hinet.net.
V. Muthuraj, Email: muthuraj75@gmail.com
References
- 1.Balasundram N, Sundram K, Samman S. Phenolic compounds in plants and agri-industrial by-products: Antioxidant activity, occurrence, and potential uses. Food Chem. 2006;99:191–203. doi: 10.1016/j.foodchem.2005.07.042. [DOI] [Google Scholar]
- 2.Salcedo CL, Nazareno MA. Effect of phenolic compounds on the oxidative stability of ground walnuts and almonds. RSC Adv. 2015;5:45878–45887. doi: 10.1039/C5RA00245A. [DOI] [Google Scholar]
- 3.Arnous A, Makris DP, Kefalas P. Effect of principal polyphenolic components in relation to antioxidant characteristics of aged red wines. J. Agric. Food Chem. 2001;49:5736–5742. doi: 10.1021/jf010827s. [DOI] [PubMed] [Google Scholar]
- 4.Zheng B, et al. Green preparation of reduced graphene oxide for sensing and energy storage applications. Sci. Rep. 2014;4:1–8. doi: 10.1038/srep04684. [DOI] [PMC free article] [PubMed] [Google Scholar]
- 5.Tyszczuk K, Skalska-Kaminska A, Wozniak A. Voltammetric method using a lead film electrode for the determination of caffeic acid in a plant material. Food Chem. 2011;125:1498–1503. doi: 10.1016/j.foodchem.2010.10.075. [DOI] [Google Scholar]
- 6.Huang MT, Ferraro T. Phenolic-compounds in food and cancer prevention. ACS Symp. Ser. 1992;507:8–34. doi: 10.1021/bk-1992-0507.ch002. [DOI] [Google Scholar]
- 7.Robinson WE, Reinecke MG, Abdel-Malek S, Jia Q, Chow SA. Inhibitors of HIV-1 replication that inhibit HIV integrase. Proc. Natl. Acad. Sci. USA. 1996;93(13):6326–6331. doi: 10.1073/pnas.93.13.6326. [DOI] [PMC free article] [PubMed] [Google Scholar]
- 8.Cai N, Li Y, Chen S, Su X. Fluorometric Assay Platform for Caffeic Acid Detection Based on the G-quadruplex/hemin DNAzyme. Analyst. 2016;141:4456–4462. doi: 10.1039/C6AN00543H. [DOI] [PubMed] [Google Scholar]
- 9.Fracassetti D, et al. Quantification of glutathione, catechin and caffeic acid in grape juice and wine by a novel ultra-performance liquid chromatography method. Food Chem. 2011;128:1136–1142. doi: 10.1016/j.foodchem.2011.04.001. [DOI] [Google Scholar]
- 10.Robbins RJ. Phenolic acids in foods: an overview of analytical methodology. J. Agric. Food Chem. 2003;51:2866–2887. doi: 10.1021/jf026182t. [DOI] [PubMed] [Google Scholar]
- 11.Zitka O, et al. Comparison of Various Easy-to-Use Procedures for Extraction of Phenols from Apricot Fruits. Molecules. 2011;16:2914–2936. doi: 10.3390/molecules16042914. [DOI] [PMC free article] [PubMed] [Google Scholar]
- 12.Peng YY, Liu FH, Ye JN. Determination of phenolic acids and flavones in lonicera japonica thumb. by capillary electrophoresis with electrochemical detection. Electroanalysis. 2005;17:356–362. doi: 10.1002/elan.200403102. [DOI] [Google Scholar]
- 13.Karthik R, et al. Eco-friendly synthesis of Ag-NPs using Cerasus serrulata plant extract–Its catalytic, electrochemical reduction of 4-NPh and antibacterial activity. J. Ind. Eng. Chem. 2016;37:330–339. doi: 10.1016/j.jiec.2016.03.044. [DOI] [Google Scholar]
- 14.Karthik R, et al. A Study of Electrocatalytic and Photocatalytic Activity of Cerium Molybdate Nanocubes Decorated Graphene Oxide for the Sensing and Degradation of Antibiotic Drug: Chloramphenicol. ACS Appl. Mater. Interfaces. 2017;9:6547–6559. doi: 10.1021/acsami.6b14242. [DOI] [PubMed] [Google Scholar]
- 15.Karikalan N, Karthik R, Chen SM, Velmurugana M, Karuppiah C. Electrochemical properties of the acetaminophen on the screen printed carbon electrode towards the high performance practical sensor applications. J. Colloid Interface Sci. 2016;483:109–117. doi: 10.1016/j.jcis.2016.08.028. [DOI] [PubMed] [Google Scholar]
- 16.Dong S, et al. Facile synthesis of novel ZnO/RGO hybrid nanocomposites with enhanced catalytic performance for visible light-driven photodegradation of metronidazole. Mater. Chem. Phys. 2014;145:357–365. doi: 10.1016/j.matchemphys.2014.02.024. [DOI] [Google Scholar]
- 17.Farzadkia M, Esrafili A, Baghapour MA, Shahamat YD, Okhovat N. Degradation of metronidazole in aqueous solution by nano-ZnO/UV photocatalytic process. Desalin. Water Treat. 2013;52:4947–4952. doi: 10.1080/19443994.2013.810322. [DOI] [Google Scholar]
- 18.Bendesky A, Menendez D, Ostrosky-Wegman P. Is metronidazole carcinogenic. Mutat Res., Rev. Mutat. Res. 2002;511:133–144. doi: 10.1016/S1383-5742(02)00007-8. [DOI] [PubMed] [Google Scholar]
- 19.Saidi I, et al. Indirect electroreduction as pretreatment to enhance biodegradability of metronidazole. J. Hazard. Mater. 2014;278:172–179. doi: 10.1016/j.jhazmat.2014.06.003. [DOI] [PubMed] [Google Scholar]
- 20.Richardson ML, Bowron JM. The fate of pharmaceutical chemicals in the aquatic environment. J. Pharm. Pharmacol. 1985;37:1–12. doi: 10.1111/j.2042-7158.1985.tb04922.x. [DOI] [PubMed] [Google Scholar]
- 21.Rabolle M, Spliid NH. Sorption and mobility of metronidazole, olaquindox, oxytetracycline and tylosin in soil. Chemosphere. 2000;40:715–722. doi: 10.1016/S0045-6535(99)00442-7. [DOI] [PubMed] [Google Scholar]
- 22.Farzadkia M, Bazrafshan E, Esrafili A, Yang J, Siboni MS. Photocatalytic degradation of Metronidazole with illuminated TiO2 nanoparticles. J. Environ. Health Sci. Eng. 2015;13:35–42. doi: 10.1186/s40201-015-0194-y. [DOI] [PMC free article] [PubMed] [Google Scholar]
- 23.Kumar JV, Karthik R, Chen SM, Muthuraj V, Chelladurai K. Fabrication of potato-like silver molybdate microstructures for photocatalytic degradation of chronic toxicity ciprofloxacin and highly selective electrochemical detection of H2O2. Sci. Rep. 2016;6(34149):1–13. doi: 10.1038/srep34149. [DOI] [PMC free article] [PubMed] [Google Scholar]
- 24.Dong. S, et al. Shape-controlled synthesis of BiVO4 hierarchical structures with unique natural-sunlight-driven photocatalytic activity. Appl. Catal. B. 2014;152–153:413–424. doi: 10.1016/j.apcatb.2014.01.059. [DOI] [Google Scholar]
- 25.Dong. S, et al. Designing three-dimensional acicular sheaf shaped BiVO4/reduced graphene oxide composites for efficient sunlight-driven photocatalytic degradation of dye wastewater. Chem. Eng. J. 2014;249:102–110. doi: 10.1016/j.cej.2014.03.071. [DOI] [Google Scholar]
- 26.Dong. S, et al. Self-assembled hollow sphere shaped Bi2WO6/RGO composites for efficient sunlight-driven photocatalytic degradation of organic pollutants. Chem. Eng. J. 2017;316:778–789. doi: 10.1016/j.cej.2017.02.017. [DOI] [Google Scholar]
- 27.Dong. S, et al. ZnSnO3 hollow nanospheres/reduced graphene oxide nanocomposites as high-performance photocatalysts for degradation of metronidazole. Appl. Catal. B. 2014;144:386–393. doi: 10.1016/j.apcatb.2013.07.043. [DOI] [Google Scholar]
- 28.Dong. S, et al. Solar photocatalytic degradation of sulfanilamide by BiOCl/reduced graphene oxide nanocomposites: Mechanism and degradation pathways. J. Alloys Compd. 2016;663:1–9. doi: 10.1016/j.jallcom.2015.12.027. [DOI] [Google Scholar]
- 29.Hu. L, et al. Effects of sodium dodecyl benzene sulfonate on the crystal structures and photocatalytic performance of ZnO powders prepared by hydrothermal method. J. Alloys Compd. 2015;649:400–408. doi: 10.1016/j.jallcom.2015.07.109. [DOI] [Google Scholar]
- 30.Dong. S, et al. Recent developments in heterogeneous photocatalytic water treatment using visible-light-responsive photocatalysts: A review. RSC Adv. 2015;5:14610–14630. doi: 10.1039/C4RA13734E. [DOI] [Google Scholar]
- 31.Ong. WJ, et al. Facet-Dependent Photocatalytic Properties of TiO2-Based Composites for Energy Conversion and Environmental Remediation. ChemSusChem. 2014;7:690–719. doi: 10.1002/cssc.201300924. [DOI] [PubMed] [Google Scholar]
- 32.Ong. WJ, et al. Enhanced daylight-induced photocatalytic activity of solvent exfoliated graphene (SEG)/ZnO hybrid nanocomposites towards degradation of Reactive Black 5. Ind. Eng. Chem. Res. 2014;53:17333–17344. doi: 10.1021/ie5027088. [DOI] [Google Scholar]
- 33.Ong. WJ, et al. Synergistic effect of graphene as a co-catalyst for enhanced daylight-induced photocatalytic activity of Zn0.5Cd0.5S synthesized via an improved one-pot co-precipitation-hydrothermal strategy. RSC Adv. 2014;4:59676–59685. doi: 10.1039/C4RA10467F. [DOI] [Google Scholar]
- 34.Nithya VD, Selvan RK, Sanjeeviraja C, Radheep DM, Arumugam S. Synthesis and characterization of FeVO4 nanoparticles. Mater. Res. Bull. 2011;46:1654–1658. doi: 10.1016/j.materresbull.2011.06.005. [DOI] [Google Scholar]
- 35.Zhou Q, Shao M, Chen T, Xu H. Strontium vanadate nanoribbons: Synthesis, characterization and detection of dopamine. Mater. Res. Bull. 2010;45:1051–1055. doi: 10.1016/j.materresbull.2010.06.028. [DOI] [Google Scholar]
- 36.Vignesh K, Hariharan R, Rajarajan M, Suganthi A. Visible light assisted photocatalytic activity of TiO2–metal vanadate (M = Sr, Ag and Cd) nanocomposites. Mater. Sci. Semicond. Process. 2013;16:1521–1530. doi: 10.1016/j.mssp.2013.04.025. [DOI] [Google Scholar]
- 37.Macias J, Yaremchenko AA, Frade JR. Redox transitions in strontium vanadates: Electrical conductivity and dimensional changes. J Alloys Compd. 2014;601:186–194. doi: 10.1016/j.jallcom.2014.02.148. [DOI] [Google Scholar]
- 38.Sawala NS, Bajaj NS, Omanwar SK. Near-infrared quantum cutting in Yb3+ ion doped strontium vanadate. Infrared Phys Techn. 2016;76:271–275. doi: 10.1016/j.infrared.2016.03.007. [DOI] [Google Scholar]
- 39.Li Y, et al. Pressure-induced amorphization of metavanadate crystals SrV2O6 and BaV2O6. J. Appl. Phys. 2015;118:035902–035910. doi: 10.1063/1.4926784. [DOI] [Google Scholar]
- 40.Li Z, Yang H, Tian HF, Zhang Y, Li JQ. Fabrication and Characterization of Micro-Pattern Dandelion-like and Nanobelts of β-SrV2O6 via Hydrothermal Process. Chin. J. Chem. Phys. 2007;20:727–732. doi: 10.1088/1674-0068/20/06/727-732. [DOI] [Google Scholar]
- 41.Yu J, Dai G, Cheng B. Effect of Crystallization Methods on Morphology and Photocatalytic Activity of Anodized TiO2 Nanotube Array Films. J. Phys. Chem. C. 2010;114:19378–19385. doi: 10.1021/jp106324x. [DOI] [Google Scholar]
- 42.Liu S, et al. Foamed single-crystalline anatase nanocrystals exhibiting enhanced photocatalytic activity. J. Mater. Chem. A. 2015;3:17837–17848. doi: 10.1039/C5TA04682C. [DOI] [Google Scholar]
- 43.Wang ZL. Characterizing the Structure and Properties of Individual Wire-Like Nanoentities. Adv. Mater. 2000;12:1295–1298. doi: 10.1002/1521-4095(200009)12:17<1295::AID-ADMA1295>3.0.CO;2-B. [DOI] [Google Scholar]
- 44.Shen ZX, Ong CW, Tang SH, Kuok MH. Spectroscopic evidence of pressure-induced amorphization in α-NaVO3. Phys. Rev. 1994;B49:1433–1442. doi: 10.1103/PhysRevB.49.1433. [DOI] [PubMed] [Google Scholar]
- 45.Seetharaman S, Bhat HL, Narayanan PS. Raman spectroscopic studies on sodium metavanadate. J. Raman Spectrosc. 1983;14:401–405. doi: 10.1002/jrs.1250140608. [DOI] [Google Scholar]
- 46.Yan Y, Yu Y, Wu D, Yang Y, Cao Y. TiO2/vanadate (Sr10V6O25, Ni3V2O8, Zn2V2O7) heterostructured photocatalysts with enhanced photocatalytic activity for photoreduction of CO2 into CH4. Nanoscale. 2016;8:949–958. doi: 10.1039/C5NR05332C. [DOI] [PubMed] [Google Scholar]
- 47.Ai-ju X, Zhaorigtu B, Mei-lin J, Lin Q. Study on Performance of Ni3V2O8 Catalyst and Analysis of X-Ray Photoelectron Spectroscopy. Spectros. Spect. Anal. 2007;27:2134–2138. [PubMed] [Google Scholar]
- 48.Lei Y, et al. Rapid microwave-assisted green synthesis of 3D hierarchical flower-shaped NiCo2O4 microsphere for high-performance supercapacitor. ACS Appl. Mater. Interface. 2014;6:1773–1780. doi: 10.1021/am404765y. [DOI] [PubMed] [Google Scholar]
- 49.Santos DP, Bergamini MF, Fogg AG, Zanoni MVB. Application of a Glassy Carbon Electrode Modified with Poly(Glutamic Acid) in Caffeic Acid Determination. Microchim. Acta. 2005;151:127–134. doi: 10.1007/s00604-005-0374-z. [DOI] [Google Scholar]
- 50.Fernandes SC, Oliveira IRWZ, Vieira IC. A green bean homogenate immobilized on chemically crosslinked chitin for determination of caffeic acid in white wine. Enzyme Microb. Tech. 2007;40:661–668. doi: 10.1016/j.enzmictec.2006.05.023. [DOI] [Google Scholar]
- 51.Silva LF, Stradiotto NR, Oliveira HP. Determination of Caffeic Acid in Red Wine by Voltammetric Method. Electroanalysis. 2008;20:1252–1258. doi: 10.1002/elan.200704175. [DOI] [Google Scholar]
- 52.Carlo D, et al. Green synthesis of gold–chitosan nanocomposites for caffeic acid sensing. Langmuir. 2012;28(12):5471–5479. doi: 10.1021/la204924d. [DOI] [PubMed] [Google Scholar]
- 53.Zhang Y, et al. Electrochemical Behavior of Caffeic Acid Assayed with Gold Nanoparticles/Graphene Nanosheets Modified Glassy Carbon Electrode. Electroanal. 2013;25:1230–1236. doi: 10.1002/elan.201200587. [DOI] [Google Scholar]
- 54.Filik H, et al. Square-wave stripping voltammetric determination of caffeic acid on electrochemically reduced graphene oxide–Nafion composite film. Talanta. 2013;116:245–250. doi: 10.1016/j.talanta.2013.05.031. [DOI] [PubMed] [Google Scholar]
- 55.Leite FRF, Santos WJR, Kubota LT. Selective determination of caffeic acid in wines with electrochemical sensor based on molecularly imprinted siloxanes. Sensor. Actuat. B-Chem. 2014;193:238–246. doi: 10.1016/j.snb.2013.11.028. [DOI] [Google Scholar]
- 56.Kahl M, Golden TD. Electrochemical Determination of Phenolic Acids at a Zn/Al Layered Double Hydroxide Film Modified Glassy Carbon Electrode. Electroanal. 2014;26:1664–1670. doi: 10.1002/elan.201400156. [DOI] [Google Scholar]
- 57.David IG, et al. Rapid determination of total polyphenolic content in tea samples based on caffeic acid voltammetric behaviour on a disposable graphite electrode. Food Chem. 2015;173:1059–1065. doi: 10.1016/j.foodchem.2014.10.139. [DOI] [PubMed] [Google Scholar]
- 58.Hongjiao Z, et al. Highly Sensitive Determination of Caffeic Acid Using a Multiwalled Carbon Nanotubes Modified Electrode with NButylpyridinium Hexafluorophosphate Ionic Liquid and Chitosan as Binders. Int. J. Electrochem. Sci. 2016;11:2971–2981. [Google Scholar]
- 59.Ibarra-Escutia P, Gomez JJ, Calas-Blanchard C, Marty JL, Ramirez-Silva MT. Amperometric biosensor based on a high resolution photopolymer deposited onto a screen-printed electrode for phenolic compounds monitoring in tea infusions. Talanta. 2010;81:1636–1642. doi: 10.1016/j.talanta.2010.03.017. [DOI] [PubMed] [Google Scholar]
- 60.Diaconu M, Simona C, Litescu, Gabriel LR. Laccase–MWCNT–chitosan biosensor-A new tool for total polyphenolic content evaluation from in vitro cultivated plants. Sens. Actuators B-chem. 2010;145:800–806. doi: 10.1016/j.snb.2010.01.064. [DOI] [Google Scholar]
- 61.Cortina-Puig M, Murioz-Berbel X, Calas-Blanchard C, Marty JL. Diazonium-functionalized tyrosinase-based biosensor for the detection of tea polyphenols. Microchim. Acta. 2010;171:187–193. doi: 10.1007/s00604-010-0425-y. [DOI] [Google Scholar]
- 62.Karabiberoğlu ŞU, Ayan EM, Dursun Z. Investigation of thermodynamic parameters using an Ag nanoparticles modified poly (thiophene) film glassy carbon electrode. Electroanalysis. 2013;25:1933–1945. doi: 10.1002/elan.201300091. [DOI] [Google Scholar]
- 63.Kaoutit M. E. et. A comparison of three amperometric phenoloxidase–Sonogel–Carbon based biosensors for determination of polyphenols in beers. J. Cisneros, Food Chem. 2008;110:1019–1024. doi: 10.1016/j.foodchem.2008.03.006. [DOI] [PubMed] [Google Scholar]
- 64.Magarelli G, et al. Development and validation of a voltammetric method for determination of total phenolic acids in cotton cultivars. Microchem. J. 2013;109:23–28. doi: 10.1016/j.microc.2012.05.014. [DOI] [Google Scholar]
- 65.Blasco AJ, Gonz.lez MC, Escarpa A. Electrochemical approach for discriminating and measuring predominant flavonoids and phenolic acids using differential pulse voltammetry: towards an electrochemical index of natural antioxidants. Anal. Chim. Acta. 2004;511:71–81. doi: 10.1016/j.aca.2004.01.038. [DOI] [Google Scholar]
Associated Data
This section collects any data citations, data availability statements, or supplementary materials included in this article.


