Abstract
The major energy source for most cells is glucose, from which ATP is generated via glycolysis and/or oxidative metabolism. Glucose deprivation activates AMP-activated protein kinase (AMPK)1, but it has been unclear whether this occurs solely via changes in AMP or ADP, the classical activators of AMPK2–5. Here, we uncover a mechanism that triggers AMPK activation via an AMP/ADP-independent mechanism sensing absence of FBP, with AMPK being progressively activated as extracellular glucose and intracellular FBP decrease. When unoccupied by FBP, aldolases promote the formation of lysosomal complexes containing the v-ATPase, Ragulator, AXIN, LKB1 and AMPK, previously shown to be required for AMPK activation6,7. Knockdown of aldolases activates AMPK even in cells with abundant glucose, while the catalysis-defective D34S aldolase mutant, which still binds FBP, blocks AMPK activation. Cell-free reconstitution assays show that addition of FBP disrupts association of AXIN/LKB1 with v-ATPase/Ragulator. Importantly, in some cell types AMP:ATP/ADP:ATP ratios remain unchanged during acute glucose starvation, and intact AMP-binding sites on AMPK are not required for AMPK activation. These results establish that aldolase, as well as a glycolytic enzyme, is a sensor of glucose availability that regulates AMPK.
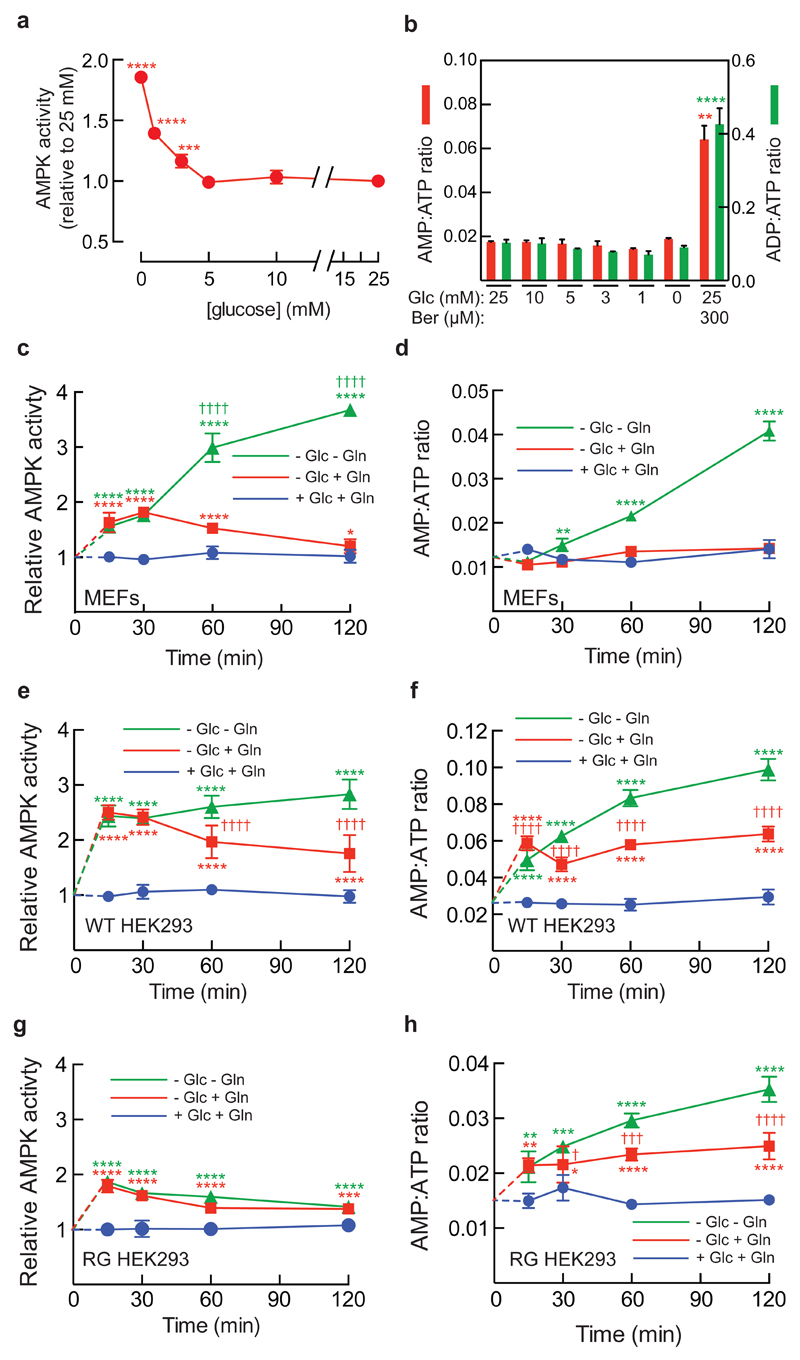
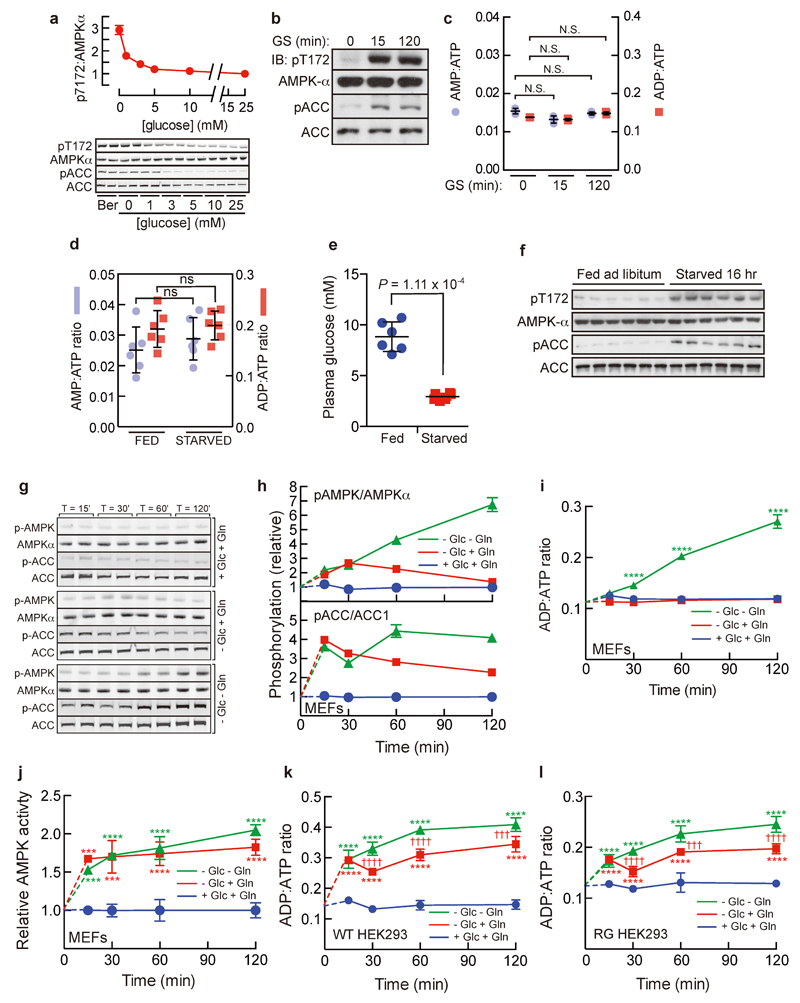
Mammalian AMPK is activated by glucose deprivation, and it has often been assumed that impaired production of ATP from reduced glucose metabolism triggers this by increasing levels of AMP/ADP1,8. Recently, glucose deprivation has been shown to trigger formation of a complex at the lysosomal surface involving the v-ATPase, Ragulator, AXIN, LKB1 and AMPK, promoting AMPK phosphorylation by LKB1 at the activating phosphorylation site, Thr1726,7. However, these findings did not reveal how glucose deprivation was sensed. To study this, we grew mouse embryo fibroblasts (MEFs) in standard medium, and then replaced the medium with reduced glucose, with other components unchanged. When glucose fell below 5 mM, progressive increases in immunoprecipitated AMPK activity occurred (Fig. 1a), correlating with phosphorylation of AMPK (p-AMPKα) and its downstream target acetyl-CoA carboxylase (pACC) (Extended Data Fig. 1a). Surprisingly, this was not associated with any increase in cellular AMP:ATP or ADP:ATP ratios, although both were increased by the mitochondrial inhibitor berberine (Fig. 1b), which caused comparable AMPK/ACC phosphorylation as complete lack of glucose (Extended Data Fig. 1a). Similar results were obtained in HEK293T cells (Extended Data Fig. 1b, c). No changes in adenine nucleotide ratios were observed in livers of mice starved for 16 h either, despite blood glucose dropping from 9 to 3 mM with accompanying increases in AMPK and ACC phosphorylation (Extended Data Fig. 1d-f). Combined starvation of MEFs for glucose, glutamine and serum (leaving them with no major carbon source) caused a rapid, 1.8-fold activation of AMPK within 15 min, followed by a much larger activation up to 2 h, while only the initial activation was observed if glutamine was still present (Fig. 1c); these changes correlated with phosphorylation of AMPK and ACC (Extended Data Fig. 1g, h). Intracellular AMP:ATP/ADP:ATP ratios were not significantly altered on removal of glucose alone, but on removing glucose and glutamine they increased after 30 min, correlating with the delayed AMPK activation (Fig. 1d; Extended Data Fig. 1i). Interestingly, we found the presence or absence of serum yielded different patterns of AMPK activation upon starvation for glucose or glucose plus glutamine (compare Fig. 1c and Extended Data Fig. 1j; see Supplementary Note 1). We also studied HEK293 cells that stably expressed FLAG-tagged wild type (WT) AMPKγ2 or the R531G (RG) mutant, which is not activated by treatments that increase cellular AMP/ADP9. In RG cells the rapid effect of removing glucose was still present, while the delayed effect of also removing glutamine was essentially absent (Fig. 1e-h; Extended Data Fig. 1k, l; Supplementary Note 2). Thus, glucose starvation activates AMPK by an AMP/ADP-independent mechanism, whereas removal of all carbon sources activates AMPK by the canonical AMP/ADP-dependent mechanism. The latter effect takes place after a delay of 20-30 minutes, which may represent the time taken to metabolize pyruvate in the medium and/or cellular nutrient reserves.
Figure 1. Glucose deprivation activates AMPK via an AMP/ADP independent mechanism.
a, MEFs were grown in full medium and then switched to medium containing reduced concentrations of glucose for 4 h, or full medium with 300 μM berberine (Ber) for 1 h, and AMPK activity in immunoprecipitates was measured (mean ± SD, n = 3; asterisks show significant differences from 25 mM glucose). b, MEFs were incubated as in (a) and intracellular AMP:ATP/ADP:ATP ratios determined by LC:MS. Results are mean ± SD, n = 3; asterisks show significant differences from control with 25 mM glucose. c, MEFs were grown in full medium and then incubated overnight in the same medium but with 5 mM glucose. At time zero, medium was removed and replaced with the same medium (+Glc+Gln), medium lacking glucose only (-Glc+Gln), or medium lacking glucose and glutamine (-Glc-Gln), all without serum. AMPK was isolated by immunoprecipitation (IP) and kinase activity determined. Results are mean ± SD, n = 4; asterisks show significant differences from control (+Glc+Gln); daggers (†) show significant differences between -Glc+Gln and -Glc-Gln samples at the same time point. d, AMP:ATP ratios in an experiment as in c. Results are mean ± SD (n = 3); statistical significance as in c. e, g, as c, but using HEK293 cells expressing wild type (WT) FLAG-tagged AMPK-γ2 (e) or an AMP/ADP-insensitive R531G (RG) mutant9 (g). Results are mean ± SD, n = 4; statistical significance as in c. f, h, as d, but using HEK293 cells expressing WT or RG mutant. Results are mean ± SD, n = 3; statistical significance as in c. All experiments were performed at least twice.
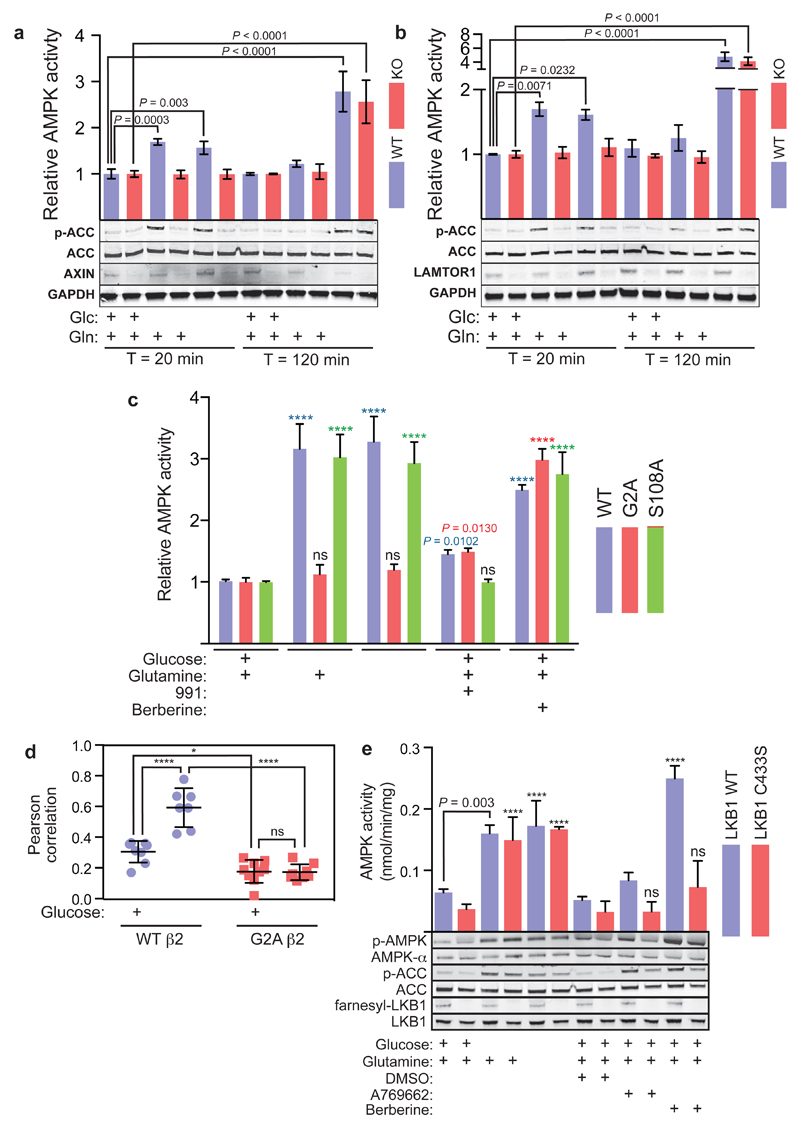
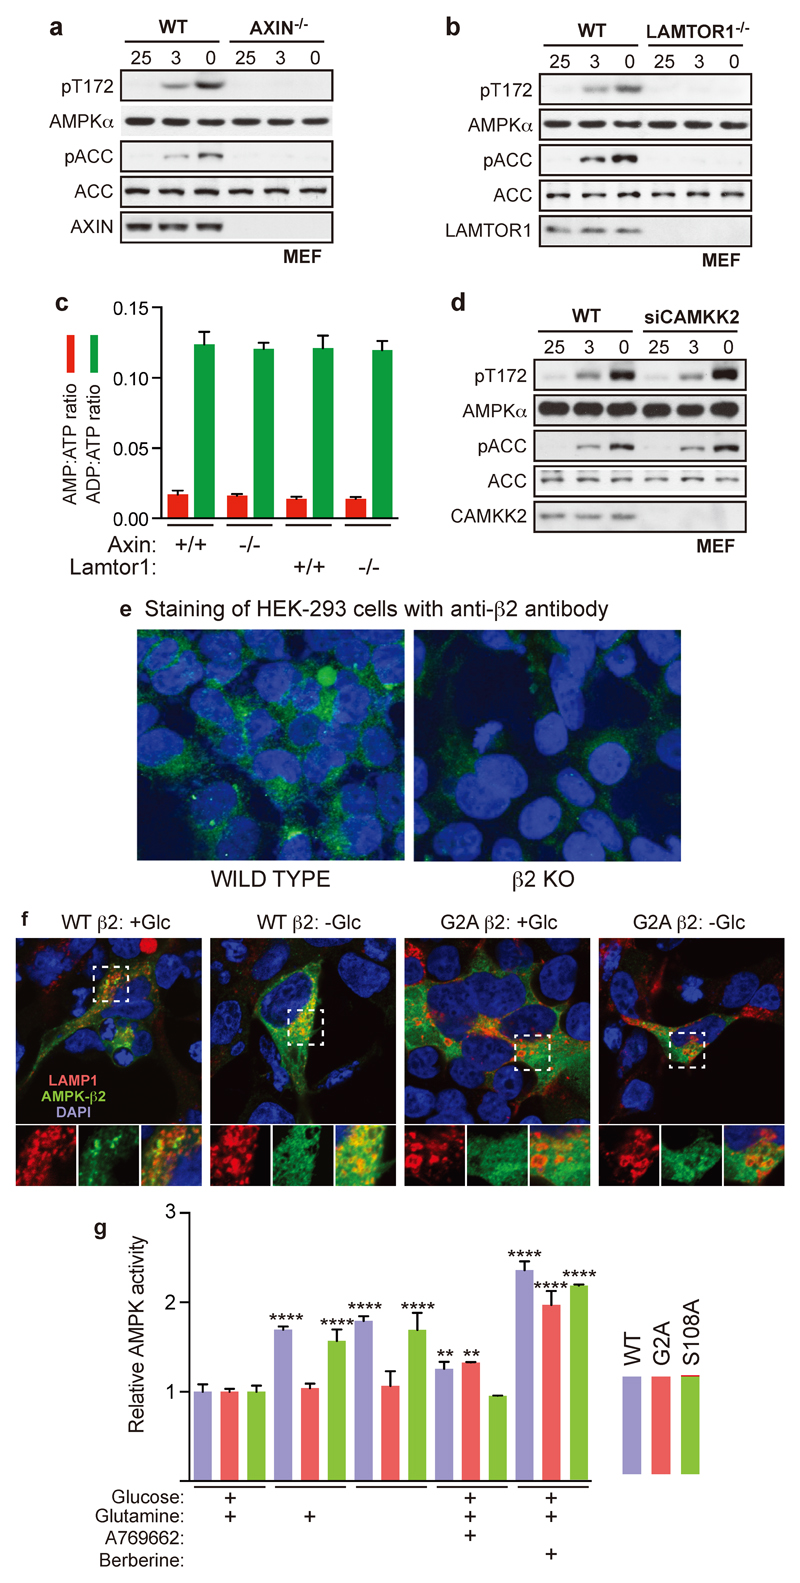
We next tested the effects of nutrient removal in AXIN-/- or LAMTOR1-/- MEFs, and found that acute (20 min) AMPK activation on removal of glucose or glucose plus glutamine was completely abolished, while the larger effects of removing both carbon sources at 2 h were unaffected (Fig. 2a, b; Extended Data Fig. 2a-c). Unlike WT AMPKβ2, re-introduction to knockout HEK293 cells of a G2A mutant (which prevents the N-myristoylation required for glucose starvation to cause AMPK accumulation in “perinuclear speckles”8,10) did not restore the ability of glucose removal to activate AMPK or promote its translocation to lysosomes (Fig. 2c, d, Extended Data Fig. 2e, f). Similar results were obtained with AMPKβ1 (Extended Data Fig. 2g). By contrast, knock-down of CaMKK2 (the alternate upstream kinase for AMPK), expression of the AMPKβ2-S108A mutation that disrupts the “ADaM” binding site for allosteric activators such as A769662 and 99111,12, or of the LKB1-C433S mutation that prevents the C-terminal farnesylation essential for maximal AMPK activation by energy stress13, had no effect on glucose starvation-induced AMPK activation (Fig. 2c, e; Extended Data Fig. 2d). Thus, by several criteria AMPK activation by glucose removal occurs via a mechanism distinct from that involved in effects of energy stress or ADaM site ligands.
Figure 2. Glucose starvation activates AMPK by a lysosomal mechanism different from energy stress.
a-b, Rapid effect of glucose removal on AMPK, but not the delayed effect of removal of glucose and glutamine, is dependent on AXIN and LAMTOR1. Experiments were performed in MEFs without serum as in Fig. 1c, except that cells carried homozygous floxed alleles of the AXIN (AXINF/F) (a) or LAMTOR1 (LAMTOR1F/F) (b) genes. Prior to the experiment (36 h), MEFs were pre-treated with adenoviral vector expressing either Cre recombinase or empty vector. Samples were taken for AMPK assay; results in the top panels are mean ± SD, n = 4. The lower panels show western blotting of cell lysates using the indicated antibodies. c, Endogenous AMPKβ2 was knocked out in HEK293 cells by CRISPR-Cas9, and WT β2, or G2A or S108A mutants, were re-expressed by transient transfection. Cells were then treated by removing glucose, or glucose plus glutamine, for 20 min as in a, or with 5 µM 991 or 300 µM berberine for 1 h, all without serum. AMPKβ2 complexes were immunoprecipitated and AMPK activity determined. Results are mean ± SD, n = 4; asterisks or exact P values indicate means significantly different from controls (left-hand columns) of the same genotype. d, Glucose starvation causes translocation of AMPKβ2 to the lysosome in HEK-293 cells that is dependent on N-myristoylation. The data are derived from the experiment shown in Extended Data Fig. 2f. Pearson correlations between red (lysosomes) and green (AMPK-β2) stain across the cytoplasm were determined; results are for 7-9 cells under each condition, with horizontal bars representing mean ± SD. e, MEFs expressing WT LKB1 or a C433S knock-in13 were incubated ± glucose and/or glutamine for 20 min, or with DMSO, A769662 (300 µM) or berberine (300 µM) for 1 h, all without serum. Endogenous AMPK was immunoprecipitated and assayed (top) or lysates were analysed by Western blotting using the indicated antibodies (bottom). Results in the top panel are mean ± SD, n = 4; asterisks or exact P values show results significantly different from controls in full medium (removal of glucose and/or glutamine) or DMSO controls (A769662 and berberine). All experiments were performed at least twice.
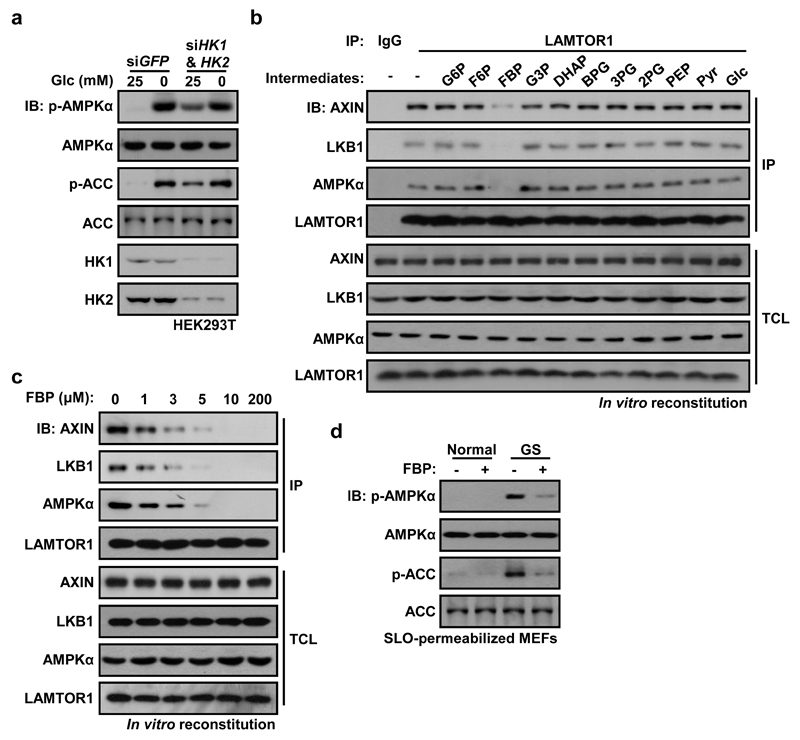
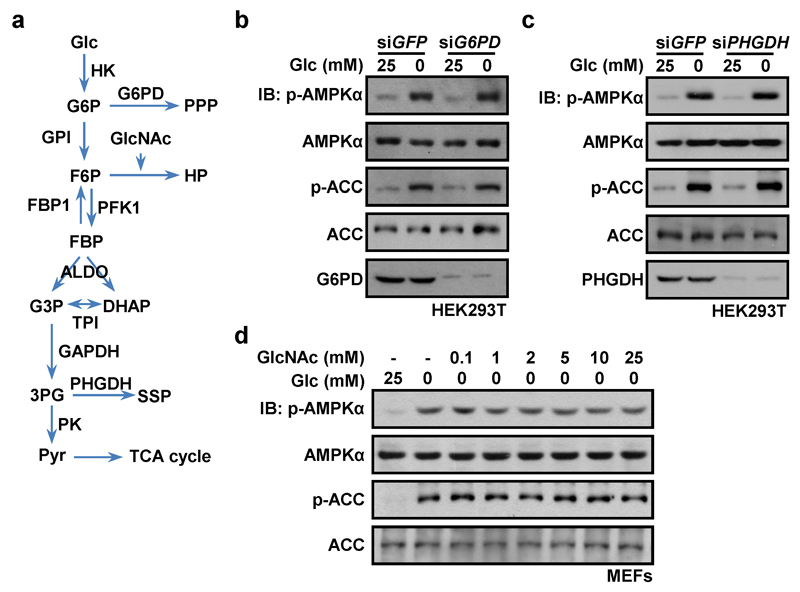
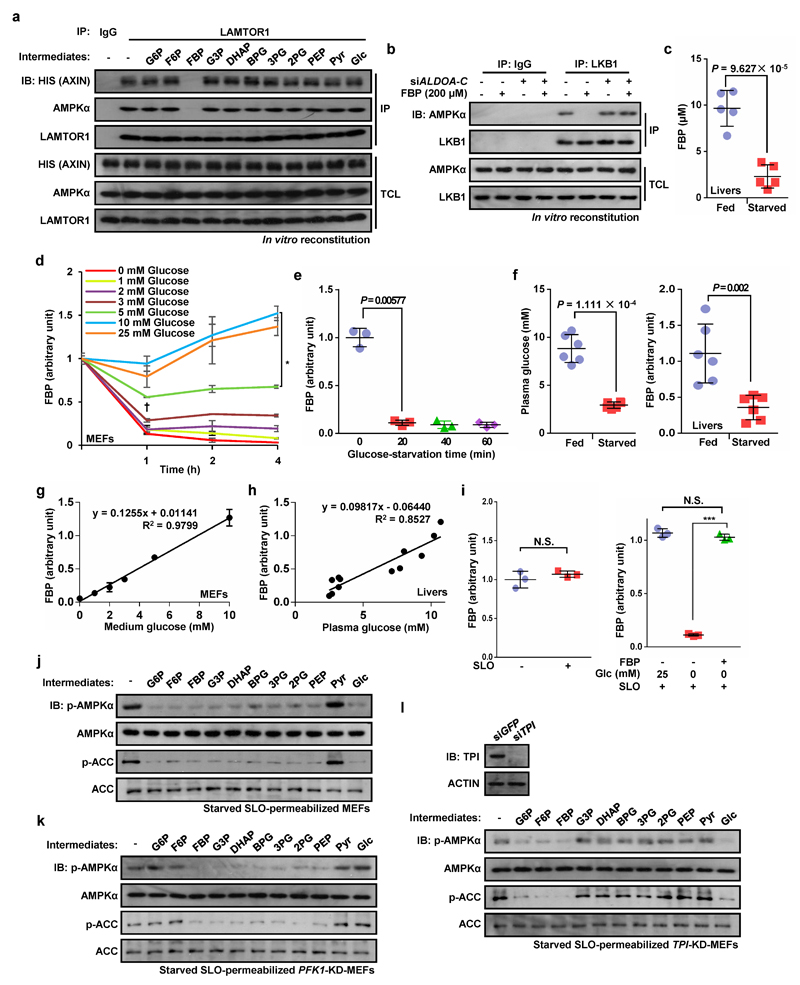
We next analyzed whether it is lack of glucose itself, or deficiency of a downstream metabolite (Extended Data Fig. 3a), that is responsible for AMPK activation. We first knocked down hexokinases (HK1/HK2) in HEK293T cells, which caused marked phosphorylation of AMPK and ACC even in high glucose (Fig. 3a). However, intermediates in the pentose phosphate, serine biosynthesis or hexosamine pathways did not appear to be involved in AMPK regulation (Extended Data Fig. 3b-d). Since AMPK was still activated by glucose deprivation even in medium containing 1 mM pyruvate (Fig. 1; Extended Data Fig. 1), this left a glycolytic intermediate as the most likely regulator of AMPK. To address this, we used cell-free reconstitution assays involving complex formation between LAMTOR1, AXIN/LKB1 and AMPK6. Of the eleven intermediates from glucose to pyruvate, only FBP caused dissociation of AXIN/LKB1 and AMPKα from LAMTOR1 in a fraction containing lysosomal membranes from glucose-starved MEFs (Fig. 3b; Extended Data Fig. 4a, b). The intracellular levels of FBP in mouse liver decreased markedly, from 9.7 ± 1.9 to 2.3 ± 1.2 µM, after starvation for 16 h (Extended Data Fig. 4c). Significantly, 10 µM FBP was able to cause complete dissociation of AXIN/LKB1 from LAMTOR1 (Fig. 3c). Interestingly, the relationship between the concentrations of medium/plasma glucose and intracellular FBP was linear, both in MEFs and in liver in vivo (Extended Data Fig. 4d-h).
Figure 3. Absence of fructose-1,6-bisphosphate (FBP) defines a starvation signal for AMPK activation.
All intact cell experiments in this Figure were performed in the presence of 10% serum. a, HEK293T cells were infected with lentivirus expressing indicated siRNAs; the cells were then starved for glucose for 2 h, followed by analysis of p-AMPKα and p-ACC levels. b, Cytosol from unstarved MEFs was mixed with light organelles purified from glucose-starved MEFs. Various glycolytic intermediates (200 μM) as indicated were individually added to the mixture. The mixtures were then dissolved and LAMTOR1 was immunoprecipitated. c, FBP at physiologically relevant concentrations completely dissociates AXIN/LKB1 from LAMTOR1. d, FBP (10 μM) was added to the 2-h-glucose-starved MEFs pre-incubated with streptolysin O (SLO) for 5 min. After incubating for another 15 min, cells were lysed and were analyzed by immunoblotting. Experiments in a, b and d were performed 3 times, and the experiments in c twice.
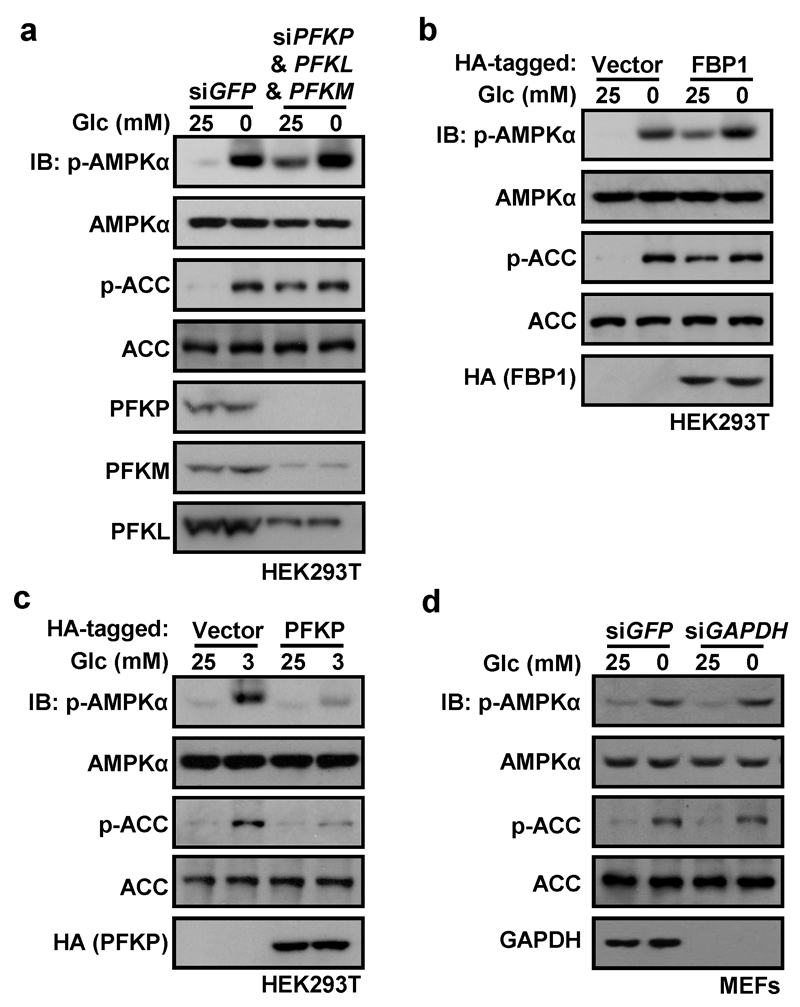
To confirm that FBP represses AMPK activation, we introduced it into glucose-starved cells permeabilized with streptolysin O (SLO) (Extended Data Fig. 4i). Addition of 10 µM FBP to the SLO-treated cells reduced AMPK phosphorylation under glucose starvation conditions (Fig. 3d). Interestingly, addition of intermediates upstream or downstream of FBP had similar effects except for pyruvate, which cannot be converted back to FBP in these cells (Extended Data Fig. 4j). However, intermediates upstream of FBP failed to suppress AMPK in SLO-permeabilized MEFs with knockdown of phosphofructokinase-1 (PFK1-KD, triple knockdown of PFKP, PFKM and PFKL), while intermediates downstream of FBP failed to suppress AMPK in SLO-permeabilized MEFs with knockdown of triose-phosphate isomerase (TPI-KD) (Extended Data Fig. 4k, l). Furthermore, inhibiting FBP production by knocking down PFK1 or over-expressing fructose-1,6-bisphosphatase (FBP1) led to AMPK phosphorylation even in high glucose (Extended Data Fig. 5a, b). By contrast, promoting formation of FBP by over-expressing PFKP impaired AMPK activation in low glucose (Extended Data Fig. 5c). Knockdown of glyceraldehyde-3-phosphate dehydrogenase (GAPDH) had no effect on AMPK activation (Extended Data Fig. 5d).
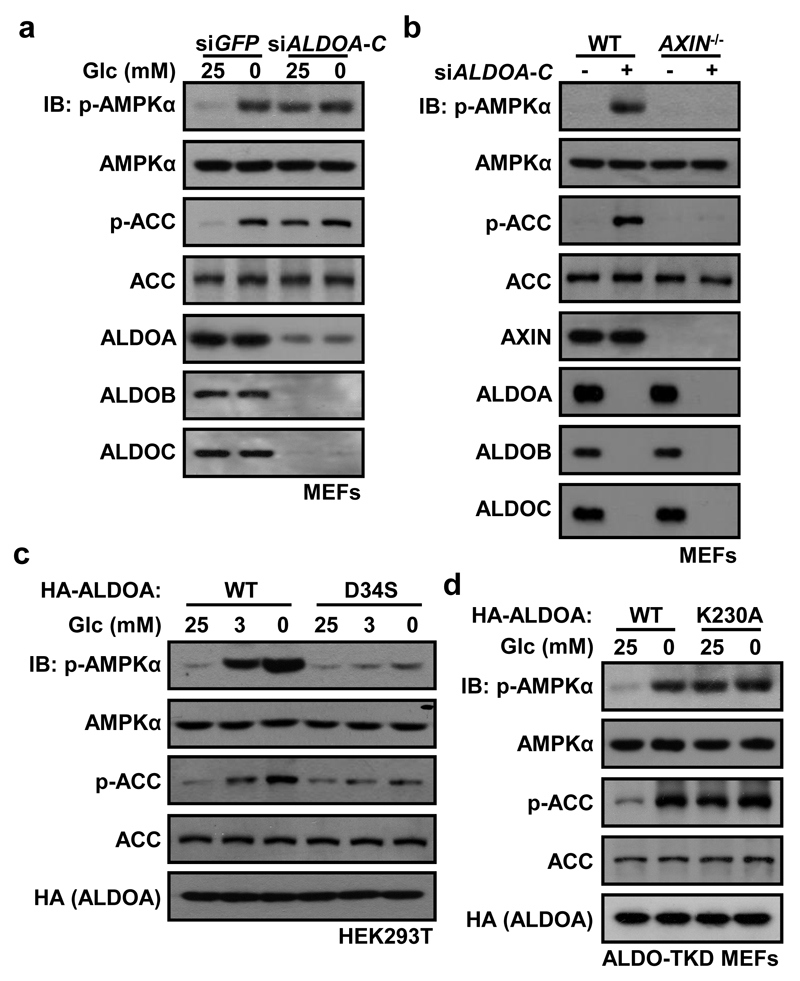
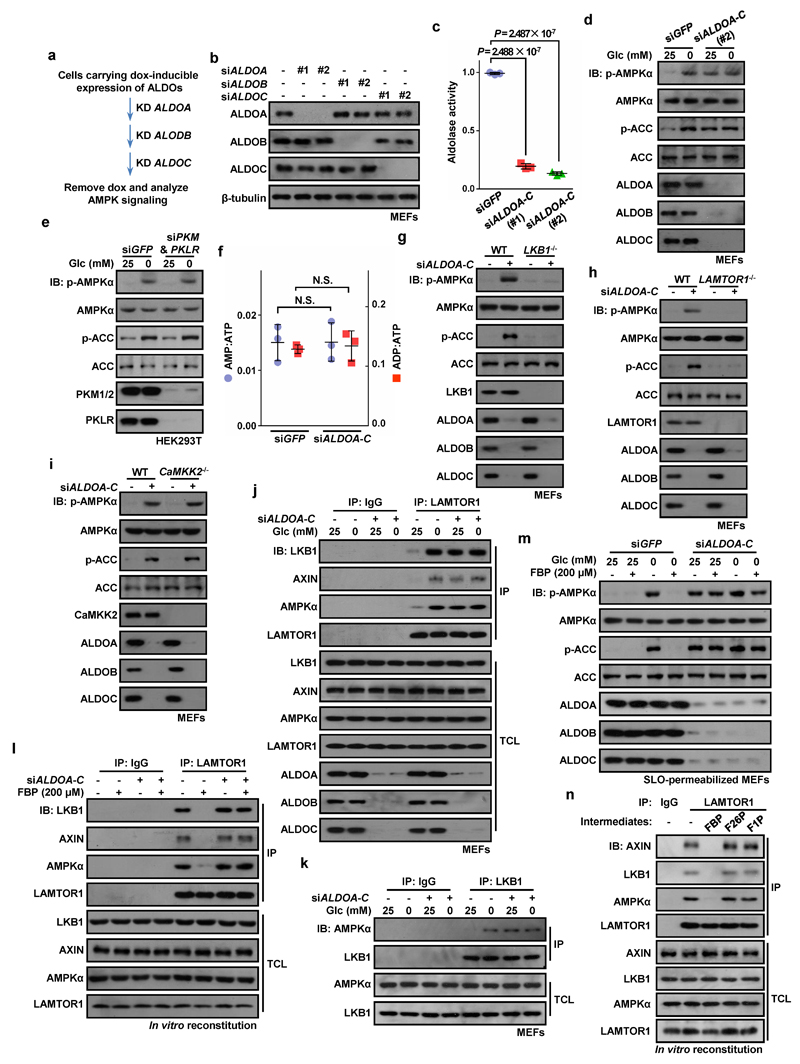
We next asked which protein acts as the FBP sensor responsible for regulating AMPK. FBP is a substrate for aldolases (ALDOA-C) and an allosteric activator of pyruvate kinase (PK)14. Knockdown of aldolases causes cell death15, so ALDOA-C was first expressed under a doxycycline-inducible promoter before successive knockdown of the three endogenous isoenzymes, and doxycycline was then withdrawn to trigger almost complete aldolase depletion (Extended Data Fig. 6a-c). The triple knockdown (ALDO-TKD) caused AMPK activation even in high glucose (Fig. 4a; Extended Data Fig. 6d), while knocking down pyruvate kinases (PKM/PKLR) had no effect (Extended Data Fig. 6e). Triple knockdown of aldolases did not alter AMP:ATP/ADP:ATP levels (Extended Data Fig. 6f). Moreover, the effects of aldolase knockdown on AMPK activation and formation of AMPK-activating complexes were blocked in AXIN-/-, LAMTOR1-/- and LKB1-/- MEFs, but intact in CaMKK2-/- MEFs (Fig. 4b; Extended Data Fig. 6g-k and 7), confirming that aldolase exerts its effects through the lysosomal pathway. Importantly, FBP, even at 200 μM, failed to dissociate AXIN/LKB1 from LAMTOR1 in light organelles isolated from glucose-starved, aldolase-deficient MEFs, or to block glucose starvation-induced AMPK activation in SLO-permeabilized, aldolase-deficient MEFs (Extended Data Fig. 6l, m). These results show that aldolase is required for FBP to prevent AMPK activation. Neither fructose-1-phosphate (an alternate aldolase substrate) nor fructose-2,6-bisphosphate dissociated AXIN/LKB1 from LAMTOR1 (Extended Data Fig. 6n), indicating that FBP is the unique intermediate that modulates aldolase to sense availability of glucose.
Figure 4. Aldolase is the receptor for FBP physically linking glucose deprivation to AMPK activation.
All intact cell experiments in this Figure were performed in the presence of 10% serum. a, b, ALDO-TKD MEFs were generated from WT MEFs (a) or AXIN-/- MEFs (b) following the procedures depicted in Extended Data Fig. 6a. The cells were then incubated in the DMEM medium with or without glucose for 2 h, followed by analysis of p-AMPKα and p-ACC levels. c, d, Activation of AMPK in HEK293T cells stably expressing ALDOA-D34S (c), or in ALDO-TKD MEFs stably expressing ALDOA-K230A (d) were analyzed as in a. The experiment in a was performed 4 times, that in b and d twice, and that in c 3 times.
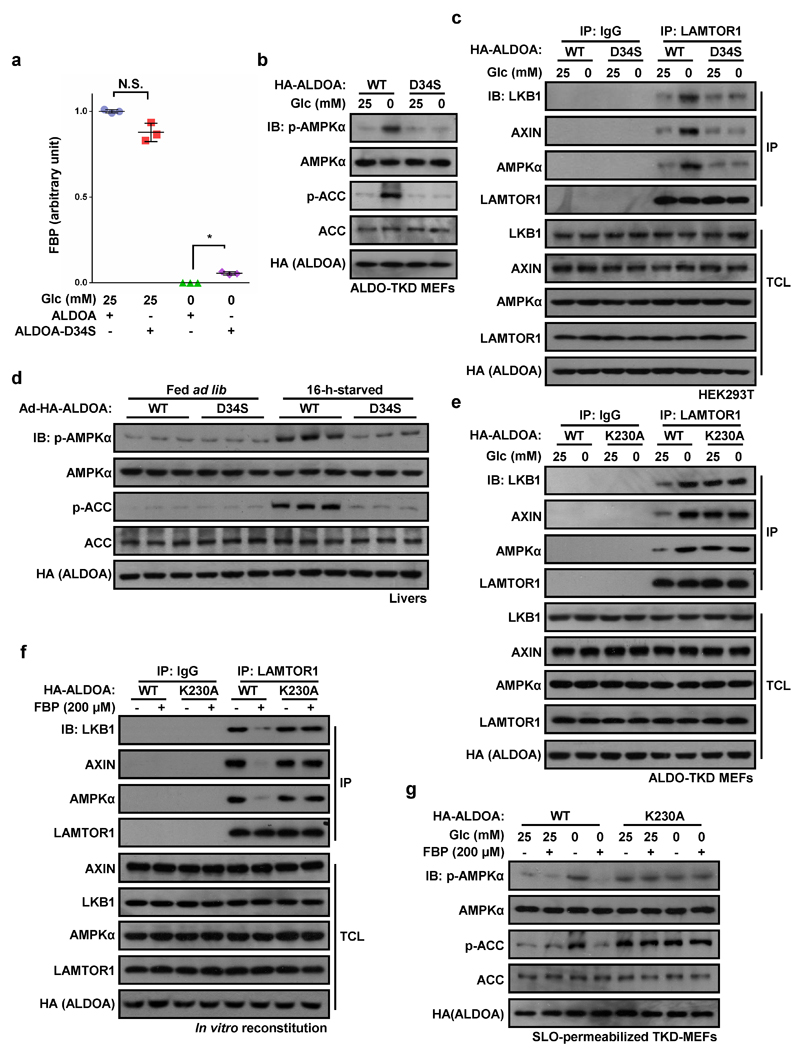
As final confirmation, we made use of an ALDOA mutation (D34S) that does not significantly affect Km for FBP, but dramatically reduces the kcat for conversion of FBP to DHAP and G3P16,17. FBP would therefore accumulate in the active site of this mutant, even when glucose availability was low. Supporting this, intracellular levels of FBP were slightly (but significantly) higher on glucose starvation of HEK293T cells expressing the D34S mutant than wild type ALDOA (Extended Data Fig. 8a). As expected, AMPK activation and formation of the Ragulator-AXIN/LKB1-AMPK complex were markedly impaired in HEK293T cells or ALDO-TKD MEFs expressing this mutant (Fig. 4c; Extended Data Fig. 8b, c). Furthermore, the levels of p-AMPK/p-ACC were greatly reduced in starved mice injected with adenovirus expressing the D34S mutant compared to WT aldolase (Extended Data Fig. 8d). By contrast, when WT ALDOA was expressed in ALDO-TKD MEFs, it restored the response of AMPK to glucose availability, whereas the K230A mutant, which cannot form the initial Schiff base with FBP and would thus not undergo the conformational change induced by FBP16,18,19, failed to do this (Fig. 4d; Extended Data Fig. 8e-g).
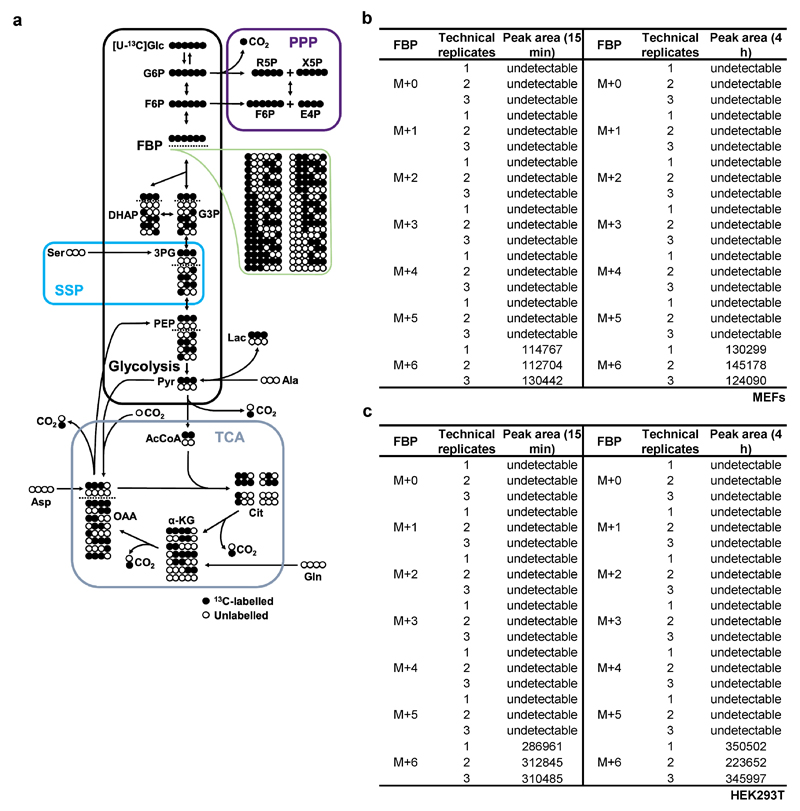
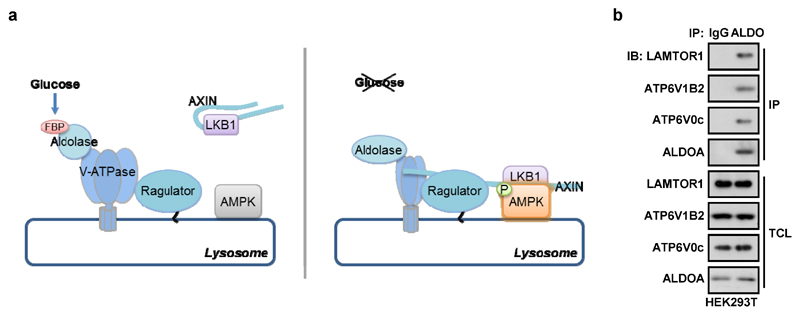
This study defines FBP as the critical metabolite that signals glucose availability, and provides strong evidence that aldolases are the sensors that transmit the signal to AMPK. In MEFs and HEK293T cells, FBP was almost entirely derived from glucose (Extended Data Fig. 9), and the intracellular concentrations of FBP correlated with medium/plasma glucose (Extended Data Fig. 4g, h). We propose that aldolase, as a natural FBP receptor, transmits the effects of glucose shortage to AMPK via the v-ATPase-Ragulator-AXIN/LKB1 complex (Extended Data Fig. 10a). Knockdown of aldolase triggers formation of this complex even in high glucose, like pharmacological inhibition of v-ATPase6. Intriguingly, yeast and mammalian aldolases (Fba1 and ALDOA/B/C) physically interact with various subunits of the v-ATPase and are required for assembly and activity of the v-ATPase complex20–23. Our co-precipitation assays confirmed that aldolase interacts with v-ATPase and Ragulator in HEK293T cells (Extended Data Fig. 10b).
According to our model, aldolase would function as a surveillance system, sensing a fall in glucose availability before any fall in cellular energy status occurs, and activating AMPK in an AMP/ADP-independent manner. Aldolases may be ideal sensors of glucose availability because they are not saturated with FBP at normal glucose concentrations, so that FBP availability can be sensed across the entire physiological range (Supplementary Note 3). Once activated, AMPK would promote alternate catabolic pathways to generate ATP, such as fatty acid oxidation. Our findings that cellular energy status was not compromised by glucose removal in MEFs, unless glutamine was also removed, suggest that glucose-deprived MEFs simply switch to oxidative metabolism from glutamine. While AMP promotes the interaction of AMPK with AXIN7, low, basal levels of AMP may be sufficient for AMPK activation via the lysosomal mechanism6, whereas higher concentrations (sufficient to cause binding at site 3, the low affinity site disrupted by the RG mutation24) may be necessary to trigger the canonical energy-sensing mechanism. Finally, since the budding yeast AMPK orthologue is activated by glucose starvation but is not regulated by AMP25, while the interaction between aldolase and v-ATPase is modulated by glucose availability in yeast22, we propose that the mechanism for AMPK regulation identified here may reflect its ancestral role in glucose sensing.
Methods
Data reporting
No statistical methods were used to predetermine sample size. The experiments were not randomized. The investigators were not blinded to group allocation and outcome assessment.
Mouse studies
AXINF/F, LAMTOR1F/F mice were generated and maintained as described6. LKB1F/F mice were obtained from Frederick National Laboratory for Cancer Research provided by Dr. Ron DePinho. CaMKK2-/- mice were obtained from The Jackson Laboratory, provided by Dr. Talal Chatila. Male C57BL/6J littermate mice of 6-week old were used in this study. Mice were housed with free access to water and standard diet (65% carbohydrate, 11% fat, 24% protein). The light was on from 8 a.m. to 8 p.m. Adenovirus was propagated in AD293 (Adeno-X 293) cells and purified by cesium chloride density gradient ultracentrifugation. Adenoviruses (1.3 × 10⁹ plaque-forming units) were injected via the tail vein five days before analysis. For starvation, the diet was withdrawn from the cage at 5 p.m. and mice were sacrificed at 9 a.m. the next day by cervical dislocation. Unless stated otherwise, liver tissues were dissected and instantly frozen in liquid nitrogen for further use. Protocols for all animal experiments were approved by the Institutional Animal Care and the Animal Committee of Xiamen University.
Plasmids
Point mutations of ALDOA were performed by a PCR-based site-directed mutagenesis method using PrimeSTAR HS polymerase (Takara). Expression plasmids for various proteins were constructed in the pCDNA3.3 vector for transient transfection, in pBOBI for lentivirus packaging (stably expression), or in pLVX-IRES for doxycycline-inducible expression. PCR products were verified by sequencing (Invitrogen, China). The lentivirus-based vector pLL3.7 was used for expression of siRNA in HEK293T and MEFs. The 19-nucleotide sequence for each siRNA is as follows: 5’-CCAAGTGGCGCTGTGTGCT-3’ (#1) and 5’-GCCATGGGCCTT GACTTTC-3’ (#2) for mouse ALDOA, 5’-GCTCTCTGAGCAGATCCAT-3’ (#1) and 5’-GGCAGTTCCGAGAACTCCT-3’ (#2) for mouse ALDOB, 5’-GAGTCTAGAGC TTATGTCT-3’ (#1) and 5’-CAGTTACCCTTGATGGTAT-3’ (#2) for mouse ALDOC, 5’-GGGACATCAAACCTTCCAA-3’ for mouse CaMKK2, 5’-GATGAAAGGGAAGCTGGCA -3’ for mouse TPI, 5’-CCGAGAACACCGAGGAGAA-3’ for human ALDOA, 5’- CCAAAGCCCTGGAAACTAA -3’ for human ALDOB, and 5’-CCTCAAACGTTGTCAGTAT -3’ for human ALDOC. The siRNAs against human HK1, HK2, PFKM, PFKL, PFKP, G6PD (#1) and PHGDH (#1) were constructed and validated as described previously26. The siRNA against mouse GAPDH was constructed as described previously27. Human ALDOA and ALDOA-D34S were constructed in pAdEasy-1 (Stratagene) for adenovirus packaging. Sequences of all oligonucleotides used in this study are available upon request.
CRISPR knockout of AMPK-β1 and β2
The genes (PRKAB1 and PRKAB2) were deleted from HEK293 cells using the CRISPR-Cas9 system28. Targeting nucleotides for β1 were caccGTGAGCGCGCCGCGCTGGAG (a.a. 6-13) and caccGTGGCC ATAAGACGCCCCGG (a.a. 15-22) and for β2 were caccGCCAAGGCTGCACG CTCCGA (a.a. 15-27) and caccGTCGCTGGTGGTGTTTCCCA, (a.a. 1-7). Nucleotides were annealed to their complements containing the cloning tag aaac, and inserted into the back-to-back BbsI restriction sites of pSpCas9(BB)-2A-Puro (PX459) and pSpCas9(BB)-2A-GFP (PX458) (Addgene plasmids #48139 and #48138). Cells were transfected with a 1:1 mixture of GFP and Puro constructs containing the CRISPR oligonucleotides, using 2-3 µg DNA in Fugene 6 transfection reagent per well of a 6 well plate. After 24 h, transfection was verified by fluorescence microscopy and cells trypsinised from the plates and re-plated into 15 cm dishes in the presence of puromycin (0.6 µg/ml). After 24 h the medium was changed, fresh puromycin added and cells grown for a further 48 h, at which time cells were transferred to medium without puromycin and allowed to grow until colonies formed. Colonies (20-30) were picked and expanded until large enough to allow freezing of stocks and analysis of AMPK-β2 expression by Western blot and immunoprecipitate kinase assay.
Reagents
Rabbit polyclonal antibody against LAMTOR1 was raised and validated as described previously6, and was diluted 1:100 for immunoprecipitation (IP) or 1:500 for immunoblotting (IB). Rabbit polyclonal antibody against PFKM was raised and validated as described previously26 and was diluted 1:500 for IB. Rabbit anti-phospho-AMPKα-T172 (cat. #2535, 1:1000 for IB), anti-AMPKα (cat. #2532, 1:1000 for IB), anti-phospho-ACC-Ser79 (cat. #3661, 1:1000 for IB), anti-ACC (cat. #3662, 1:1000 for IB), anti-LKB1 (cat. #3047, 1:1000 for IB), anti-AXIN1 (cat. #2074, 1:1000 for IB), anti-HK1 (cat. #2024, 1:1000 for IB), anti-HK2 (cat. #2867, 1:1500 for IB), anti-PFKP (cat. #8164, 1:1000 for IB), anti-PFKL (cat. #8175, 1:1000 for IB), anti-G6PD (cat. #12263, 1:1000 for IB), anti-PKM1/2 (cat. #3190, 1:1000 for IB), anti-ALDOA (cat. # 8060, 1:2000 for IB), anti-β-tubulin (cat. #2128, 1:1000 for IB), anti-AMPKβ1 (cat. #12063), anti-AMPKβ2 (cat. #4148), anti-HIS (cat. #12698, 1:500 for IB), and HRP-conjugated mouse anti-rabbit IgG (conformation specific, cat. #5127, 1:2000 for IB) antibodies were purchased from Cell Signaling Technology. In Figs. 1, 2 and Extended Data Fig. 1f, total ACC was detected using IR dye 800 conjugated streptavidin (Rockland, cat. #S000-32). Rabbit anti-ALDOB (cat. 18065-1-AP, 1:1000 for IB) and anti-CaMKK2 (cat. 11549-1-AP, 1:500 for IB) antibodies were purchased from Proteintech. Mouse anti-ALDOC (cat. AM2215b, 1:2000 for IB) antibody was purchased from Abgent. Rabbit anti-PKLR (cat. ab38240, 1:500 for IB), rat anti-LAMP2 (cat. ab13524; 1:120 for IF), mouse anti-LAMP1 [cat. ab25630, 1:120 for immunofluorescent staining (IF)], mouse anti-aldolase (cat. ab54770, 1:50 for IP), and goat anti-TPI (cat. ab28760, 1:1000 for IB) antibodies were purchased from Abcam. Mouse anti-PHGDH (cat. AMAB90786, 1:1000 for IB) and rabbit anti-GAPDH (cat. G9545, 1:1000 for IB) antibodies were purchased from Sigma. Goat anti-AXIN (cat. sc-8567, 1:100 for IP and 1:60 for IF), mouse anti-HA (cat. sc-7392, 1:2000 for IB), anti-LKB1 (cat. sc-32245, 1:100 for IP), and anti-goat IgG-HRP (cat. sc-2354, 1:5000 for IB) antibodies were purchased from Santa Cruz Biotechnology. The HRP-conjugated goat anti-mouse IgG (cat. 115-035-003, 1:5000 for IB) and HRP-conjugated goat anti-rabbit IgG (cat. 111-035-003, 1:5000 for IB) antibodies were purchased from Jackson ImmunoResearch. Glucose (cat. G7021), G3P (cat. G5251), DHAP (cat. D7137), 3PG (cat. P8877), 2PG (cat. 19710), PEP (cat. P7002), N-acetylglucosamine (cat. A3286), octyl β-D-glucopyranoside (ODG, cat. O8001) and SLO (cat. S5265) were purchased from Sigma. G6P (cat. sc-210728), F6P (cat. sc-202563) and FBP (cat. sc-214805) were purchased from Santa Cruz Biotechnology. BPG was customized from Triveni Interchem Pvt Ltd. Glutamax™ (cat. 35050) and sodium pyruvate (cat. 11360) was purchased from Gibco. Doxycycline (cat. S4163) was purchased from Selleckchem. Protease inhibitor cocktail was purchased from Roche (cat. 04693116001). [U-13C]glucose (cat. CLM-1396-PK) and [U-13C]FBP (cat. CLM-8962-0) were purchased from Cambridge isotope laboratories. Full names for glycolytic intermediates: Glc, glucose; G6P, glucose-6-phosphate; F6P, fructose-6-phosphate; G3P, glyceraldehyde-3-phosphate; DHAP, dihydroxyacetone phosphate; BPG, 1,3-bisphosphoglycerate; 3PG, 3-phosphoglycerate; 2PG, 2-phosphoglycerate; PEP, phosphoenolpyruvate; Pyr, pyruvate.
Cell culture, transient transfection and lentivirus infection
HEK293T, HEK293, AD293 cells and MEFs were maintained in Dulbecco’ s modified Eagle’ s medium (DMEM, Gibco, cat. 11965) supplemented with 10% fetal bovine serum (FBS), 100 IU penicillin, 100 mg/ml streptomycin at 37 °C in a humidified incubator containing 5% CO2. Polyethylenimine (Polysciences, Inc., Cat. #23966) at a final concentration of 10 μM was used to transfect HEK293T cells. Total DNA for each plate was adjusted to the same amount by using relevant empty vector. Transfected cells were harvested at 24 h after transfection. Lentivirus for infection of the MEFs was packaged in HEK293T cells using Lipofectamine 2000 (Invitrogen, Cat. 11668-027) transfection. At 30 h post transfection, medium was collected and added to the cells. The cells were incubated for another 24 h. LAMTOR1F/F, AXINF/F, LKB1F/F or CaMKK2-/- MEFs were established by introducing SV40 T antigen into primary cultured embryonic cells from a litter of corresponding mice. LAMTOR1-/-, AXIN-/- or LKB1-/- MEFs were generated by infecting LAMTOR1F/F, AXINF/F or LKB1F/F MEFs with adenoviruses expressing Cre recombinase for 12 h. The infected cells were then incubated in the fresh DMEM for another 8 to 10 h before further treatments. HEK293T cells were obtained from ATCC. HEK293 cells were obtained from Invitrogen. AD293 cells were obtained from Clontech. Cells were verified to be free of mycoplasma contamination and authenticated by STR sequencing. For starvation, cells were rinsed twice with PBS, and then incubated in glucose-free DMEM (Gibco, cat. 11966) supplemented with 10% FBS and 1 mM sodium pyruvate (Gibco, cat. 11360) for desired periods of time at 37 °C. For starvation for glucose plus glutamine, cells were incubated in DMEM without glucose, glutamine, phenol red or pyruvate (Gibco cat. A14430-01) with the addition of 1 mM pyruvate (Lonza cat. BE 13-11 SE) with or without Glutamax™ (Gibco cat. 35050-038) and D-glucose (Gibco cat. A2494001). For determining the effect of different glycolytic intermediates on affecting AMPK activation in cells, the cells were first permeabilized with SLO as described previously29 (incubated with SLO for 5 min). After incubating for another 15 min, cells were lysed and were analyzed by immunoblotting.
Immunoprecipitation and immunoblotting
IP was carried out as described previously6. Briefly, 10 × 15 cm dishes of MEFs (grown to 80% confluence) for immunoprecipitating LAMTOR1 or 4 × 15 cm dishes of MEFs (grown to 80% confluence) for immunoprecipitating AXIN in each lane were collected and lysed with 750 μl/dish of ice cold ODG buffer (50 mM Tris-HCl, pH 8.0, 50 mM NaCl, 1 mM EDTA, 1 mM EGTA, 2% ODG, 5 mM β-mercaptoethanol with protease inhibitor cocktail). Cell lysates were incubated with respective antibodies overnight. Overnight protein aggregates were pre-cleared by centrifugation at 20,000g for 10 min, and protein A/G beads (1:100 for immunoprecipitating AXIN and 1:250 for LAMTOR1) were then added into the lysates and mixed for another 3 h. The beads were washed with 100 times volume of ODG buffer for 3 times at 4°C and then mixed with an equal volume of 2× SDS sample buffer for immunoblotting. To analyze the levels of p-AMPKα and p-ACC in MEFs, cells grown to 70-80% confluence in a well of a 6-well dish were lysed with 250 μl of ice cold lysis buffer (20 mM Tris-HCl, pH 7.5, 150 mM NaCl, 1 mM EDTA, 1 mM EGTA, 1% Triton X-100, 2.5 mM sodium pyrophosphate, 1 mM β-glycerolphosphate, with protease inhibitor cocktail). The lysates were then centrifuged at 20,000g for 10 min at 4 °C and an equal amount of 2× SDS sample buffer was into the supernatant. The levels of p-AMPKα and p-ACC were then analyzed by immunoblotting. To analyze the levels of p-AMPKα and p-ACC in liver, the freshly excised liver tissues were added with ice cold lysis buffer (10 μl/mg liver weight), followed by homogenization and centrifugation as described above. The lysates were then mixed with 2× SDS sample buffer and then subjected to immunoblotting. Levels of total proteins and the levels of phosphorylation of proteins were analyzed on separate gels. The band intensities on developed films were quantified using Image J software (National Institutes of Health Freeware).
Fluorescence microscopy
Cells were grown on glass coverslips in 6-well dishes and were cultured to 60-80% confluence. Cells were fixed with 1 ml of 4% formaldehyde (diluted in PBS) at room temperature for 20 min. They were rinsed 2x with 1 ml of PBS (room temperature) and then permeabilized with 1 ml of 0.1% Triton X-100 (diluted in PBS) for 5 min at 4 °C. Cells were rinsed 2x with 1 ml of PBS, and were incubated with primary antibodies overnight at 4 °C. The cells were then rinsed 3x with 1 ml of PBS, and then incubated with Alexa-Fluor 488-conjugated anti-goat secondary antibody (Molecular Probes, A11058; diluted 1:100 in PBS) and Alexa-Fluor 594-conjugated anti-rat secondary antibody (Molecular Probes, cat. A21209; diluted 1:100 in PBS)/Alexa-Fluor 594-conjugated anti-mouse secondary antibody (Molecular Probes, cat. A11032; diluted 1:100 in PBS) for 8 h at room temp in the dark. They were washed for 4 times with 1 ml of PBS, and then mounted on slides by ProLong Diamond Antifade Mountant (Molecular Probes, cat. P36970). Cells were imaged under a Zeiss LSM 780. Samples were excited with Ar gas laser (Zeiss, laser module LGK 7812) using a 488-nm laser line for Alexa-Fluor 488 dye (green channel), and with HeNe gas laser (Zeiss, LGK 7512 PF) using a 594-nm laser line for Alexa-Fluor 594 dye (red channel). Confocal microscope pictures were taken with a 63× oil objective. The parameters, including PMT voltage, Offset, Pinhole and Gain were kept unchanged between each picture taken. For quantitative analyses in Fig. 2d, Pearson’s correlations were performed using Volocity 5.2 software, analyzing the whole cell but excluding the nucleus. For quantitative analyses in Extended Data Fig. 7a and 7b, colocalization percentages (determined by Mander’s overlap coefficient-the number of pixels from the red channel that overlap with pixels from the green channel divided by the total number of pixels detected in the red channel above the threshold value) were calculated by ZEN 2010 software (Zeiss). Thresholds were set automatically by the software using the method of Costes et al (2004)30.
AMPK assays
AMPK was assayed using the AMARA peptide as substrate in resuspended immunoprecipitates made using a equal mixture of anti-AMPKα1 and -AMPKα2 antibodies9, except for the assays in Fig 2c and Extended Data Fig. 2e where we immunoprecipitated using anti-AMPKβ2 and AMPKβ1 antibodies respectively, and Fig. 1g and 1i where we immunoprecipitated using anti-FLAG antibodies.
Aldolase assays
Aldolase enzymatic assay was performed as described previously31, in which 3-phosphoglyceraldehyde reacts with hydrazine to form hydrazone that absorbs at 240 nm. Briefly, MEFs (80% confluence grown in a 10-cm dish) were collected, washed with PBS, and lysed with 500 μl of digitonin solution (100 μg/ml PBS). Some 5 μl of cell lysate was incubated with EDTA (0.1 mM final concentration), iodoacetate (0.2 mM final concentration) and hydrazine (2.33 mM final concentration), and the digitonin solution was added to make a final volume of 300 μl. A blank read was taken at 240 nm. FBP (5 mM final concentration) were added and the OD240 was determined in 1 min intervals by a SpectraMax M5 microplate reader (Molecular Device). Enzymatic activity was determined in triplicate and normalized to the control.
In vitro reconstitution for lysosomal binding assays
The assays were performed as described previously6. Full length His-tagged AXIN was expressed and purified as described previously7. In general, each reconstitution reaction requires light organelles from two 15-cm dishes of MEFs and cytosol from four 15-cm dishes. Cells were scraped and spun down at 200g at room temperature, and then resuspended in 750 μl per 15-cm dish of fractionation buffer [50 mM KCl, 90 mM K-Gluconate, 1 mM EGTA, 5 mM MgCl2, 50 mM sucrose, 20 mM HEPES, pH 7.4, supplemented with 2.5 mM ATP, amino acids (Gibco, cat. 11130-077) and protease inhibitor cocktail] at room temperature, and were mechanically broken by spraying 6 times through a 22G needle, then yielding a post-nuclear supernatant (PNS) by spun at 2,000g for 5 min. The PNS was then spun at max speed for 15 min in a tabletop centrifuge. The light organelles (the pellets) were thus separated from the cytosol (the supernatants). Light organelles were then re-suspended with 100 μl of fractionation buffer containing glycolytic intermediates as indicated and were incubated at 37 °C, in the thermomixer at 400 r.p.m. for 15 min. Some 500 μl of cytosol or 1 μg of His-AXIN was then added to the mixture, followed by incubation at 37 °C for another 25 min. The mixtures were lysed with 800 μl of ODG buffer, followed by IP with antibody against LAMTOR1.
CE-MS-based analysis of metabolites
Sample preparation for CE (capillary electrophoresis)-MS was carried out as described previously32,33, with some modifications. In general, each measurement requires cells collected from a 10-cm dish (60-70% confluence) or 100 mg of liver tissue. For analysis of metabolites, cells were rinsed with 20 ml of 5% mannitol solution (dissolved in water) and instantly frozen in liquid nitrogen. Cells were then lysed with 1 ml of methanol containing internal standards 1 [IS1 (Human Metabolome Technologies, H3304-1002, 1:200), used to standardize the metabolite intensity and to adjust the migration time], and were scrapped off from the dish. For analysis of metabolites in liver, the fleshly excised tissue was freeze-clamped first, then washed in pre-cooled 5% mannitol solution and grinded in 1 ml of methanol with 50 μM IS1. The lysate was then mixed with 1 ml of chloroform and 400 μl of water by 20 s of vortexing. After centrifugation at 15,000g for 15 min at 4 °C, 450 μl of aqueous phase was collected and was then filtrated through a 5 kDa cutoff filter (Millipore, cat. UFC3LCCNB-HMT) by centrifuging at 10,000g for 3 h at 4 °C. Simultaneously, the quality control (QC) sample was prepared by combining 100 μl of the aqueous phase from each samples and then filtered. The filtered aqueous phase was then freeze-dried in a vacuum concentrator and then dissolved in water containing internal standards 3 [IS3 (Human Metabolome Technologies, H3304-1104, 1:200), to adjust the migration time]. 20 μl of re-dissolved solution was then loaded into an injection vial with a conical insert for CE-TOF MS (Agilent Technologies 7100, equipped with 6224 mass spectrometer) analysis. Instrumental analysis and data processing were performed as described previously. For quantifying absolute concentrations of FBP, [U-13C]FBP (10 μg/mL) was used as internal standard. A standard curve and a two parameter polynomial equation were generated by plotting the ratios of unlabeled FBP:labelled FBP (peak area:peak area) against the concentrations of unlabeled FBP. The amount of FBP was then estimated according to the equation. The total concentrations of FBP in mouse liver ([FBP]liver) were obtained by dividing the values of the amount of FBP by the estimated volume of liver. The concentrations of free-state FBP were then estimated, according to the value of [FBP]liver, as described previously.
ATP, ADP and AMP detection by LC-MS
The three compounds (ATP, ADP and AMP) levels were measured using a TSQ Quantiva interfaced with Ultimate 3000 Liquid Chromatography system (ThermoScientific), equipped with a porous graphitic carbon column (HyperCarb 30x1mm ID 3 μm; Part No: C-35003-031030, Thermo-Scientific). Mobile phase buffer A consisted of 0.3% (v/v) formic acid adjusted to pH 9 with ammonia prior to a 1/10 dilution. Mobile phase buffer B was 80% (v/v) acetonitrile. The column was maintained at a controlled temperature of 30°C and was equilibrated with 10% buffer B for 5 minutes at a constant flow rate of 0.06 mL/min. Aliquots of 1 µL of each sample were loaded onto the column and compounds were eluted from the column with a linear gradient of 10%-60% buffer B over 9 min. Buffer B was then increased to 100% within 1 min, and the column was washed for a 5 min with 100% Buffer B. Eluents were sprayed into the TSQ Quantiva using Ion Max NG ion source with ion transfer tube temperature set to 350°C and vaporizer temperature 125°C. The TSQ Quantiva was run in negative mode with a spray voltage of 2600, sheath gas 40 and Aux gas 10. Levels of ATP, ADP and AMP were measured using multiple reactions monitoring mode (MRM) with optimised collision energies and radio frequencies previously determined by infusing pure compounds. Three transitions were used to monitor each of the three compounds, ATP (505.92>158.98, 505.92>408.12 and 505.92>426.12), ADP (426.98>158.98, 426.98>328.78 and 426.98>409.09) and AMP (345.96>134.20, 345.96>151.27 and 345.96>211.12).
Statistical analysis
For experiments in Fig. 1 and 2 and Extended Data Fig. 1 and 2, 1-way or 2-way ANOVA was performed with Holm-Sidak’s multiple comparison test (by GraphPad Prism 6 for MacOS), unless specified otherwise. For all other experiments, 1-way or 2-way ANOVA with post hoc analysis was used to compare values among different experimental groups. For experiments with only two groups, a two-tailed Student’s t test was used as specified in the figure legends. For ANOVA, the homogeneity of variance was tested by Levene’s test. If the results are similar, the Tukey's test was preceded, and if not, the Games-Howell’s test was preceded. Similar procedures were followed when Student's t test was performed. No samples or animals were excluded from the analysis. Tests were performed with SPSS Statistics 17.0 program, and P < 0.05 was considered statistically significant. Where exact P values are not shown, statistical significance is shown as */† P < 0.05, **/†† P < 0.01, ***/††† P < 0.001, ****/†††† P < 0.0001.
Extended Data
Extended Data Figure 1. Glucose deprivation activates AMPK via an AMP/ADP independent mechanism.
a, Phosphorylation of AMPK (pT172) and ACC (pACC) analyzed by immunoblotting from the experiment shown in Fig. 1a; the upper panel shows quantification of the pT172:AMPKα ratios (mean ± SD, n = 2). b-c, Glucose deprivation rapidly activates AMPK without altering cellular AMP:ATP or ADP:ATP ratios in HEK293T cells. Cells were grown in full medium (25 mM glucose, 4 mM alanyl-glutamine, 1 mM pyruvate, 10% serum) and then switched to medium without glucose, with other components unchanged, for 15 min or 2 h. AMPK activation was monitored by immunoblotting for p-AMPKα and p-ACC (a), and intracellular AMP:ATP/ADP:ATP ratios determined by CE:MS (b, results are mean ± SD, n = 3). d, Adenine nucleotide ratios are unaltered in mouse liver after starvation. Mice were fed ad libitum or fasted for 16 h, freeze-clamped liver samples prepared, and AMP:ATP/ADP:ATP ratios measured by CE-MS. Results are mean ± SD, n = 6; ns, not significant by Student’s t-test. e, Decrease in plasma glucose concentrations induced by fasting mice for 16 h. Mice from the same experiment shown in Fig. 1d were either fed ad libitum or were deprived of food for 16 h and plasma glucose determined. Circles are individual data points and horizontal lines are means ± SD, n = 6; P value computed by Student’s t test. f, Extracts were prepared from livers of mice treated as in d (6 mice per group) and analysed by Western blotting using the indicated antibodies. g, Western blots from the same experiment shown in Fig. 1c. Although shown as separate panels, the blots with each antibody were from the same gel scanned at the same time, and are therefore directly comparable. h, quantification of blots in g. Results are mean ± SD, n = 2. i, ADP:ATP ratios determined by LC:MS, from the same experiments shown in Fig. 1c and d. j, Time course of effects of starving MEFs for glucose only, or glucose and glutamine, in the presence of serum. The experiment was as in Fig. 1c except that the medium contained 10% fetal calf serum throughout. k, l, ADP:ATP ratios determined by LC:MS, from the experiments shown in Figs. 1e-h. All experiments were performed at least twice.
Extended Data Figure 2. Glucose deprivation activates AMPK by a mechanism distinct from energy stress.
a, b, d, AXIN-/- (a), LAMTOR1-/- (b) and CaMKK2 knockdown (d) MEFs were incubated with DMEM containing indicated concentrations of glucose for 2 h. The levels of p-AMPKα and p-ACC in the cell lysates were analyzed by immunoblotting. c, AMP:ATP and ADP:ATP ratios in AXIN-/- and LAMTOR1-/- MEFs, generated as in Fig. 2a, b. e, Validation of monoclonal anti-β2 antibody for use in immunofluorescence microscopy. Parental wild type HEK293 cells, or β2 KO cells, were stained with DAPI (blue, nuclei) and anti-β2 antibody (green). Representative merged images are shown, obtained using identical intensity settings. f, Glucose starvation causes translocation of AMPKβ2 to the lysosome in HEK-293 cells that is dependent on N-myristoylation. The experiment was performed in β2 KO cells as in Fig. 1c, except that the lysosomal marker LAMP1 (tagged with RFP) was co-expressed with the WT or AMPK-β2 mutants. Upper panels show merged images stained blue [4',6-diamidino-2-phenylindole (DAPI), nuclei], red (LAMP1, lysosomes) and green (AMPK-β2, detected using antibody validated in Extended Data Fig. 2e), in cells incubated with or without glucose for 20 min. Lower small panels are magnifications of the areas indicated by dashed boxes in the upper panels, showing (L to R) red and green channels and merged images. g, Experiment identical to that shown in Fig. 2c, but expressing AMPK-β1, either WT, G2A or S108A mutants, in β1 KO cells. Results are mean ± SD, n = 4. All experiments were performed at least twice.
Extended Data Figure 3. Glycolytic intermediate(s) is responsible for repression of AMPK in the presence of glucose.
All intact cell experiments in this Figure were performed in the presence of 10% serum. a, Summary of glycolysis pathway and pathways branching off it. PPP, pentose phosphate pathway; SSP, serine synthesis pathway; HP, hexosamine pathway. b, c, Knockdown of G6PD (glucose-6-phosphate dehydrogenase) (b) or PHGDH (phosphoglycerate dehydrogenase) (c) has no effect on AMPK activation. HEK293T cells were infected with lentivirus expressing siRNA against G6PD (b) or PHGDH (c), or siRNA against GFP as a control; the cells were then incubated in the DMEM medium with (25 mM) or without glucose for 2 h, followed by analysis of p-AMPKα and p-ACC levels. d, The hexosamine pathway is not involved in AMPK regulation under glucose deprivation. MEFs were incubated for 2 h in the DMEM medium containing GlcNAc (N-acetylglucosamine), an supplement of hexosamine pathway which cannot be converted back to glucose34, at indicated concentrations and 25 mM or 0 mM glucose. Cells were then subjected to immunoblotting. Experiments in b and c were performed twice, and that in d 3 times.
Extended Data Figure 4. Absence of fructose-1,6-bisphosphate (FBP) defines a starvation signal for AMPK activation.
All intact cell experiments in this Figure were performed in the presence of 10% serum. a, FBP dissociates AXIN/LKB1 from LAMTOR1 in vitro. The same experiment identical to that in Fig. 3b was performed except that the bacterially expressed His-tagged AXIN was used in lieu of AXIN-containing cytosol, incubating with light organelles purified from MEFs glucose-starved for 2 h. b, FBP modulates the interaction between AMPK and LKB1. Cytosol from unstarved MEFs was mixed with light organelles purified from 2-h-glucose-starved ALDO-TKD MEFs or WT MEFs, followed by addition of 200 μM FBP. The mixtures were then dissolved and LKB1 was immunoprecipitated. c, Concentrations of FBP in mouse liver after starvation for 16 h. FBP levels from mouse livers were determined by CE-MS. The amounts of FBP were estimated according to the standard curve generated by plotting the peak-area ratios of unlabeled:13C-labelled FBP (derived from [U-13C]FBP used as internal standard) against the concentrations of unlabeled FBP. The results were obtained by dividing its amount by the estimated volume of liver, and the concentrations of free-state FBP were then estimated as described previously35. Values are presented as mean ± SEM, n = 5 for each condition, P = 9.627 × 10⁻⁵ (Student’s t-test). d, e, Intracellular FBP levels were measured by CE-MS in MEFs after incubation in medium containing different concentrations of glucose (d), or in glucose-free DMEM for the indicated time periods (e). Values are presented as mean ± SD, n = 3 for each treatment; *P = 0.0187, FBP levels in cells incubated in 10 mM glucose were compared to those in cells incubated with medium containing 5 mM glucose; †P = 0.0102, cells incubated with medium containing 5 mM to 3 mM glucose; P = 0.831, cells incubated with medium containing 25 mM to 10 mM glucose; P = 0.00577, comparison of incubation in glucose-free medium for 0 min to 15 min (ANOVA). f, Plasma glucose concentrations (left panel) and intracellular FBP levels (right panel) in mouse liver. FBP were determined by CE-MS analysis. Results are mean ± SD, n = 6 for each condition; P value by Student’s t-test. g, h, Linear correlation between extracellular glucose concentrations and intracellular FBP levels. FBP levels in MEFs, measured at 2 h of incubation in medium containing various concentrations of glucose as shown in d, and in the starved mouse liver shown in f, were plotted against their corresponding glucose concentrations in the culture medium (g) and plasma (h), respectively. i, FBP levels in SLO-permeabilized MEFs. Levels of FBP in regularly cultured SLO-permeabilized MEFs (left panel), or glucose-starved SLO-permeabilized MEFs treated with exogenous FBP (right panel), were determined by CE-MS analysis. Results are mean ± SD, n = 3 for each condition; P value by Student’s t-test (left panel) and ANOVA (right panel). Experiments shown in left and right panels were performed simultaneously and shared a single control (SLO-permeabilized MEFs incubated in medium containing 25 mM glucose). j-l, Addition of exogenous FBP to permeabilized MEFs blocks glucose starvation-induced AMPK activation. Various glycolytic intermediates (200 μM) as indicated were individually added to the 2-h-glucose-starved WT (j), PFK1-KD (k) or TPI-KD (l) MEFs pre-incubated with SLO for 5 min. After incubating for another 15 min, cells were lysed and were analyzed by immunoblotting. Experiments in this figure were performed twice.
Extended Data Figure 5. Modulation of FBP controls AMPK activation.
All intact cell experiments in this Figure were performed in the presence of 10% serum. a, Knockdown of PFK1 activates AMPK in unstarved cells. HEK293T cells were infected with lentivirus expressing PFKP, PFKL and PFKM siRNA, or GFP siRNA as a control, and were incubated in the DMEM medium with or without glucose for 2 h, followed by analysis of p-AMPKα and p-ACC levels. b, c, Effects of overexpression of FBP1 and PFKP on AMPK activation. HEK293T cells were infected with lentivirus expressing FBP1 (b) or PFKP (c), and were then incubated in the DMEM medium with indicated glucose concentrations for 2 h, followed by analysis of p-AMPKα and p-ACC levels. d, Knockdown of GAPDH has no effect on AMPK activation. MEFs were infected with lentivirus expressing GAPDH siRNA, or GFP siRNA as a control, and were glucose-starved for 2 h, followed by analysis of p-AMPKα and p-ACC levels. Experiments in this figure were performed twice.
Extended Data Figure 6. Knockdown of aldolase renders AMPK activation constitutive.
All intact cell experiments in this Figure were performed in the presence of 10% serum. a, Schematic diagram showing the strategy for knocking down the three aldolases (isozymes ALDOA-C) in MEFs. In detail, MEFs carrying doxycycline-inducible expression of ALDOA-C were cultured in medium containing doxycycline (Dox, 100 ng/ml), and were infected with lentivirus expressing siRNA against ALDOA, ALDOB and ALDOC sequentially, or GFP siRNA as a control, followed by incubation in doxycycline-free medium for another 12 h. For Fig. 4a and 4b, #1 siRNAs targeting each enzyme were used. b, Validation of the efficiency and specificity of siRNAs targeting ALDOA-C in MEFs. Cell lysates from MEFs expressing siRNAs against ALDOA, ALDOB, ALDOC or GFP as a control (minus) were immunoblotted as indicated. c, Validation of aldolase-knockdown efficiency by measuring the activity of aldolase in ALDO-TKD cells. Aldolase activities in cell lysates prepared from ALDO-TKD and WT MEFs were measured. Results are mean ± SD, n = 3; P value by ANOVA. d, Knockdown of the three aldolase isozymes renders AMPK activation constitutive. In an experiment identical to Fig. 4a for knocking down the aldolases, the #2 siRNAs targeting each isozyme were used. e, Pyruvate kinase (PK) is not involved in regulation of AMPK. HEK293T cells were infected with lentivirus expressing PKM and PKLR siRNA, or GFP siRNA as a control; the cells were then incubated in the DMEM medium with or without glucose for 2 h, followed by analysis of p-AMPKα and p-ACC levels. f, Knockdown of aldolase does not alter the energy status in MEFs. AMP:ATP/ADP:ATP ratios in WT and ALTO-TKD MEFs were measured by CE-MS. Results are mean ± SD, n = 3; N.S., not significant by Student’s t-test. g-i, Aldolase regulates AMPK through the lysosomal pathway. Aldolases in LKB1-/- (g), LAMTOR1-/- (h) and CaMKK2-/- (i) MEFs were knocked down following the procedures described in a, and were incubated with DMEM medium with 25 mM glucose. The levels of p-AMPKα and p-ACC in the cell lysates were analyzed by immunoblotting. j, Triple knockdown of aldolases promotes the formation of Ragulator-AXIN/LKB1-AMPK complex. Endogenous LAMTOR1 in regularly cultured or glucose-starved ALDO-TKD MEFs were immunoprecipitated, followed by immunoblotting. k, Knockdown of aldolase enhances the interaction between AMPK and LKB1. Experiment identical to that shown in j, but the endogenous LKB1 was immunoprecipitated. l, FBP fails to dissociate AXIN/LKB1 from LAMTOR1 on light organelles purified from starved ALDO-TKD MEFs. Cytosol from unstarved MEFs was mixed with light organelles purified from 2-h-glucose-starved ALDO-TKD MEFs or WT MEFs as a control, and 200 μM FBP was then added to the mixture. The mixtures were then solubilized and LAMTOR1 was immunoprecipitated. m, Addition of exogenous FBP fails to block glucose starvation-induced AMPK activation in permeabilized ALDO-TKD MEFs. FBP (200 μM) was added to the 2-h-glucose-starved ALDO-TKD MEFs or WT MEFs that had been pre-incubated with SLO for 5 min. After incubating for another 15 min, cells were subjected to immunoblotting. n, FBP is the unique intermediate that modulates aldolase for sensing the availability of glucose. FBP, fructose-2,6-bisphosphate (F26P), and fructose-1-phosphate (F1P) at 200 μM were individually added to light organelles purified from 2-h-glucose-starved MEFs. The mixtures were then solubilized and LAMTOR1 was immunoprecipitated, followed by immunoblotting to determine co-precipitated proteins. Experiments in b, e, g-l were performed 3 times, and that in c, d, f, m and n twice.
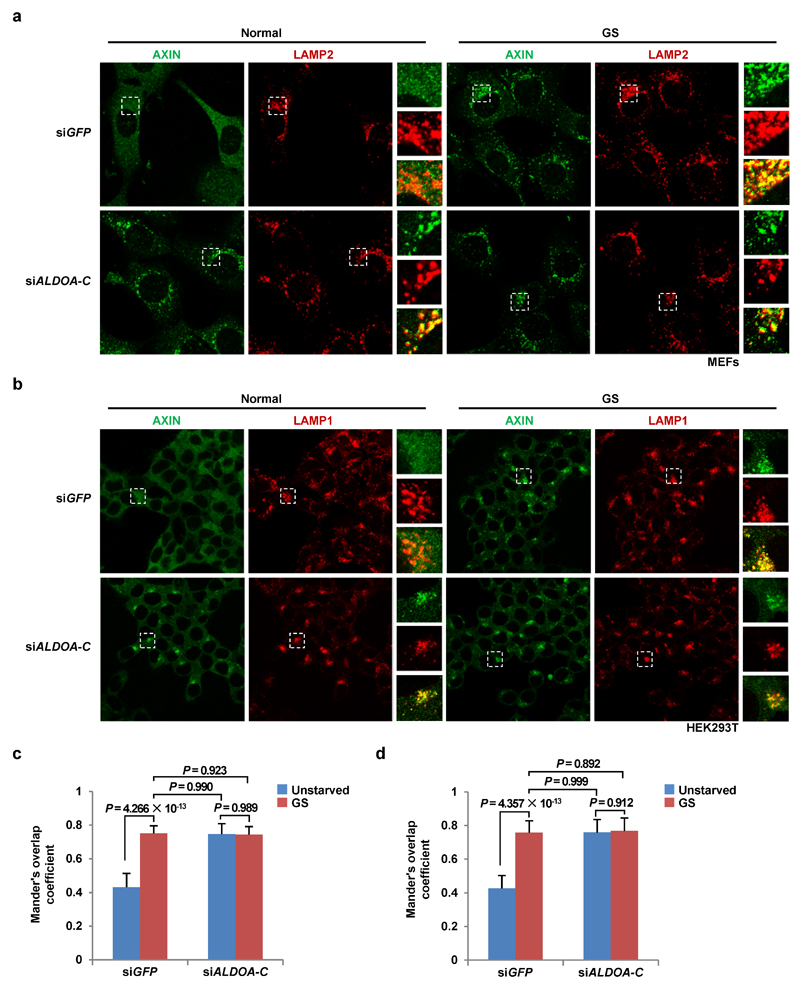
Extended Data Figure 7. AXIN is constitutively localized to lysosomes in aldolase-deficient MEFs and HEK293T cells.
All intact cell experiments in this Figure were performed in the presence of 10% serum. a, b, Immunofluorescent staining in WT and ALDO-TKD MEFs (a) and HEK293T cells (b) was performed. Rat anti-LAMP2 antibody and goat anti-AXIN antibody were used for staining MEFs (a), and mouse anti-LAMP1 antibody and goat anti-AXIN antibody for HEK293T cells (b). The antibodies had been validated previously6. c, d, Mander’s overlap coefficients of a and b were graphed in c and d, respectively, as mean ± SD, n = 61 (siGFP, unstarved), 54 (siGFP, GS), 60 (siALDOA-C, unstarved), 58 (siALDOA-C, GS) (c) and n = 57 (siGFP, unstarved), 48 (siGFP, GS), 52 (siALDOA-C, unstarved), 51 (siALDOA-C, GS) (d) for each group; P value by ANOVA. N.S., not significant. The experiment was performed twice.
Extended Data Figure 8. Effects of aldolase mutants on AMPK activation.
All intact cell experiments in this Figure were performed in the presence of 10% serum. a, ALDOA-D34S mutant increases intracellular FBP levels under glucose starvation. HEK293T cells stably expressing ALDOA or its D34S mutant were incubated in DMEM with or without glucose for 2 h, followed by measuring FBP levels. Results are mean ± SD, n = 3; P value by ANOVA. N.S., not significant. b, D34S mutant of ALDOA that still binds FBP in glucose-free medium exhibits reduced AMPK activation. ALDO-TKD MEFs stably expressing ALDOA-D34S, or wild type ALDOA as control, were incubated in DMEM medium with or without glucose for 2 h, followed by immunoblotting. c, ALDOA-D34S blunts the formation of Ragulator-AXIN/LKB1-AMPK complex. HEK293T cells stably expressing ALDOA and ALDOA-D34S were lysed and the endogenous LAMTOR1 was immunoprecipitated, followed by immunoblotting. d, Adenovirus-mediated expression of the D34S mutant in mouse liver blocks AMPK activation after starvation. Adenovirus expressing ALDOA-D34S, or WT ALDOA as control, was injected into the tail veins of 6-week-old mice. Five days later, mice were fasted for 16 h. Phosphorylation of AMPKα and ACC were then determined by immunoblotting. e, K230A mutant of aldolase promotes the formation of Ragulator-AXIN/LKB1-AMPK complex. Endogenous LAMTOR1 in unstarved or glucose-starved WT MEFs and ALDOA-K230A MEFs were immunoprecipitated, followed by immunoblotting. f, FBP fails to dissociate AXIN/LKB1 from LAMTOR1 on light organelles purified from starved ALDOA-K230A MEFs. Cytosol from unstarved MEFs was mixed with light organelles purified from 2-h-glucose-starved ALDOA-K230A MEFs or WT MEFs as a control, and 200 μM FBP was then added to each mixture. The mixtures were then dissolved and LAMTOR1 was immunoprecipitated, followed by immunoblotting. g, Addition of exogenous FBP fails to block glucose starvation-induced AMPK activation in permeabilized ALDO-K230A expressed, TKD-MEFs (ALDOA-K230A MEFs). FBP (200 μM) was added to the 2-h-glucose-starved ALDOA-K230A MEFs or WT MEFs that had been pre-incubated with SLO for 5 min. After incubating for another 15 min, cells were subjected to immunoblotting. Experiments in c and f were performed 3 times, and that in a, b, d, e and g twice.
Extended Data Figure 9. FBP is predominantly derived from glucose.
All intact cell experiments in this Figure were performed in the presence of 10% serum. a, Isotopomeric distribution of metabolites derived from D-[U-13C]glucose. 13C atoms are marked as filled circles. Note that FBP can be converted from various substrates besides glucose, but the conversion of glucose to F6P and then to FBP (grey-shaded area) is the only way that yields completely M+6 labelled FBP. b, c, MEFs (b) or HEK293T cells (c) were incubated in DMEM medium without glucose for 4 h. The medium was then added with 25 mM D-[U-13C]glucose. After 15 min or 4 h of incubation, the labeled FBP levels in cells were measured by CE-MS. The results shown that FBP produced after re-addition of glucose to the MEFs was almost entirely M+6 labelled. The experiment was performed twice.
Extended Data Figure 10. Aldolase interacts with the v-ATPase-Ragulator complex.
a, A simplified model depicting that aldolase is a sensor of glucose availability that directly links glucose shortage to activation of AMPK. b, HEK293T cells were lysed and the endogenous aldolase was immunoprecipitated, followed by immunoblotting. The experiment was performed twice.
Supplementary Material
Supplementary Information is available in the online version of the paper.
Acknowledgements
We thank all other members of the S-CL laboratory for suggestions and technical assistance, and the proteomics team at the University of Dundee (Douglas Lamont, Abdel Atrih, Wenzhang Chen and Kenneth Beattie) for LC:MS analyses of nucleotides. DGH was supported by an Investigator Award from the Wellcome Trust (097726) and a Programme Grant from Cancer Research UK (C37030/A15101). S-CL was supported by grants from the National Key Research and Development Project of China (2016YFA0502001) and National Natural Science Foundation of China (#31430094, #31690101, #31571214, #31601152 and #J1310027).
Footnotes
Author Contributions
C.-S.Z., S.A.H., Y.Z., M.L., D.G.H. and S.-C.L conceived the study. C.-S.Z., S.A.H., Y.Z. and M.L. performed most experiments with assistance from T.M., J.C., J.-W.F., A.G., Y.-Q.W., T.Y.L. and S.-Y.L. Y.Z. and Z.W. performed the CE-MS-based analysis of metabolites, and S.A.H., M.L. and M.Z. performed the analysis of adenylates. Z.Y., S.-Y.L., H.Y. and H.-L.P. helped with discussion and interpretation of results. D.G.H. and S.-C.L. wrote the manuscript.
Author Information
Reprints and permissions information is available at www.nature.com/reprints. Readers are welcome to comment on the online version of the paper.
The authors declare no competing financial interests.
Data availability
The authors declare that all data supporting the findings of this study are available within the paper and the Supplementary Information files.
References
- 1.Salt IP, Johnson G, Ashcroft SJ, Hardie DG. AMP-activated protein kinase is activated by low glucose in cell lines derived from pancreatic beta cells, and may regulate insulin release. The Biochemical journal. 1998;335(Pt 3):533–539. doi: 10.1042/bj3350533. [DOI] [PMC free article] [PubMed] [Google Scholar]
- 2.Ross FA, MacKintosh C, Hardie DG. AMP-activated protein kinase: a cellular energy sensor that comes in 12 flavours. The FEBS journal. 2016;283:2987–3001. doi: 10.1111/febs.13698. [DOI] [PMC free article] [PubMed] [Google Scholar]
- 3.Carling D. AMPK signalling in health and disease. Current opinion in cell biology. 2017;45:31–37. doi: 10.1016/j.ceb.2017.01.005. [DOI] [PubMed] [Google Scholar]
- 4.Steinberg GR, Kemp BE. AMPK in Health and Disease. Physiological reviews. 2009;89:1025–1078. doi: 10.1152/physrev.00011.2008. [DOI] [PubMed] [Google Scholar]
- 5.Mihaylova MM, Shaw RJ. The AMPK signalling pathway coordinates cell growth, autophagy and metabolism. Nature cell biology. 2011;13:1016–1023. doi: 10.1038/ncb2329. [DOI] [PMC free article] [PubMed] [Google Scholar]
- 6.Zhang CS, et al. The lysosomal v-ATPase-Ragulator complex is a common activator for AMPK and mTORC1, acting as a switch between catabolism and anabolism. Cell metabolism. 2014;20:526–540. doi: 10.1016/j.cmet.2014.06.014. [DOI] [PubMed] [Google Scholar]
- 7.Zhang YL, et al. AMP as a low-energy charge signal autonomously initiates assembly of AXIN-AMPK-LKB1 complex for AMPK activation. Cell metabolism. 2013;18:546–555. doi: 10.1016/j.cmet.2013.09.005. [DOI] [PubMed] [Google Scholar]
- 8.Oakhill JS, et al. beta-Subunit myristoylation is the gatekeeper for initiating metabolic stress sensing by AMP-activated protein kinase (AMPK) Proceedings of the National Academy of Sciences of the United States of America. 2010;107:19237–19241. doi: 10.1073/pnas.1009705107. [DOI] [PMC free article] [PubMed] [Google Scholar]
- 9.Hawley SA, et al. Use of cells expressing gamma subunit variants to identify diverse mechanisms of AMPK activation. Cell metabolism. 2010;11:554–565. doi: 10.1016/j.cmet.2010.04.001. [DOI] [PMC free article] [PubMed] [Google Scholar]
- 10.Kroemer G, Jaattela M. Lysosomes and autophagy in cell death control. Nature reviews Cancer. 2005;5:886–897. doi: 10.1038/nrc1738. [DOI] [PubMed] [Google Scholar]
- 11.Langendorf CG, Kemp BE. Choreography of AMPK activation. Cell research. 2015;25:5–6. doi: 10.1038/cr.2014.163. [DOI] [PMC free article] [PubMed] [Google Scholar]
- 12.Xiao B, et al. Structural basis of AMPK regulation by small molecule activators. Nature communications. 2013;4:3017. doi: 10.1038/ncomms4017. [DOI] [PMC free article] [PubMed] [Google Scholar]
- 13.Houde VP, et al. Investigation of LKB1 Ser431 phosphorylation and Cys433 farnesylation using mouse knockin analysis reveals an unexpected role of prenylation in regulating AMPK activity. The Biochemical journal. 2014;458:41–56. doi: 10.1042/BJ20131324. [DOI] [PMC free article] [PubMed] [Google Scholar]
- 14.El-Maghrabi MR, Claus TH, McGrane MM, Pilkis SJ. Influence of phosphorylation on the interaction of effectors with rat liver pyruvate kinase. The Journal of biological chemistry. 1982;257:233–240. [PubMed] [Google Scholar]
- 15.Ritterson Lew C, Tolan DR. Targeting of several glycolytic enzymes using RNA interference reveals aldolase affects cancer cell proliferation through a non-glycolytic mechanism. The Journal of biological chemistry. 2012;287:42554–42563. doi: 10.1074/jbc.M112.405969. [DOI] [PMC free article] [PubMed] [Google Scholar]
- 16.Morris AJ, Tolan DR. Site-directed mutagenesis identifies aspartate 33 as a previously unidentified critical residue in the catalytic mechanism of rabbit aldolase A. The Journal of biological chemistry. 1993;268:1095–1100. [PubMed] [Google Scholar]
- 17.Choi KH, Shi J, Hopkins CE, Tolan DR, Allen KN. Snapshots of catalysis: the structure of fructose-1,6-(bis)phosphate aldolase covalently bound to the substrate dihydroxyacetone phosphate. Biochemistry. 2001;40:13868–13875. doi: 10.1021/bi0114877. [DOI] [PubMed] [Google Scholar]
- 18.Kelley PM, Tolan DR. The complete amino Acid sequence for the anaerobically induced aldolase from maize derived from cDNA clones. Plant physiology. 1986;82:1076–1080. doi: 10.1104/pp.82.4.1076. [DOI] [PMC free article] [PubMed] [Google Scholar]
- 19.Rago F, Saltzberg D, Allen KN, Tolan DR. Enzyme Substrate Specificity Conferred by Distinct Conformational Pathways. Journal of the American Chemical Society. 2015;137:13876–13886. doi: 10.1021/jacs.5b08149. [DOI] [PubMed] [Google Scholar]
- 20.Forgac M. Vacuolar ATPases: rotary proton pumps in physiology and pathophysiology. Nature reviews Molecular cell biology. 2007;8:917–929. doi: 10.1038/nrm2272. [DOI] [PubMed] [Google Scholar]
- 21.Lu M, Holliday LS, Zhang L, Dunn WA, Jr, Gluck SL. Interaction between aldolase and vacuolar H+-ATPase: evidence for direct coupling of glycolysis to the ATP-hydrolyzing proton pump. The Journal of biological chemistry. 2001;276:30407–30413. doi: 10.1074/jbc.M008768200. [DOI] [PubMed] [Google Scholar]
- 22.Lu M, Sautin YY, Holliday LS, Gluck SL. The glycolytic enzyme aldolase mediates assembly, expression, and activity of vacuolar H+-ATPase. The Journal of biological chemistry. 2004;279:8732–8739. doi: 10.1074/jbc.M303871200. [DOI] [PubMed] [Google Scholar]
- 23.Lu M, Ammar D, Ives H, Albrecht F, Gluck SL. Physical interaction between aldolase and vacuolar H+-ATPase is essential for the assembly and activity of the proton pump. The Journal of biological chemistry. 2007;282:24495–24503. doi: 10.1074/jbc.M702598200. [DOI] [PubMed] [Google Scholar]
- 24.Xiao B, et al. Structure of mammalian AMPK and its regulation by ADP. Nature. 2011;472:230–233. doi: 10.1038/nature09932. [DOI] [PMC free article] [PubMed] [Google Scholar]
- 25.Wilson WA, Hawley SA, Hardie DG. Glucose repression/derepression in budding yeast: SNF1 protein kinase is activated by phosphorylation under derepressing conditions, and this correlates with a high AMP:ATP ratio. Current biology : CB. 1996;6:1426–1434. doi: 10.1016/s0960-9822(96)00747-6. [DOI] [PubMed] [Google Scholar]
- 26.Li TY, et al. ULK1/2 Constitute a Bifurcate Node Controlling Glucose Metabolic Fluxes in Addition to Autophagy. Molecular cell. 2016;62:359–370. doi: 10.1016/j.molcel.2016.04.009. [DOI] [PubMed] [Google Scholar]
- 27.Alvarez-Erviti L, et al. Delivery of siRNA to the mouse brain by systemic injection of targeted exosomes. Nature biotechnology. 2011;29:341–345. doi: 10.1038/nbt.1807. [DOI] [PubMed] [Google Scholar]
- 28.Ran FA, et al. Genome engineering using the CRISPR-Cas9 system. Nat Protoc. 2013;8:2281–2308. doi: 10.1038/nprot.2013.143. [DOI] [PMC free article] [PubMed] [Google Scholar]
- 29.Kao AW, Noda Y, Johnson JH, Pessin JE, Saltiel AR. Aldolase mediates the association of F-actin with the insulin-responsive glucose transporter GLUT4. The Journal of biological chemistry. 1999;274:17742–17747. doi: 10.1074/jbc.274.25.17742. [DOI] [PubMed] [Google Scholar]
- 30.Costes SV, et al. Automatic and quantitative measurement of protein-protein colocalization in live cells. Biophys J. 2004;86:3993–4003. doi: 10.1529/biophysj.103.038422. [DOI] [PMC free article] [PubMed] [Google Scholar]
- 31.Hu H, et al. Phosphoinositide 3-Kinase Regulates Glycolysis through Mobilization of Aldolase from the Actin Cytoskeleton. Cell. 2016;164:433–446. doi: 10.1016/j.cell.2015.12.042. [DOI] [PMC free article] [PubMed] [Google Scholar]
- 32.Zhao J, et al. Study of polar metabolites in tobacco from different geographical origins by using capillary electrophoresis–mass spectrometry. Metabolomics. 2014;10 doi: 10.1007/s11306-014-0631-4. [DOI] [Google Scholar]
- 33.Zhao Y, et al. A metabolomics study delineating geographical location-associated primary metabolic changes in the leaves of growing tobacco plants by GC-MS and CE-MS. Scientific reports. 2015;5:16346. doi: 10.1038/srep16346. [DOI] [PMC free article] [PubMed] [Google Scholar]
- 34.Dennis JW, Nabi IR, Demetriou M. Metabolism, cell surface organization, and disease. Cell. 2009;139:1229–1241. doi: 10.1016/j.cell.2009.12.008. [DOI] [PMC free article] [PubMed] [Google Scholar]
- 35.Sols A, Marco R. In: Current Topics in Cellular Regulation. Horecker Bernard L, Stadtman Earl R, editors. Vol. 2. Academic Press; 1970. pp. 227–273. [Google Scholar]
Associated Data
This section collects any data citations, data availability statements, or supplementary materials included in this article.


