

Abstract
Background/Objective
The brain plays a central role in regulating ingestive behavior in obesity. Analogous to addiction behaviors, an imbalance in the processing of rewarding and salient stimuli results in maladaptive eating behaviors that override homeostatic needs. We performed network analysis based on graph theory to examine the association between body mass index (BMI) and network measures of integrity, information flow, and global communication (centrality) in reward, salience and sensorimotor regions, and to identify sex-related differences in these parameters.
Subjects/Methods
Structural and diffusion tensor imaging were obtained in a sample of 124 individuals (61 males and 63 females). Graph theory was applied to calculate anatomical network properties (centrality) for regions of the reward, salience, and sensorimotor networks. General linear models with linear contrasts were performed to test for BMI and sex-related differences in measures of centrality, while controlling for age.
Results
In both males and females, individuals with high BMI (obese and overweight) had greater anatomical centrality (greater connectivity) of reward (putamen) and salience (anterior insula) network regions. Sex differences were observed both in individuals with normal and elevated BMI. In individuals with high BMI, females compared to males showed greater centrality in reward (amygdala, hippocampus, nucleus accumbens) and salience (anterior mid cingulate cortex) regions, while males compared to females had greater centrality in reward (putamen) and sensorimotor (posterior insula) regions.
Conclusions
In individuals with increased BMI, reward, salience, and sensorimotor network regions are susceptible to topological restructuring in a sex related manner. These findings highlight the influence of these regions on integrative processing of food-related stimuli and increased ingestive behavior in obesity, or in the influence of hedonic ingestion on brain topological restructuring. The observed sex differences emphasize the importance of considering sex differences in obesity pathophysiology.
Keywords: body mass index (BMI), anatomical network metrics, sex differences, reward network, salience network, sensorimotor network
INTRODUCTION
In the United States, more than one third of the population is obese.1 Epidemiological studies have tracked prevalence rates of obesity based on various stratifications, including sex-related differences.2 Compared to adult males, females have the highest incidence rates of morbid obesity,3 and have different eating behaviors such as emotional eating or overeating under stress.4 However in the past 10 years, obesity rates in males have increased exponentially faster compared to females and have now reached almost the same rates as females.5 The reasons for these sex-related differences in obesity rates are incompletely understood, but may involve sex-related differences associated with altered ingestive behavior.
Obesity is a multifactorial disorder that affects several organs including the brain.6 Obesity contributes to alterations in metabolism and neural activity in brain networks involved in the processing of rewarding stimuli and modulation of food-seeking behavior,7, 8 inhibitory control,9 interoceptive and sensory awareness,10–12 and integrating salient information to make decisions regarding food intake.13–15 The “reward model” suggests that repeated exposure to palatable food cues, results in alterations in the responsiveness of reward, salience, and sensorimotor regions, leading to eating behaviors that override homeostatic needs, and cause overeating and obesity.8, 11, 15, 16 Differences in brain activity between obese and non-obese subjects in the brain’s function during tasks and/or resting state,13, 17–19 gray-matter morphometry,10, 20, 21 and white-matter properties10, 22–25 have been identified. Classification algorithms based on white-matter connectivity have classified individuals with high body mass index (BMI) from normal BMI with 97% accuracy related to differences in the reward network and associated salience and sensorimotor networks,10 emphasizing the involvement of the brain in obesity.
Neuroimaging studies offer a powerful tool to examine sex differences in the reward and homeostatic brain systems involved in obesity.14, 26 Studies have shown that females with obesity demonstrate higher resting state activity in reward and salience regions,27 greater responses to taste and olfactory stimuli in the insula,28 and greater responses to high energy food cues in the caudate (reward).29 Men with obesity show increased resting-state activity in the putamen (reward).30 However, since the primary motor and somatosensory cortex project directly to the putamen8, 31–33 suggests that alterations in regions of the sensorimotor network may also be involved in the underlying pathophysiology associated with obesity in males. Despite the growing understanding of the involvement of the brain in obesity and the associated obesity-related sex differences, the majority of studies have focused on the description of differences in individual brain regions, and a deeper understanding of the underlying properties and architecture of key brain networks in obesity is lacking.
Network analysis based on graph theory allows for the characterization of the role of brain regions and their connections in the integrity and information flow of brain networks.34–36 Measures of centrality are the most common measures of global connectedness identifying brain regions that are most likely to participate in integrative processing and associated behavioral responses.34–36
The study aimed to investigate BMI and sex-related differences on anatomical centrality measures of reward, salience and sensorimotor networks by addressing the following hypotheses: 1. Greater BMI is associated with greater centrality of core regions of the reward and salience networks. 2. Measures of centrality of network regions show sex-related differences, with greater sensitivity in reward and salience regions in females, and in sensorimotor regions in males.
METHODS
Study Participants
The sample was comprised of 124 right-handed volunteers (61 males and 63 females), with the absence of significant medical or psychiatric conditions. Subjects were excluded for the following: pregnant or lactating, substance abuse, abdominal surgery, tobacco dependence (>half a pack or more daily), extreme strenuous exercise (>8hrs of continuous exercise per week), current or past psychiatric illness, and major medical or neurological conditions. Subjects taking medications that interfere with the central nervous system or regular use of analgesic drugs were excluded. Since female sex hormones such as estrogen are known to effect brain structure and function, we used women who were premenopausal and who were scanned during the follicular phase of their menstrual cycles as determined by self-report of their last day of the cycle.
Subjects with hypertension, diabetes, metabolic syndrome, or eating disorders were excluded to minimize confounding effects. We used BMI cutoffs to define our groups: BMI<25 consisted of lean individuals (normal BMI group), and BMI≥25 consisted of obese or overweight individuals (high BMI group). These two groups were further divided by sex for a total of four groups (Males with normal BMI, Females with normal BMI, Males with high BMI, Females with high BMI). No subjects exceeded 400lbs due to MRI scanning weight limits.
All procedures complied with the principles of the Declaration of Helsinki and were approved by the Institutional Review Board at UCLA’s Office of Protection for Research Subjects. All subjects provided written informed consent.
Behavioral Measures
Somatization was assessed using the Patient Health Questionnaire (PHQ), which is a 15-item self administered scale.37 The PHQ-15 comprises of 15 somatic symptoms and each symptom is scored from 0 (“not bothered at all”) to 2 (“bothered a lot”), and scores of 5, 10, and 15 represent cutoff points of mild, medium or high somatic symptom severity scores. The PHQ-15 has good psychometric properties, with an internal consistency α=0.80.37 The Perceived Stress Scale (PSS), a 10-item scale was used to measure stressful demands on a situation, indicating that demands exceed ability to cope.38 The questions are based on subjects reporting the frequency of their feelings to each question, which are scored on a scale of 0 (Never) to 4 (Very Often).38
MRI Acquisition
A 3.0T Siemens Trio scanner was used to perform whole brain structural, and diffusion tensor (DTI) magnetic resonance imaging. Noise reducing headphones were used.
Structural gray-matter
A high resolution structural image was obtained from each subject using a magnetization-prepared rapid acquisition gradient-echo sequence, repetition time=2200ms, echo time=3.26ms, structural acquisition time=5m 12s, slice thickness=1mm, 176 slices, 256*256 voxel matrix, 1mm voxel size.
Anatomical connectivity (DTI)
Diffusion-weighted MRIs (DWIs) were acquired according to two comparable acquisition protocols, in either 61 or 64 noncolinear directions with b=1000s/mm2, with 8 or 1 b=0s/mm2 images respectively, TR=9400ms, TE=83ms, and field of view (FOV)=256mm with an acquisition matrix of 128×128, and a slice thickness of 2mm to produce 2×2×2mm3 isotropic voxels.
MRI preprocessing and quality control
Structural gray-matter
Structural T1-image segmentation and regional parcellation were conducted using FreeSurfer39, 40 following the nomenclature described in Destrieux et al.41 This parcellation results in 165 regions, 74 bilateral cortical structures, 7 subcortical structures, the midbrain, and the cerebellum.
Anatomical connectivity (DTI)
Diffusion weighted images (DWI) were corrected for motion and used to compute diffusion tensors that were rotationally re-oriented at each voxel. The diffusion tensor images were realigned based on trilinear interpolation of log-transformed tensors and resampled to an isotropic voxel resolution (2×2×2mm3). White matter connectivity for each subject was estimated between the 165 brain regions using DTI fiber tractography, performed via the Fiber Assignment by Continuous Tracking (FACT) algorithm using TrackVis (http://trackvis.org).
Anatomical MRI network construction
Connection Matrix
Regional parcellation and tractography results were combined to produce a weighted, unidirected connectivity matrix. The final estimate of white matter connectivity between each of the brain regions was determined based on the number of fiber tracts intersecting each region. Weights of the connections were then expressed as the absolute fiber count divided by the individual volumes of the two interconnected regions.42, 43, 44 To determine the influence of this methodological choice in weighting on detecting group differences, we performed sensitivity analyses using alternative weighting schemes. A detailed description and results for this analysis are reported in the Supplementary Materials.
Regions and Networks of Interest
Regions of interest (ROI) were restricted to the core regions of the reward network (caudate, putamen, globus pallidus, amygdala, hippocampus, nucleus accumbens (NAcc), medial orbital frontal gyrus [mOFG]),7, 8, 14, 26 the salience network (anterior insula [aINS], anterior mid cingulate cortex [aMCC]),48 and the sensorimotor network (thalamus, primary somatosensory cortex/S1 [postcentral gyrus (PosCG), postcentral sulcus (PosCS), central sulcus (CS)], secondary somatosensory cortex/S2 [subcentral gyrus and sulcus (SbCGS)], primary motor cortex/M1 [precentral gyrus (PreCG), inferior part of the precentral sulcus (InfPreCS), superior part of the precentral sulcus (SupPreCS)], mid insula (mINS) (superior segment of circular sulcus of the insula [SupCirINS]), posterior insula (pINS) [long insular gyrus and sulcus (LongINSGS), inferior segment of the circular sulcus of the insula (InfCirINS), posterior ramus of the lateral sulcus (PosLS)]11, 12, 49 (Table 1, Figure 1).
Table 1.
Regions of Interest
| Region | Full Destrieux Name | Destrieux Abbreviation | |
|---|---|---|---|
| Reward Network | |||
| 1 | Basal Ganglia | Caudate Nucleus | CaN |
| Putamen | Pu | ||
| Globus Pallidus | Pal | ||
| Nucleus Accumbens | Nacc | ||
| 2 | Amygdala | Amygdala | Amg |
| 3 | Hippocampus | Hippocampus | Hip |
| 4 | Orbital Frontal Cortex (mOFC) | Medial Orbital Gyrus | OrG |
| Medial orbital sulcus (olfactory sulcus) | MedOrS | ||
| Salience Network | |||
| 1 | Anterior Insula (aINS) | Horizontal ramus of theanterior segment of the lateral sulcus (or fissure) | ALSHorp |
| Anterior segment of the circular sulcus of the insula | ACirINS | ||
| Vertical ramus of the anterior segment of the lateral sulcus(or fissure) | ALSVerp | ||
| Short insular gyri | ShoInG | ||
| 2 | Middle Anterior Cingulate (aMCC) | Middle-anterior part of the cingulate gyrus and sulcus | MACgG |
| Sensorimotor Network | |||
| 1 | Thalamus | Thalamus | Tha |
| 2 | Primary Somatosensory Cortex (S1) | Postcentral Gyrus | PosCG |
| Postcentral Sulcus | PosCS | ||
| Central Sulcus | CS | ||
| 3 | Secondary Somatosensory Cortex (S2) | Subcentral gyrus (central operculum) and sulci | SbCG_S |
| 4 | Primary Motor Cortex (M1) | Precentral Gyrus | PreCG |
| Inferior part of the precentral sulcus | InfPreCS | ||
| Superior part of the precentral sulcus | SupPreCS | ||
| 5 | Posterior Insula (pINS) | Long insular gyrus and central sulcus of the insula | LoInG_CINS |
| Inferior segment of the circular sulcus of the insula | InfCirINS | ||
| Posterior ramus (or segment)of the lateral sulcus (or fissure) | PosLS | ||
| 6 | Middle Insula (mINS) | Superior segment of the circular sulcus of the insula | SupCirINS |
Reward Network Regions of Interest: caudate nucleus, putamen, globus pallidus, nucleus accumbens (NAcc), amygdala, hippocampus, medial orbital frontal gyrus (mOFG) and includes parcellations from the medial orbital gyrus (mOG) and medial orbital sulcus (mOS)
Salience Network Regions of Interest: anterior insula (aINS) and includes parcellations from the horizontal ramus of the anterior segment of the lateral sulcus (ALSHorp), anterior segment of the circular sulcus of the insula (ACirINS), vertical ramus of the anterior segment of the lateral sulcus (ALSVerp) and the short insular gyri (ShoInG); anterior mid cingulate cortex (aMCC)
Sensorimotor Network Regions of Interest: thalamus, primary somatosensory cortex/S1 [which includes the postcentral gyrus (PosCG), postcentral sulcus (PosCS), and central sulcus (CS)], secondary somatosensory cortex/S2 [which includes the subcentral gyrus and sulcus (SbCGS)], primary motor cortex/M1 [which includes the precentral gyrus (PreCG), inferior part of the precentral sulcus (InfPreCS), and superior part of the precentral sulcus (SupPreCS)], mid insula (mINS) (superior segment of circular sulcus of the insula [SupCirINS]), posterior insula (pINS) [which includes the long insular gyrus and sulcus (LongINSGS), inferior segment of the circular sulcus of the insula (InfCirINS), and the posterior ramus of the lateral sulcus (PosLS)]
Figure 1. Regions of Interest.
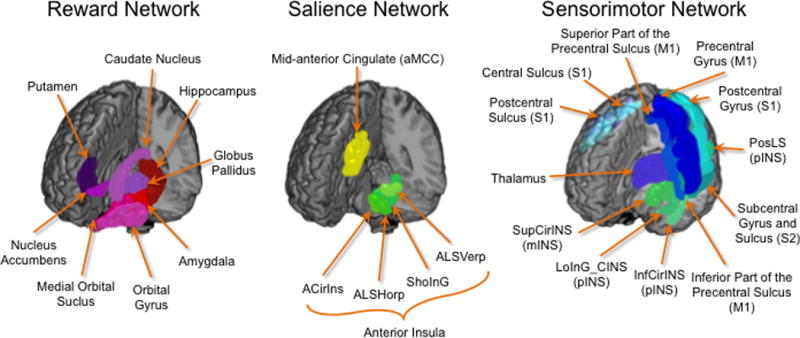
Regions of interest used in the analyses are displayed separated by network
Reward Network Regions of Interest: caudate nucleus, putamen, globus pallidus, nucleus accumbens (NAcc), amygdala, hippocampus, medial orbital frontal gyrus (mOFG) and includes parcellations from the medial orbital gyrus (mOG) and medial orbital sulcus (mOS)
Salience Network Regions of Interest: anterior insula (aINS) and includes parcellations from the horizontal ramus of the anterior segment of the lateral sulcus (ALSHorp), anterior segment of the circular sulcus of the insula (ACirINS), vertical ramus of the anterior segment of the lateral sulcus (ALSVerp) and the short insular gyri (ShoInG); anterior mid cingulate cortex (aMCC)
Sensorimotor Network Regions of Interest: thalamus, primary somatosensory cortex/S1 [which includes the postcentral gyrus (PosCG), postcentral sulcus (PosCS), and central sulcus (CS)], secondary somatosensory cortex/S2 [which includes the subcentral gyrus and sulcus (SbCGS)], primary motor cortex/M1 [which includes the precentral gyrus (PreCG), inferior part of the precentral sulcus (InfPreCS), and superior part of the precentral sulcus (SupPreCS)], mid insula (mINS) (superior segment of circular sulcus of the insula [SupCirINS]), posterior insula (pINS) [which includes the long insular gyrus and sulcus (LongINSGS), inferior segment of the circular sulcus of the insula (InfCirINS), and the posterior ramus of the lateral sulcus (PosLS)]
Computing Network Metrics
The Graph Theory GLM toolbox (GTG) (www.nitrc.org/projects/metalab_gtg) and in-house matlab scripts were applied to subject-specific anatomical brain networks to compute three local weighted network metrics indexing centrality.34, 36, 50
Measures of centrality include strength, betweenness centrality and eigenvector centrality
Strength represents the number of connections (fiber tracts) a given brain region has, factoring in the “weight” of each connection and reflects a brain region’s total level of impact in the network. Betweenness centrality describes degree to which a brain region lies on the shortest path between two other regions. Acting as way stations, regions with high betweenness centrality are topologically primed to control communication between other regions. Eigenvector centrality reflects how connected a given brain region is to other brain regions with high centrality (greater number of fiber tracts), and is a measure of a region’s overall influence on the network.
Data Analyses
An ordinary least squares model was applied to test the differences in centrality of brain ROIs based upon subject groups defined by BMI and sex. Analyses were performed using the GTG toolbox. Five linear contrasts were specified: 1. High BMI vs. Normal BMI, 2. Females with Normal BMI vs. Males with Normal BMI, 3. Females with high BMI vs. Males with High BMI, 4. Females with High BMI vs. Females with Normal BMI, 4. Males with High BMI vs. Males with Normal BMI. The main effect of age was included as a covariate in the model. Significance was determined via Freedman & Lane’s non-parametric permutation testing strategy and specifying 10,000 permutations.51 This method provides good control over type I error rates and is robust to the presence of outliers.51 In total, 7 reward, 2 salience, and 6 sensorimotor network regions were tested. Permuted probability values were corrected using an FDR adjusted p value, where a FDR q <0.05 was considered significant.52 This correction was performed within each contrast, each measure of centrality, by the number of regions in each network (reward, salience, sensorimotor), and by laterality (left vs. right).
Group differences in behavioral measure scores were evaluated by applying linear contrast analyses in a GLM model. To quantify the differences between the various contrasts in the non-imaging data, we calculated Cohen’s effect size d, reflecting differences on the scale of standard deviation units and values are interpreted as low (d = .20), moderate (d = .50), and high (d = .80).53
RESULTS
Subject Characteristics
Subject characteristics are summarized in Tables 2A and 2B. Subjects with a higher BMI (BMI ≥ 25kg/m2: mean BMI=29.45, sd=6.65, range=25.00–43.59kg/m2) consisted of 37 males (mean=29.51, sd=1.69, range=25.00–40.50kg/m2) and 20 females (mean=29.35, sd=4.79, range=25.09–43.59kg/m2). Of these subjects, 42 were overweight (BMI=25.00–30.00kg/m2; males=29, females=13) and 15 were obese (BMI≥30.00kg/m2, males=8, females=7). Subjects with normal BMI (BMI<25kg/m2: mean BMI=22.16, sd=1.69, range=18.19–24.80kg/m2) consisted of 24 males (mean BMI=22.44kg/m, sd=1.77, range=18.20–24.20kg/m2), and 43 females (mean BMI=22.01kg/m2, sd=1.64, range=18.19–24.80kg/m2). Females with high BMIs were slightly younger than males with high BMIs, d=−.61.
Table 2.
Study Demographics and Clinical Behavioral Measures
| A: Means and Standard Deviations of Clinical and Behavioral Measurements | |||||||||||||||||||||
|---|---|---|---|---|---|---|---|---|---|---|---|---|---|---|---|---|---|---|---|---|---|
| Normal BMI | High BMI | Total Subjects | |||||||||||||||||||
| Males | Females | Total | Males | Females | Total | ||||||||||||||||
| N=24 | N=43 | N=67 | N=37 | N=20 | N=57 | N=124 | |||||||||||||||
| Measurement | Mean (SD) |
Range | N | Mean (SD) |
Range | N | Mean (SD) |
Range | N | Mean (SD) |
Range | N | Mean (SD) |
Range | N | Mean (SD) |
Range | N | Mean (SD) |
Range | N |
| BMI (kg/m2) | 22.44 (1.77) |
18.20–24.20 | 24 | 22.01 (1.64) |
18.19–24.80 | 43 | 22.16 (1.69) |
18.19–24.80 | 67 | 29.51 (7.53) |
25.00–40.50 | 37 | 29.35 (4.79) |
25.09–43.59 | 20 | 29.45 (6.65) |
25.00–43.59 | 57 | 25.51 (5.92) |
18.19–43.59 | 124 |
| Age (years) | 31.58 (12.51) |
19.00–55.00 | 24 | 28.51 (10.82) |
18.00–52.00 | 43 | 29.61 (11.46) |
18.00–55.00 | 67 | 34.76 (11.99) |
20.00–61.00 | 37 | 28.45 (7.15) |
19.99–44.00 | 20 | 32.54 (10.91) |
19.99–61.00 | 57 | 30.96 (11.26) |
18.00–61.00 | 124 |
| Patient Health Questionnaire (PHQ) | |||||||||||||||||||||
| PHQ Score | 1.23 (2.16) |
0–9 | 22 | 2.14 (2.24) |
0–10 | 42 | 1.83 (2.24) |
0–10 | 64 | 1.42 (1.54) |
0–5 | 36 | 2.35 (2.03) |
0–8 | 17 | 1.72 (1.75) |
0–8 | 53 | 1.78 (2.02) |
0–10 | 117 |
| Perceived Stress Score (PSS) | |||||||||||||||||||||
| PSS Score | 8.96 (6.73) |
0–20 | 24 | 9.88 (6.88) |
0–26 | 43 | 9.55 (6.79) |
0–26 | 67 | 8.24 (5.77) |
0–24 | 37 | 9.10 (7.07) |
0–21 | 20 | 8.54 (6.21) |
0–24 | 57 | 9.10 (6.52) |
0–26 | 124 |
| B: Differences between Groups on Clinical and Behavioral Measurements | |||||||||||||||
|---|---|---|---|---|---|---|---|---|---|---|---|---|---|---|---|
| High BMI vs. Normal BMI | Females with High BMI vs. Males with High BMI |
Females with Normal BMI vs. Males with Normal BMI |
Females with High BMI vs. Females with Normal BMI |
Males with High BMI vs. Males with Normal BMI |
|||||||||||
| Measurement | F | p-value | d | F | p-value | d | F | p-value | d | F | p-value | d | F | p-value | d |
| Age (years) | .56 | .48 | −.26 | 4.22 | .04 | .61 | 1.19 | .28 | .27 | 4.24E-04 | .98 | .006 | 1.20 | .28 | −.26 |
| Patient Health Questionnaire (PHQ) | |||||||||||||||
| PHQ Score | .26 | .61 | .06 | 2.53 | .11 | −.55 | 3.03 | .09 | −.42 | .13 | .72 | −.10 | .12 | .73 | −.11 |
| Perceived Stress Score (PSS) | |||||||||||||||
| PSS Score | .37 | .55 | .16 | .22 | .64 | −.14 | .31 | .58 | −.14 | .19 | .66 | .12 | .17 | .68 | .12 |
Questionnaires: Body Mass Index (BMI), Patient Health Questionnaire (PHQ), Perceived Stress Score (PSS)
Abbreviations: High BMI (BMI≥25kg/m2), Normal BMI (BMI<25kg/m2)
Subject Number (N), Standard Deviation (SD), Cohen d effect size
Significant = p<0.05*, p<0.005**
BMI related Network Metric Differences
Significant BMI-related group differences are summarized in Table 3, Figure 2a.
Table 3.
BMI and sex related differences in anatomical measures of centrality in regions of the reward, salience and sensorimotor networks
| HIGH BMI vs. NORMAL BMI | |||||||
|---|---|---|---|---|---|---|---|
| Reward Network | |||||||
| Region of Interest | Network Metric | T-value | p-value | q-value | β value | Cohen’s d | Interpretation |
| Left Putamen | Strength | −2.12 | .004 | .03 | −.01 | −.49 | High BMI↑ Normal BMI↓ |
| Right Putamen | Eigenvector Centrality | −2.81 | .003 | .02 | −.01 | −.54 | High BMI↑ Normal BMI↓ |
| Salience Network | |||||||
| Region of Interest | Network Metric | T-value | p-value | q-value | β value | Cohen’s d | Interpretation |
| Right aINS (ShoInG) | Eigenvector Centrality | −2.40 | .01 | .04 | −.01 | −.44 | High BMI↑ Normal BMI↓ |
| Sensorimotor Network | |||||||
| Region of Interest | Network Metric | T-value | p-value | q -value | β value | Cohen’s d | Interpretation |
| none | |||||||
| FEMALES WITH HIGH BMI vs. MALES WITH HIGH BMI | |||||||
| Reward Network | |||||||
| Region of Interest | Network Metric | T-value | p-value | q -value | β value | Cohen’s d | Interpretation |
| Left Putamen | Strength | 2.16 | .003 | .02 | .01 | .64 | Females with High BMI↓ Males with High BMI↑ |
| Right Putamen | Strength | 2.16 | .003 | .02 | .01 | .59 | Females with High BMI↓ Males with High BMI↑ |
| Left Amygdala | Strength | −2.02 | .004 | .03 | −.01 | −.73 | Females with High BMI ↑ Males with High BMI ↓ |
| Left Hippocampus | Eigenvector Centrality | −1.98 | .004 | .04 | −.004 | −.81 | Females with High BMI ↑ Males with High BMI ↓ |
| Right Hippocampus | Eigenvector Centrality | −2.38 | .002 | .01 | −.003 | −.84 | Females with High BMI ↑ Males with High BMI ↓ |
| Right Nucleus Accumbens | Strength | −2.04 | .005 | .03 | −.01 | −.57 | Females with High BMI ↑ Males with High BMI ↓ |
| Salience Network | |||||||
| Region of Interest | Network Metric | T-value | p-value | q -value | β value | Cohen’s d | Interpretation |
| Left aMCC | Eigenvector Centrality | −3.85 | .0002 | .001 | −.01 | −1.21 | Females with High BMI ↑ Males with High BMI ↓ |
| Right aMCC | Eigenvector Centrality | −3.41 | .0006 | .003 | −.02 | −1.05 | Females with High BMI ↑ Males with High BMI ↓ |
| Sensorimotor Network | |||||||
| Region of Interest | Network Metric | T-value | p-value | q-value | β value | Cohen’s d | Interpretation |
| Right pINS (LoInG_CINS) | Strength | 3.40 | .001 | .007 | .01 | 1.00 | Females with High BMI↓ Males with High BMI↑ |
| FEMALES WITH HIGH BMI vs. FEMALES WITH NORMAL BMI | |||||||
| Reward Network | |||||||
| Region of Interest | Network Metric | T-value | p-value | q -value | β value | Cohen’s d | Interpretation |
| Left Amygdala | Strength | −2.15 | .004 | .03 | −.01 | −.68 | Females with High BMI↑ Females with Normal BMI↓ |
| Salience Network | |||||||
| Region of Interest | Network Metric | T-value | p-value | q -value | β value | Cohen’s d | Interpretation |
| none | |||||||
| Sensorimotor Network | |||||||
| Region of Interest | Network Metric | T-value | p-value | q -value | β value | Cohen’s d | Interpretation |
| Right InfPreCS (Primary Motor Cortex/M1) | Betweenness Centrality | 2.65 | .009 | .04 | 149.72 | .63 | Females with High BMI↓ Females with Normal BMI↑ |
| MALES WITH HIGH BMI vs. MALES WITH NORMAL BMI | |||||||
| Reward Network | |||||||
| Region of Interest | Network Metric | T-value | p-value | q -value | β value | Cohen’s d | Interpretation |
| Right Putamen | Strength | −2.64 | .001 | .01 | −.01 | −.82 | Males with High BMI↑ Males with Normal BMI↓ |
| Right Putamen | Eigenvector Centrality | −3.15 | .003 | .02 | −.01 | −.81 | Males with High BMI↑ Males with Normal BMI↓ |
| Right Hippocampus | Strength | −2.08 | .004 | .03 | −.004 | −.61 | Males with High BMI↑ Males with Normal BMI↓ |
| Right Medial Orbital Sulcus (mOFG) | Betweenness Centrality | −2.03 | .004 | .03 | −162.39 | −.54 | Males with High BMI↑ Males with Normal BMI↓ |
| Salience Network | |||||||
| Region of Interest | Network Metric | T-value | p-value | q-value | β value | Cohen’s d | Interpretation |
| none | |||||||
| Sensorimotor Network | |||||||
| Region of Interest | Network Metric | T-value | p-value | q -value | β value | Cohen’s d | Interpretation |
| Right Subcentral Gyrus (Secondary Somatosensory Cortex/ S2) | Eigenvector Centrality | −2.39 | .02 | .04 | −.007 | −.45 | Males with High BMI↑ Males with Normal BMI↓ |
| Right mINS (SupCirINS) | Eigenvector Centrality | −2.44 | .01 | .03 | −.006 | −.46 | Males with High BMI↑ Males with Normal BMI↓ |
| Right pINS (InfCirINS) | Eigenvector Centrality | −2.72 | .006 | .03 | −.005 | −.56 | Males with High BMI↑ Males with Normal BMI↓ |
| Left pINS (LoInG_CINS) | Eigenvector Centrality | −2.71 | .004 | .03 | −.006 | −.51 | Males with High BMI↑ Males with Normal BMI↓ |
| Right pINS (PosLS) | Eigenvector Centrality | −2.69 | .006 | .03 | −.004 | −.53 | Males with High BMI↑ Males with Normal BMI↓ |
| FEMALES WITH NORMAL BMI vs. MALES WITH NORMAL BMI | |||||||
| Reward Network | |||||||
| Region of Interest | Network Metric | T-value | p-value | q -value | β value | Cohen’s d | Interpretation |
| Left Caudate Nucleus | Eigenvector Centrality | −2.55 | .01 | .03 | −.01 | −.72 | Females with Normal BMI↑ Males with Normal BMI↓ |
| Right Caudate Nucleus | Eigenvector Centrality | −2.34 | .02 | .04 | −.01 | −.63 | Females with Normal BMI↑ Males with Normal BMI↓ |
| Left Amygdala | Eigenvector Centrality | −2.65 | .008 | .02 | −.01 | −.74 | Females with Normal BMI↑ Males with Normal BMI↓ |
| Right Amygdala | Eigenvector Centrality | −3.18 | .002 | .01 | −.01 | −.82 | Females with Normal BMI↑ Males with Normal BMI↓ |
| Left Hippocampus | Eigenvector Centrality | −2.66 | .008 | .02 | −.01 | −.65 | Females with Normal BMI↑ Males with Normal BMI↓ |
| Right Hippocampus | Eigenvector Centrality | −2.54 | .01 | .04 | −.01 | −.71 | Females with Normal BMI↑ Males with Normal BMI↓ |
| Left Nucleus Accumbens | Eigenvector Centrality | −2.28 | .02 | .03 | −.01 | −.56 | Females with Normal BMI↑ Males with Normal BMI↓ |
| Salience Network | |||||||
| Region of Interest | Network Metric | T-value | p-value | q -value | β value | Cohen’s d | Interpretation |
| none | |||||||
| Sensorimotor Network | |||||||
| Region of Interest | Network Metric | T-value | p-value | q-value | β value | Cohen’s d | Interpretation |
| Left Postcentral Gyrus (PosCG/S1) | Strength | 2.66 | .009 | .04 | .02 | .74 | Females with Normal BMI↓ Males with Normal BMI↑ |
| Right Postcentral Gyrus (PosCG/S1) | Strength | 2.59 | .01 | .04 | .01 | .71 | Females with Normal BMI↓ Males with Normal BMI↑ |
| Left Precentral Gyrus (PreCG/M1) | Strength | 3.64 | .001 | .001 | .02 | .98 | Females with Normal BMI↓ Males with Normal BMI↑ |
| Right Precentral Gyrus (PreCG/M1) | Strength | 2.67 | .01 | .04 | .01 | .82 | Females with Normal BMI↓ Males with Normal BMI↑ |
Groups: High BMI (BMI≥25), Normal BMI (BMI<25)
Abbreviations: BMI, body mass index
Reward Network Regions of Interest: caudate nucleus, putamen, globus pallidus, nucleus accumbens (NAcc), amygdala, hippocampus, medial orbital frontal gyrus (mOFG) and includes parcellations from the medial orbital gyrus (mOG) and medial orbital sulcus (mOS)
Salience Network Regions of Interest: anterior insula (aINS) and includes parcellations from the horizontal ramus of the anterior segment of the lateral sulcus (ALSHorp), anterior segment of the circular sulcus of the insula (ACirINS), vertical ramus of the anterior segment of the lateral sulcus (ALSVerp) and the short insular gyri (ShoInG); anterior mid cingulate cortex (aMCC)
Sensorimotor Network Regions of Interest: thalamus, primary somatosensory cortex/S1 [which includes the postcentral gyrus (PosCG), postcentral sulcus (PosCS), and central sulcus (CS)], secondary somatosensory cortex/S2 [which includes the subcentral gyrus and sulcus (SbCGS)], primary motor cortex/M1 [which includes the precentral gyrus (PreCG), inferior part of the precentral sulcus (InfPreCS), and superior part of the precentral sulcus (SupPreCS)], mid insula (mINS) (superior segment of circular sulcus of the insula [SupCirINS]), posterior insula (pINS) [which includes the long insular gyrus and sulcus (LoInG_CINS), inferior segment of the circular sulcus of the insula (InfCirINS), and the posterior ramus of the lateral sulcus (PosLS)]
Significance: p<.05; q-value FDR corrected for multiple comparisons q<.05
Key
|
| |
| High BMI↑ Normal BMI↓ |
High BMI↓ Normal BMI↑ |
|
| |
| Females with High BMI↑ Males with High BMI↓ |
Females with High BMI↓ Males with High BMI↑ |
|
| |
| Females with High BMI↑ Females with Normal BMI↓ |
Females with High BMI↓ Females with Normal BMI↑ |
|
| |
| Males with High BMI↑ Males with Normal BMI↓ |
Males with High BMI↓ Males with Normal BMI↑ |
|
| |
| Females with Normal BMI↑ Males with Normal BMI↓ |
Females with Normal BMI↓ Males with Normal BMI↑ |
|
| |
Figure 2.
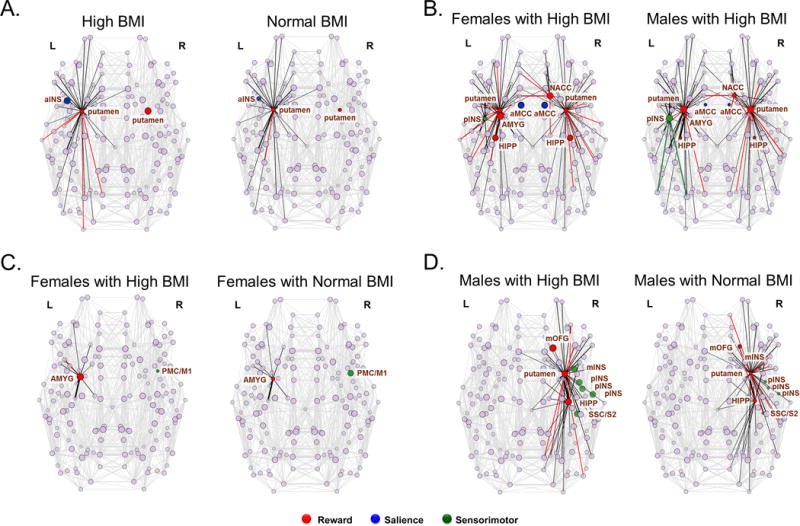
A: BMI-related differences in anatomical network metric measures of centrality
Abbreviations: L, left; R, right; aINS, anterior insula (short insular gyri [ShoInG])
Node Strength is represented by both the number of edges emanating from a given node as well as the thickness of the edge (sized by weight).
Betweenness Centrality and Eigenvector Centrality are depicted by colored nodes with no edges
Significant differences in measures of centrality depicted as Nodes were colored according to the network they belong to (shown below). Black edges that were common to both groups were colored black and edges that were specific to one group were colored according to the network they belonged to (see below).
B: Sex-related differences in anatomical measures of centrality in subjects with high BMI
Abbreviations: L, left; R, right; AMYG, amygdala; HIPP, hippocampus; NACC, nucleus accumbens; aMCC; anterior mid cingulate cortex; pINS, posterior insula (long insular gyrus and sulcus [LongINSGS])
Node Strength is represented by both the number of edges emanating from a given node as well as the thickness of the edge (sized by weight).
Betweenness Centrality and Eigenvector Centrality are depicted by colored nodes with no edges
Significant differences in measures of centrality depicted as Nodes were colored according to the network they belong to (shown below). Black edges that were common to both groups were colored black and edges that were specific to one group were colored according to the network they belonged to (see below).
C: BMI and sex-related differences in anatomical measures of centrality in female subjects with high BMI compared to female subjects with normal BMI
Abbreviations: L, left; R, right; AMYG, amygdala; PMC/M1 primary motor cortex (specifically the inferior part of the precentral sulcus [InfPreCS])
Node Strength is represented by both the number of edges emanating from a given node as well as the thickness of the edge (sized by weight).
Betweenness Centrality and Eigenvector Centrality are depicted by colored nodes with no edges
Significant differences in measures of centrality depicted as Nodes were colored according to the network they belong to (shown below). Black edges that were common to both groups were colored black and edges that were specific to one group were colored according to the network they belonged to (see below).
D: BMI and sex-related differences in anatomical measures of centrality in male subjects with high BMI compared to male subjects with normal BMI
Abbreviations: L, left; R, right; HIPP, hippocampus; mOFG, medial orbital frontal gyrus; SSC/S2, secondary somatosensory cortex [which includes the subcentral gyrus and sulcus [SbCGS]); mINS, mid insula (superior segment of circular sulcus of the insula [SupCirINS]); pINS, posterior insula (which includes the long insular gyrus and sulcus [LongINSGS], inferior segment of the circular sulcus of the insula [InfCirINS], and the posterior ramus of the lateral sulcus [PosLS])
Node Strength is represented by both the number of edges emanating from a given node as well as the thickness of the edge (sized by weight).
Betweenness Centrality and Eigenvector Centrality are depicted by colored nodes with no edges
Significant differences in measures of centrality depicted as Nodes were colored according to the network they belong to (shown below). Black edges that were common to both groups were colored black and edges that were specific to one group were colored according to the network they belonged to (see below).
 Reward
 Salience
 Sensorimotor
Reward
Individuals with high BMIs compared to individuals with normal BMI had higher measures of centrality of the putamen bilaterally (left: strength: q=.03; right: eigenvector centrality: q=.03).
Salience
Individuals with high BMI showed higher measures of eigenvector centrality than individuals with normal BMI in the right aINS (q=.04).
Sensorimotor
No significant differences were found.
Sex-related differences in normal weight subjects
Significant sex-related differences in normal BMI individuals are summarized in Table 3.
Reward
Females with normal BMI compared to males with normal BMI had greater measures of eigenvector centrality in various reward network regions including the bilateral caudate nucleus (left: q=.03; right, q=.04), bilateral amygdala (left: q=.02, right: q=.01), bilateral hippocampus (left: q=.02, right: q=.04) and left nucleus accumbens (q=.03).
Salience
No significant differences.
Sensorimotor
Males with normal BMI compared to females with normal BMI demonstrated greater measures of strength in various sensorimotor regions including the bilateral postcentral gyrus/S1 (left: q==.04, right: q=.04), and the bilateral precentral gyrus/M1 (left: q=.001, right: q=.04).
Sex-related differences in obese subjects
Significant sex-related differences in high BMI individuals are summarized in Table 3, Figure 2b.
Reward
Females with a high BMI compared to males with a high BMI demonstrated higher centrality in various reward regions including the left amygdala (strength: q=.03), right NAcc (strength: q=.03), and bilateral hippocampus (eigenvector centrality: q=.04 [left] and q=.01 [right]). However, males with a high BMI compared to females with a high BMI demonstrated higher strength of the putamen (left: q=.02; right: q=.02).
Salience
Females with a high BMI had greater values of eigenvector centrality in the aMCC (left: q=.001; right: q=.003) compared to males with high BMI.
Sensorimotor
Males with high BMI had greater values of strength in the right pINS (q=.007) compared to females with high BMI.
Differences in female subjects with high vs. normal BMI
Significant BMI-related differences in females are summarized in Table 3, Figure 2c.
Reward
Females with high BMI had greater strength in the left amygdala (q=.03) compared to females with normal BMI.
Salience
No significant differences were observed.
Sensorimotor
Females with high BMI had lower betweenness centrality in the right primary motor cortex/M1 (q=.04) compared to females with normal BMI.
Differences in male subjects with high and normal BMI
Significant BMI-related differences in males are summarized in Table 3, Figure 2d.
Reward
Males with high BMI compared to males with normal BMI had greater measures of centrality in various reward network regions including the right putamen (strength: q=.01; eigenvector centrality: q=.02), right hippocampus (strength: q=.03), and right mOFG (betweenness centrality: q=.03).
Salience
No significant differences were observed.
Sensorimotor
Males with high BMI compared to males with normal BMI demonstrated greater measures of eigenvector centrality in various sensorimotor regions including the right secondary somatosensory cortex/S2 (q==.04), right mINS (q=.03), and several subregions of the right pINS including the inferior segment of the circular sulcus of the insula (q=.03), long insular gyrus and sulcus (q=.03), and the posterior ramus of the lateral sulcus (q=.03).
DISCUSSION
Our findings demonstrate that high BMI is associated with sex-specific alterations in the connectedness of core regions of the reward, salience and sensorimotor networks. Regions with high centrality promote functional integration by enabling global communication between communities through network hubs.34, 35 Across males and females, individuals with high BMI compared to those with normal BMI had higher connectedness of the bilateral putamen and the right aINS. Amongst subjects with high BMI, females compared to males showed greater centrality in core regions of the reward and salience networks, while males with high BMI also showed greater centrality in regions of the sensorimotor regions. Our findings are consistent with earlier reports regarding regional brain alterations in reward, salience and sensorimotor networks in obesity, but demonstrate additional sex specific alterations in anatomical centrality of some regions. To our knowledge this is the first study to investigate sex differences of obesity-related alterations in the anatomical architecture of specific brain networks.
Association of high BMI with centrality measures of reward network regions
Several functional alterations in the reward network have been observed in the context of ingestive behavior and obesity.7, 8, 16 Studies involving food images, food ingestion, gustatory or olfactory cues have demonstrated increased activity in the basal ganglia and OFG (reward, motivation), amygdala (emotion), hippocampus (memory), precentral and postcentral gyrus and pINS (sensorimotor), and aINS (awareness, salience assessment).
The similarity of reward network alterations related to food intake with activation patterns observed in patients with drug addiction, has led to the term “food addiction” or hedonic eating,8, 14, 26 a behavior which has been implicated in the pathophysiology of some forms of obesity.7 The basal ganglia (putamen, caudate nucleus, globus pallidum, and NAcc) and related corticostriatal pathways play a crucial role in the reward network.33 The basal ganglia receive inputs from several cortical (including sensory, motor), limbic, and midbrain regions, and are involved in a range of learning behaviors based on reward outcomes and anticipation.31 These pathways are also involved in the acquisition and development of reward-based memories and values attributed to food intake.31 Dopamine release in the NAcc can influence motivation towards consumption of food and alterations in dopamine signaling have been implicated in hedonic eating.8 According to the reward-deficiency model, hedonic eating occurs as a result of decreased dopamine receptor availability in the reward and salience regions with increasing BMI.54, 55
We found higher connectedness in regions of the bilateral putamen in individuals with high compared to those with normal BMI, consistent with the increased functional connectivity and hyperactivity observed within the reward network in several obesity studies.16–19, 29 These prior studies have demonstrated a correlation between BMI and activity in the putamen,56 greater connectivity of the putamen with salience regions,13 and greater activation of the putamen after the ingestion of high sugar versus high fat.49 A recent study identified significant BMI-related differences in the structural connectivity of the putamen with other reward regions in explaining the variance attributed to predicting individuals with non-healthy weights.57 The reduced local connectivity of the putamen previously reported in obese individuals,58 differs from our findings, and these differences could be attributed to the fact that in their study participants had BMIs>30, that sex as a variable was not considered, and due to the smaller sample size.
The dorsal striatum (consisting of the putamen and caudate nucleus) functions as the key input region to the basal ganglia. It receives projections from prefrontal cortical regions and makes projections to the sensorimotor cortex and can influence reward behaviors such as reinforcing the value of food.8, 33 A study found that white-matter connectivity between the striatum and subcortical regions (hippocampus and amygdala) was negatively correlated with the number of dopamine receptors, and increased desire for seeking novel experiences, as well as increased impulsive and reward-seeking behaviors.59 Reduced dopamine signaling in the striatum is also associated with reinforcing the rewarding properties of food.55 Even though the causality remains to be determined, our findings suggest that anatomical rewiring of regions in the brain’s reward network are present in obese individuals, which may play a role in the persistence of hedonic eating behavior. Longitudinal studies will need to determine if high BMI and associated metabolic changes causes a rewiring in brain architecture, or if genetic and environmental factors shape brain networks, which increase the vulnerability to develop maladaptive eating behaviors in obesity.
Association of high BMI with centrality measures of the salience network regions
The salience network, with its key regions aINS, aMCC and prefrontal cortex continuously monitors the homeostatic state of the body and adjusts to real or expected perturbations in homeostasis through autonomic nervous system and behavioral responses.14 Functional alterations, including increased connectivity of the salience network13 and increased activation of the aINS by food cues after the ingestion of a sugary drink19 have been observed in obese subjects. Other DTI studies have found reduced white-matter integrity in regions of the salience network.23, 60–62 While some studies have reported decreased fiber density in the aINS,10, 22, 62 we found increased centrality of the right aINS suggesting greater global communication. Our results suggest that alterations in key brain regions involved with sensory integration, salience attribution, and motivation processes may contribute to increased food intake behaviors in obesity.24, 60, 62
The acquisition of reward-based behaviors is mediated by projections from the prefrontal cortex to the striatum,9, 33 and in obesity disruptions in the modulation of these striatal-prefrontal pathways may be associated with difficulties with decision-making, motivation, and cognitive integration related to food addiction behaviors.62 Lower levels of dopamine signaling, which consists of both a reduction of receptors and a decrease in dopamine release in these regions, are also associated with metabolic activity, suggesting a loss of cognitive control when it comes to eating behaviors in obese individuals.55 When viewed together, one can speculate that the presence of anatomical brain alterations in key regions of the salience network is associated with altered appraisal of food cues and food-related stimuli in obese subjects. The findings of altered salience network architecture suggest that individuals with high BMI process and appraise taste reward differently, and that they have difficulty restraining ingestive hedonic behavior despite awareness of the negative consequences of overconsumption.
Sex-related differences
Amongst obese subjects, females showed greater connectedness than males in regions of the reward network (hippocampus, amygdala, NAcc), and salience network (aMCC). In contrast, males with high BMI showed greater centrality in the putamen and in the pINS. These findings in the obese were similar to those seen in normal weight subjects where females also showed greater connectivity in hippocampus, amygdala, NAcc and caudate nucleus, while males had greater connectivity in pre- and postcentral gyrus (S1/M1). Within females, those with high BMI had greater centrality in the left amygdala, but less connectedness in the primary motor cortex. Within males, those with high BMI showed more widespread differences, with greater centrality in putamen, hippocampus, mOFG, secondary somatosensory cortex/S2 and mid and posterior INS.
Our structural findings are consistent with previous results from functional studies which have shown that obese women have increased functional connectivity and activity in key regions of the reward (NAcc amygdala, hippocampus)4, 17, 19, 49 and salience (aMCC)18, 19 networks. Since these regions modulate feeding behavior through learning and food memories, they impact the desire to eat specific types of food (cravings),19 and damage to these regions can result in hyperphagia in obese women.19, 29, 49 Together with the observed increase in global connectedness in regions of the reward and salience networks in females compared to males, our findings are consistent with the hypothesis that women are more prone to weight gain due to greater engagement of these networks, enhanced valence attributed to palatable food cues, and increased susceptibility to cravings associated with the hedonic properties of certain foods such as sugar.18, 19, 29
The sensorimotor network receives sensory input from the periphery and plays an important role in body sensation awareness and generation of appropriate motor responses.10 Exposure to energy dense foods results in greater functional activation of sensorimotor and motor regions in obese males.4, 29 Obese men have demonstrated increased activity in regions involved with interoception, motor execution, and planning.26 The observed increased centrality in sensorimotor regions based on brain structure is consistent with studies that have shown greater neural activity in motor regions (e.g. supplementary motor areas) and greater functional connectivity from the amygdala to sensorimotor regions in obese males.4, 29 There has also been a link between reduced dopamine receptor availability in striatal regions and metabolism in the sensorimotor regions which process palatability, highlighting a possible mechanism underlying reward associated with food intake. When viewed together, our findings suggest that obese males differ from their female counterparts in the processing and modulation of sensory information, possibly including information arising from afferents innervating the oral cavity, which encode the texture of food.26, 63
Limitations and Directions for Future Research
The cross sectional nature of the study did not enable us to address questions of causality between the observed brain changes and obesity. Future studies are needed to determine if the observed anatomical alterations in brain networks in obesity are a premorbid state, or if they are a consequence of remodeling of the brain secondary to obesity and associated metabolic changes. Even though women were scanned during the follicular phase of the menstrual cycle, we did not measure female sex hormones. While BMI is the most widely used measure of obesity, it is not ideal and future studies need to consider other methods to measure obesity such as waist-hip ratio or visceral adiposity in order to validate the current BMI studies. Future studies with larger samples will also need to address the differences between overweight and obese groups. Associations with eating behaviors, eating preferences, and diet information are required in order to better understand these findings. From a methodological perspective, as more computationally effective and efficient algorithms develop, future studies should use probabilistic tractrography algorithms as a way to model fiber tract information, and investigate measures of centrality using functional connectome information. By using multimodal imaging modalities, such approaches will provide complementary information.
Conclusions and Clinical Implications
Our results confirm the hypothesis that in both men and women, high BMI is associated with anatomical alterations in several overlapping brain networks, while emphasizing the importance to consider sex-related differences in these alterations. The more prominent alterations in connectedness of regions of the reward network, including the amygdala in women may play a role in the greater prevalence of emotion-related and compulsive behavior related to increased hedonic ingestion. In contrast, the greater connectedness of reward and sensorimotor regions in males points towards a different pattern of brain remodeling. These findings may have implications for more personalized treatments for obesity, taking into consideration the sex of the affected individual.
Supplementary Material
Groups: High BMI (BMI≥25), Normal BMI (BMI<25)
Abbreviations: BMI, body mass index.
KEY: X denotes significant results of the ordinary least squares analysis model applied to test the differences in centrality in brain ROIs based upon subject groups defines by BMI and sex, and corrected for multiple comparisons (FDR: q-value=.05).
Reward Network Regions of Interest: caudate nucleus, putamen, globus pallidus, nucleus accumbens (NAcc), amygdala, hippocampus, medial orbital frontal gyrus (mOFG) and includes parcellations from the medial orbital gyrus (mOG) and medial orbital sulcus (mOS)
Salience Network Regions of Interest: anterior insula (aINS) and includes parcellations from the horizontal ramus of the anterior segment of the lateral sulcus (ALSHorp), anterior segment of the circular sulcus of the insula (ACirINS), vertical ramus of the anterior segment of the lateral sulcus (ALSVerp) and the short insular gyri (ShoInG); anterior mid cingulate cortex (aMCC)
Sensorimotor Network Regions of Interest: thalamus, primary somatosensory cortex/S1 [which includes the postcentral gyrus (PosCG), postcentral sulcus (PosCS), and central sulcus (CS)], secondary somatosensory cortex/S2 [which includes the subcentral gyrus and sulcus (SbCGS)], primary motor cortex/M1 [which includes the precentral gyrus (PreCG), inferior part of the precentral sulcus (InfPreCS), and superior part of the precentral sulcus (SupPreCS)], mid insula (mINS) (superior segment of circular sulcus of the insula [SupCirINS]), posterior insula (pINS) [which includes the long insular gyrus and sulcus (LoInG_CINS), inferior segment of the circular sulcus of the insula (InfCirINS), and the posterior ramus of the lateral sulcus (PosLS)]
Acknowledgments
Funding Support: This research was supported by grants from the National Institutes of Health including K23 DK106528 (AG), R01 DK048351 (EAM), P50 DK064539 (EAM), P30 DK041301, R01 AT007137 (KT), R03 DK084169 (JSL), and pilot funds were provided for brain scanning by the Ahmanson-Lovelace Brain Mapping Center.
Footnotes
Conflicts of Interest: The authors have no conflicts of interest to disclose.
Author Contributions:
Arpana Gupta: Study concept and design, analysis and interpretation of data, drafting and revision of manuscript
Emeran Mayer: Drafting and critical review of manuscript, approval of final version of the manuscript, study funding
Kareem Hamadani: Generation of data, data analysis
Ravi Bhatt: Analysis of data
Connor Fling: Analysis of data
Mher Alverydan: Analysis of data
Carina Torgenson: Analysis of data
Cody Ashe-McNalley: Analysis of data
John D Van Horn: Analysis of data
Bruce Naliboff: Review of manuscript, study funding
Kirsten Tillisch: Review of manuscript, study funding
Claudia P. Sanmiguel: Drafting and critical review of manuscript, data interpretation
Jennifer S. Labus: Study concept and design, analysis and interpretation of data, drafting and revision of manuscript, approval of final version of the manuscript, study funding
References
- 1.Ogden CL, Carroll MD, Kit BK, Flegal KM. Prevalence of childhood and adult obesity in the United States, 2011–2012. JAMA. 2014;311(8):806–14. doi: 10.1001/jama.2014.732. [DOI] [PMC free article] [PubMed] [Google Scholar]
- 2.Lovejoy JC, Sainsbury A, Stock Conference Working G Sex differences in obesity and the regulation of energy homeostasis. Obesity reviews: an official journal of the International Association for the Study of Obesity. 2009;10(2):154–67. doi: 10.1111/j.1467-789X.2008.00529.x. [DOI] [PubMed] [Google Scholar]
- 3.Flegal KM, Carroll MD, Ogden CL, Curtin LR. Prevalence and Trends in Obesity Among US Adults, 1999–2008. Jama-J Am Med Assoc. 2010;303(3):235–241. doi: 10.1001/jama.2009.2014. [DOI] [PubMed] [Google Scholar]
- 4.Atalayer D, Pantazatos SP, Gibson CD, McOuatt H, Puma L, Astbury NM, et al. Sexually dimorphic functional connectivity in response to high vs. low energy-dense food cues in obese humans: an fMRI study. NeuroImage. 2014;100:405–13. doi: 10.1016/j.neuroimage.2014.05.054. [DOI] [PMC free article] [PubMed] [Google Scholar]
- 5.Ogden CL, Carroll MD, Kit BK, Flegal KM. Prevalence of obesity in the United States, 2009–2010. NCHS data brief. 2012;(82):1–8. [PubMed] [Google Scholar]
- 6.Das UN. Obesity: genes, brain, gut, and environment. Nutrition. 2010;26(5):459–73. doi: 10.1016/j.nut.2009.09.020. [DOI] [PubMed] [Google Scholar]
- 7.Kenny PJ. Reward mechanisms in obesity: new insights and future directions. Neuron. 2011;69(4):664–79. doi: 10.1016/j.neuron.2011.02.016. [DOI] [PMC free article] [PubMed] [Google Scholar]
- 8.Volkow ND, Wang GJ, Baler RD. Reward, dopamine and the control of food intake: implications for obesity. Trends in cognitive sciences. 2011;15(1):37–46. doi: 10.1016/j.tics.2010.11.001. [DOI] [PMC free article] [PubMed] [Google Scholar]
- 9.Bartholdy S, Dalton B, O’Daly OG, Campbell IC, Schmidt U. A systematic review of the relationship between eating, weight and inhibitory control using the stop signal task. Neurosci Biobehav Rev. 2016;64:35–62. doi: 10.1016/j.neubiorev.2016.02.010. [DOI] [PubMed] [Google Scholar]
- 10.Gupta A, Mayer EA, Sanmiguel CP, Van Horn JD, Woodworth D, Ellingson BM, et al. Patterns of brain structural connectivity differentiate normal weight from overweight subjects. NeuroImage Clinical. 2015;7:506–17. doi: 10.1016/j.nicl.2015.01.005. [DOI] [PMC free article] [PubMed] [Google Scholar]
- 11.Stice E, Yokum S, Burger KS, Epstein LH, Small DM. Youth at risk for obesity show greater activation of striatal and somatosensory regions to food. The Journal of neuroscience: the official journal of the Society for Neuroscience. 2011;31(12):4360–6. doi: 10.1523/JNEUROSCI.6604-10.2011. [DOI] [PMC free article] [PubMed] [Google Scholar]
- 12.Olivo G, Wiemerslage L, Nilsson EK, Solstrand Dahlberg L, Larsen AL, Olaya Bucaro M, et al. Resting-State Brain and the FTO Obesity Risk Allele: Default Mode, Sensorimotor, and Salience Network Connectivity Underlying Different Somatosensory Integration and Reward Processing between Genotypes. Front Hum Neurosci. 2016;10:52. doi: 10.3389/fnhum.2016.00052. [DOI] [PMC free article] [PubMed] [Google Scholar]
- 13.Garcia-Garcia I, Jurado MA, Garolera M, Segura B, Sala-Llonch R, Marques-Iturria I, et al. Alterations of the salience network in obesity: a resting-state fMRI study. Human brain mapping. 2013;34(11):2786–97. doi: 10.1002/hbm.22104. [DOI] [PMC free article] [PubMed] [Google Scholar]
- 14.Volkow ND, Baler RD. NOW vs LATER brain circuits: implications for obesity and addiction. Trends Neurosci. 2015;38(6):345–52. doi: 10.1016/j.tins.2015.04.002. [DOI] [PubMed] [Google Scholar]
- 15.Wijngaarden MA, Veer IM, Rombouts SA, van Buchem MA, Willems van Dijk K, Pijl H, et al. Obesity is marked by distinct functional connectivity in brain networks involved in food reward and salience. Behavioural brain research. 2015;287:127–34. doi: 10.1016/j.bbr.2015.03.016. [DOI] [PubMed] [Google Scholar]
- 16.Carnell S, Gibson C, Benson L, Ochner CN, Geliebter A. Neuroimaging and obesity: current knowledge and future directions. Obesity reviews: an official journal of the International Association for the Study of Obesity. 2012;13(1):43–56. doi: 10.1111/j.1467-789X.2011.00927.x. [DOI] [PMC free article] [PubMed] [Google Scholar]
- 17.Coveleskie K, Gupta A, Kilpatrick LA, Mayer ED, Ashe-McNalley C, Stains J, et al. Altered functional connectivity within the central reward network in overweight and obese women. Nutr Diabetes. 2015;5:e148. doi: 10.1038/nutd.2014.45. [DOI] [PMC free article] [PubMed] [Google Scholar]
- 18.Kilpatrick LA, Coveleskie K, Connolly L, Labus JS, Ebrat B, Stains J, et al. Influence of sucrose ingestion on brainstem and hypothalamic intrinsic oscillations in lean and obese women. Gastroenterology. 2014;146(5):1212–21. doi: 10.1053/j.gastro.2014.01.023. [DOI] [PMC free article] [PubMed] [Google Scholar]
- 19.Connolly L, Coveleskie K, Kilpatrick LA, Labus JS, Ebrat B, Stains J, et al. Differences in brain responses between lean and obese women to a sweetened drink. Neurogastroenterology and motility: the official journal of the European Gastrointestinal Motility Society. 2013;25(7):579–e460. doi: 10.1111/nmo.12125. [DOI] [PMC free article] [PubMed] [Google Scholar]
- 20.Medic N, Ziauddeen H, Ersche KD, Farooqi IS, Bullmore ET, Nathan PJ, et al. Increased body mass index is associated with specific regional alterations in brain structure. International journal of obesity. 2016 doi: 10.1038/ijo.2016.42. [DOI] [PMC free article] [PubMed] [Google Scholar]
- 21.Raji CA, Ho AJ, Parikshak NN, Becker JT, Lopez OL, Kuller LH, et al. Brain structure and obesity. Human brain mapping. 2010;31(3):353–64. doi: 10.1002/hbm.20870. [DOI] [PMC free article] [PubMed] [Google Scholar]
- 22.Shott ME, Cornier MA, Mittal VA, Pryor TL, Orr JM, Brown MS, et al. Orbitofrontal cortex volume and brain reward response in obesity. International journal of obesity. 2014 doi: 10.1038/ijo.2014.121. [DOI] [PMC free article] [PubMed] [Google Scholar]
- 23.Stanek KM, Grieve SM, Brickman AM, Korgaonkar MS, Paul RH, Cohen RA, et al. Obesity is associated with reduced white matter integrity in otherwise healthy adults. Obesity. 2011;19(3):500–4. doi: 10.1038/oby.2010.312. [DOI] [PubMed] [Google Scholar]
- 24.Kullmann S, Callaghan MF, Heni M, Weiskopf N, Scheffler K, Haring HU, et al. Specific white matter tissue microstructure changes associated with obesity. NeuroImage. 2016;125:36–44. doi: 10.1016/j.neuroimage.2015.10.006. [DOI] [PMC free article] [PubMed] [Google Scholar]
- 25.Karlsson HK, Tuulari JJ, Hirvonen J, Lepomaki V, Parkkola R, Hiltunen J, et al. Obesity is associated with white matter atrophy: a combined diffusion tensor imaging and voxel-based morphometric study. Obesity. 2013;21(12):2530–7. doi: 10.1002/oby.20386. [DOI] [PubMed] [Google Scholar]
- 26.Volkow ND, Wang GJ, Tomasi D, Baler RD. Obesity and addiction: neurobiological overlaps. Obesity reviews: an official journal of the International Association for the Study of Obesity. 2013;14(1):2–18. doi: 10.1111/j.1467-789X.2012.01031.x. [DOI] [PMC free article] [PubMed] [Google Scholar]
- 27.Hogenkamp PS, Zhou W, Dahlberg LS, Stark J, Larsen AL, Olivo G, et al. Higher resting-state activity in reward-related brain circuits in obese versus normal-weight females independent of food intake. International journal of obesity. 2016 doi: 10.1038/ijo.2016.105. [DOI] [PMC free article] [PubMed] [Google Scholar]
- 28.Uher R, Treasure J, Heining M, Brammer MJ, Campbell IC. Cerebral processing of food-related stimuli: effects of fasting and gender. Behavioural brain research. 2006;169(1):111–9. doi: 10.1016/j.bbr.2005.12.008. [DOI] [PubMed] [Google Scholar]
- 29.Geliebter A, Pantazatos SP, McOuatt H, Puma L, Gibson CD, Atalayer D. Sex-based fMRI differences in obese humans in response to high vs. low energy food cues. Behavioural brain research. 2013;243:91–6. doi: 10.1016/j.bbr.2012.12.023. [DOI] [PMC free article] [PubMed] [Google Scholar]
- 30.Zhang B, Tian D, Yu C, Zhang J, Tian X, von Deneen KM, et al. Altered baseline brain activities before food intake in obese men: a resting state fMRI study. Neuroscience letters. 2015;584:156–61. doi: 10.1016/j.neulet.2014.10.020. [DOI] [PubMed] [Google Scholar]
- 31.Haber SN, Knutson B. The reward circuit: linking primate anatomy and human imaging. Neuropsychopharmacology: official publication of the American College of Neuropsychopharmacology. 2010;35(1):4–26. doi: 10.1038/npp.2009.129. [DOI] [PMC free article] [PubMed] [Google Scholar]
- 32.Vicente AF, Bermudez MA, Romero Mdel C, Perez R, Gonzalez F. Putamen neurons process both sensory and motor information during a complex task. Brain research. 2012;1466:70–81. doi: 10.1016/j.brainres.2012.05.037. [DOI] [PubMed] [Google Scholar]
- 33.Balleine BW, Delgado MR, Hikosaka O. The role of the dorsal striatum in reward and decision-making. The Journal of neuroscience: the official journal of the Society for Neuroscience. 2007;27(31):8161–5. doi: 10.1523/JNEUROSCI.1554-07.2007. [DOI] [PMC free article] [PubMed] [Google Scholar]
- 34.Rubinov M, Sporns O. Complex network measures of brain connectivity: uses and interpretations. NeuroImage. 2010;52(3):1059–69. doi: 10.1016/j.neuroimage.2009.10.003. [DOI] [PubMed] [Google Scholar]
- 35.Bullmore E, Sporns O. Complex brain networks: graph theoretical analysis of structural and functional systems. Nat Rev Neurosci. 2009;10(3):186–98. doi: 10.1038/nrn2575. [DOI] [PubMed] [Google Scholar]
- 36.Sporns O. Structure and function of complex brain networks. Dialogues Clin Neurosci. 2013;15(3):247–62. doi: 10.31887/DCNS.2013.15.3/osporns. [DOI] [PMC free article] [PubMed] [Google Scholar]
- 37.Kroenke K, Spitzer RL, Williams JB. The PHQ-15: validity of a new measure for evaluating the severity of somatic symptoms. Psychosomatic medicine. 2002;64(2):258–66. doi: 10.1097/00006842-200203000-00008. [DOI] [PubMed] [Google Scholar]
- 38.Cohen S, Kamarck T, Mermelstein R. A global measure of perceived stress. J Health Soc Behav. 1983;24(4):385–96. [PubMed] [Google Scholar]
- 39.Fischl B, Salat DH, Busa E, Albert M, Dieterich M, Haselgrove C, et al. Whole brain segmentation: Automated labeling of neuroanatomical structures in the human brain. Neuron. 2002;33(3):341–355. doi: 10.1016/s0896-6273(02)00569-x. [DOI] [PubMed] [Google Scholar]
- 40.Dale AM, Fischl B, Sereno MI. Cortical surface-based analysis - I. Segmentation and surface reconstruction. NeuroImage. 1999;9(2):179–194. doi: 10.1006/nimg.1998.0395. [DOI] [PubMed] [Google Scholar]
- 41.Destrieux C, Fischl B, Dale A, Halgren E. Automatic parcellation of human cortical gyri and sulci using standard anatomical nomenclature. NeuroImage. 2010;53(1):1–15. doi: 10.1016/j.neuroimage.2010.06.010. [DOI] [PMC free article] [PubMed] [Google Scholar]
- 42.van den Heuvel MP, Sporns O. Rich-club organization of the human connectome. The Journal of neuroscience: the official journal of the Society for Neuroscience. 2011;31(44):15775–86. doi: 10.1523/JNEUROSCI.3539-11.2011. [DOI] [PMC free article] [PubMed] [Google Scholar]
- 43.van den Heuvel MP, Sporns O, Collin G, Scheewe T, Mandl RC, Cahn W, et al. Abnormal rich club organization and functional brain dynamics in schizophrenia. JAMA psychiatry. 2013;70(8):783–92. doi: 10.1001/jamapsychiatry.2013.1328. [DOI] [PubMed] [Google Scholar]
- 44.Bonilha L, Gleichgerrcht E, Fridriksson J, Rorden C, Breedlove JL, Nesland T, et al. Reproducibility of the Structural Brain Connectome Derived from Diffusion Tensor Imaging. Plos One. 2015;10(8):e0135247. doi: 10.1371/journal.pone.0135247. [DOI] [PMC free article] [PubMed] [Google Scholar]
- 45.Fischi-Gomez E, Vasung L, Meskaldji DE, Lazeyras F, Borradori-Tolsa C, Hagmann P, et al. Structural Brain Connectivity in School-Age Preterm Infants Provides Evidence for Impaired Networks Relevant for Higher Order Cognitive Skills and Social Cognition. Cerebral cortex. 2015;25(9):2793–805. doi: 10.1093/cercor/bhu073. [DOI] [PubMed] [Google Scholar]
- 46.Kubicki M, Park H, Westin CF, Nestor PG, Mulkern RV, Maier SE, et al. DTI and MTR abnormalities in schizophrenia: analysis of white matter integrity. NeuroImage. 2005;26(4):1109–18. doi: 10.1016/j.neuroimage.2005.03.026. [DOI] [PMC free article] [PubMed] [Google Scholar]
- 47.van den Heuvel MP, Stam CJ, Kahn RS, Hulshoff Pol HE. Efficiency of functional brain networks and intellectual performance. The Journal of neuroscience: the official journal of the Society for Neuroscience. 2009;29(23):7619–24. doi: 10.1523/JNEUROSCI.1443-09.2009. [DOI] [PMC free article] [PubMed] [Google Scholar]
- 48.Seeley WW, Menon V, Schatzberg AF, Keller J, Glover GH, Kenna H, et al. Dissociable intrinsic connectivity networks for salience processing and executive control. Journal of Neuroscience. 2007;27(9):2349–2356. doi: 10.1523/JNEUROSCI.5587-06.2007. [DOI] [PMC free article] [PubMed] [Google Scholar]
- 49.Stice E, Burger KS, Yokum S. Relative ability of fat and sugar tastes to activate reward, gustatory, and somatosensory regions. Am J Clin Nutr. 2013;98(6):1377–84. doi: 10.3945/ajcn.113.069443. [DOI] [PMC free article] [PubMed] [Google Scholar]
- 50.Opsahl T, Agneessens F, Skortez J. Node centrality in weighted networks: Generalizing degree and shortest paths. Social Networks. 2010;32(3):245–251. [Google Scholar]
- 51.Winkler AM, Ridgway GR, Webster MA, Smith SM, Nichols TE. Permutation inference for the general linear model. NeuroImage. 2014;92:381–97. doi: 10.1016/j.neuroimage.2014.01.060. [DOI] [PMC free article] [PubMed] [Google Scholar]
- 52.Benjamini Y, Krieger AM, Yekutieli D. Adaptive linear step-up procedures that control the false discovery rate. Biometrika. 2006;93(3):491–507. [Google Scholar]
- 53.Fritz CO, Morris PE, Richler JJ. Effect size estimates: current use, calculations, and interpretation. J Exp Psychol Gen. 2012;141(1):2–18. doi: 10.1037/a0024338. [DOI] [PubMed] [Google Scholar]
- 54.Dang LC, Samanez-Larkin GR, Castrellon JJ, Perkins SF, Cowan RL, Zald DH. Associations between dopamine D2 receptor availability and BMI depend on age. NeuroImage. 2016 doi: 10.1016/j.neuroimage.2016.05.044. [DOI] [PMC free article] [PubMed] [Google Scholar]
- 55.Volkow ND, Wang GJ, Telang F, Fowler JS, Thanos PK, Logan J, et al. Low dopamine striatal D2 receptors are associated with prefrontal metabolism in obese subjects: possible contributing factors. NeuroImage. 2008;42(4):1537–43. doi: 10.1016/j.neuroimage.2008.06.002. [DOI] [PMC free article] [PubMed] [Google Scholar]
- 56.Dietrich A, Hollmann M, Mathar D, Villringer A, Horstmann A. Brain regulation of food craving: relationships with weight status and eating behavior. International journal of obesity. 2016 doi: 10.1038/ijo.2016.28. [DOI] [PubMed] [Google Scholar]
- 57.Park BY, Seo J, Yi J, Park H. Structural and Functional Brain Connectivity of People with Obesity and Prediction of Body Mass Index Using Connectivity. Plos One. 2015;10(11):e0141376. doi: 10.1371/journal.pone.0141376. [DOI] [PMC free article] [PubMed] [Google Scholar]
- 58.Marques-Iturria I, Scholtens LH, Garolera M, Pueyo R, Garcia-Garcia I, Gonzalez-Tartiere P, et al. Affected connectivity organization of the reward system structure in obesity. NeuroImage. 2015;111:100–6. doi: 10.1016/j.neuroimage.2015.02.012. [DOI] [PubMed] [Google Scholar]
- 59.Cohen MX, Schoene-Bake JC, Elger CE, Weber B. Connectivity-based segregation of the human striatum predicts personality characteristics. Nat Neurosci. 2009;12(1):32–4. doi: 10.1038/nn.2228. [DOI] [PubMed] [Google Scholar]
- 60.Xu J, Li Y, Lin H, Sinha R, Potenza MN. Body mass index correlates negatively with white matter integrity in the fornix and corpus callosum: a diffusion tensor imaging study. Human brain mapping. 2013;34(5):1044–52. doi: 10.1002/hbm.21491. [DOI] [PMC free article] [PubMed] [Google Scholar]
- 61.Shott ME, Cornier MA, Mittal VA, Pryor TL, Orr JM, Brown MS, et al. Orbitofrontal cortex volume and brain reward response in obesity. International journal of obesity. 2015;39(2):214–21. doi: 10.1038/ijo.2014.121. [DOI] [PMC free article] [PubMed] [Google Scholar]
- 62.Riederer JW, Shott ME, Deguzman M, Pryor TL, Frank GK. Understanding Neuronal Architecture in Obesity through Analysis of White Matter Connection Strength. Front Hum Neurosci. 2016;10:271. doi: 10.3389/fnhum.2016.00271. [DOI] [PMC free article] [PubMed] [Google Scholar]
- 63.Rapuano KM, Huckins JF, Sargent JD, Heatherton TF, Kelley WM. Individual Differences in Reward and Somatosensory-Motor Brain Regions Correlate with Adiposity in Adolescents. Cerebral cortex. 2016;26(6):2602–11. doi: 10.1093/cercor/bhv097. [DOI] [PMC free article] [PubMed] [Google Scholar]
Associated Data
This section collects any data citations, data availability statements, or supplementary materials included in this article.
Supplementary Materials
Groups: High BMI (BMI≥25), Normal BMI (BMI<25)
Abbreviations: BMI, body mass index.
KEY: X denotes significant results of the ordinary least squares analysis model applied to test the differences in centrality in brain ROIs based upon subject groups defines by BMI and sex, and corrected for multiple comparisons (FDR: q-value=.05).
Reward Network Regions of Interest: caudate nucleus, putamen, globus pallidus, nucleus accumbens (NAcc), amygdala, hippocampus, medial orbital frontal gyrus (mOFG) and includes parcellations from the medial orbital gyrus (mOG) and medial orbital sulcus (mOS)
Salience Network Regions of Interest: anterior insula (aINS) and includes parcellations from the horizontal ramus of the anterior segment of the lateral sulcus (ALSHorp), anterior segment of the circular sulcus of the insula (ACirINS), vertical ramus of the anterior segment of the lateral sulcus (ALSVerp) and the short insular gyri (ShoInG); anterior mid cingulate cortex (aMCC)
Sensorimotor Network Regions of Interest: thalamus, primary somatosensory cortex/S1 [which includes the postcentral gyrus (PosCG), postcentral sulcus (PosCS), and central sulcus (CS)], secondary somatosensory cortex/S2 [which includes the subcentral gyrus and sulcus (SbCGS)], primary motor cortex/M1 [which includes the precentral gyrus (PreCG), inferior part of the precentral sulcus (InfPreCS), and superior part of the precentral sulcus (SupPreCS)], mid insula (mINS) (superior segment of circular sulcus of the insula [SupCirINS]), posterior insula (pINS) [which includes the long insular gyrus and sulcus (LoInG_CINS), inferior segment of the circular sulcus of the insula (InfCirINS), and the posterior ramus of the lateral sulcus (PosLS)]