Abstract
Although BMP-9 has been reported to induce browning of white adipose tissues (WATs) and suppress high fat diet-induced obesity, detailed molecular mechanism needs to be further elucidated. We report here that administration of MB109, a recombinant derivative of human BMP-9, into obese mice enhanced gene expression of fibroblast growth factor 21 (FGF21), a metabolic regulator, and alleviates a spectrum of pathological symptoms due to high fat diet-induced obesity. In addition, periodical injection of MB109 (500 μg/kg/week) reduced an amount of lipid droplets in the liver, serum levels of alanine aminotransferase (ALT), and total cholesterol. These results indicate that MB109 is also effective to treat obesity-mediated non-alcoholic fatty liver disease (NAFLD).
Keywords: ALT, BMP-9, FGF21, Obesity, Stem cell, UCP1
1. Introduction
Worldwide prevalence of obesity and obesity-associated type 2 diabetes has raised the economic and medical burden to an unprecedented level [1]. Imbalance of energy intake to energy expenditure causes storage of excess energy as triglycerides in white adipose tissues (WATs), which also function as an endocrine organ secreting adipokines [2,3]. Obesity-mediated abnormal secretion of pro- and anti-inflammatory adipokines from WATs has been reported to cause insulin resistance, a hallmark of type 2 diabetes [4]. Recent studies revealed that obesity resulted in hepatic burdens with an elevated level of circulating alanine aminotransferase (ALT), which is an indicator of liver toxicity [5,6]. An elevated serum level of total cholesterol has also been associated with obesity [7].
Meanwhile, brown adipose tissues (BATs) utilize uncoupling protein 1 (UCP1) in the mitochondrial inner membrane to dissipate energy as heat [8–10]. BATs play a role in regulation of glucose homeostasis and improve insulin sensitivity [11,12]. Recent studies identified beige/brite adipocytes or recruitable brown adipocytes, which may function as brown adipocytes in the WATs [13,14]. Although basal expression levels of UCP1 in the beige adipocytes were much lower than those of brown adipocytes, UCP1 expression was markedly increased in response to cGMP or β3-adrenoreceptor agonists. A recent animal study demonstrated that impairment of original BATs induced compensatory browning of WATs [15]. Studies indicated that gene expression patterns of BATs from adult human followed those of beige adipocytes [13,16].
Bone morphogenetic proteins (BMPs), which determine development of various tissues, have recently come to the forefront in regulation of adipogenesis. Although BMP-2, -4, and -6 did not enhance expression of UCP1, BMP-7 and BMP-9 promoted brown adipogenesis of stem cells with marked induction of UCP1 in response to cGMP [17,18]. Animal studies indicated that BMP-7, BMP-8b, and BMP-9 suppressed high fat diet-induced obesity and improved obesity-mediated insulin resistance [17–19]. Mice deficient of BMP type IA receptor in Myf5-lineage cells displayed a much smaller BAT size and induced UCP1 gene expression in WATs, indicating a key role of BMP type IA receptor in brown adipogenesis [15].
Fibroblast growth factor 21 (FGF21), which is predominantly released from hepatocytes and to a lesser extent from other tissues, has been reported to regulate metabolism of carbohydrate and lipid, indicating a role of FGF21 as a metabolic regulator [20]. Animal studies demonstrated that administration of FGF21 to obese animals improved insulin sensitivity, caused a decrease in body weights as well as low density lipoprotein cholesterol levels, and reversed hepatic steatosis [21,22]. Since FGF21 has been reported to activate thermogenesis by enhancing UCP1 expression [23], we hypothesized that BMP-9 might enhance expression of FGF21 and suppress pathophysiology of high fat diet-induced obesity.
2. Materials and methods
2.1. MB109
MB109, a recombinant derivative of human BMP-9 containing a methionine residue in front of the mature form of human BMP-9 (Ser338-Arg429), was purchased from joint Protein Central (Incheon, Korea, jointproteincentral.com). MB109 was reconstituted in 5 mM HCl and diluted in phosphate buffered saline (PBS) for animal experiment just before use.
2.2. Animals
Animal experimental procedures were performed in accordance with protocols approved by the Gachon University Institutional Animal Care and Use Committee. C57BL/6 (male, 7-week old) mice were randomly assigned to normal chow diet groups (NC/sham) and 60% Kcal high fat (HF) diet groups. One mouse was housed per cage after 5 weeks of high fat diet. Each mouse, after 5 weeks of high fat diet, received intraperitoneal injection of vehicle (PBS), 200 μg/kg/week (HF/ML), or 500 μg/kg/week (HF/MH) of MB109 for 8 weeks. Food consumption and body weights of mice were recorded every week.
2.3. Glucose tolerance test (GTT)
Mice were fasted for 7 h with free access to drinking water. Each mouse was challenged with 20% glucose solution (1.5 g glucose/kg body weight). Blood glucose levels were determined before, 30 min, 60 min, 120 min, and 180 min after glucose challenge.
2.4. RNA extraction and real-time PCR
Mice were overnight fasted at the termination of each experiment. Entire left-side sc or epi adipose tissues were snap frozen in liquid nitrogen, smashed with liquid nitrogen, minced in Trizol, centrifuged at 13,000 ×g for 5 min, and used to extract RNA using Trizol according to the manufacturer’s instruction. A lipid layer was removed and a layer containing Trizol solution was used for further procedure to isolate RNA. Samples from the liver were obtained from the left liver lobe according to the method described elsewhere [24]. Primers for FGF21 are forward 5′-CAAATCCTGGGTGTCAAAGC-3′ and reverse 5′-CATGGGCTTCAGACTGGTAC-3′. Procedures and the other primers for real-time PCR analysis were described in the previous report [17]. Abundance of mRNA of interest in each sample was determined by the ΔCτ (cycle threshold), the difference between the Cτ values for gene of interest and cyclophilin.
2.5. Histological analysis
Center portion of the right-side portion of sc and epi adipose tissues were used to prepare paraffin block from immunohistochemical analysis. Center portions of the left liver lobe (ref) were used to prepare frozen blocks. Hematoxylin–eosin staining or DAB staining using ImmPRESS detection system (VECTOR Lab, USA) was performed as described in the previous report [17]. Anti-UCP1 and anti-FGF21 antibodies were purchased from Abcam (Cambridge, England).
2.6. Oil red O staining of frozen sections
Frozen sections (5 μm) of the left liver lobe were fixed in 10% normal buffered formalin, rinsed with PBS, pretreated in 60% isopropanol, stained in freshly prepared oil red O staining solution (0.3% oil red O in 60% isopropanol), rinsed in 60% isopropanol, and analyzed under the microscope.
2.7. Hematological analysis
Blood was obtained from mice at the termination of each experiment with overnight fasting. Serum levels of ALT, AST, amylase, creatine, total cholesterol, and total triglyceride were determined by Neodin Veterinary Science Institute (Seoul, Korea).
2.8. Statistical analysis
Data are presented as mean ± standard deviation (SD), otherwise described. Statistical comparison of data was determined using one-way analysis of variance, followed by the Dunnett post-hoc adjustment. A value of p < 0.05 was considered significant.
3. Results
3.1. Dose-dependent effect of MB109 to treat high fat diet-induced obesity
In order to determine the time point when mice on high fat diet developed obesity-mediated symptoms, 7 h fasting blood glucose levels were analyzed 5 weeks after high fat diet. Results indicated that high fat diet for 5 weeks significantly raised 7 h fasting blood glucose levels (Fig. 1A). We started MB109 injection from that time point. While MB109 (200 μg/kg/week) injection started together with high fat diet suppressed weight gaining [17], MB109 injection (ML, 200 μg/kg/week) following 5 weeks of high fat diet showed a marginal effect on suppression of weight gaining. However, MB109 (MH, 500 μg/kg/week) injection suppressed weight gaining (Fig. 1B) without changes in food consumption (Fig. 1C). In addition, injection of MB109 did not change serum levels of creatine and amylase, indicators for kidney and pancreas toxicity, of the mice on HFD (Fig. 1D and E).
Fig. 1.
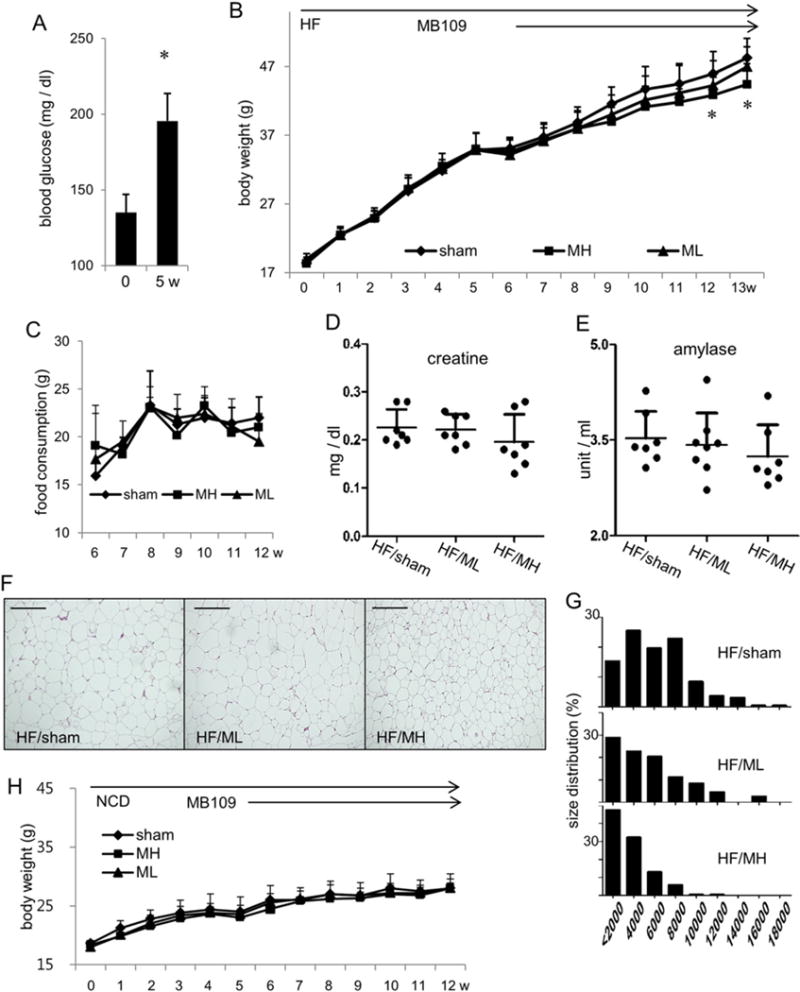
MB109 suppresses weight gaining of high fat diet-induced obese mice in a dose-dependent manner. (A) 7-h fasting blood glucose levels of mice on high fat diet were analyzed. (B) Body weight changes of mice fed with high fat diet were observed for 13 weeks. Injection of vehicle (PBS), or ML or MH was performed from 5th week of high fat diet. Changes in body weights by administration of MH were statistically significant from 12th week (p < 0.05). (C) Changes in food consumption per mouse for 7 weeks are shown. Circulating serum levels of creatine (D) and amylase (E) were analyzed at the termination of the experiment. A serum level of each molecule from each mouse was displayed as a dot. (F) Representative H&E staining of the subcutaneous adipose tissues of animals with average body weights in each group. Scale bars indicate 100 μm. (G) Percentage distribution of cross-sectional areas of adipocytes from each group is shown. An x-axis represents areas of adipocytes in μm2. (H) Body weight changes of mice fed with normal chow diet were observed for 12 weeks. Injection of vehicle (PBS), or ML or MH was performed from 5th week of normal chow diet.
Histological analysis of the subcutaneous fat tissues revealed that adipocytes in the HF/MH group mice are noticeably smaller size than those in the HF/sham group or the HF/ML group mice (Fig. 1F). Percentage distribution analysis indicated that sizes of adipocytes in the adipose tissues showed dose-dependent effect such that more cells were shifted from large to medium and small sizes in order from the HF/sham, HF/ML, and to HF/MH groups (Fig. 1G). Adipocytes in the epididymis fat tissues also showed the same trend as those in the subcutaneous fat tissue (Suppl Fig. 1). However, injection of MB109 at both dosages did not change weight gaining of the mice on normal chow diet (Fig. 1H).
3.2. Effects of MB109 on FGF21 expression and serum levels of cholesterol and ALT
Since enhanced expression of FGF21 has been reported to be a key modulator of HFD-induced obesity [21,22], FGF21 mRNA expression in the liver was analyzed. Administration of MH significantly enhanced FGF21 mRNA expression in the liver (Fig. 2A). Although the liver has been reported to be a major organ expressing FGF21, studies demonstrated expression of FGF21 in WATs. Administration of MH also enhanced FGF21 mRNA expression in the WATs in a dose-dependent manner (Fig. 2B and C). Results of immunohistochemical analysis demonstrated FGF21 expression in the liver at the protein level (Fig. 2D). MH injection did not change mRNA expression levels of FGFR1c, a receptor for FGF21, in the liver as well as WATs (Fig. 2E and F).
Fig. 2.
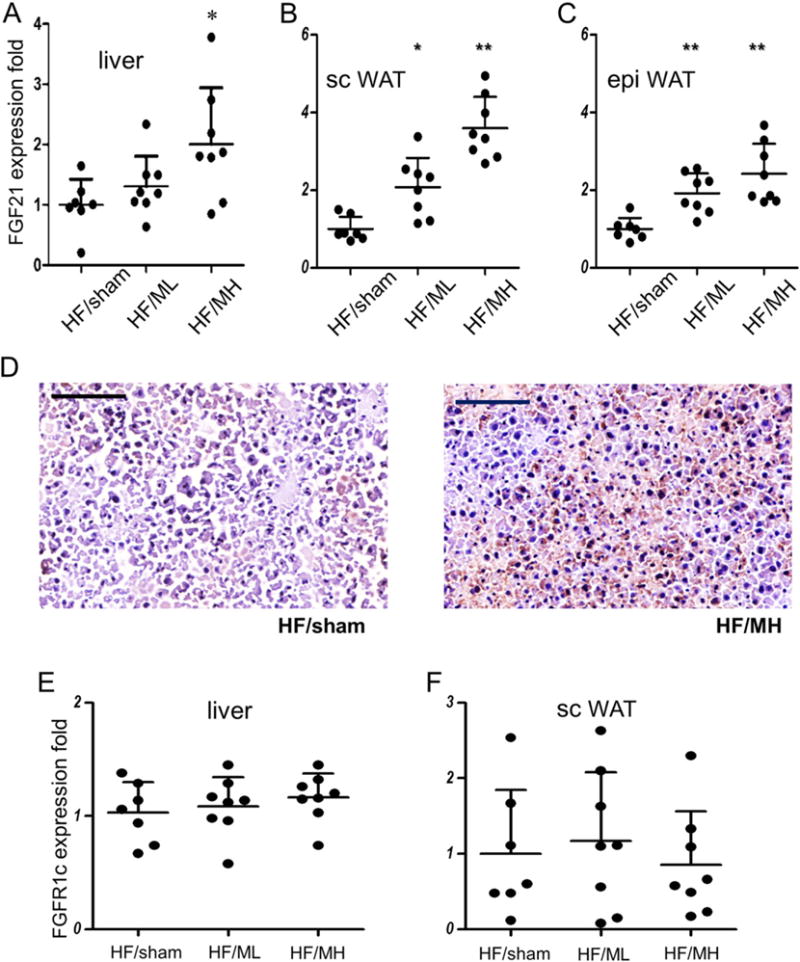
MB109 enhances expression of FGF21 in the liver and adipose tissues. Expression levels of FGF21 mRNA in the liver (A) and WATs (B, C) were analyzed using real-time PCR. An average value of FGF21 expression of HF/sham mice was calculated as 1 for statistical analysis. Distribution of FGF21 expression in each mouse fat tissue sample was displayed as a dot. * p < 0.05 vs sham control. ** p < 0.01 vs sham control. FGF21 expression at the protein level was analyzed using IHC of the liver (D). Areas with red-brownish color indicate cells reacted with anti-FGF21 antibody. Scale bars indicate 100 μm.
Animal studies have indicated that high fat diet-induced obesity also raised serum levels of total cholesterol [25]. MH injection markedly decreased serum levels of total cholesterol (Fig. 3A). ML, which showed a marginal effect on suppression of weight gaining of obese mice, moderately decreased serum levels of total cholesterol (Fig. 3A). However, MB109 injection did not show significant changes of serum levels of total triglycerides (Fig. 3B).
Fig. 3.
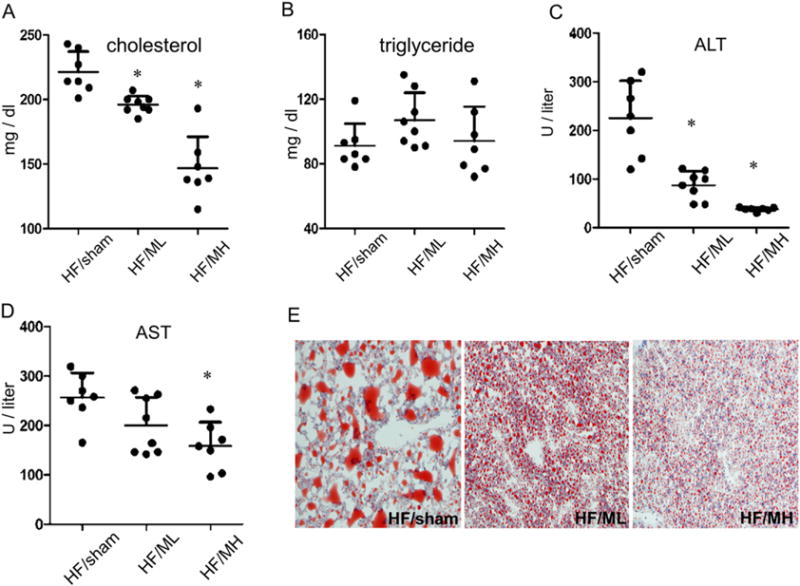
MB109 alleviates symptoms of obesity-induced NAFLD by reducing ALT and total cholesterol in a dose-dependent manner. Circulating serum levels of total cholesterol (A), triglyceride (B), ALT (C), and AST (D) were analyzed at the termination of the experiment. A serum level of each molecule from each mouse was displayed as a dot. * p < 0.05 vs sham control. Frozen sections of the liver were analyzed by Oil red O staining (E).
High fat diet-induced obesity has been reported to increase serum levels of ALT and aspartate transaminase (AST) [5,6]. Serum ALT levels of mice in the HF/MH group were markedly lower than those in the HF/sham group. Although ML injection to obese mice showed marginal effect on suppression of high fat diet-induced weight gaining of obese mice, it showed a statistically significant decrease in serum levels of ALT (Fig. 3C). MB109 injection also decreased elevated serum levels of AST due to high fat diet-induced obesity in a dose-dependent manner (Fig. 3D). Since elevated levels of serum ALT and AST are associated with obesity-mediated fatty liver disease [25], we determined if MB109 could suppress accumulation of lipids in the liver. Oil red O staining analysis demonstrated that MB109 strikingly suppressed the size of lipid droplets accumulating in the liver due to high fat diet-induced obesity (Fig. 3E).
3.3. MB109 enhances UCP1 expression in the BAT and WATs
H&E staining of cross sections of BATs (Fig. 4A) did not show significant difference among the groups. Real-time analysis showed that MH, but not ML, enhanced mRNA expression levels of brown adipocyte specific genes UCP1 (Fig. 4B). Cell death-inducing DFFA-like effector a (Cidea) has been reported to play a role in energy expenditure and metabolic rate [26]. Administration of MH also enhanced mRNA expression levels of Cidea (Fig. 4C) and brown adipocyte-selective gene [13] Eva1 (Fig. 4D) in the BAT. Expression levels of FGF21 mRNA (Fig. 4E) were markedly enhanced in the BATs of the MH group mice. However, administration of MH for 8 weeks to obese mice did not show statistically significant changes in mRNA expression levels of PRDM16 and PGC1a, key modulators for embryonic development of BAT (Fig. 4F and G).
Fig. 4.
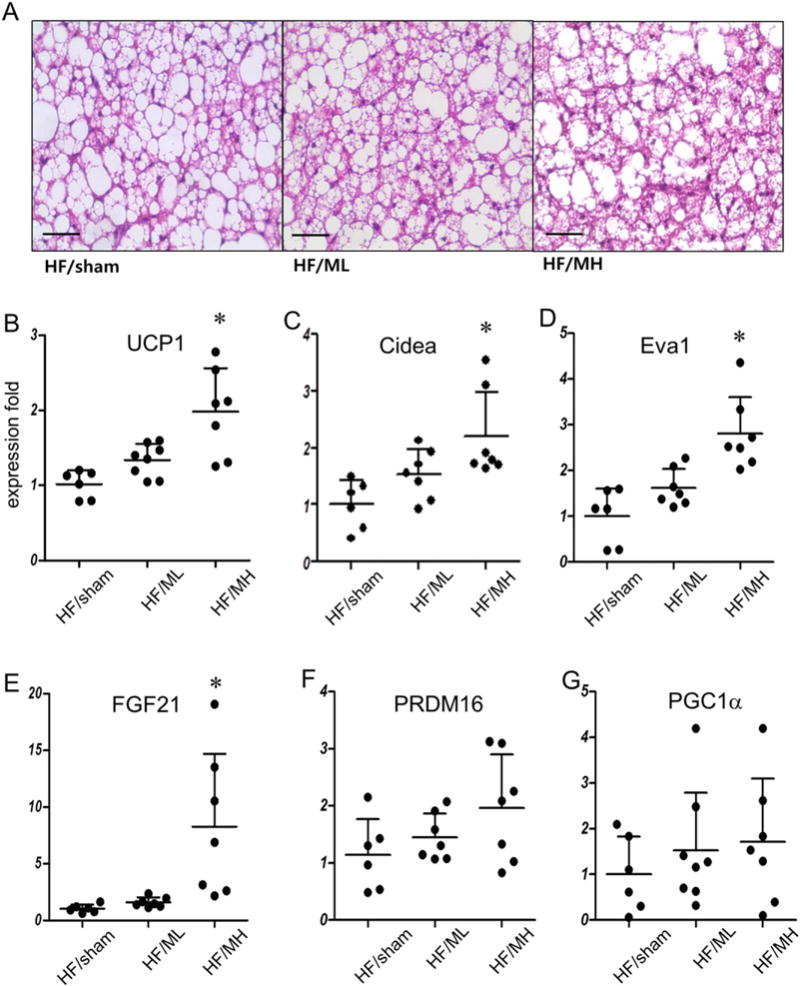
MB109 enhances expression of UCP1 and FGF21 in the BAT. (A) Representative H&E staining of the BATs of animals with average body weights in each group (magnification 400×). Scale bars indicate 50 μm. (B) UCP1 mRNA expression levels in the BATs were analyzed using real-time PCR as described in Fig. 2. Eva1 (C), FGF21 (D), PRDM16 (E), and PGC1a (F) mRNA expression levels in the BATs were analyzed as described in Fig. 2.
Since browning of WATs has been reported to suppress HFD-induced obesity, real-time PCR analysis was carried out to determine expression patterns of genes responsible for browning of the white adipose tissues. MB109 enhanced mRNA expression levels of UCP1 both in the epididymis and subcutaneous fat tissues in a dose-dependent manner (Fig. 5A). Consistent with the results of real-time PCR analysis, immunohistochemical staining analysis showed that MH injection enhanced UCP1 expression in the subcutaneous WATs (Fig. 5B). Enhanced expression of UCP1 protein in the subcutaneous and epididymis WATs of the MH group mice was detected in the area with small multilocular cells.
Fig. 5.
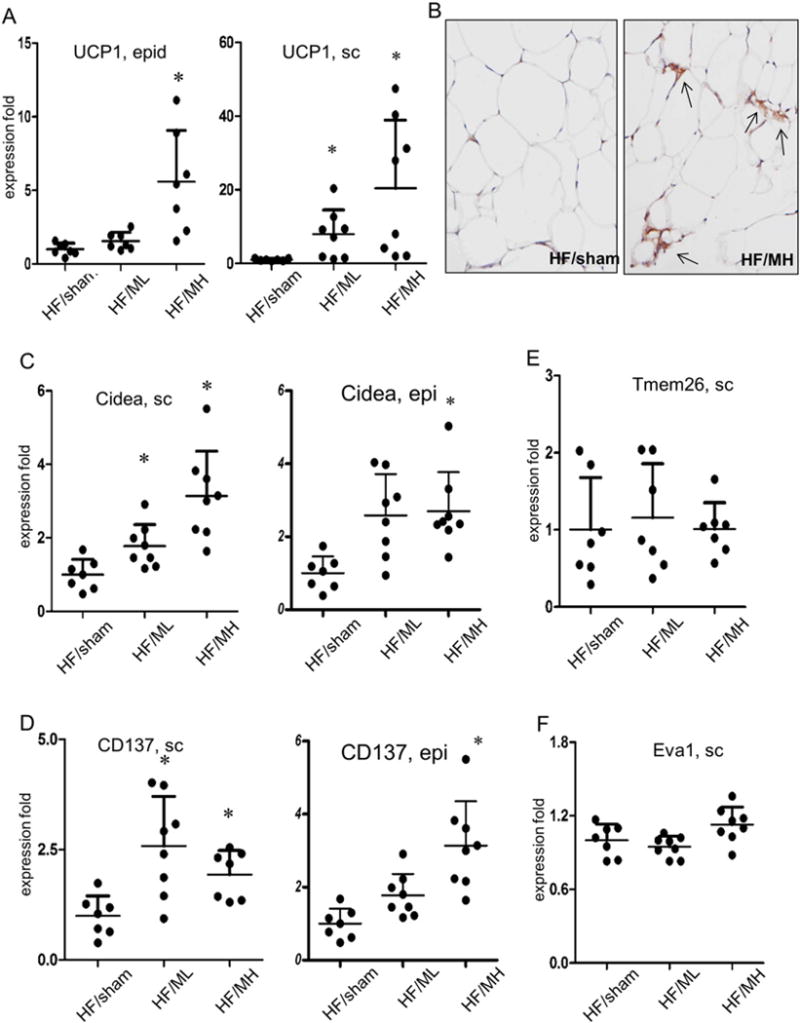
MB109 induces browning of the WATs. (A) UCP1 mRNA expression in the epididymis (epi) or subcutaneous (sc) fat tissues were analyzed using real-time PCR. An average value of UCP1 expression of HF/sham mice was calculated as 1 for statistical analysis. Distribution of UCP1 expression in each mouse fat tissue sample was displayed as a dot. * p < 0.05 vs sham control. (B) UCP1 protein expression in the subcutaneous WATs was analyzed using immunohistochemical staining. Arrows indicate UCP1 protein expression. Expression levels of Cidea (C), CD137 (D), Tmem26 (E), and Eva1 (F) in the subcutaneous WATs were determined using real-time PCR.
MB109 injection to obese mice enhanced mRNA expression levels of Cidea in the WATs in a dose-dependent manner (Fig. 5C). Expression levels of CD137 and Tmem26, whose expression has been reported to be high in beige adipocytes [13], were also analyzed. While MB109 injection enhanced CD137 mRNA expression in the adipose tissues (Fig. 5D), it did not Tmem26 expression (Fig. 5E). MB109 injection enhanced expression of Eva 1, a brown adipocyte selective gene (Fig. 4D), in the BAT but not in sc WATs (Fig. 5F). Expression analyses of Cidea, CD137, Tmem26, and Tbx genes in the epi adipose tissue also displayed the similar patterns of those in the sc adipose tissues (Suppl Fig. 1).
3.4. MH injection to obese mice improved obesity-mediated insulin resistance
Glucose tolerance test was performed to determine if MB109 injection to obese mice would be able to improve obesity-associated insulin resistance. Fasting blood glucose levels before glucose challenge of the ML and MH groups were statistically lower than those of HF/sham groups (Fig. 6A). While blood glucose levels of mice in the MH group were on the decline at 60 min after glucose challenge, those in the HF/sham or ML groups stayed on a plateau (Fig. 6A). However, injection of MB109 diet did not change patterns of glucose tolerance test of mice on normal chow diet (Fig. 6B).
Fig. 6.
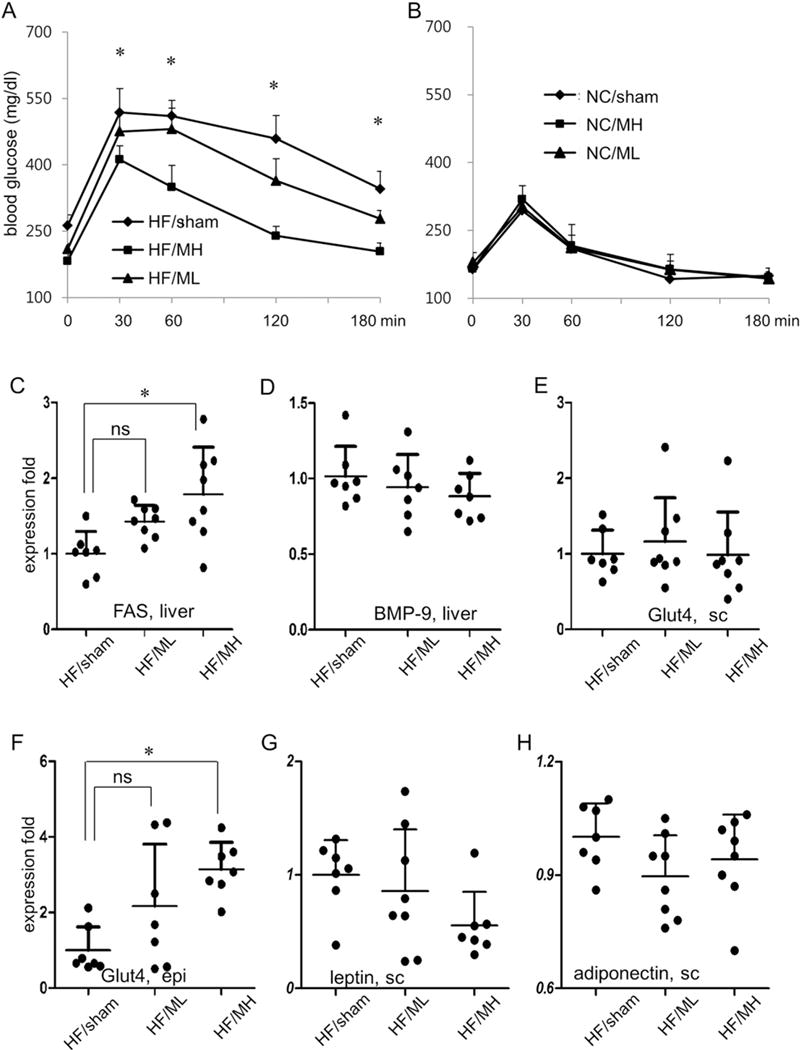
MB109 injection improves obesity-mediated insulin resistance. GTT of mice was performed 13th week of HF diet (A) or NC diet (B). * p < 0.05, MH vs sham control. Expression levels of FAS (C), BMP-9 (D) in the liver, Glut4 in the subcutaneous fat tissue (E), and epididymis fat tissue (F) were analyzed using real-time PCR.
Given the reports indicating that BMP-9 enhanced expression of FAS and reduced blood glucose levels [27], we analyzed expression patterns of FAS in the liver. ML injection did not significantly change expression levels of FAS, but MH injection clearly increased expression levels of FAS (Fig. 6C). Since BMP-9 has been reported to be expressed mainly in the liver cells [28], we also analyzed if MB109 injection to mice changed expression patterns of BMP-9 in the liver. BMP-9 mRNA expression levels among the HF/sham, ML, and MH groups did not show statistically significant changes (Fig. 6D). However, MH injection to mice on the high fat diet enhanced expression of Glut4, which is responsible for glucose uptake, in the epididymis, fat tissues (Fig. 6E and F). Although adipokines have been reported to play a role in obesity-mediated pathophysiology of glucose metabolism, expression levels of leptin and adiponectin in the WATs were not changed by administration of MH (Fig. 6G and H).
4. Discussion
The most salient feature of the periodical injection of MH to mice after 5 weeks of high fat diet is that it enhanced FGF21 expression in the liver as well as adipose tissues and suppressed a spectrum of pathophysiology of obesity (Fig. 7). Our results demonstrated that MB109 injection enhance FGF21 expression and alleviated obesity-mediated pathological symptoms in the liver. MB109 injection to high fat diet-induced obese mice did not only reduce elevated serum levels of ALT and AST in a dose-dependent manner, but also suppressed accumulation of lipid in the liver due to high fat diet-induced obesity. Our study indicates that MB109 is effective to treat symptoms of NAFLD in a dose-dependent manner. Periodical injection of MB109 reduced elevated serum levels of total cholesterol due to high fat diet-induced obesity in a dose-dependent manner, but not those of triglyceride. Since statins have been clinically used to lower total cholesterol levels and reduce risk factors of cardiovascular diseases [29], further study is necessary to determine if MB109 would be applied to reduce risk of cardiovascular diseases or to synergize statins’ effects to lower total cholesterol levels.
Fig. 7.
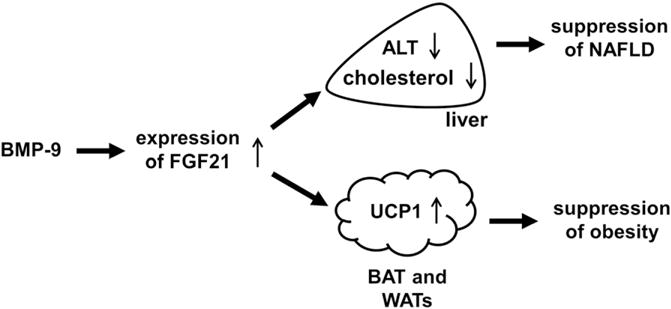
A schematic diagram explains molecular mechanisms by which BMP-9 suppresses pathophysiology of obesity. Enhanced expression of FGF21 reduces a serum level of ALT as well as cholesterol and enhances brown adipogenesis, resulting in suppression of NAFLD and obesity.
FGF21 has been reported to enhance UCP1 expression and suppress weight gaining due to high fat diet [23]. Periodical injection of MB109 to mice after 5 weeks of high fat diet enhanced expression levels of FGF21, UCP1, Cidea, and Eva1 in the BAT. However, injection of MH to obese mice did not change expression levels of PRDM16 and PGC1α, which plays a key role in embryonic development of BAT. Since MB109 was injected to mice whose BATs were already developed, it did not change expression levels of PRDM16 or PGC1α. Changes in expression patterns of Cidea in the WATs by MB109 injection were similar to those of UCP1. MB109 enhanced expression of Cidea and CD137 in the WATs, but not expression of Tmem26 indicating that it enhanced only a selective set of genes responsible for browning WATs. MH injection to obese mice enhanced brown adipocyte-selective gene Eva1 in the BAT, but not in the WATs.
Enhanced expression of UCP1, Cidea, and CD137 has been associated with improved insulin resistance [30]. Although periodical injection of ML moderately enhanced expression levels of those genes in the subcutaneous WATs, it did not improve insulin resistance. Since ML injection did not enhance expression of UCP1 and Cidea in the BAT, enhanced expression of those genes only in the subcutaneous WAT may not be enough to counteract obesity-mediated insulin resistance. Given the results indicating that ML injection to obese mice did not result in statistically significant decrease in weight gaining, orchestrated changes in gene expression in multiple tissues by MH injection are also required to decrease high fat diet-mediated weight gaining.
Given the reports demonstrating that administration of recombinant FGF21 improved metabolic parameters and enhanced insulin sensitivity [20–22], enhanced FGF21 expression by MB109 is an underlying mechanism implicated in suppression of obesity by periodical injection of MH. MH injection to obese mice markedly reduced sizes of adipocytes in the WATS and improved glucose tolerance test. Adipocyte hyperplasia by reducing sizes of adipocytes in the WATs has been reported to improve insulin tolerance in the high fat diet-induced obese mice [31,32]. Consistent with the reports indicating that enhanced GLUT4 expression in the WATs improved insulin tolerance [33,34], MH injection to obese mice enhanced GLUT4 expression in the WATs and improved glucose tolerance in obese mice. In addition, periodical injection of MH enhanced mRNA expression of FAS in the liver, indicating that MB109 injection might improve glucose metabolism by converting glucose to fatty acid in the liver. ML injection to obese mice did not show statistically significant changes in the expression levels of FAS, although it showed a trend of enhanced expression. Since enhanced expression of CD137 and UCP1 has been associated with improved glucose tolerance [30], MH injection to obese mice appears to improve insulin resistance by causing adipocyte hyperplasia as well as enhancing expression of CD137, UCP1, GLUT4, and FAS.
While the study we previously reported was focused to determine anti-obesity effects of MB109 at the prevention level [17], this study was designed to address if periodical administration of MB109 could be applied to treat obesity of mice that have been fed with high fat diet prior to being treated with MB109. Anti-obesity effects of MB109 can be achieved even when periodical injection of MB109 was initiated to mice with elevated fasting blood glucose levels. However, the MB109 dose for treatment of obesity needs to be higher than that for prevention. The most important clinical prospect of MB109 as a new therapeutic potential is that periodical injection of MB109 does not only suppress weight gaining due to high fat diet but also alleviates a spectrum of pathological symptoms resulting from obesity.
Supplementary Material
Acknowledgments
This study was supported by the Korean Health Technology R&D Project, Ministry for Health and Welfare (HI12C0328) and IFEZ.
Footnotes
Supplementary data to this article can be found online at http://dx.doi.org/10.1016/j.bbadis.2016.04.006.
Disclosure statement
Drs. S Choe and DK Lee report that they have a patent PCT/US2014/060969 pending. S Kim reports no conflict of interest.
Transparency Document
The Transparency document associated with this article can be found, in online version.
References
- 1.Yach D, Stuckler D, Brownell KD. Epidemiologic and economic consequences of the global epidemics of obesity and diabetes. Nat Med. 2006;12:62–66. doi: 10.1038/nm0106-62. [DOI] [PubMed] [Google Scholar]
- 2.Armani A, Mammi C, Marzolla V, Calanchini M, Antelmi A, Rosano GM, Fabbri A, Caprio M. Cellular models for understanding adipogenesis, adipose dysfunction, and obesity. J Cell Biochem. 2010;110:564–572. doi: 10.1002/jcb.22598. [DOI] [PubMed] [Google Scholar]
- 3.Kahn SE, Hull RL, Utzschneider KM. Mechanisms linking obesity to insulin resistance and type 2 diabetes. Nature. 2006;444:840–846. doi: 10.1038/nature05482. [DOI] [PubMed] [Google Scholar]
- 4.Ouchi N, Parker JL, Lugus JJ, Walsh K. Adipokines in inflammation and metabolic disease. Nat Rev Immunol. 2011;11:85–97. doi: 10.1038/nri2921. [DOI] [PMC free article] [PubMed] [Google Scholar]
- 5.Devers MC, Campbell S, Shaw J, Zimmet P, Simmons D. Should liver function tests be included in definitions of metabolic syndrome? Evidence from the association between liver function tests, components of metabolic syndrome and prevalent cardiovascular disease. Diabet Med. 2008;25:523–529. doi: 10.1111/j.1464-5491.2008.02408.x. [DOI] [PubMed] [Google Scholar]
- 6.Liu X, Hamnvik OP, Chamberland JP, Petrou M, Gong H, Christophi CA, Christiani DC, Kales SN, Mantzoros CS. Circulating alanine transaminase (ALT) and gamma-glutamyl transferase (GGT), but not fetuin-A, are associated with metabolic risk factors, at baseline and at two-year follow-up: the prospective Cyprus Metabolism Study. Metabolism. 2014;63:773–782. doi: 10.1016/j.metabol.2014.03.008. [DOI] [PMC free article] [PubMed] [Google Scholar]
- 7.Gostynski M, Gutzwiller F, Kuulasmaa K, Doring A, Ferrario M, Grafnetter D, Pajak A. Analysis of the relationship between total cholesterol, age, body mass index among males and females in the WHO MONICA Project. Int J Obes Relat Metab Disord. 2004;28:1082–1090. doi: 10.1038/sj.ijo.0802714. [DOI] [PubMed] [Google Scholar]
- 8.Cristancho AG, Lazar MA. Forming functional fat: a growing understanding of adipocyte differentiation. Nat Rev Mol Cell Biol. 2011;12:722–734. doi: 10.1038/nrm3198. [DOI] [PMC free article] [PubMed] [Google Scholar]
- 9.Tran TT, Kahn CR. Transplantation of adipose tissue and stem cells: role in metabolism and disease. Nat Rev Endocrinol. 2010;6:195–213. doi: 10.1038/nrendo.2010.20. [DOI] [PMC free article] [PubMed] [Google Scholar]
- 10.Cypess AM, Lehman S, Williams G, Tal I, Rodman D, Goldfine AB, Kuo FC, Palmer EL, Tseng YH, Doria A, Kolodny GM, Kahn CR. Identification and importance of brown adipose tissue in adult humans. N Engl J Med. 2009;360:1509–1517. doi: 10.1056/NEJMoa0810780. [DOI] [PMC free article] [PubMed] [Google Scholar]
- 11.Stanford KI, Middelbeek RJ, Townsend KL, An D, Nygaard EB, Hitchcox KM, Markan KR, Nakano K, Hirshman MF, Tseng YH, Goodyear LJ. Brown adipose tissue regulates glucose homeostasis and insulin sensitivity. J Clin Invest. 2013;123:215–223. doi: 10.1172/JCI62308. [DOI] [PMC free article] [PubMed] [Google Scholar]
- 12.Gunawardana SC, Piston DW. Reversal of type 1 diabetes in mice by brown adipose tissue transplant. Diabetes. 2012;61:674–682. doi: 10.2337/db11-0510. [DOI] [PMC free article] [PubMed] [Google Scholar]
- 13.Wu J, Bostrom P, Sparks LM, Ye L, Choi JH, Giang AH, Khandekar M, Virtanen KA, Nuutila P, Schaart G, Huang K, Tu H, van Marken Lichtenbelt WD, Hoeks J, Enerback S, Schrauwen P, Spiegelman BM. Beige adipocytes are a distinct type of thermogenic fat cell in mouse and human. Cell. 2012;150:366–376. doi: 10.1016/j.cell.2012.05.016. [DOI] [PMC free article] [PubMed] [Google Scholar]
- 14.Liu W, Shan T, Yang X, Liang S, Zhang P, Liu Y, Liu X, Kuang S. A heterogeneous lineage origin underlies the phenotypic and molecular differences of white and beige adipocytes. J Cell Sci. 2013;126:3527–3532. doi: 10.1242/jcs.124321. [DOI] [PMC free article] [PubMed] [Google Scholar]
- 15.Schulz TJ, Huang P, Huang TL, Xue R, McDougall LE, Townsend KL, Cypess AM, Mishina Y, Gussoni E, Tseng YH. Brown-fat paucity due to impaired BMP signalling induces compensatory browning of white fat. Nature. 2013;495:379–383. doi: 10.1038/nature11943. [DOI] [PMC free article] [PubMed] [Google Scholar]
- 16.Jespersen NZ, Larsen TJ, Peijs L, Daugaard S, Homoe P, Loft A, de Jong J, Mathur N, Cannon B, Nedergaard J, Pedersen BK, Moller K, Scheele C. A classical brown adipose tissue mRNA signature partly overlaps with brite in the supraclavicular region of adult humans. Cell Metab. 2013;17:798–805. doi: 10.1016/j.cmet.2013.04.011. [DOI] [PubMed] [Google Scholar]
- 17.Kuo MM, Kim S, Tseng CY, Jeon YH, Choe S, Lee DK. BMP-9 as a potent brown adipogenic inducer with anti-obesity capacity. Biomaterials. 2014;35:3172–3179. doi: 10.1016/j.biomaterials.2013.12.063. [DOI] [PubMed] [Google Scholar]
- 18.Tseng YH, Kokkotou E, Schulz TJ, Huang TL, Winnay JN, Taniguchi CM, Tran TT, Suzuki R, Espinoza DO, Yamamoto Y, Ahrens MJ, Dudley AT, Norris AW, Kulkarni RN, Kahn CR. New role of bone morphogenetic protein 7 in brown adipogenesis and energy expenditure. Nature. 2008;454:1000–1004. doi: 10.1038/nature07221. [DOI] [PMC free article] [PubMed] [Google Scholar]
- 19.Whittle AJ, Carobbio S, Martins L, Slawik M, Hondares E, Vazquez MJ, Morgan D, Csikasz RI, Gallego R, Rodriguez-Cuenca S, Dale M, Virtue S, Villarroya F, Cannon B, Rahmouni K, Lopez M, Vidal-Puig A. BMP8B increases brown adipose tissue thermogenesis through both central and peripheral actions. Cell. 2012;149:871–885. doi: 10.1016/j.cell.2012.02.066. [DOI] [PMC free article] [PubMed] [Google Scholar]
- 20.Kharitonenkov A, Shiyanova TL, Koester A, Ford AM, Micanovic R, Galbreath EJ, Sandusky GE, Hammond LJ, Moyers JS, Owens RA, Gromada J, Brozinick JT, Hawkins ED, Wroblewski VJ, Li DS, Mehrbod F, Jaskunas SR, Shanafelt AB. FGF-21 as a novel metabolic regulator. J Clin Invest. 2005;115:1627–1635. doi: 10.1172/JCI23606. [DOI] [PMC free article] [PubMed] [Google Scholar]
- 21.Xu J, Lloyd DJ, Hale C, Stanislaus S, Chen M, Sivits G, Vonderfecht S, Hecht R, Li YS, Lindberg RA, Chen JL, Jung DY, Zhang Z, Ko HJ, Kim JK, Veniant MM. Fibroblast growth factor 21 reverses hepatic steatosis, increases energy expenditure, and improves insulin sensitivity in diet-induced obese mice. Diabetes. 2009;58:250–259. doi: 10.2337/db08-0392. [DOI] [PMC free article] [PubMed] [Google Scholar]
- 22.Berglund ED, Li CY, Bina HA, Lynes SE, Michael MD, Shanafelt AB, Kharitonenkov A, Wasserman DH. Fibroblast growth factor 21 controls glycemia via regulation of hepatic glucose flux and insulin sensitivity. Endocrinology. 2009;150:4084–4093. doi: 10.1210/en.2009-0221. [DOI] [PMC free article] [PubMed] [Google Scholar]
- 23.Fisher FM, Kleiner S, Douris N, Fox EC, Mepani RJ, Verdeguer F, et al. FGF21 regulates PGC-1a and browning of white adipose tissues in adaptive thermogenesis. Genes Dev. 2012;26:271–281. doi: 10.1101/gad.177857.111. [DOI] [PMC free article] [PubMed] [Google Scholar]
- 24.Foley JF, Collins JB, Umbach DM, Grissom S, Boorman GA, Heinloth AN. Optimal sampling of rat liver tissue for toxicogenomic studies. Toxicol Pathol. 2006;34:795–801. doi: 10.1080/01926230601009527. [DOI] [PMC free article] [PubMed] [Google Scholar]
- 25.Zhang J, Li S, Li J, Han C, Wang Z, Li C, Wang X, Liu Z, Wen J, Zheng L. Expression and significance of fat mass and obesity associated gene and forkhead transcription factor O1 in non-alcoholic fatty liver disease. Chin Med J. 2014;127:3771–3776. [PubMed] [Google Scholar]
- 26.Gummesson A, Jernas M, Svensson PA, Larsson I, Glad CA, Schele E, Gripeteg L, Sjoholm K, Lystig TC, Sjostrom L, Carlsson B, Fagerberg B, Carlsson LM. Relations of adipose tissue CIDEA gene expression to basal metabolic rate, energy restriction, and obesity: population-based and dietary intervention studies. J Clin Endocrinol Metab. 2007;92:4759–4765. doi: 10.1210/jc.2007-1136. [DOI] [PubMed] [Google Scholar]
- 27.Chen C, Grzegorzewski KJ, Barash S, Zhao Q, Schneider H, Wang Q, Singh M, Pukac L, Bell AC, Duan R, Coleman T, Duttaroy A, Cheng S, Hirsch J, Zhang L, Lazard Y, Fischer C, Barber MC, Ma ZD, Zhang YQ, Reavey P, Zhong L, Teng B, Sanyal I, Ruben SM, Blondel O, Birse CE. An integrated functional genomics screening program reveals a role for BMP-9 in glucose homeostasis. Nat Biotechnol. 2003;21:294–301. doi: 10.1038/nbt795. [DOI] [PubMed] [Google Scholar]
- 28.Miller AF, Harvey SA, Thies RS, Olson MS. Bone morphogenetic protein-9. An autocrine/paracrine cytokine in the liver. J Biol Chem. 2000;275:17937–17945. doi: 10.1074/jbc.275.24.17937. [DOI] [PubMed] [Google Scholar]
- 29.Koh KK, Sakuma I, Quon MJ. Differential metabolic effects of distinct statins. Atherosclerosis. 2010;215:1–8. doi: 10.1016/j.atherosclerosis.2010.10.036. [DOI] [PubMed] [Google Scholar]
- 30.Kim CS, Tu TH, Kawada T, Kim BS, Yu R. The immune signaling molecule 4-1BB stimulation reduces adiposity, insulin resistance, and hepatosteatosis in obese mice. Endocrinology. 2010;151:4725–4735. doi: 10.1210/en.2010-0346. [DOI] [PubMed] [Google Scholar]
- 31.Lu Q, Li M, Zou Y, Cao T. Induction of adipocyte hyperplasia in subcutaneous fat depot alleviated type 2 diabetes symptoms in obese mice. Obesity. 2014;22:1623–1631. doi: 10.1002/oby.20705. [DOI] [PubMed] [Google Scholar]
- 32.Kim JY, van de Wall E, Laplante M, Azzara A, Trujillo ME, Hofmann SM, Schraw T, Durand JL, Li H, Li G, Jelicks LA, Mehler MF, Hui DY, Deshaies Y, Shulman GI, Schwartz GJ, Scherer PE. Obesity-associated improvements in metabolic profile through expansion of adipose tissue. J Clin Invest. 2007;117:2621. doi: 10.1172/JCI31021. [DOI] [PMC free article] [PubMed] [Google Scholar]
- 33.Carvalho E, Kotani K, Peroni OD, Kahn BB. Adipose-specific overexpression of GLUT4 reverses insulin resistance and diabetes in mice lacking GLUT4 selectively in muscle. Am J Physiol Endocrinol Metab. 2005;289:E551–E561. doi: 10.1152/ajpendo.00116.2005. [DOI] [PubMed] [Google Scholar]
- 34.Atkinson BJ, Griesel BA, King CD, Josey MA, Olson AL. Moderate GLUT4 overexpression improves insulin sensitivity and fasting Triglyceridemia in high-fat diet-fed transgenic mice. Diabetes. 2013;62:2249–2258. doi: 10.2337/db12-1146. [DOI] [PMC free article] [PubMed] [Google Scholar]
Associated Data
This section collects any data citations, data availability statements, or supplementary materials included in this article.


