

Abstract
A fundamental mechanism of in situ tissue regeneration from biodegradable synthetic acellular vascular grafts is the effective interplay between graft degradation, erosion and the production of extracellular matrix. In order to understand this crucial process of graft erosion and degradation, we conducted an in vitro investigation of grafts (n = 4 at days 1, 4, 7, 10 each) exposed to enzymatic degradation. Herein, we provide constitutive relationships for mass loss and mechanical properties based on much-needed experimental data. Furthermore, we formulate a mathematical model to provide a physics-based framework for understanding graft erosion. A novel finding is that despite their porous nature, grafts lost mass exponentially via surface erosion demonstrating a 20% reduction in outer diameter and no significant change in apparent density. A diffusion based, concentration gradient-driven mechanistic model of mass loss through surface erosion was introduced which can be extended to an in vivo setting through the use of two degradation parameters. Furthermore, notably, mechanical properties of degrading grafts did not scale with mass loss. Thus, we introduced a damage function scaling a neo-Hookean model to describe mechanical properties of the degrading graft; a refinement to existing mass-dependent growth and remodelling (G&R) models. This framework can be used to improve accuracy of well-established G&R theories in biomechanics; tools that predict evolving structure–function relationships of neotissues and guide graft design.
Keywords: growth and remodelling, continuum mechanics, tissue-engineered vascular grafts, degradation, erosion
1. Introduction
Since the publication of the seminal paper by Weinberg & Bell [1], there have been tremendous developments in the field of tissue-engineered vascular grafts (TEVGs). Specifically, the first-in-human clinical trial for extracellular matrix (ECM)-derived acellular grafts for hemodialysis access conducted by Niklason et al. showed very promising results at 1 year post-implant [2]. While these grafts perform well in large diameter (greater than 6 mm) and high flow conditions, they are less successful as small diameter TEVGs. However, the need for small diameter TEVGs keeps growing due to high prevalence of atherosclerosis in coronary and peripheral arteries in the United States [3] and drawbacks associated with common treatment options. The venous graft, which is the surgical gold standard, has limited availability and suffers from high incidences of donor site morbidity [4]. As an alternative, various tissue-engineered strategies have been suggested in recent years. These can broadly be classified into four major categories—ECM-derived cellular [5], ECM-derived acellular [2,6], synthetic cellular [7–9] and synthetic acellular [10,11] TEVGs. While the ECM-derived strategies have shown remarkable in-host remodelling with some even reaching Phase II clinical trials, they are associated with complicated and high production times along with significant production costs which serve as a barrier to clinical translation.
Synthetic acellular bioresorbable grafts circumvent the need for high production times by eliminating key cell-dependent steps thereby offering an alternative that is potentially easy to translate to a clinical setting. Particularly, we have shown that one such bilayered acellular composite graft made of an inner fast degrading poly(glycerol sebacate) (PGS) core and an outer slow degrading polycaprolactone (PCL) sheath developed a fully functioning neoartery when implanted in a rat abdominal aorta [10]. This neoartery exhibited mature levels of elastin and collagen production along with nerve generation [12]; essential components of a healthy blood vessel, at 1 year. However, despite remarkable success seen in young small animal models, translating this to the clinic requires substantial graft redesign to accommodate for changes in arterial geometry, age and physiological conditions of different species.
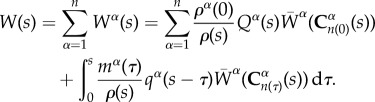
Developments in biomechanics have led to formulation of continuum mechanics based, mixture theory-driven growth and remodelling (G&R) computational models that predict vascular G&R response to altered physiological conditions [13–15]. These models have been useful in predicting G&R response in diseased conditions like aneurysms [16–19] and are being extended to model the in vivo development of neotissue from a degrading TEVG in venous circulation [20]. In our prior work, we used this G&R model to conduct a paramteric study to understand the effect of degradation rates on long-term neoarterial development [21]. Briefly, we postulate the following strain energy function to model the evolving neoartery using a constrained mixture model [22]:
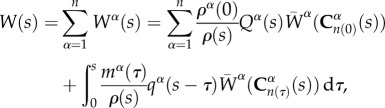 |
1.1 |
where W(s) is the total strain energy of the mixture, ρα(0) is the density of constituent α at time s = 0, Qα(s) is the survival function that represents remaining mass and  represents the evolving strain energy function of the degrading constituent.
  and mα(τ) represent the strain energy function and rate of deposition of constituents, where
  is the right Cauchy–Green tensor at current time s, defined relative to the configuration at time τ. The survival function and changing mechanical properties are phenomenological equations which can be tuned to refine the predictive capability of the tool. There is a much cited need in the field of biomechanics for experimental data to develop these constitutive equations and obtain the requisite rate constants [20,23]. Our prior computational work with this model showed that the time constants associated with graft erosion and degradation are critical for the remodelling process, with fusiform aneurysms forming if the degradation rate was too fast. It must be noted that while degradation is defined as the deleterious change in properties due to scission of polymer chains into monomers [24], we are primarily concerned with the manifestation of these changes in the context of mechanical properties. Erosion of the grafts is defined as the reduction in mass through surface or volumetric (bulk) erosion.
While there is a critical need to understand the erosion and degradation process of TEVGs, the only data available are based on studies of solid PGS erosion in vivo [25] and base-accelerated degradation in vitro [26], with no data on degradation or erosion of porous small diameter PGS TEVGs. In this study, we address this need by investigating the degradation and erosion mechanisms of porous PGS TEVGs used for in situ neoartery formation [12]. We acquire experimental data by conducting an in vitro analysis of the porous grafts used in our in vivo studies exposed to enzymatic degradation and provide a constitutive equation (functional form) for mass loss and mechanical property change as a function of degradation time. Furthermore, we use these data to develop a diffusion-based erosion model for predicting mass loss. This mechanistic, physics-based explanation allows formulation of erosion as a boundary-value problem and can be used for modelling the phenomena under different boundary conditions. To our knowledge, this is the first investigation that studies the degradation and erosion process for porous PGS TEVGs and provides a mechanistic framework to model erosion with validation against experimental data. These results provide physical insights into the mechanisms of degradation and erosion and will be of great value for G&R frameworks as the basis of predictive tools for rational design of TEVGs.
PGS is a widely used elastomer in the field of tissue engineering due to its biocompatibility and fast degradability. It has been used in myocardial engineering [27–29], vascular graft and microvasculature fabrication [10,30], bone and cartilage engineering [31,32] and nerve guide development [33–35] to name a few. These applications require an understanding of the degradation and erosion process of the polymer as it guides load transfer and remodelling response. Hence, understanding these mechanisms will have translational benefits by tuning properties of PGS (like curing time, temperature, porosity) to achieve desired degradation rates. This work also has broader applicability to other elastomers manufactured by salt leaching [36–38] as they exhibit a similar porous morphology which we have found to play a major role in degradation.
This paper is broadly divided into two parts—modelling erosion as pertaining to mass loss and modelling degradation as manifested by change in mechanical properties. Section 2 outlines the methods used to investigate the enzymatic degradation of grafts in vitro followed by outlining the analytical solution of the erosion boundary value problem and predicting mass loss through this process. Section 3 provides constitutive relationships of mass loss based on in vitro enzymatic degradation assays and outlines the relative contribution of bulk versus surface erosion. Results from the mathematical modelling of erosion are presented in the context of theoretical as compared to the experimental mass loss. Furthermore, we investigated the changes in mechanical properties of the degrading grafts and introduced a scalar damage function with an explicit time-dependence to represent the weakening of mechanical properties over degradation time s. Finally, we analyse the results in the context of TEVG development and refinement of G&R tools for guiding graft design.
2. Material and methods
2.1. Graft fabrication
The PGS prepolymer was synthesized as previously described [39]. Briefly, 20 grafts were fabricated from a solvent casting/salt leaching method using 25–32 μm ground salts as porogens [40]. Salts were packed into the mould, which consisted of a stainless steel rod (outer diameter = 0.8 mm) as a mandrel and a teflon outer tubing (inner diameter = 1.58 mm, length = 20 mm). The salt mould was then fused in humidified chamber at 37°C for 90 min. Salt templates were released from the mould. PGS prepolymer was dissolved with tetrahydrofuran to prepare 20% (w/v) solution. The volume of PGS solution was adjusted as 3 : 1 mass ratio of salt : PGS, and added to salt templates. Salt templates were placed in a fume hood for 1 h to evaporate solvent, and cured in a vacuum oven at 150°C for 24 h. After curing, grafts were placed in a series of two water baths (first bath for 24 h and second bath for 48 h) to remove residual salts and then lyophilized (figure 1).
Figure 1.

Scanning electron microscopy image of salt-leached PGS core at time s = 0.
2.2. Enzymatic degradation
Since graft mechanics cannot directly be studied in vivo due to the growth of neotissue upon graft degradation, we conducted an in vitro analysis of the effect of enzymatic degradation on graft properties to understand the physics of degradation and erosion of these grafts. Cholesterol esterase was the enzyme of choice for the study as it has been reported to be the primary enzyme responsible for catalysis of PGS degradation by hydrolysis of ester groups in vivo [41]. Fabricated PGS samples (n = 4 at each of the 4 time points) were immersed in 1 ml solution of phosphate buffered saline with 0.2 units μg−1 PGS of cholesterol esterase (Sigma-Aldrich) kept in an incubator at 37°C maintained at a pH of 7.4. Enzyme concentration was chosen through preliminary experiments that iteratively determined the concentration required to achieve complete in vitro mass loss by three weeks, a time constant found to match in vivo observed rates of mass loss [25]. Initial enzyme concentration for this process was obtained from Chen et al. [42]. The medium was replaced every 2 days to maintain enzyme activity. Mass loss, change in volume fraction, morphology and mechanical properties were recorded at days 1, 4, 7 and 10 after which the grafts lost most of their structural integrity.
2.3. Dry mass loss
The mass of each sample was recorded before immersion in degradation media and at every time point post-degradation. Wet samples at every time-point were thoroughly dried by lyophilization for 24 h. Each sample was then weighed and mass loss was calculated as
| 2.1 |
where m(s) is the dry mass after degradation time s and m(0) is the initial dry mass.
2.4. Change in volume fraction
Porosity and pore size of grafts were measured using a submicrometre resolution (0.35 μm) Skyscan 1272 (Bruker Corporation) 11 Mp micro-computed tomography (microCT) instrument. Samples were scanned before immersion in degradation media for baseline measurements. Following enzymatic degradation, samples were lyophilized at predetermined time points and dry samples were scanned to measure change in porosity and pore size over time. Briefly, samples were mounted on a brass stub with a styrofoam holder (figure 2a) and scanned using the following settings: camera pixel size of 7.4 μm, image pixel size of 2.8 μm, frame averaging of 10, rotation step size of 0.1° and scanned 180° around the vertical axis. In vitro volume fraction of PGS was defined as
| 2.2 |
where ϕPGS(s) is the in vitro volume fraction (also called porosity) of PGS, VPGS(s) is the volume of PGS and Vgraft(s) is the total graft volume as calculated using microCT at time s. To obtain volume fraction, a three-dimensional image was reconstructed as a stack of 2 μm average thick sections in the axial plane using NRecon (Bruker Corporation). Volume fraction was calculated by using CT-Analyser (Bruker Corporation). Briefly, a region of interest (ROI) was defined along the length of the graft followed by identifying a threshold value to obtain a binary image with air as the background (figure 2c). These binary images were then used to obtain overall dimensions and a three-dimensional morphometric analysis was conducted to obtain metrics of volume fractions and to create a surface mesh using the marching cubes algorithm (figure 2d). We calculated the per cent change in in vitro porosity over time of the degrading grafts as
| 2.3 |
where ϕPGS(0) and ϕPGS(s) are the porosities of the scaffolds at time s = 0 and current time, respectively.
Figure 2.

(a) Image of PGS graft mounted on brass stub in styrofoam holder, (b) scanned CT image, (c) reconstructed surface mesh with (d) PGS in red and pores in green. (Online version in colour.)
2.5. Apparent density
The balance of mass equation in mixture theory allows formulation of mass exchange between different constituents. This exchange leads to mass deposition/removal which can occur as a surface or volume erosion process. Surface erosion constitutes evolution of the entire boundary of the species and volume erosion is surface erosion at a microscopic level (at pore surface) throughout the bulk of the body [43]. Looked at another way, pure surface erosion requires that the apparent density of the body remains constant, whereas volume erosion leads to a change in apparent density, where the apparent density of PGS (ρPGSa) is defined as the mass of PGS per unit total TEVG volume. The apparent density can also be defined in terms of graft porosity as follows:
| 2.4 |
where ρPGST is the true material density of PGS.
2.6. Change in bulk morphology
Three-dimensional images obtained from microCT reconstruction were used to calculate the changes in inner and outer diameter as functions of time exposed to enzymatic degradation. These were measured at every 0.2 mm and averaged across the length of the sample followed by normalization to its initial dimensions to calculate per cent change in diameter as
| 2.5 |
where d(0) and d(s) are the diameters of the scaffolds at time s = 0 and current time, respectively.
2.7. Mechanical testing
PGS grafts were assumed to be isotropic as they were fabricated using the method of salt-leaching. Uniaxial tensile testing was performed on each sample to calculate the change in mechanical properties as a function of time exposed to enzymatic degradation. The wet length, diameter and thickness of each sample was recorded before mounting the sample. Each sample was tested uniaxially to failure on a custom-designed biaxial tensile testing machine. Briefly, the device consists of mounting points for various gauge cannulae (Zephyrtronics Inc.) which are used to mount specimens. A bath is provided for submerging samples in desired solution at 37°C. Samples can be stretched axially at a controlled strain rate via a computer-controlled actuator (Aerotech Inc., Model ANT-25LA) under a video camera (Edmund Optics, model EO-5012C) capturing images which are analysed using custom written Matlab (MathWorks, Natick, USA) code to obtain local strain measurements. The load is recorded by a load cell (Transducer Techniques, model MDB-5) affixed to one of the mounts of the device. In this case, samples were stretched uniaxially to failure to obtain their mechanical properties. Samples were mounted on gauge 27 cannulae followed by lightly gluing 250 μm silica microspheres (Whitehouse Scientific Ltd) on the surface for local strain measurements. Four preconditioning cycles were performed by stretching the samples to 10% of their initial length at a strain rate of 0.005 mm s−1. This was followed by stretching the samples to failure. Cauchy stress and stretch were calculated as follows:
| 2.6 |
where f is the load recorded by the load cell, r0(t) and ri(t) are the outer and inner radii, respectively, at current time, calculated by assuming isovolumetric deformation. l(0) and l(t) are the initial and current lengths, respectively.
This data were fit to a standard neo-Hookean model with a time-dependent material coefficient
| 2.7 |
where s represents the G&R time and I1 is the first invariant of the right Cauchy–Green tensor, namely the trace of  .
.
2.8. Mathematical model of surface erosion
In this section, we discuss the analytical solution for the mass loss from a graft subjected to enzymatic degradation. We hypothesized that the mechanism of TEVG mass loss is through a time evolving concentration gradient set up by diffusion of the eroded PGS from the exposed graft surface. This diffusion-driven mass loss can occur in the volume occupied by the solvent (degradation media) which serves as the transport medium for the eroded solute.
We model the graft as a thick walled, circular cylinder and define a cylindrical coordinate system (r, θ, z) with the z-axis coincident with the centreline of the graft. We consider an initial value problem, where at time s = 0, the graft is placed in an impermeable cylinder of radius R3. Ω1(s) and Ω2(s) denote the inner solvent region (0 ≤ r ≤ R1(s), 0 ≤ θ ≤ 2π, 0 ≤ z ≤ L) and outer solvent region (R2(s) ≤ r ≤ R3, 0 ≤ θ ≤ 2π, 0 ≤ z ≤ L), respectively (figure 3). In this work, we approximate these moving boundaries Γ1 and Γ2 as independent of time, based on our perturbation analysis of the moving boundary problem [44]. It follows from the perturbation analysis that this approximation is valid when the ratio cs/ραa ≪ 1. In this study, cs/ρPGSa = 8.77 × 10⁻⁴, supporting the fixed boundary approximation.
Figure 3.

Schematic of cross section of TEVG submerged in degradation media. Diffusion of eroded PGS occurs in the domains Ω1 and Ω2. Γ1 and Γ2 represent the inner and outer surfaces of the PGS graft, respectively. Γ3 represents the impermeable outer tube wall.
The eroded PGS (solute) sets up a concentration gradient in both these domains and Fick's law in conjunction with conservation of mass can be used to model the rate of change of concentration gradient. Figure 3 shows a representative two-dimensional cross section of the hollow cylinder (TEVG) submerged in degradation media.
We employ Fick's law of isotropic diffusion in both fluid domains,
| 2.8 |
where F is the mass flux and D is the coefficient of diffusion, a scalar material constant. Substituting Fick's law in the equation for conservation of mass for a stationary fluid, we obtain
| 2.9 |
The diffusion is modelled as axisymmetric and independent of axial position, so that (2.9) reduces to
| 2.10 |
We impose the standard Noyes–Whitney equation [45] to describe the rate of dissolution of the graft at its inner and outer surfaces, Γ1 and Γ2, respectively
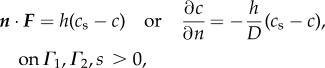 |
2.11 |
where h is a material coefficient, c is the molar concentration and cs is the saturation limit for the solute (eroded PGS) in the solvent (enzymatic media). We assume the concentration is initially zero in both fluid regions,
| 2.12 |
2.8.1. Solution in inner domain, Ω1
At the inner surface of the graft (Γ1), where r = R1 and  , equation (2.11) takes the form,
| 2.13 |
The classical method of separation of variables can be used to obtain the solution c(r, s) to equation (2.10) subject to the boundary condition (2.13) and initial condition (2.12) [46]. For the sake of completeness, the details are included in electronic supplementary material, appendix A. Briefly here, defining
| 2.14 |
for the inner domain Ω1, the solution is
| 2.15 |
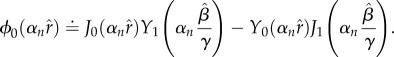
where  are the eigenfunctions of a (singular) Sturm–Liouville problem [47] and αn are the corresponding eigenvalues and found as the distinct, positive real roots of
| 2.16 |
As is well known, these αn can be ordered such that
| 2.17 |
a fact which will be relevant in later sections. Using equations (2.11) and (2.15), mass loss in the inner domain can then be calculated as follows:
| 2.18 |
 |
2.19 |
2.8.2. Solution in outer domain, Ω2
The boundary condition on the outer surface of the TEVG, Γ2 (r = R2,  is
is
| 2.20 |
On the surface of the outer tube wall, Γ3 (r = R3) :  , the zero flux condition becomes
| 2.21 |
The classical method of separation of variables can be used to obtain the solution c(r, t) to equation (2.10) subject to the boundary conditions (2.20) and (2.21) with the initial condition (2.12). The details are provided for completeness in electronic supplementary material, appendix B. Using the following non-dimensionalization in the outer domain:
| 2.22 |
the solution can be written as
| 2.23 |
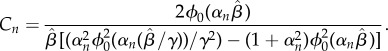
where
 |
2.24 |
The eigenvalues αn are the roots of
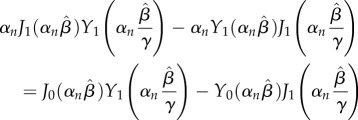 |
2.25 |
and
 |
2.26 |
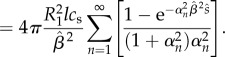
Using this result, the mass loss in the outer domain can obtained by using equations (2.11) and (2.23), applied at Γ2,
| 2.27 |
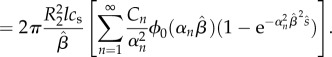 |
2.28 |
2.9. Determination of degradation constants
Mass loss was theoretically calculated through the above boundary value problem using two degradation constants. The experimental condition required change of degradation media every two days which changed the solute concentration. This process was modelled by repeatedly solving the dimensional form of equation (2.28) at each 2-day time point, after which the solute concentration in the solution was returned to zero. For this analysis, we let cs = 0.25 g l−1 [48] as the degradation products of PGS are sebacic acid and gycerol, with glycerol being miscible in the media. h and D are obtained by fitting dimensional form of equation (2.28) to only the first experimental mass loss time point. These values of h and D are then used to predict mass loss at all other subsequent times. These predicted values were validated against the experimentally observed mass loss at each time point.
3. Results
3.1. Baseline graft evaluation
The fabricated grafts (n = 20) had an average outer diameter of 1.51 ± 0.02 mm, inner diameter of 0.85 ± 0.13 mm and length of 9.62 ± 0.36 mm. Porosity of 72.76 ± 1.89% and pore size of 25–32 μm with 99.99% interconnectivity of pores were observed. MicroCT analysis was conducted to assess heterogeneity within samples before exposing them to enzymatic degradation. Figure 4a shows the variation in porosity along the length and figure 4b shows the pore size of a representative sample. All samples showed consistent porosity of 71.84 ± 1.76 across their length and 75% of these pores lie within 16–35 μm for all samples, as expected from porogen size.
Figure 4.

Variation in (a) porosity and (b) pore size of PGS sample at time s = 0. No significant axial variation in porosity was observed.
3.2. Erosion of tissue-engineered vascular graft
Changes in mass, volume fraction and bulk morphology were assessed as a function of time exposed to enzymatic degradation. These are important parameters that indicate the extent of erosion of these grafts. They are also valuable in understanding and modelling the mechanism of erosion in these porous TEVGs.
3.2.1. Survival function: best-fit to experimental mass loss
Rate of mass loss is of fundamental importance for understanding and modelling degradation of these grafts. Figure 5 shows the in vitro rate of mass loss of these porous grafts when exposed to enzymatic degradation. In the constrained mixture model, mass loss of the degrading TEVGs is captured by the survival function QPGS(s) which is defined as:
| 3.1 |
where Δm(s) is defined in equation (2.1). In order to obtain the functional form of the survival function for these porous grafts, we performed nonlinear regression on mass loss as a function of time exposed to enzymatic degradation in vitro. Figure 5 shows the experimental mass loss with the best-fit exponential form of the survival function. Rate constant Q2 controls the rate of degradation.
Figure 5.

Mass remaining (survival function) as a function of time exposed to enzymatic degradation. Data are presented as mean ± standard deviation (n = 4 each time point).
While the form of this survival function is generally assumed to be sigmoidal [20] due to lack of experimental data in the literature, table 1 shows that an exponential function is better suited to model mass loss with an R2 value of 0.99.
Table 1.
Functional forms for survival function with best-fit values and goodness of fit.
| functional form | equation | parameter values | R2 |
|---|---|---|---|
| exponential | QPGS(s) = Q1 e−Q2s | Q1 = 97.74, Q2 = 0.07 d−1 | 0.99 |
| linear | 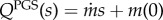 |
 , m(0) = 93.8 , m(0) = 93.8 |
0.88 |
| sigmoidal | QPGS(s) = [1 + ekp^{\rm (s-offset)}]−1 | kp = 1.42 d−1, offset = 27 days | 0.03 |
3.2.2. Tissue-engineered vascular graft mass loss is surface erosion driven
The mass loss of TEVGs can be due to a range of mechanisms, from pure surface erosion to pure volume erosion. Figure 6 shows that there was a 20% reduction in outer diameter at day 10 with a negligible change in the inner diameter. The small change in inner radius can be attributed to saturation of the inner domain and will be explained in detail in later sections. Also, the apparent density of the grafts (as normalized with their original apparent density to account for between sample variations) also remains fairly constant as seen in figure 7 over the duration of degradation. Therefore, mass loss can only be attributed to the erosion of the outer diameter thereby showing that these TEVGs primarily undergo surface erosion.
Figure 6.

Surface erosion is characterized by reduction in diameter of sample. This plot shows the reduction in inner and outer diameters as a function of time exposed to enzymatic degradation. Data are presented as mean ± s.d. (n = 4 each time point).
Figure 7.

Time course of apparent density normalized to initial density of each sample exposed to enzymatic degradation. A value of 1 represents no change in apparent density of the sample, consistent with minimal volume erosion. Data are presented as mean ± s.d. (n = 4 each time point).
3.3. Mathematical modelling of tissue-engineered vascular graft erosion
A simple mass balance shows that saturation of the inner domain causes at most a 0.044% reduction in inner radius of the grafts as follows:
 |
3.2 |
This is consistent with the result that no discernible change in inner radius is observed. As the inner core saturates, the observed surface erosion can be attributed to reduction in outer diameter. Based on the observation that TEVG erosion was primarily driven by a concentration gradient as seen by the negligible loss in inner diameter, we developed a concentration gradient-driven mass diffusion equation to model this mass loss process. Using equation (2.28) and the approach elucidated earlier for the outer domain, we determined that the best-fit values of h and D are 1.053 × 10⁻⁶ mm s−1 and 2.123 × 10⁻⁶ mm2 s−1, respectively. Using these values obtained by fitting to the first experimental time point, and the roots of equation (2.25) outlined in table 2, we can predict mass loss at the subsequent times. Figure 8 shows the experimental and predicted mass loss from the mechanistic model in the outer domain. The first experimental time point was used to fit h, D required in equation (2.28). As can be seen, the predictions at later time points closely follow the experimentally observed mass loss which suggests that the analytical approach accurately models TEVG mass loss.
Table 2.
Roots of equation (2.25).
| n | 1 | 2 | 3 | 4 | 5 | 6 | 7 |
|---|---|---|---|---|---|---|---|
| roots | 0.2919 | 1.7824 | 3.2043 | 4.6504 | 6.1131 | 7.5859 | 9.0649 |
Figure 8.

(a) Graph of experimental and theoretically predicted mass loss. Predicted mass loss is obtained by fitting dimensional form of equation (2.28) to day 1 experimental data. (b) The analytical solution is an infinite series; at least three terms of equation (2.28) are required to achieve a good fit. (Online version in colour.)
Figure 9 shows the spatial distribution of concentration at the experimental time points of 1 and 2 days. It can be seen that saturation is observed at day 1 and the saturation front increases over time. As noted in Material and methods section, after 2 days, the degradation medium was replaced in the experiment to maintain enzyme activity and prevent complete saturation. Through the use of three terms in the series equation (2.28), this analytical approach models the experimental phenomena and re-establishes the concentration gradient which can be seen by the increase in rate of mass loss after 2 days following a period of reduction in rate of mass loss (figure 8). This method provides a better understanding of the physical phenomena causing erosion which is a significant improvement to using a single rate constant obtained through a best-fit over degradation time.
Figure 9.

Graph of (a) non-dimensional concentration ( ) and (b) concentration c normalized to cs as a function of radius (R2 ≤ r ≤ R3) at 1 day (orange) and 2 days (black). Almost 50% radial saturation was observed at day 1 and increased slightly with time.
3.4. Degradation of tissue-engineered vascular graft
3.4.1. Change in mechanical properties
Change in mechanical properties due to degradation is a crucial component of in situ host-remodelling. Degradation of polymer alters mechanical properties of the grafts, which causes a transfer of load from the degrading graft to the surrounding cells under in vivo conditions. In order to capture this phenomenon accurately in our G&R tool, we need to obtain the functional form and rate constants associated with the evolving material properties. Figure 10 shows the stress–stretch data fitted to a neo-Hookean model (equation (2.7)) at each degradation time point with an R2 > 0.97 for each sample.
Figure 10.

Cauchy stress–stretch curves (circles) as a function of time exposed to enzymatic degradation with fit for β(s) in the neo-Hookean model (solid lines) (equation (2.7)).
Section 3.2.2 shows that the TEVG mass loss is primarily surface driven; however, the mechanical properties are not. Specifically, the mechanical properties of the grafts do not scale with density. We introduce an explicit time dependence of mechanical properties to the existing G&R models by introducing a scalar damage function ζ(s) such that 0 ≤ ζ(s) ≤ 1. This damage function ‘softens’ the material over degradation time s. Here, 1 represents the value for the initial undamaged graft and 0 represents complete degradation. Hence, the mechanical properties of the degrading graft can be represented as
| 3.3 |
where βPGS0 = 34.43 kPa
The damage function is obtained by a nonlinear regression fit of ζ(s) normalized to the shear modulus at s = 0 (figure 11). It can be seen from table 3 that an exponential fit to the normalized ζ(s) values yielded an R2 value of 0.96.
Figure 11.

(a) Neo-Hookean parameter fit as a function of time. (b) ζ(s) fit as a function of time, to model damage-like phenomena in changing mechanical properties of grafts exposed to enzymatic degradation. Data are shown as mean ± s.d. (n = 4 each time point). (Online version in colour.)
Table 3.
Functional forms for time-evolving neo-Hookean parameter with best fit values and goodness of fit.
| functional form | equation | parameter values | R2 |
|---|---|---|---|
| exponential | ζ(s) = ζ1 e−ζ2s | ζ1 = 1, ζ2 = 0.164 | 0.96 |
| linear |  |
 |
0.89 |
In summary, the experimental data provided by the in vitro enzymatic degradation study conducted on these porous TEVGs enable the formulation of data-driven functional forms of the survival function and changing material properties. Recall the strain energy function for the entire mixture
 |
3.4 |
For the TEVG component in question,
| 3.5 |
since PGS is only degrading and is not deposited over time. Therefore,
| 3.6 |
Substituting the form of the survival function and evolving material properties gives
| 3.7 |
where values of Q1 and Q2 are given in table 1.
4. Discussion
Successful G&R elicited by porous acellular TEVGs rests on the effective interplay between PGS degradation, erosion and ECM deposition. Computational G&R tools have proven to be sources of predictive capabilities that guide rational design of TEVGs. However, this predictive capability depends on the knowledge of certain properties that can be prescribed through experimental data or mechanistic models. Two such material properties that are the focus of this study are degradation and erosion rates of grafts. It has been postulated that the main mechanism of ECM deposition is through the stress-driven mechanobiological response of ECM-producing cells which requires accurate modelling of load transfer from the graft. Since graft mechanics cannot directly be studied in vivo due to the growth of neotissue upon graft degradation, we conducted an in vitro analysis of the effect of enzymatic degradation on graft properties.
We took two approaches to modelling the mass loss due to erosion of these TEVGs based on experimental data. Firstly, we obtained functional forms and rate constants of the survival function by providing a best-fit to mass loss over time. While most previous models assume a sigmoidal mass loss [20], we observe that an exponential model provides a better fit in this context. Another significant finding was that despite the porous nature of these grafts, most mass loss occurs at the surface of these TEVGs. This was evidenced by the small change in density, pore size and inner diameter of the grafts over degradation time. Based on these results, we formulated a mathematical model of graft erosion and validated the proposed theoretical model with experimental data. The boundary value problem formulated herein enables the prediction of mass loss through two degradation constants h and D. Furthermore, differences between the in vivo and in vitro setting can be included in this framework by changing the rate constants and boundary conditions while using the same functional forms of the equations. For example, the inner boundary condition can be changed to a convection boundary condition to account for blood flow in the lumen in vivo. Cell infiltration in vivo is expected to alter the rate constants for degradation and erosion and not the functional forms themselves. These rate constants can be tuned for in vivo applications based on measurements of neoartery formation. For example, the parameters h and D can be tuned for in vivo mass loss through a parametric evaluation guided by observations from experiments. The rate of degradation could additionally be affected in vivo by strains experienced by the graft. However, due to the nature of graft implantation, there is no axial strain at implantation and the presence of the PCL sheath restricts circumferential strain to be less than 4%. The influence of larger strains on degradation rates can be evaluated, if needed, in future studies.
Another important aspect of the in-host remodelling process is the changing load bearing contribution of the degrading TEVG which guides cellular response over time. We observed that while mass loss is largely surface-driven, mechanical properties are not. Herein, we provided a constitutive relationship for the ‘weakening’ of material properties due to degradation over time by introducing a damage function. This key finding ensures that mechanical properties are extracted from the dependence on mass loss alone and are explicitly modelled as functions of degradation time; an improvement to existing G&R models.
It must be noted that while erosion was primarily observed on the outer surface of the grafts, we did observe some minor volume degradation at the pores. Figure 12 shows that there was an 8% increase in porosity at day 10 which corresponds to only a 3% mass loss. We also modelled mechanical properties of the graft using an assumption of isochoric deformation for an incompressible material. This assumption is often made in models of the artery wall and vascular grafts [13,20], and future studies can explore the importance of modelling the graft using a two-parameter coupled compressible neo-Hooken model [49].
Figure 12.

Per cent change in porosity as a function of time exposed to enzymatic degradation. Very small increase in porosity suggests little volumetric degradation. Data are shown as mean ± s.d. (n = 4 each time point).
These findings not only provide an understanding of the fundamental process of PGS degradation and erosion, but also provide broader insights into the in vivo remodelling process. The finding that graft surface erosion is dominated by an evolving concentration gradient implies that the pores in these grafts saturate which is consistent with data found here on mass loss. This has implications in the inflammatory response of cells; a crucial first response that guides further remodelling [50]. Furthermore, since pore size is one of the major determinants of macrophage polarization [51] it can be conjectured that these cells sense the fabricated pore size and that their behavior can be modulated as desired through this particular graft parameter. It must also be mentioned that while this study enabled us to understand the underlying mechanism of graft degradation, the effect of volume degradation can be enhanced in vivo by the presence of cells, especially macrophages. This phenomenon is currently under investigation in our group and is being included in the G&R framework to improve its predictive capability for use in rational design of TEVGs.
5. Conclusion
In summary, this work provides much-needed experimental data required to guide computational G&R modelling in the field. It is the first study that takes a physics-based approach to informing G&R computational tools with physical mechanisms of degradation and erosion of these grafts using a controlled environment. It also serves as an essential complement to our ongoing in vivo study of neoartery formation using the PGS core studied here as replacement vessels in the carotid artery of rats [52]. These results are of value not only for the use of G&R frameworks as predictive tools but also for understanding the fundamental mechanisms responsible for successful in-host remodelling of TEVGs as translational medical devices.
Supplementary Material
Data accessibility
The mathematical derivations supporting this article have been uploaded as part of the electronic supplementary material.
Authors' contributions
A.M.R conceived, led the project and oversaw writing of the manuscript. P.S.G performed the design and analysis of in vitro experiments, computational analysis and took a major role in writing the manuscript. A.M.R and P.S.G carried out the theoretical analysis of graft erosion and interpretation of results. K.L fabricated the grafts required for the experiments. B.N.P performed analysis of the enzyme concentration required to achieve an appropriate rate of graft degradation. Y.W advised with the preliminary design of the experimental study. All authors contributed to discussions and writing of the manuscript.
Competing interests
None of the authors have any financial or personal relationships with people or organizations that could inappropriately influence this work.
Funding
This research was supported, in part, by a grant from the National Heart, Lung, and Blood Institute (NHLBI) of the NIH (NIH/1R21HL124479-01): In Host Remodelling of Grafts to Functional Arteries—Translation to Mature Animals (PIs: Y.W., A.M.R.).
References
- 1.Weinberg CB, Bell E. 1986. A blood vessel model constructed from collagen and cultured vascular cells. Science 24, 397–401. ( 10.1126/science.2934816) [DOI] [PubMed] [Google Scholar]
- 2.Lawson JH. et al. 2016. Bioengineered human acellular vessels for dialysis access in patients with end-stage renal disease: two phase 2 single-arm trials. Lancet 387, 2026–2034. ( 10.1016/S0140-6736(16)00557-2) [DOI] [PMC free article] [PubMed] [Google Scholar]
- 3.American Heart Association. 2005. Heart disease and stroke statistics. American Heart Association Update, pp. 1–52. [Google Scholar]
- 4.Kannan RY, Salacinski HJ, Butler PE, Hamilton G, Seifalian AM. 2005. Current status of prosthetic bypass grafts: a review. J. Biomed. Mater. Res. B 74B, 570–581. ( 10.1002/jbm.b.30247) [DOI] [PubMed] [Google Scholar]
- 5.Stankus JJ, Soletti L, Fujimoto K, Hong Y, Vorp DA, Wagner WR. 2007. Fabrication of cell microintegrated blood vessel constructs through electrohydrodynamic atomization. Biomaterials 28, 2738–2746. ( 10.1016/j.biomaterials.2007.02.012) [DOI] [PMC free article] [PubMed] [Google Scholar]
- 6.L'Heureux N. et al. 2006. Human tissue-engineered blood vessels for adult arterial revascularization. Nat. Med. 12, 361–365. ( 10.1038/nm1364) [DOI] [PMC free article] [PubMed] [Google Scholar]
- 7.Hashi CK, Zhu Y, Yang G-Y, Young WL, Hsiao BS, Wang K, Chu B, Li S. 2007. Antithrombogenic property of bone marrow mesenchymal stem cells in nanofibrous vascular grafts. Proc. Natl Acad. Sci. USA 104, 11 915–11 920. ( 10.1073/pnas.0704581104) [DOI] [PMC free article] [PubMed] [Google Scholar]
- 8.Hibino N. et al. 2011. Tissue-engineered vascular grafts form neovessels that arise from regeneration of the adjacent blood vessel. FASEB J. 25, 2731–2739. ( 10.1096/fj.11-182246) [DOI] [PMC free article] [PubMed] [Google Scholar]
- 9.Udelsman BV, Khosravi R, Miller KS, Dean EW, Bersi MR, Rocco K, Yi T, Humphrey JD, Breuer CK. 2014. Characterization of evolving biomechanical properties of tissue engineered vascular grafts in the arterial circulation. J. Biomech. 47, 2070–2079. ( 10.1016/j.jbiomech.2014.03.011) [DOI] [PMC free article] [PubMed] [Google Scholar]
- 10.Wu W, Allen RA, Wang Y. 2012. Fast-degrading elastomer enables rapid remodeling of a cell-free synthetic graft into a neoartery. Nat. Med. 18, 1148–1153. ( 10.1038/nm.2821) [DOI] [PMC free article] [PubMed] [Google Scholar]
- 11.Driessen NJB, Wilson W, Bouten CVC, Baaijens FPT. 2004. A computational model for collagen fibre remodelling in the arterial wall. J. Theor. Biol. 226, 53–64. ( 10.1016/j.jtbi.2003.08.004) [DOI] [PubMed] [Google Scholar]
- 12.Allen RA. et al. 2014. Nerve regeneration and elastin formation within poly(glycerol sebacate)-based synthetic arterial grafts one-year post-implantation in a rat model. Biomaterials 35, 165–173. ( 10.1016/j.biomaterials.2013.09.081) [DOI] [PMC free article] [PubMed] [Google Scholar]
- 13.Gleason RL, Humphrey JD. 2005. A 2D constrained mixture model for arterial adaptations to large changes in flow, pressure and axial stretch. Math. Med. Biol. 22, 347–369. ( 10.1093/imammb/dqi014) [DOI] [PubMed] [Google Scholar]
- 14.Alford PW, Humphrey JD, Taber LA. 2007. Growth and remodeling in a thick-walled artery model: effects of spatial variations in wall constituents. Biomech. Model. Mechanobiol. 7, 245–262. ( 10.1007/s10237-007-0101-2) [DOI] [PMC free article] [PubMed] [Google Scholar]
- 15.Valentin A, Humphrey JD, Holzapfel GA. 2013. A finite element-based constrained mixture implementation for arterial growth, remodeling, and adaptation: theory and numerical verification. Int. J. Numer. Methods Biomed. Eng. 29, 822–849. ( 10.1002/cnm.2555) [DOI] [PMC free article] [PubMed] [Google Scholar]
- 16.Watton PN, Ventikos Y, Holzapfel GA. 2011. Modelling cerebral aneurysm evolution. In Biomechanics and mechanobiology of aneurysms (ed. T McGloughlin), pp. 373–399. Berlin, Germany: Springer. ( ) [DOI] [Google Scholar]
- 17.Watton PN, Raberger NB, Holzapfel GA, Ventikos Y. 2009. Coupling the hemodynamic environment to the evolution of cerebral aneurysms: computational framework and numerical examples. J. Biomech. Eng. 131, 101003 ( 10.1115/1.3192141) [DOI] [PubMed] [Google Scholar]
- 18.Baek S, Rajagopal KR, Humphrey JD. 2005. Competition between radial expansion and thickening in the enlargement of an intracranial saccular aneurysm. J. Elast. 80, 13–31. ( 10.1007/s10659-005-9004-6) [DOI] [Google Scholar]
- 19.Figueroa AC, Baek S, Taylor CA, Humphrey JD. 2009. A computational framework for fluid-solid-growth modeling in cardiovascular simulations. Comput. Methods Appl. Mech. Eng. 198, 3583–3602. ( 10.1016/j.cma.2008.09.013) [DOI] [PMC free article] [PubMed] [Google Scholar]
- 20.Miller KS, Khosravi R, Breuer CK, Humphrey JD. 2015. A hypothesis-driven parametric study of effects of polymeric scaffold properties on tissue engineered neovessel formation. Acta Biomater. 11, 283–294. ( 10.1016/j.actbio.2014.09.046) [DOI] [PMC free article] [PubMed] [Google Scholar]
- 21.Valentin A, Duan X, Allen R, Zunino P, Wang Y, Robertson AM. 2013. A predictive computational model of arterial tissue equivalent evolution. In Proc. 4th Canadian Conf. on Nonlinear Solid Mechanics (CanCNSM), Montreal, Canada, 23–26 July 2013, paper 715. [Google Scholar]
- 22.Humphrey JD, Rajagopal KR. 2002. A constrained mixture model for growth and remodeling of soft tissues. Math. Models Methods Appl. Sci. 12, 407–430. ( 10.1142/S0218202502001714) [DOI] [Google Scholar]
- 23.Niklason LE, Yeh AT, Calle EA, Bai Y, Valentin A, Humphrey JD. 2009. Enabling tools for engineering collagenous tissues integrating bioreactors, intravital imaging, and biomechanical modeling. Proc. Natl Acad. Sci. USA 107, 3335–3339. ( 10.1073/pnas.0907813106) [DOI] [PMC free article] [PubMed] [Google Scholar]
- 24.Ottenbrite RM, Albertsson AC, Scott G. 1992. Discussion on degradation terminology. In Biodegradable polymers and plastics (eds M Vert, J Feijen, AC Albertsson, G Scott, E Chiellini), pp. 73–92. Cambridge, UK: Royal Society of Chemistry. [Google Scholar]
- 25.Wang Y, Kim YM, Langer R. 2003. In vivo degradation characteristics of poly(glycerol sebacate). J. Biomed. Mater. Res. 66A, 192–197. ( 10.1002/jbm.a.10534) [DOI] [PubMed] [Google Scholar]
- 26.Nijst CLE, Bruggeman JP, Karp JM, Ferreira L, Zumbuehl A, Bettinger CJ, Langer R. 2007. Synthesis and characterization of photocurable elastomers from poly(glycerol-co-sebacate). BioMacromolecules 8, 3067–3073. ( 10.1021/bm070423u) [DOI] [PMC free article] [PubMed] [Google Scholar]
- 27.Rai R. et al. 2015. Bioactive electrospun fibers of poly(glycerol sebacate) and poly(ɛ-caprolactone) for cardiac patch application. Adv. Healthcare Mater. 4, 2012–2025. ( 10.1002/adhm.201500154) [DOI] [PubMed] [Google Scholar]
- 28.Ravichandran R, Venugopal JR, Sundarrajan S, Mukherjee S, Ramakrishna S. 2011. Poly(glycerol sebacate)/gelatin core/shell fibrous structure for regeneration of myocardial infarction. Tissue Eng. A 17, 1363–1373. ( 10.1089/ten.tea.2010.0441) [DOI] [PubMed] [Google Scholar]
- 29.Radisic M, Park H, Martens TP, Salazar-Lazaro JE, Geng W, Wang Y, Langer R, Freed LE, Vunjak-Novakovic G. 2008. Pre-treatment of synthetic elastomeric scaffolds by cardiac fibroblasts improves engineered heart tissue. J. Biomed. Mater. Res. 86, 713–724. ( 10.1002/jbm.a.31578) [DOI] [PMC free article] [PubMed] [Google Scholar]
- 30.Crapo PM, Wang Y. 2010. Physiologic compliance in engineered small-diameter arterial constructs based on an elastomeric substrate. Biomaterials 31, 1626–1635. ( 10.1016/j.biomaterials.2009.11.035) [DOI] [PMC free article] [PubMed] [Google Scholar]
- 31.Kemppainen JM, Hollister SJ. 2010. Tailoring the mechanical properties of 3D-designed poly(glycerol sebacate) scaffolds for cartilage applications. J. Biomed. Mater. Res. A 94A, 9–18. ( 10.1002/jbm.a.32653) [DOI] [PubMed] [Google Scholar]
- 32.Zaky SH, Hangadora CK, Tudares MA, Gao J, Jensen A, Wang Y, Sfeir C, Almarza AJ. 2014. Poly (glycerol sebacate) elastomer supports osteogenic phenotype for bone engineering applications. Biomed. Mater. 9, 25003 ( 10.1088/1748-6041/9/2/025003) [DOI] [PubMed] [Google Scholar]
- 33.Sundback C, Shyu J, Wang Y, Faquin W, Langer R, Vacanti J, Hadlock T. 2005. Biocompatibility analysis of poly(glycerol sebacate) as a nerve guide material. Biomaterials 26, 5454–5464. ( 10.1016/j.biomaterials.2005.02.004) [DOI] [PubMed] [Google Scholar]
- 34.Fidkowski C, Kaazempur-Mofrad MR, Borenstein J, Vacanti JP, Langer R, Wang Y. 2005. Endothelialized microvasculature based on a biodegradable elastomer. Tissue Eng. 11, 302–309. ( 10.1089/ten.2005.11.302) [DOI] [PubMed] [Google Scholar]
- 35.Hu J, Kai D, Ye H, Tian L, Ding X, Ramakrishna S, Loh XJ. 2017. Electrospinning of poly(glycerol sebacate)-based nanofibers for nerve tissue engineering. Mater. Sci. Eng. C 70, 1089–1094. ( 10.1016/j.msec.2016.03.035) [DOI] [PubMed] [Google Scholar]
- 36.Barbanti SH, Zavaglia CAC, Duek EA de R. 2008. Effect of salt leaching on PCL and PLGA(50/50) resorbable scaffolds. Mater. Res. 11, 75–80. ( 10.1590/S1516-14392008000100014) [DOI] [Google Scholar]
- 37.Aramwit P, Ratanavaraporn J, Ekgasit S, Tongsakul D, Bang N. 2014. A green salt-leaching technique to produce sericin/PVA/glycerin scaffolds with distinguished characteristics for wound-dressing applications. J. Biomed. Mater. Res. B 103, 915–924. ( 10.1002/jbm.b.33264) [DOI] [PubMed] [Google Scholar]
- 38.Mattioli-Belmonte M, Vozzi G, Kyriakidou K, Pulieri E, Lucarini G, Vinci B, Pugnaloni A, Biagini G, Ahluwalia A. 2008. Rapid-prototyped and salt-leached PLGA scaffolds condition cell morpho-functional behavior. J. Biomed. Mater. Res. A 85A, 466–476. ( 10.1002/jbm.a.31483) [DOI] [PubMed] [Google Scholar]
- 39.Wang Y, Ameer GA, Sheppard BJ, Langer R. 2002. A tough biodegradable elastomer. Nat. Biotechnol. 20, 602–606. ( 10.1038/nbt0602-602) [DOI] [PubMed] [Google Scholar]
- 40.Lee K-W, Wang Y. 2011. Elastomeric PGS scaffolds in arterial tissue engineering. J. Vis. Exp. 50, E2691 ( 10.3791/2691) [DOI] [PMC free article] [PubMed] [Google Scholar]
- 41.Gerald S. 2013. Degradable polymers: principles and applications. Berlin, Germany: Springer Science & Business Media. [Google Scholar]
- 42.Chen Q, Yang X, Yuan L. 2012. A comparative study on in vitro enzymatic degradation of poly(glycerol sebacate) and poly(xylitol sebacate). RSC Adv. 2, 4125–4134. ( 10.1039/c2ra20113e) [DOI] [Google Scholar]
- 43.Ateshian GA. 2011. The role of mass balance equations in growth mechanics illustrated in surface and volume dissolutions. J. Biomech. Eng. 133, 011010 ( 10.1115/1.4003133) [DOI] [PMC free article] [PubMed] [Google Scholar]
- 44.Robertson AM, Gade PS, Jiao K. In preparation. Perturbation solution for the full moving boundary problem of an eroding axisymmetric vascular graft. [Google Scholar]
- 45.Noyes AA, Whitney WR. 1897. The rate of dissolution of solid substances in their own solutions. J. Am. Chem. Soc. 19, 930–934. ( 10.1021/ja02086a003) [DOI] [Google Scholar]
- 46.Carslaw HS, Jaeger JC. 1959. Conduction of heat in solids, 2nd edn Oxford, UK: Claredon Press. [Google Scholar]
- 47.Boyce WE, DiPrima RC. 2007. Elementary differential equations, 7th edn Oxford, UK: John Wiley. [Google Scholar]
- 48.Bretti C, Crea F, Foti C, Sammartano S. 2006. Solubility and activity coefficients of acidic and basic nonelectrolytes in aqueous salt solutions. 2. Solubility and activity coefficients of suberic, azelaic, and sebacic acids in NaCl(aq), (CH3)4NCl(aq), and (C2H5)4NI(aq) at different ionic strengths and at t = 25°C. J. Chem. Eng. Data 51, 1660–1667. ( 10.1021/je060132t) [DOI] [Google Scholar]
- 49.Holzapfel GA. 2000. Nonlinear solid mechanics, vol. 24. Chichester, UK: Wiley. [Google Scholar]
- 50.Roh JD. et al. 2008. Small-diameter biodegradable scaffolds for functional vascular tissue engineering in the mouse model. Biomaterials 29, 1454–1463. ( 10.1016/j.biomaterials.2007.11.041) [DOI] [PMC free article] [PubMed] [Google Scholar]
- 51.Madden LR. et al. 2010. Proangiogenic scaffolds as functional templates for cardiac tissue engineering. Proc. Natl Acad. Sci. USA 107, 15 211–15 216. ( 10.1073/pnas.1006442107) [DOI] [PMC free article] [PubMed] [Google Scholar]
- 52.Gade PS, Lee KW, Wang Y, Robertson AM. 2017. Experimental methods to drive a computational growth and remodeling framework for in situ tissue engineered vascular grafts. In Proc. 5th Int. Conf. on Computational and Mathematical Biomedical Engineering, Pittsburgh, PA, USA, 10–12 April 2017, vol. 2 (eds P Nithiarasu, AM Robertson), pp. 846–849. [Google Scholar]
Associated Data
This section collects any data citations, data availability statements, or supplementary materials included in this article.
Supplementary Materials
Data Availability Statement
The mathematical derivations supporting this article have been uploaded as part of the electronic supplementary material.