

Summary
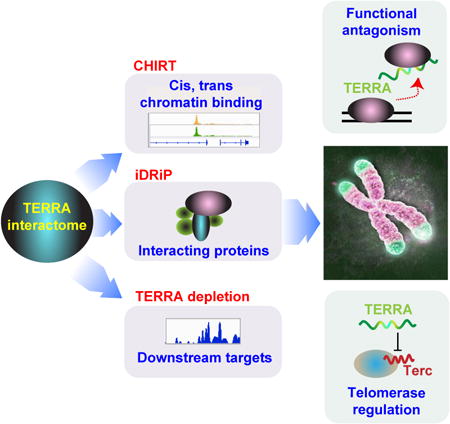
Through an integration of genomic and proteomic approaches to advance understanding of long noncoding RNAs, we investigate the function of the telomeric transcript, TERRA. By identifying thousands of TERRA target sites in the mouse genome, we demonstrate that TERRA can bind both in cis to telomeres and in trans to genic targets. We then define a large network of interacting proteins, including epigenetic factors, telomeric proteins, and the RNA helicase, ATRX. TERRA and ATRX share hundreds of target genes and are functionally antagonistic at these loci: Whereas TERRA activates, ATRX represses gene expression. At telomeres, TERRA competes with telomeric DNA for ATRX binding, suppresses ATRX localization, and ensures telomeric stability. Depleting TERRA increases telomerase activity and induces telomeric pathologies, including formation of telomere-induced DNA damage foci and loss or duplication of telomeric sequences. We conclude that TERRA functions as epigenomic modulator in trans and as essential regulator of telomeres in cis.
Graphical abstract
Introduction
The Human Genome and ENCODE Projects have shown that the protein-coding potential of the mammalian genome is extremely limited (Consortium et al., 2007; Kung et al., 2013). Although only 2% of the genome is coding, >90% is transcribed. This transcriptional activity largely produces long noncoding RNAs (lncRNA), the functions of which have remained mostly unknown. This pervasive transcription extends to the ends of eukaryotic chromosomes. In spite of associated heterochromatin, telomeric ends actively synthesize a heterogeneous population of long noncoding RNAs dubbed “TERRA” (telomeric repeat-containing RNAs)(Azzalin et al., 2007; Schoeftner and Blasco, 2007; Zhang et al., 2009). TERRA ranges in size from 100 bases to >100 kb and contains the canonical telomeric repeat sequence, UUAGGG, as well as sequences unique to the sub-telomeric region of each chromosome. The function of TERRA has generated major interest in light of its association with human diseases, such as cancer, aging, and the ICF syndrome (Maicher et al., 2012; Azzalin and Lingner, 2015). Early observations noted that TERRA RNA is localized to the ends of nearly all mammalian chromosomes, with RNA foci being especially prominently associated with sex chromosomes (Azzalin and Lingner, 2008; Schoeftner and Blasco, 2008; Zhang et al., 2009). Cytological studies have also indicated that only about half of detectable TERRA transcripts are localized to telomeres (Le et al., 2013).
Because of the preferential association with telomeres, investigation into TERRA function has focused almost exclusively on telomeres — structures that cap physical ends of linear chromosomes and protects them from unprogrammed shortening and genetic rearrangements (Blackburn et al., 2006; Bernardes de Jesus and Blasco, 2013; Doksani and de Lange, 2014; Azzalin and Lingner, 2015). Multiple studies have implicated TERRA as regulator of telomerase and telomere length (Sandell et al., 1994; Redon et al., 2010; Maicher et al., 2012; Pfeiffer and Lingner, 2012; Fei et al., 2015). TERRA has also been proposed to regulate recombination between telomeric ends (Balk et al., 2013; de Silanes et al., 2014; Yu et al., 2014) and serve as a scaffold for recruitment of chromatin factors such as HP1, histone methyltransferases, and shelterins to telomeric heterochromatin (Deng et al., 2009). TERRA therefore appears to be an integral part of telomeric architecture. However, while major progress has been made towards understanding TERRA biology, its specific in vivo functions and mechanisms remain ill-defined — especially regarding whether TERRA plays a direct role in each of the proposed functions (Azzalin and Lingner, 2015; Rippe and Luke, 2015).
Major obstacles in the quest to uncover TERRA function have been related to: (i) The inability to deplete TERRA RNA using knockdown technology and the infeasibility of creating TERRA deletions at telomeric ends; (ii) an incomplete knowledge of the TERRA protein interactome; and (iii) a poor understanding of where TERRA binds in the genome (Maicher et al., 2012; Azzalin and Lingner, 2015; Rippe and Luke, 2015). Similar limitations apply to nearly all lncRNAs, explaining the pervasive challenges associated with studying lncRNA in general. Here, we seek to overcome technical barriers and advance understanding of lncRNAs by combining RNA-centric epigenomics and proteomics approaches. Using TERRA as case study, we generate a map of TERRA's chromatin-interaction sites, define a comprehensive proteome, and establish a method of TERRA depletion to uncover in vivo functions. We integrate large datasets with new biochemical and cytological data to identify ATRX as a key interactor and to uncover a major role for TERRA in telomere end protection.
Results
TERRA RNA is not restricted to the telomere
To explore TERRA localization, we performed RNA fluorescence in situ hybridization (FISH) using TERRA-specific oligo probes. In low exposure photographs, one or two prominent TERRA domains were evident in nuclei of 16.7 mouse embryonic stem (ES) cells (Fig. 1A). Consistent with previous reports (Schoeftner and Blasco, 2007; Zhang et al., 2009), these prominent TERRA foci marked the distal ends of sex chromosomes and colocalized with the pseudoautosomal region (PAR) in >85% of ES cells (Fig. 1B). In higher exposure photographs, many additional (albeit smaller) TERRA foci became apparent throughout the nucleus (Fig. 1A). TERRA RNA immunoFISH indicated that a subset of pinpoint foci coincided with telomeres, as shown by frequent colocalization with TRF2 and RAP1 (Fig. 1C). Interestingly, as only 19.7% of TERRA colocalized with TRF2 (Fig. S1A), TERRA may bind non-telomeric sites as well.
Figure 1. CHIRT-seq analysis shows that TERRA RNA binds chromatin on a global scale and is not confined to telomeres.
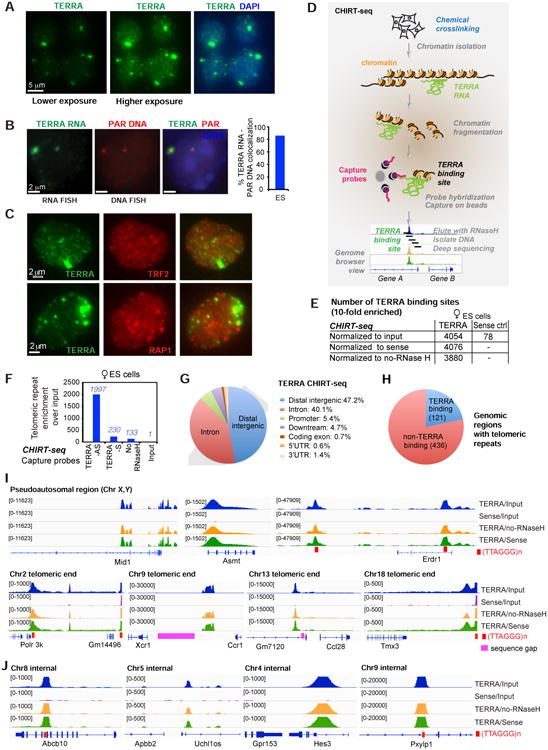
A. RNA FISH shows TERRA foci (green) at low and high exposures in mouse ES cells. DAPI detects nuclear DNA.
B. TERRA prominent spots are associated with the ends of sex chromosomes. TERRA RNA FISH (green) followed by the DNA FISH using the probes (red) derived from the pseudoautosomal regions (PAR) of sex chromosomes. The percentage of TERRA RNA foci colocalized with PAR DNA is shown in the right panel.
C. Partial colocalization of TERRA and telomeres. RNA immunoFISH of TERRA (green) and TRF2 (red, top) or RAP1 (red, bottom). Colocalization counts shown in Fig. S1A.
D. Modified CHIRT protocol to capture TERRA binding sites in chromatin.
E. CHIRT results: Number of significant TERRA peaks with 10-fold enrichment over background and the length greater than 1 kb in ES cells.
F. TERRA CHIRT-seq showed enrichment for telomeric repeats DNA over input in female ES cells. Samples captured by TERRA-AS or TERRA-S. No-RNaseH for the TERRA-AS capture is also shown as a control. Raw read counts are normalized to spike-in control.
G. CEAS analysis: Pie CHIRT shows relative representation of various genomic regions for TERRA binding sites.
H. CEAS analysis: Pie chart of genomic regions containing telomeric repeats shows that only ∼21% of such regions are bound by TERRA RNA.
I,J. Views of TERRA-binding sites within subtelomeric regions (I) and internal genes (J) of multiple chromosomes.
For molecular resolution, genomic binding sites for an RNA of interest can be mapped by pulling down associated chromatin using complementary capture probes (Fig. 1D). Here, it was necessary to optimize existing methods by combining ChIRP (Chu et al., 2011) and CHART (Simon et al., 2011) — henceforth “CHIRT” — because TERRA's highly repetitive nature precluded use of tiling probes. The use of a single capture probe (rather than a pool) presented a technical challenge, as (TTAGGG)n is present at high copy numbers at all chromosomal ends and capture probes could in principle could pull down telomeric DNA rather than the intended TERRA RNA to cause a high background. We optimized various conditions, including use of RNAseH to elute probe(DNA)-RNA interactions, without eluting probe(DNA)-DNA interaction (see Methods for details). We designed two DNA-based capture probes: (i) TERRA antisense (TERRA-AS), to capture transcripts containing UUAGGG repeats, and (ii) TERRA sense (TERRA-S, the reverse complement), to control for strand-specificity. Slot blot analysis showed that TERRA-AS probes captured TERRA RNA, whereas the corresponding sense probes did not (Fig. S1B). Spike-in controls were included for normalization between samples.
To rule out artifacts due to direct probe hybridization to genomic DNA rather than the intended RNA target, we sequenced two controls: (i) an RNaseH- control in which RNaseH was omitted in the elution step, which would in principle preclude elution of RNA-dependent interactions; and (ii) a TERRA-S control, which would not hybridize to TERRA RNA but would pull down potential contaminating DNA. Approximately 30 million 50-bp paired-end reads were obtained for each CHIRT library. After removing PCR duplicates, >70% of reads uniquely mapped to the mouse genome. Biological replicates showed a high degree of correlation (Fig. S1C,D). Regardless of whether we normalized to (i) input library, (ii) TERRA-S library, or (iii) no-RNaseH library, the results were highly similar (Fig. S1E). Using MACS software, we called statistically significant TERRA peaks and identified thousands of binding sites in ES cells (Fig. 1E). While ∼4000 binding sites were uncovered using the TERRA-AS capture probe, <80 were evident using TERRA-S, suggesting that CHIRT specifically captured TERRA RNA targets.
Major enrichment at telomeric repeat DNA was observed only in the TERRA-AS pulldown and not in TERRA-S and no-RNaseH controls (Fig. 1F). The fact that sense and antisense probes yielded dissimilar profiles overall (Fig. 1E,F, S1D) argued against hybridization capture of genomic DNA rather than the intended RNA target. Although telomeres were strong binding sites, the vast majority of binding sites actually occurred outside of telomeres (Fig. 1G; S1F,G). CEAS analysis revealed preferential binding to noncoding sequences, with preference for intergenic regions and introns (Fig. 1G; S1F,G). Excluding genomic regions containing telomeric repeats did not change the distribution (Fig. S1G). The distribution was also similar when CEAS analysis was performed only on genomic regions (internal + telomeric) containing telomeric repeats (Fig. S1G). Notably, only a minority (21%) of genomic regions with telomeric repeats were sites of TERRA binding (Fig. 1H). Conversely, TERRA-binding sites did not necessarily contain telomeric repeat sequences (Fig. S1G). Thus, TERRA binding was not defined by presence of telomeric repeats in the underlying chromatin.
Nonetheless, chromosome maps showed greatest TERRA density at or near telomeric ends (Fig. S1H; telomeric reads could be unambiguously aligned by their chromosome-specific subtelomeric sequences). TERRA read coverage was high within subtelomeric regions of nearly all chromosomes (Chr), most prominently Chr. 2, 9, 13, 18, and the sex chromosomes, with targets being as much as tens of kilobases away from the telomeric repeat (Fig. 1I). Consistent with TERRA RNA FISH, the strongest TERRA binding sites occurred within the pseudoautosomal regions (PAR) of sex chromosomes (Fig. 1I). TERRA also bound within internal chromosomal regions and within genes, where it favored introns (Fig. 1J). Thus, although TERRA has mainly been studied in the context of telomeres (Le et al., 2013; Rippe and Luke, 2015), TERRA binds chromatin targets throughout the genome. We conclude that TERRA binds both in cis at telomeres and in trans within or near genes.
TERRA depletion causes dysregulation of TERRA target genes
Determination of TERRA's in vivo function requires a method of TERRA depletion. Previous efforts to deplete TERRA RNA (and many other nuclear lncRNAs) have been unsuccessful. Deletional approaches have been infeasible due to the essential nature of telomeric sequences. Knockdown approaches using siRNA and shRNA approaches have also failed to eliminate TERRA. Here we took an alternative approach and developed single-stranded antisense oligonucleotides (ASO) with locked nucleic acids (LNA) chemistry and a gapmer design to promote RNaseH-mediated degradation of TERRA RNA in vivo. Northern blot analysis showed that treatment of cells with 2 μM TERRA-specific ASO resulted in 95% depletion of TERRA transcripts after 1 hour, and ∼75% depletion after 6 hours (Fig. 2A). Longer depletions were more successful with higher concentrations of ASO (Fig. 2A). Regardless of conditions, RNA FISH indicated dramatic effects, as TERRA RNA foci disappeared nearly completely within 1 hour and the depletion lasted for at least 24 hours (Fig. 2B, S2A). Thus, gapmer ASOs are an effective means of depleting TERRA.
Figure 2. TERRA depletion results in dysregulation of gene expression at target sites.
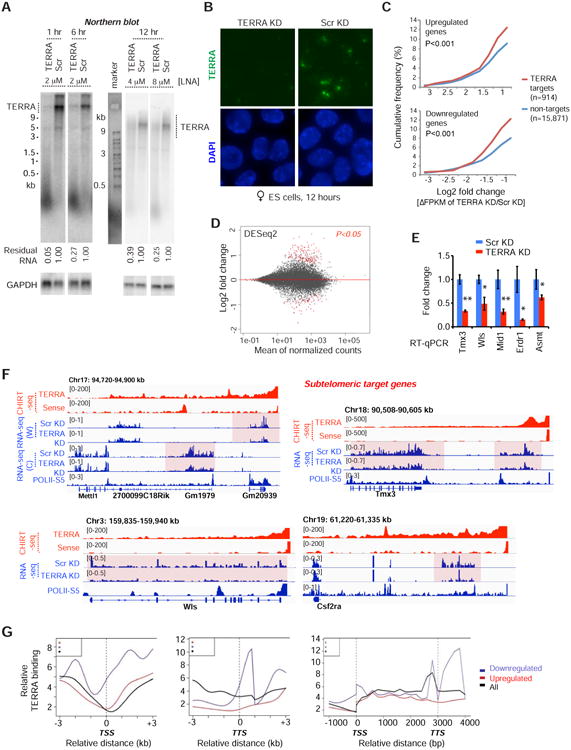
A. Northern blot analysis of TERRA RNA shows depletion by treatment with gapmer LNA at indicated time points and LNA concentrations in ES cells. Scr, scramble LNA control. GAPDH RNA is used as loading control and % remaining TERRA RNA is indicated.
B. RNA FISH confirming TERRA depletion after 12 hours of LNA treatment. Photos taken with the same exposure.
C. Cumulative frequency plots for up- and down-regulated genes, showing Log2 fold-changes (ΔFPKM) after TERRA KD for the 914 genes with or 15,871 genes without TERRA sites. P-values determined by 2-tailed Chi-square test with Yate's correction.
D. MA Bland–Altman plot to visualize RNA-seq data transformed onto the M (log2 fold-change) and A (mean average) scale. Log2 fold change represents TERRA KD vs Scr KD. Red dots, genes with significant change (P-adjust<0.05) using DESeq2 analysis.
E. RT-qPCR of sub-telomeric genes following TERRA KD. P-values (** <0.01; * <0.05) determined by the Student t-test. Error bars, S.D.
F. RNA-seq analysis. Examples of downregulated subtelomeric genes following TERRA KD. All CHIRT data are normalized to input. For all RNA-seq tracks, only the relevant strand is shown, with exception of Chr17 subtelomeric end where both are shown: W, Watson strand; C, Crick strand. RNA-seq coverage was normalized to total mapped fragments.
G. Average metasite (left, middle) and metagene (right) profiles for TERRA binding relative to the TSS, TTS, and gene body. Profiles shown for downregulated (blue), upregulated (red), and all (black) genes in TERRA KD.
Transcriptomic analysis at the 12-hour timepoint showed high reproducibility between two biological replicates (Fig. S2B). Cumulative distribution plots (CDP) demonstrated significant changes in expression of TERRA targets relative to non-targets after TERRA depletion (Fig. 2C, P<0.001), indicating that TERRA target genes were more likely to be affected by TERRA depletion. An MA plot showed significant changes in gene expression after TERRA depletion (Fig. 2D; Table S1). Interestingly, subtelomeric target genes were consistently downregulated, as shown by RT-qPCR (Fig. 2E) and RNA-seq (Fig. 2F; decreased read counts across gene bodies). Internal target genes could either be up- or down-regulated (Fig. S2C,D; Table S1). The sense LNA control yielded a distinct profile with little to no overlap (Fig. S2E,F), arguing against a nonspecific effect. Gene ontology (GO) analysis indicated that downregulated genes are highly associated with TOR signaling and transcriptional regulation (Fig. S3A), whereas upregulated genes are associated with heart development and telomere capping (Fig. S3B). There was an intersection of telomerase pathway genes with genes that were upregulated after TERRA depletion (Fig. S3C). Intriguingly, metasite and metagene profiles showed greatest TERRA binding densities over genes that were downregulated upon TERRA depletion (Fig. 2G). The analysis also revealed a propensity of TERRA RNA to bind genes near the transcription start site (TSS, promoter) and/or the transcription termination site (TTS). This finding was specific to the class of downregulated genes. Upregulated and unaffected genes did not exhibit this propensity. Together, these data demonstrate that TERRA RNA has a direct positive influence on expression of a subset of target genes.
The TERRA proteome
To understand how TERRA functions, we next sought to obtain a comprehensive TERRA protein interactome. Proteomic studies to date have largely isolated heterogeneous ribonucleoproteins (hnRNPs) and other general RNA-binding proteins (Ishikawa et al., 1993; de Silanes et al., 2010; Scheibe et al., 2013; Rippe and Luke, 2015). With one exception (Scheibe et al., 2013), the proteomic analyses have taken in vitro approaches. To take an in vivo approach, we used iDRiP (identification of direct RNA interacting proteins), which we recently developed to define the Xist proteome (Minajigi et al., 2015). After UV crosslinking of ES cells, TERRA-protein complexes were purified using TERRA-AS capture probes and washed under denaturing conditions to eliminate proteins that were not crosslinked to TERRA (Fig. 3A). Results of a multiplexed quantitative mass spectrometry (Ting et al., 2011) were then analyzed for enrichment over several negative control samples — those pulled down by TERRA-sense, luciferase (non-mammalian), and U1 (abundant RNA) capture probes (Fig. S4).
Figure 3. iDRiP-mass spectrometry analysis reveals an extensive TERRA proteome.

A. The iDRiP-MS approach to define the TERRA interactome.
B. TERRA-interacting proteins subclassified into functional groups.
C. Connectivity map for the TERRA interactome using IPA® software (QIAGEN). Solid lines, strong direct interactions. Dashed lines, no current evidence for direct interaction. Solid oval, TERRA interactors. Empty ovals, TERRA non-interactors.
D. GO analysis identified enriched pathways by DAVID bioinformatics resources. P values determined by Fisher Exact test. Benjamini FDR shown.
We averaged two biological replicates and uncovered 134 enriched proteins (>2 fold enrichment compared to luciferase control) belonging to several functional groups (Fig. 3B; Table S2): (i) Chromatin and transcription factors (e.g., EZH2, SMCHD1), (ii) proteins involved in alternative telomere lengthening (ALT), (iii) the shelterin complex, (iv) cell cycle regulators, (v) DNA replication proteins, and (vi) general RNA binding proteins and nuclear matrix factors. Their absence in the control TERRA-sense iDRiP and their substantial enrichment relative to the luciferase and U1 samples suggested a specific pulldown of TERRA-associated proteins (Fig. S4AC). Shelterin proteins, POT1 and TRF1, were ∼32-fold enriched over background; telomere function associated proteins, PAXIP1, RTEL1 were >16-fold enriched, as were associated CST complex and Cajal body proteins, CTC1, STN1, and COIL; and ALT pathway related proteins ATRX, PML and SMC6 were >4-fold enriched (Fig. S4C). All noted proteins were significantly enriched over the TERRA-sense pulldown, suggesting a direct association with TERRA RNA rather than telomeric repeat DNA. A subset of the iDRiP-identified factors had previously been shown to bind the telomere (e.g., shelterins, ALT proteins), but the relationship to TERRA RNA was not known (de Lange, 2009; Dejardin and Kingston, 2009; Deng et al., 2009; Grolimund et al., 2013). Thus, in addition to revealing known TERRA interactors, TRF1, POT1 (Deng et al., 2009), nuclear matrix factors, and general RNA binding proteins (Ishikawa et al., 1993; de Silanes et al., 2010; Scheibe et al., 2013; Rippe and Luke, 2015), iDRiP uncovered a wide variety of new TERRAbinding proteins.
To visualize interconnections in the TERRA proteome, we analyzed data from iDRiP-MS biological replicates in the context of protein interaction data deposited in public databases. The resulting connectivity map using the Ingenuity Pathway Analysis (Fig. 3C) fortified the deduced groupings, with telomere signaling, DNA repair proteins, and cell cycle/DNA replication factors identified as interaction hubs among the proteomic network for TERRA. Independent analysis using a Gene Ontology (GO) algorithm also revealed enrichment for factors involved in DNA replication, nucleic acid binding, telomere association, helicase activity, and methyltransferases (Fig. 3D). The deduced connectome suggests a key organizational role in chromatin regulation, telomere function, DNA replication, and the cell cycle.
Co-occupancy of ATRX and TERRA on chromatin targets
We asked if enriched interactors colocalize with TERRA RNA in vivo. We correlated our CHIRT data with ES cell ChIP data (Kagey et al., 2010; Law et al., 2010; Pinter et al., 2012; Sarma et al., 2014; Kung et al., 2015; Minajigi et al., 2015) by comparing coverage densities of various chromatin factors to the TERRA landscape (TERRA binding peak x=0, Fig. 4A). Intriguingly, ATRX density was highly correlated with TERRA binding, showing a stronger colocalization than any other chromatin mark. Because ATRX is known to aid deposition of H3K9me3 at telomeres (Clynes et al., 2015), we examined the H3K9me3 histone mark and found significant enrichment at telomeric heterochromatin. Furthermore, TERRA binding was strongly correlated with H3K27me3, the modification placed by EZH2, the catalytic subunit of Polycomb repressive complex 2 (PRC2), which is known to associate with ATRX (Sarma et al., 2014). On the other hand, TERRA was depleted of activate histone marks, including H3K4me3 and H3K36me3, as well as RNA Polymerase II, POL-II-S5. TERRA peaks were also depleted of CTCF and cohesins (SMC1 subunit), two factors associated with telomeric transcription (Deng et al., 2012). However, CTCF and cohesins were often found nearby (Fig. 4A, S5A). Proteomic data also showed that the cohesin release factor, WAPL, binds TERRA (Fig. 3B). The correlative plots held true when telomere-associated TERRA peaks were excluded from analysis (Fig. S5A). The only exception was the loss of the H3K9me3 peak, consistent with H3K9me3 being enriched in telomeric constitutive heterochromatin (rather than at genes).
Figure 4. TERRA and ATRX target a common set of genes and are functionally antagonistic.
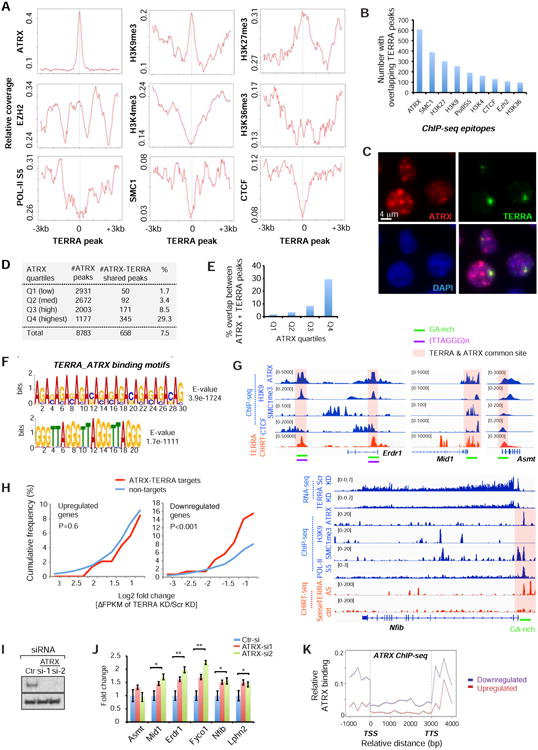
A. Metasite analysis: ChIP-seq coverage of indicated epitopes (y-axis) relative to the averaged genomic TERRA-binding site (x=0).
B. Number of ChIP-seq enriched regions (of indicated epitopes) with an overlapping TERRA peak.
C. Immuno-RNA FISH performed with anti-ATRX antibodies (red) and TERRA-specific probes (green) reveals colocalization of TERRA with a subset of ATRX domains.
D. ATRX chromatin targets in ES cells (ChIP-seq) are divided into four quartiles on the basis of coverage densities (Q4 highest). The number of ATRX peaks and those shared with TERRA are shown, along with the % ATRX peaks shared with TERRA peaks.
E. Percentage of ATRX peaks shared with TERRA is shown for each ATRX quartile.
F. De novo motif analysis using MEME reveals two dominant motifs for TERRA-ATRX target sites. E-values indicate how well each occurrence matches motif.
G. Genome browser shots of TERRA CHIRT-seq and ChIP-seq data for TERRA-ATRX target genes. RNA-seq shows downregulation of Nfib after TERRA depletion.
H. TERRA depletion decreases expression of ATRX-TERRA target genes. Cumulative frequency plots of Log2 fold-changes (ΔFPKM) for upregulated (Log2>0.75) and downregulated (Log2<- 0.75) genes after TERRA KD. Profiles for shared ATRX-TERRA targets versus non-targets are graphed. P-values determined by two-tailed Chi-squared test.
I. Western analysis of ATRX protein after ATRX knockdown (KD) by two gene-specific siRNAs. No protein is detectable after KD.
J. ATRX depletion increases expression of ATRX-TERRA target genes. RT-qPCR assay shows fold changes in expression of indicated genes in ES cells after 48 h. ATRX siRNA knockdown. Results from several biological replicates. **, P<0.01; *, P<0.05 two-tailed student t-test. Error bars, S.D.
K. Metagene analysis of ATRX binding. Profiles for genes that are upregulated (red) or downregulated (blue) after TERRA depletion are graphed separately.
Because ATRX stood out (Fig. 4A,B; S5A), we focused analysis on TERRA-ATRX interactions. Immuno-RNA FISH showed that prominent TERRA foci colocalized with a subset of ATRX foci (64%, n=208; Fig. 4C). To ask if TERRA shared a DNA binding motif with ATRX, we divided ATRX binding sites into quartiles by coverage densities (low, medium, high, and highest). Intriguingly, ∼30% of ATRX sites in the highest quartile (Q4) showed co-occupancy with TERRA RNA (Fig. 4D,E). The majority of overlapping sites occurred within repetitive sequences. De novo motif analysis using MEME uncovered several common, highly enriched DNA motifs (Fig. 4F). The strongest motifs were the (GA)n repeat (E-value 3.9e-1724) and the telomeric repeat including (TTAGGG)n and (CCCTAA)n (E-value 1.7e-1111), examples of which are shown in the colocalized ATRX and TERRA peaks within Erdr1, Mid1, and Asmt (Fig. 4G). Thus, TERRA occupies chromatin sites with highest ATRX density and shares binding motifs with its protein partner, ATRX.
Functional antagonism between TERRA and ATRX
Given that ATRX is a chromatin remodeler that regulates gene expression (Clynes et al., 2015), we asked whether TERRA modulates gene expression through interaction with ATRX. For the subset of genes targeted by both TERRA and ATRX, there was a significant net downregulation of gene expression after TERRA depletion (Fig. 4H, S5B,C). At Nfib, for example, TERRA RNA and ATRX bound the promoter within a GA-rich motif, and TERRA depletion resulted in reduced expression (Fig. 4G), indicating that TERRA binding has a positive influence on Nfib expression. Likewise, TERRA depletion resulted in downregulation of the ATRX-TERRA target genes, Erdr1, Mid1, Asmt, Fyco1 and Lphn2, all of which harbor ATRX-TERRA motifs (Fig. 4G, S5B). These data support a general expression-promoting role for TERRA RNA at TERRA-ATRX target genes. On the other hand, knocking down ATRX protein using two different siRNAs (Fig. 4I) resulted in the opposite effect — a significant upregulation of Mid1, Erdr1, Fyco1, Lphn2 and Nfib (Fig. 4J). Thus, TERRA and ATRX have opposite effects at shared target genes, with TERRA promoting gene expression and ATRX suppressing it. Supporting this, metagene analysis showed that downregulated genes have significantly higher ATRX binding near the TSS (Fig. 4K). This trend was not observed for other epitopes, including H3K4me3 and CTCF (Fig. S6). We conclude that, at shared genomic targets, TERRA and ATRX are functionally antagonistic.
TERRA binds ATRX directly and antagonizes localization of ATRX to the telomere
To determine if TERRA and ATRX directly interact, we performed electrophoretic mobility shift assays (EMSA) in vitro with purified recombinant ATRX protein and an 83-nt invitro synthesized TERRA RNA probe. ATRX protein shifted the TERRA transcript (Fig. 5A), indicating that the protein directly binds TERRA RNA. It also shifted a 30-nt TERRA RNA probe, but to a lesser degree. By contrast, ATRX did not shift negative controls, U1 splicing RNA (83 nt) and P4P6 ribozyme RNA (156 nt) from Tetrahymena. In addition, ATRX's interaction with TERRA RNA could not be competed away by single- or double-stranded DNA (ssDNA, dsDNA) of telomeric repeat sequence (Fig. 5B, S7A). On the other hand, TERRA RNA effectively competed away ATRX-DNA complexes (Fig. 5C). These data indicate that ATRX forms a more stable complex with TERRA RNA than it does with telomeric DNA. We conclude that TERRA directly and strongly binds ATRX and this interaction can antagonize ATRX-DNA interactions.
Figure 5. TERRA competes with telomeric DNA for ATRX binding and regulates ATRX distribution.
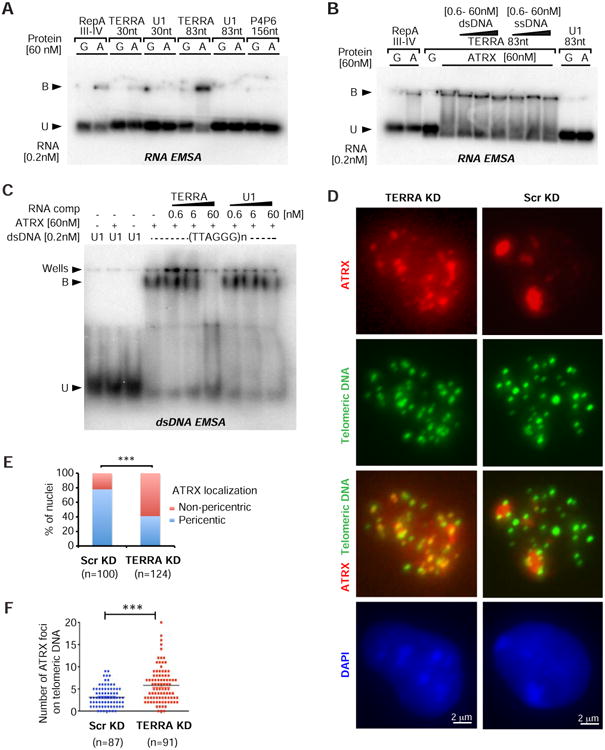
A. TERRA binds to ATRX in vitro. RNA EMSA with 0.2 nM RNA probes from indicated transcripts (top) and 60nM GST (G, control) or ATRX (A) protein. Bound probe (shifted), B. Unbound, U. RepA derived form Xist RNA as a positive control for ATRX binding. U1 RNA and P4P6 are negative controls.
B. Competition assay: TERRA RNA shifted by ATRX cannot be competed away by increasing concentrations (0.6, 6, 60nM) of dsDNA (80bp) or ssDNA (80nt) of corresponding TERRA sequence (83nt). RNA EMSA as described in (A).
C. TERRA RNA competes away the telomeric dsDNA shifted by ATRX. EMSA with double-stranded U1 or (TTAGGG)n telomeric sequence (80bp), in the presence of TERRA or U1 RNA competitor (comp), as indicated.
D. TERRA depletion (6hr knockdown) causes ATRX dispersal from pericentric heterochromatin and relocalization to telomeres in ES cells. Immuno-DNA-FISH staining for ATRX and telomeric DNA reveals large ATRX foci (red) on pericentric heterochromatin (dense DAPI staining) in control cells. TERRA depletion cells show dispersed ATRX signals that coincide with telomeric DNA (green). Asterisks are ATRX foci at pericentric heterochromatin. Arrowheads are ATRX foci at telomeres.
E. The nucleus with intensive ATRX foci on pericentric chromatin was counted in panel (D). P value (***<0.001) was determined by Fisher exact test. N, sample size.
F. Dot plot representative of two biological replicates shows the number of ATRX foci on telomeric DNA counted in each nucleus in panel (D). P value (***<0.001) was determined by student's t-test. N, sample size.
Because TERRA can compete away ATRX-telomeric DNA interactions, we tested whether TERRA may regulate ATRX binding to telomeres in vivo. We combined ATRX immunostaining and telomeric DNA FISH after TERRA depletion for 6 hours in ES cells. Control cells displayed prominent ATRX foci on DAPI-dense pericentric heterochromatin (Fig. 5D,E; S7B; asterisks). When depleted of TERRA, cells exhibited dispersed ATRX signals (Fig. 5D,E). ATRX appeared to relocate to telomeres, as shown by coincident signals with telomeric DNA probes (Fig. 5D, arrowheads). The number of ATRX foci found at telomeric DNA significantly increased after TERRA depletion (Fig. 5F; P<0.001). These data demonstrate that TERRA plays a role in the localization dynamics of ATRX. Specifically, TERRA antagonizes the binding of ATRX to telomeric DNA. Thus, TERRA regulates ATRX localization to telomeres by competing with telomeric DNA for ATRX binding.
TERRA regulates telomerase activity and maintains telomere integrity
Our data collectively hint at specific roles for TERRA in telomere function. Interestingly, RNA-seq and RT-qPCR revealed a 2-fold increase in expression of the telomerase RNA component, Terc (Webb and Zakian, 2016), in TERRA-depleted ES cells (Fig. 6A,B). Because previous in vitro studies had shown that TERRA can bind telomerase reverse transcriptase (TERT) and base-pair with Terc telomerase RNA (Redon et al., 2010), we tested whether TERRA can interact with Terc in vivo by asking if Terc RNA copurified with TERRA in UV-crosslinked samples. Indeed, we observed enriched pulldown of Terc RNA using TERRA-antisense probes. Enrichment was not seen with TERRA-sense probes, or with other negative control probes such as luciferase and U1 (Fig. 6C). RNA immunoFISH also showed that 57% of Terc foci colocalized with TERRA foci (66/116; Fig. 6D). Although we cannot determine if direct basepairing is involved, these data argue that TERRA occurs in a complex with Terc in vivo.
Figure 6. TERRA associates with Terc and inhibits telomerase activity in ES cells.
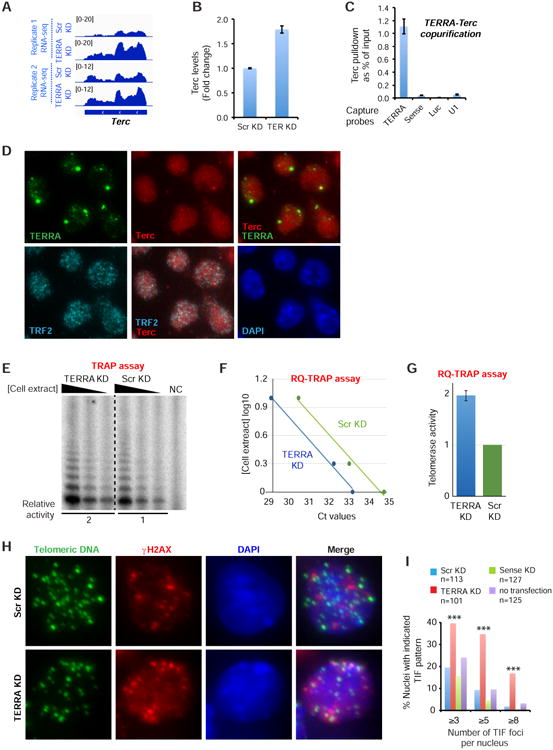
A. RNA-seq of two biological replicates shows that Terc is upregulated after TERRA knockdown for 12 hours in ES cells.
B. RT-qPCR assay confirms that telomerase RNA is upregulated after TERRA knockdown for 12 hours in ES cells. Error bars, S.D.
C. TERRA is associated with Terc in vivo. RT-qPCR for Terc after TERRA capture from UV-cross-linked cell extracts. Control probes for RNA capture: sense, luciferase and U1. Error bars, S.D.
D. RNA immunoFISH shows that 57% of Terc RNA localized with TERRA RNA (n=116). Terc also partially colocalized with TRF2 protein, which identifies all telomeric ends.
E. Representative TRAP assay validating the increase in telomerase activity upon TERRA knockdown. Three dilutions of the cellular extract are shown. Relative telomerase activity was calculated from the three dilutions. NC: negative control lacking cell extract. An equivalent amount of total cellular protein was used for each sample.
F. Linear regression of Ct values and cell extract concentration is shown. Each value represents the average from two biological replicates.
G. Relative telomerase activity upon TERRA knockdown (8 hours) determined by RQ-TRAP in ES cells. Values were calculated from two independent biological replicates and three dilutions of each extract shown in (E). S.E. is indicated (n=6). Values are normalized to total cellular protein.
H. Immuno-DNA FISH performed with anti-γH2AX antibodies (red) and telomeric DNA probes (green) shows increased TIF formation in ES cells after TERRA depletion. Arrowheads, TIFs. N, sample size.
I. Bar graph showing the number of TIFs with indicated pattern in ES cells following Scr, Sense or TERRA LNA KD. P values (***<0.001) determined by Fisher Exact test comparing the numbers of nuclei with ≥3, ≥5, and ≥8 TIFs between Scr KD and TERRA KD. n, sample size.
It has also been hypothesized that TERRA in regulates telomerase in yeast (Pfeiffer and Lingner, 2012; Moravec et al., 2016). To determine whether TERRA affects telomerase activity in mammalian cells as well, we performed the Telomeric Repeat Amplification Protocol (TRAP) to quantitate telomerase activity in TERRA-depleted ES cells. After 8 hours of TERRA knockdown, we observed a 2-fold upregulation of telomerase activity using both the radio-labelled method (Fig. 6E) and the RQ-TRAP assay (Fig. 6F,G). Thus, TERRA negatively regulates telomerase activity in vivo.
Given these effects, we surmised that TERRA depletion would cause telomere dysfunction. After treating with TERRA-specific LNAs, we looked for formation of telomere-induced DNA damage foci (TIF), which typically occur after induction of the DNA damage response at dysfunctional telomeres (Doksani and de Lange, 2014). Significantly, γH2AX foci accumulated at multiple telomeres in TERRA-depleted ES cells (Fig. 6H; arrowheads), consistent with a previous study (Deng et al., 2009). There was a dramatic, significant increase in the number of nuclei with ≥3, ≥5, and ≥8 TIFs (Fig. 6I). In Scr and sense LNA controls, TIFs were observed no more frequently than in untransfected cells (Fig. 6I). Increased TIF in TERRA-depleted cells suggests a role in maintaining telomeric integrity.
This idea was supported by observed defects in the capping function. With telomere-specific probes, DNA FISH analysis of metaphase spreads revealed loss of telomeric integrity after 24 hour TERRA knockdown, in comparison to knockdown using control scrambled or sense LNA (Fig. 7A-C). Loss of integrity was manifested by significantly increased occurrence of multiple telomeric pathologies (Fig. 7A-D): (i) Loss of the (TTAGGG)n telomeric repeat sequence (arrows) on both sister chromatids or just on one sister chromatid (“heterogeneous”); (ii) duplications of telomeric repeats at chromosomal ends (asterisks); (iii) insertions of telomeric repeats within internal chromosomal regions (asterisks); and (iv) occasional fusions between sister chromatid telomeres that would create a “ring” structure (“R”). Similar results were obtained when DNA FISH was performed with telomeric probes of either strand — C-rich (Fig. 7B) versus G-rich (Fig. 7C) PNA probes. These pathologies were observed only with TERRA-specific LNA, not with sense LNA, indicating an effect of perturbing TERRA RNA, rather than an effect of LNA binding telomeric DNA. Together, these data point to an essential nature of TERRA in the telomeric capping function and in promoting chromosomal end stability.
Figure 7. TERRA maintains telomere integrity in ES cells.
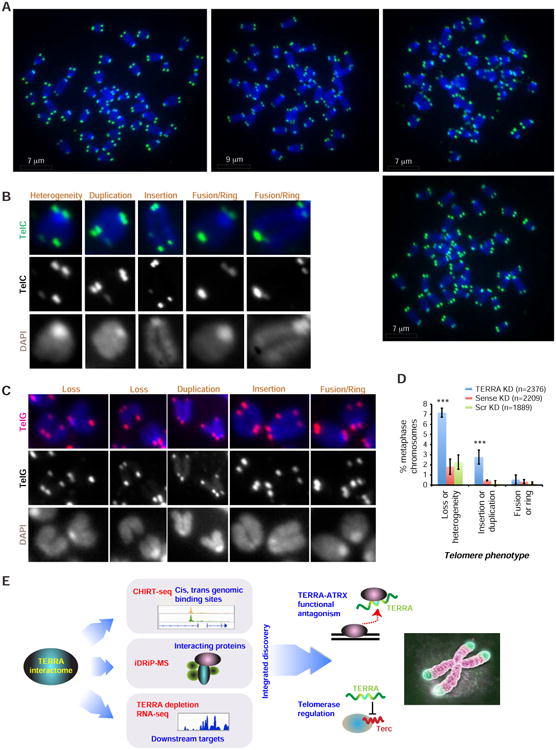
A. DNA FISH analysis using telomeric repeat probes of ES cell metaphase spreads. Telomeric DNA, green. Metaphase chromosomes, blue. A single cell is shown in each panel. ES cells were harvested after 24-hr knockdown with TERRA LNA versus control (Scr and sense) LNAs. Arrows, loss of telomeric cap on one (heterogeneous) or both sister chromatids. Asterisks, insertion or duplication. R, ring or fused telomeres.
B. Magnified examples of each aberrant telomere phenotype. DNA FISH performed using C-rich telomeric PNA probes (TelC). Black and white images shown for the TelC and DAPI signals are merged in the color image.
C. Magnified examples of each aberrant telomere phenotype. DNA FISH performed using G-rich telomeric PNA probes (TelG). Black and white images shown for the TelG and DAPI signals are merged in the color image.
D. Quantitation of each telomeric pathology. Two biological replicates of each knockdown were averaged. Error bars are S.D. ***, P< 0.001, compared to Scr KD. P values determined by twotailed Chi-square analysis. Number of counted chromosomes is indicated.
E. Summary: The TERRA interactome revealed by combining CHIRT, iDRiP, and LNA-mediated knockdown enabled determination of TERRA function. TERRA plays a critical role in telomere function by antagonizing ATRX, controlling telomerase activity, and maintaining telomeric integrity. Chromosome image adapted from http://med.stanford.edu/content/dam/smnews/images/2015/01/telomeres.jpg.
Discussion
Here we have integrated genomic, proteomic, biochemical, and cytological approaches to advance understanding of TERRA biology. In the mouse ES cell genome, we identified thousands of cis and trans chromatin binding sites and deduced consensus motifs from the binding sites [e.g., (GA)n, (TTAGGG)n, and (CCCTAA)n]. Using a TERRA-specific ASO of defined sequence and composition, we efficiently depleted TERRA RNA and reported effects both in cis at telomeres (where it is produced) and in trans at distant genes. Loss of TERRA results in dysregulation of both subtelomeric genes and internal target genes. Subtelomeric genes appeared to be especially susceptible to TERRA depletion and become downregulated when TERRA is depleted. We have also discovered a large network of TERRA-associated proteins, including epigenetic complexes, telomeric factors, DNA replication proteins, and cell cycle regulators. Among them, ATRX stood out as a major interacting protein partner.
Using orthogonal approaches, we learned that TERRA and ATRX are functionally antagonistic, both at telomeric (cis) and non-telomeric (trans) sites. Non-telomeric targets comprise a major subclass of TERRA binding sites. When ATRX shares such target genes, ATRX and TERRA are colocalized therein, but exert opposite effects on gene expression: Whereas TERRA promotes gene expression, ATRX suppresses it (Fig. 4). When TERRA and ATRX do not occur together, TERRA and ATRX could each be either activating or repressive in a manner that likely depends on context-specific interacting partners.
An antagonistic relationship was also apparent at telomeres. TERRA directly binds ATRX and displaces ATRX from telomeric DNA, as evidenced by biochemical analysis using purified factors (Fig. 5A-C). In vivo, TERRA also regulates ATRX association with telomeric chromatin, as with a deficiency of TERRA causes increased ATRX localization to telomeres (Fig. 5D-F). We also found that TERRA regulates telomerase activity (Fig. 6E-G). TERRA and Terc RNAs associated with each other in vivo and could be pulled down together from UV-crosslinked cell lysates (Fig. 6C). This interaction could occur via direct complementarity between TERRA's repeats [5′- (UUAGGG)n-3′] and the Terc RNA sequence [3′-CAAUCCCAAUC-5′], as suggested previously (Redon et al., 2010); alternatively, TERRA and Terc may simply coexist within a larger complex. Cytological evidence indicated that they do colocalize in vivo (Fig. 6D). We also observed that, although the Terc locus is not a direct TERRA target, Terc RNA levels increase 2-fold in TERRAdepleted cells (Fig. 6A,B), indicating that telomerase activity is indeed inhibited by TERRA in vivo. This is consistent with prior observations made biochemically in vitro (Schoeftner and Blasco, 2008; Redon et al., 2010; Moravec et al., 2016). ES cells naturally express high levels of TERRA, consistent with their long telomeres and a need to regulate telomere length. TERRA is known to be regulated in a cell-cycle-dependent manner (Porro et al., 2010), with low levels in late S phase when telomere replication and telomerase recruitment occur (Wellinger et al., 1993; Schmidt et al., 2016). On the other hand, evidence has also shown that TERRA is involved in telomerase recruitment to telomeres and promotes telomere lengthening in yeast (Moravec et al., 2016). Though seemingly contradictory, TERRA mediated-telomerase inhibition and recruitment are not mutually exclusive. TERRA is bound by additional proteins in vivo and its activity could depend on the exact composition of interactors. A fine balance between Terc and TERRA RNA levels could be vital to telomerase regulation, with an imbalance resulting in telomere instability.
Indeed, TERRA appears to be essential for telomere end protection. Increased telomere dysfunction was observed by TIF assays in ES cells depleted of TERRA (Fig. 6H,I)(Deng et al., 2009; de Silanes et al., 2014). Furthermore, various telomeric pathologies were also manifested on metaphase chromosomes after TERRA depletion, including loss of (TTAGGG)n sequences from chromosomal ends, insertions and duplications of (TTAGGG)n within internal chromosomal regions, and telomeric fusions that form ring-like chromosomal structures (Fig. 7). A caveat of note is that telomeres typically have a ∼200-base 3′ single-strand overhang, on the same G-rich strand as TERRA. Our gapmer ASO could therefore target either TERRA or the DNA overhang, and exert the observed effects via either or both, in principle. It is currently not possible to distinguish between these possibilities. However, our sense ASO/LNA control targeted the C-rich strand of telomeric DNA, not TERRA RNA. The C-rich strand may partially exist in single-stranded form due to engagement in a D-/T-loop with the G-rich strand. Given that the sense LNA did not cause increased TIF formation (Fig. 6H,I) nor metaphase chromosome pathology (Fig. 7), we favor the idea that the observed effects are at least partially due to depleting TERRA RNA.
In support of TERRA's end-protection function is the proposed antagonistic relationship between TERRA and ATRX (Fig. 3-5). ATRX has been known to play a key role in telomere biology (Lovejoy et al., 2012; Doksani and de Lange, 2014). We now know that TERRA and ATRX directly interact (Fig. 5). In the context of telomere protection, the antagonistic ATRX-TERRA relationship is especially notable. ATRX suppresses the ALT pathway that is activated in many cancers to promote telomere lengthening in the absence of telomerase (Lovejoy et al., 2012; Doksani and de Lange, 2014). In tumors lacking telomerase and ATRX function, elongated telomeres are associated with increased TERRA expression (Barthel et al., 2017). We propose that TERRA may be repressing both telomerase expression and ATRX function in these contexts. Thus, apart from protecting chromosomal ends in normal cells, TERRA expression may promote ALT in cancer cells by specifically suppressing ATRX and telomerase. Consistent with this idea, our proteomic analysis identified many other proteins in the ALT pathway, including PML, BLOOM, and SMC5/6. In the future, the data-rich resources provided by CHIRT and iDRiP can be used to extend analysis of TERRA function in the context of its chromatin and protein interaction networks.
Star Methods
Contact for Reagent and Resource Sharing
Further information and requests for reagents will be directed to the corresponding author Jeannie T. Lee (lee@molbio.mgh.harvard.edu).
Experimental Model and Subject Details
Mouse embryonic stem cells were cultured in regular ES medium (500 ml DMEM with addition of 1 ml of ß-mercaptoethanol, 6 ml of MEM NEAA, 25 ml of 7.5% NaHCO3, 6 ml of GlutaMAX-1, 15 ml of 1M HEPES, 90 ml of FBS, 300 μl of LIF, 6 ml of PEN/STREP) with feeders.
Method Details
FISH
Cells were cytospun onto glass slides and permeabilized with CSK buffer containing 0.5% Triton X-100, and fixed in 4 % paraformaldehyde. DNA oligos probes for RNA FISH were ordered from Integrated DNA Technologies. For TERRA: (TAACCC)7-Alexa488-3′. DNA oligo probes for RNA-FISH were mixed at the final concentration 0.5 pmol/μl in hybridization solution (50% formamide, 2×SSC, 2 mg/ml BSA, 10% Dextran Sulfate-500K). Hybridization was carried out at 42°C overnight for RNA FISH. Slides were washed with 2×SSC/50% formamide for 5 min three times at 44°C, and then wash with 2×SSC for 5 min twice at 44°C.
CHIRT-seq
Since TERRA transcripts contain repetitive sequences and have different subtelomeric sequences, it is impractical to use tiling probes to capture TERRA RNA. Thus, we developed CHIRT-seq protocol to specifically capture TERRA RNA with one single oligo probe that targets telomeric repeat sequence. This protocol also has an advantage for mapping the binding sites of other repetitive RNAs or short RNAs on the genome.
The TERRA CHIRT protocol includes specific features that differ from the original ChIRP and CHART protocols (Chu et al., 2011; Simon et al., 2011) as following. (i) We used only one probe to capture RNAs and it reduced the chance of off-target effects compared to using multiple probes. (ii) We decreased the shearing intensity to preserve integrity of long noncoding RNAs. (iii) We increased the specificity of RNA-mediated capture by improving the elution steps. Because we observed that RNaseH is not active in SDS buffer, we used NP40 instead of SDS or N-lauroyl sarcosine in the final DNA elution to better preserve RNaseH activity. (iiii) We included the spike-in control DNA before library construction, and it allowed a proper normalization between samples. In this way, we can compare the enrichment on the repetitive sequence regions, or on whole genomic coverage from different cellular conditions.
Specifically, mouse ES cells were grown to 80% confluency and feeder cells were removed. 15 millions of cells were spun down and washed with PBS once. Cells were resuspended in 10 ml of PBS and then another 10 ml of 2% of glutaraldehyde were added to fix cells at room temperature for 10 min. Crosslinking was then quenched with 0.125 M glycine for 5 min. Followed by two washes with cold PBS, cell pellets were immediately frozen in liquid nitrogen and stored at -80°C. Cells were thawed out on ice, and were resuspened in 1 ml of swelling buffer (0.1 M Tris pH 7.0 10 mM KOAc, 15 mM MgOAc, 1% NP40, 1mM DTT, 1mM PMSF, 100 U/ml Superase-In[Ambion]) for 10 min on ice. Cells were then dounced and pelleted at 2500 g for 5 min. Nuclei was further lyzed in nuclear lysis buffer (50 mM Tris pH7.0, 10 mM EDTA, 1 % SDS, 1mM DTT, 1mM PMSF, protease inhibitor, 100 U/ml Superase-In) on ice for 10 min, and sonicated using Bioruptor until DNA size 0.5-3 kb (it usually takes 1.5 hr and depends on the cell numbers). Cell lysates were then spun down at 13,000 rpm for 5 min to remove insoluble debris. Cell lysates were then frozen in liquid nitrogen and stored in -80°C. Streptavidin- magnetic C1 (Thermo Fisher) beads were blocked with 500 ng/ul yeast total RNA, and 1mg/ml BSA for 1 hr at 37°C, and respuspended in 1× hybridization buffer (1 volume of lysis buffer plus 2 volume of 2× hybridization buffer). Cell lysates were diluted in two times volume of 2× hybridization buffer (750 mM NaCl, 1% SDS, 50 mM Tris pH 7.0, 1 mM EDTA, 15% Formamide, 1 mM DTT, PMSF, protease inhibitor, and 100 U/ml Superase-in), and were precleaned with Streptavidin- magnetic C1 beads at 37°C for 1 hr (100 μl of beads for 1 ml lysates). Precleaned lysates were incubated with probes (100 pmol for 3 ml of diluted cell lysates) at 37°C for 3 hr. Three hundred microliters washed/blocked C1 beads were added per 100 pmol of probes, and the whole reaction was mixed for another 1 hr at 37°C. DNA probes for CHIRT were ordered from Integrated DNA Technologies and labeled with 3′ biotin-TEG. Beads:biotin-probes:RNA:chromatin adducts were washed five times at 37°C for 5 min with wash buffer (2× SSC, 0.5% SDS, 1 mM DTT, 1 mM PMSF), and then washed twice for 5 min at room temperature with 0.1% NP40 buffer (150 mM NaCl, 50 mM Tris pH8.0, 3 mM MgCl2, 10 mM DTT, 0.1% NP40). DNA was then eluted twice for 20 min in 450 μl of 0.1% NP40 buffer with 200 U/ml RNaseH (NEB) at room temperature. DNA for no RNaseH controls was eluted in 0.1% NP40 buffer without RNaseH. Eluted DNA was treated with RNaseA (1 mg/ml) at 37°C for 1 hr, and then was treated with proteinase K (1 mg/ml) and supplied addition of SDS to 0.5% at final concentration at 55°C for 16 hr. DNA was extracted with phenol/chloroform using phase lock gel tubes. For pre-RNaseA treatment control, cell lysates were treated with RNaseA at 37°C overnight before hybridization. For RNA elution after hybridization, beads:biotinprobes: RNA:chromatin adducts were washed 5 time in wash buffer, then treated with proteinase K in PK buffer (100 mM NaCl, Tris pH 7.0, 1 mM EDTA, 0.5% SDS) at 55°C for 30 min. Beads-suspension was boiled at 90°C for 5 min, and then RNA was extracted using TRIzol (ThermoFisher).
TERRA CHIRT-seq analysis
PicoGreen (ThermoFisher) was used to estimate the concentration of eluted DNA. Before library construction, equal amount of lambda DNA (0.015 pg of PCR products, ∼250bp) was added as spike-in control into eluted DNA samples. Lambda DNA PCR products were used as spike-in control. Following the removal of adaptor sequences and PCR duplicates, paired-end 50 bp sequencing data was aligned to mouse reference genome (GRCm38/mm10 and NCBI37/mm9) using the software Novoalign (v3.00.02) (http://www.novocraft.com/products/novoalign/). The coverage files were generated using R software library SPP software (Kharchenko et al., 2008) with smoothing using 500 bp bins with a 100 bp step size to generate control-subtracted, normalized read densities. Controls include input, sense-CHIRT, and TERRA-CHIRT without RNaseH elution (no RNaseH). These data were visualized using IGV software to display all tracks with a mean windowing function and scales indicated in each figure. Other methods to generate normalized coverage files, including the generation of conservative enrichment and maximum likelihood estimates, resulted in similar distribution patterns. Scatter plots for correlation analysis used input-normalized coverage produced by SPP, windowed by 3 kb bins and filtered out unenriched bins with an averaged density smaller than 4. Peaks were called by MACS (1.4.2)(Zhang et al., 2008) software using normalization to indicated controls (e.g., input, sense, no RNaseH or pre-RNaseA), and filtered by 10 fold enrichment and the length greater than 1kb as shown in Fig. 1E. Metagene profiles were produced by software CEAS (0.9.9.7) (Shin et al., 2009) using 2 fold enriched over input wig files and bed files produced by MACS peak calling. For comparison to TERRA KD RNA-seq data, plus-peaks genes flanking +/- 10kb with TERRA peaks (20 fold enriched from MACS peak calling) were selected, and minus-peaks genes (non-targets) were the rest of genes.
ChIP-seq analysis
For comparison to other ChIP-seq data sets, we analyzed published datasets: ATRX (GSM551138)(Law et al., 2010), CTCF (GSM1540992)(Kung et al., 2015), Ezh2 (GSM905437)(Pinter et al., 2012), PolIIS5 (GSM905442)(Pinter et al., 2012), H3K4me3 (GSM905439)(Pinter et al., 2012), H3K9me3 (GSM1531184)(Fei et al., 2015), H3K27me3 (GSM905438)(Pinter et al., 2012), SMC1 (GSM560341)(Kagey et al., 2010) and H3K36me3 (GSM905441)(Pinter et al., 2012). Fastq files were aligned to the mm10 genome using Bowtie2 (-k 1 –very-sensitive –no-disordant) (Langmead and Salzberg, 2012). Peak calling software Macs2 (version 1.4.2 20120305 or greater, with either –BAMPE or –BAM option) was used to select peaks with p=0.05 or less. Peaks from the resultant xls files were converted to wiggle format (MARK.WIG) with peak amplitude set to 1 giving each called nucleotide an equal weight. Metagene analysis around TERRA CHIRT peaks was determined using software CEAS (sitepro 0.6.6 (package version 1.0.2)) (Shin et al., 2009) with arguments (-w MARK.WIG -b TER_PEAKS.bed --span=3000) for each mark. TER_PEAKS.bed included macs2 selected TERRA peaks with p-value <= 0.05 and FDR <= 0.05 aligned to mm10. Bed region intersect was used to obtain counts for intersecting peaks between TERRA peaks and the above marks, converted from Mac2 XLS format to BED format with PCR dups removed. Intersection is done using bedtools intersect (Quinlan and Hall, 2010) (version 2.15.0, parameters -wb -f 0.5 -a MARK.bed - b TER_PEAKS.bed) and intersecting regions dups removed and counted.
TERRA knockdown
Mouse ES cells (female, 16.7, cas/mus hybrid) were grown to 70% confluency, and then trypsinized, and feeder cells were removed. A total of 2 × 10⁶ ES cells were transfected with LNA gapmer oligos at a concentration of 2∼8 μM in 100 μl nucleofector solution using A30 program (nucleofector kits, Lonza). A total of 2 ml of feeders-conditional medium (medium from feeders grown in mES medium for 6-18 hr) was added to the cells, and the cells were plated on gelatinized plates. TERRA and Sense LNA gapmers were designed and synthesized by Exiqon (www.exiqon.com) with modified LNA bases and phosphothiolated backbone modification.
RNA-seq analysis
Cells were all tested and confirmed that they were free from mycoplasma contamination. Total RNA was isolated using TRIzol (ThermoFisher), depleted of DNA by DNase treatment (TURBO DNase, Ambion), depleted of ribosomal RNA (Ribominus Eukaryote Kit v2, ThermoFisher), purified greater than 200 nucleotides using mirVana RNA extraction kit (ThermoFisher), and fragmented in first strand synthesis buffer (NEB) containing magnesium at 95 °C for 10 min to a median size 150-200 bp. cDNA was reversed transcribed with random primers (with Actinomycin D) using Superscript III (ThermoFisher) at 50°C for 30 min. The following steps such as second strand synthesis, end repair, dA-tailing, adaptor ligation, USER enzyme digestion, double size selection (0.6×-1.2× AMpure XP beads), and library amplification were performed according to NEBUltra Directional RNA library preparation protocol for Illumina (NEB). Sequencing of purified libraries was carried out on an Illumina HiSeq instrument for paired 50 nucleotides reads. After removal of adaptor sequences by Trim Galore, reads were aligned to mouse genomes (GRCm38/mm10 and NCBI37/mm9) using Tophat2 (Kim et al., 2013). After removal of PCR duplicates, data was analyzed using Cuffdiff 2 (Trapnell et al., 2013). Differential expression was presented as delta FPKM (fragments per kilobase million of exon per million fragment mapped) values comparing TERRA and Scr LNA knockdown samples using Cuffdiff 2. Two biological replicates were analyzed. Coverage of RNA-seq was normalized by per million mapped reads as FPM value shown in the tracks. For DESeq2 analysis (Love et al., 2014), raw counts were generated by HTSeq (Anders et al., 2015), and the significantly differentially expressed genes were identified by P-adj values < 0.05.
Northern blotting analysis
All oligo probes were end labeled using T4 polynucleotide kinase. Total RNA was extracted using TRIzol followed by acid phenol extraction. Total RNA (5 μg) was loaded in each lane. Hybridization was carried out at 42°C overnight using ULTRAhyb-Oligo hybridization buffer (ThermoFisher).
Quantitative RT-PCR
Total RNA was isolated using TRIzol (ThermoFisher), treated with TURBO DNase (ThermoFisher), and reverse-transcribed with random primers using Superscript III reverse transcriptase (ThermoFisher). RT-qPCR was perform using iQ SYBR Green Supermix (Bio-Rad). Expression levels were normalized to GAPDH levels.
iDRiP
The iDRiP technology provides a simple and high specificity way to investigate the direct RNA-protein interaction in vivo, and will be beneficial for the investigation of the RNA-protein interactome for almost any types of RNAs including repetitive RNAs or short RNAs. Compare to other RNA capture proteomic analysis (Chu et al., 2011), we reduced the background of DNA-mediated protein interaction by applying the additional DNase treatment on the wash steps. We also included more controls such as sense probe, U1 and luciferase for proper normalization of quantitative proteomics. TERRA iDRiP protocol improved the signal-to-noise ratio by optimization of hybridization and washing condition compared to the original iDRiP method (Minajigi et al., 2015).
After removing feeders, mouse embryonic stem cells (15×107 cells) were irradiated with UV light at 400 mJ energy (Stratagene 2400) in cold PBS, cells were treated with CSKT-0.5% (10 mM PIPES, pH 6.8, 100 mM NaCl, 3 mM MgCl2, 0.3 M sucrose, 0.5% Triton X-100, 1 mM PMSF) for 10 min at 4°C followed by a spin. Snap freezing cells could be stored at -80°C. Crosslinked cells were resuspended in 3 ml of DNase I digestion buffer (50 mM Tris pH 7.5, 0.5% Nonidet-P 40, 0.1% sodium lauroyl sarcosine, 1× protease inhibitors, SuperaseIn, 600U DNase I, 10 mM vanadyl ribonucleoside complex). The tubes were incubate at 37°C water bath for 15 min with rotations. The nuclear lysates were further supplied to the final concentrations of 1% sodium lauroyl sarcosine, 0.1% sodium deoxycholate, 0.5 M lithium chloride, 25 mM EDTA and 25 mM EGTA and incubated at 37°C for 5 min. The lysates were spun and the supernatants were collected. The pellets were resuspended in 300 μl of lysis buffer (50 mM Tris pH 7.5, 0.5M LiCl, 1% Nonidet-P 40, 1% sodium lauroyl sarcosine, 0.1% sodium lauroyl sarcosine, 20 mM EDTA, 20mM EGTA), incubated on ice for 10 min, heated to 65°C for 5 min, immediately spun at room temperature for 1 min, and stored on ice. The supernatants were collected and combined with the previous supernatants. The combined supernatants were precleaned by incubation with MyOne streptavidin C1 beads (ThermoFisher, 50 μl beads for 3.5ml of lysate) at room temperature for 20 min, and beads were removed. To conjugate DNA probes to beads, 160 μl of beads was incubated with 80 pmole of probes in 2× binding buffer (10 mM Tri-HCl (pH7.5), 1 mM EDTA, 2 M NaCl) at room temperature for 20 min, washed with 1× binding buffer twice, and then resuspended in 160 μl of lysis buffer. Precleaned lysated and probes-conjugated beads were preheated to 65°C for 5 min, mixed together and incubated at 65°C for another 15 min (100 μl beads for 1ml of lysate) in hybridization chamber, followed by slowly reducing the temperature to 37°C and one hour incubation. The beads were washed three times (5 min each time) in Wash Buffer 1 (50 mM Tris, pH 7.5, 0.3 M LiCl, 1% SDS, 0.5% Nonidet-P 40, 1mM DTT, 1mM PMSF, 1× protease inhibitors) at 37°C followed by treatment with 20 U of Turbo DNase I in 300 μl of DNase I digestion buffer with the addition of 0.3 M LiCl, protease inhibitors, and superaseIn at 37°C for 10 min. Then, beads were washed two more times at 37°C in the Wash Buffer1. The lysates were further washed at 37°C for 5 min in Wash Buffer 2 (1% SDS, 1mM DTT, 5mM EDTA, 150mM NaCl, 1mM PMSF). Proteins were eluted in 600 μl of Elution Buffer (10 mM Tris, pH 7.5, 1 mM EDTA) at 70°C for 5 min. DNA probes for iDRiP were ordered from Integrated DNA Technologies and labeled with 3′ biotin-TEG.
Detection of TERC-TERRA interaction from UV-crosslinked cells
TERRA RNA capture were performed using the iDRiP protocol described above. After elution, RNA was extracted using TRIzol and cDNA was synthesized using random primers.
Quantitative Proteomics
Proteins enriched with each lncRNA were suspended in 4 M urea/50 mM HEPES (pH 8.5). As described previously (Edwards and Haas, 2016), disulfide bonds were reduced, free thiols were alkylated with iodoacetamide; proteins were purified by MeOH/CHCl3 precipitation and digested with Lys-C and trypsin, and peptides were labeled with TMT-10plex reagents (Thermo Scientific) (McAlister et al., 2012). Labeled peptide mixtures were pooled into two 10-plexed samples, which were fractionated by basic reversed-phase HPLC as described previously (Edwards and Haas, 2016). Twelve fractions were analyzed by multiplexed quantitative proteomics performed on an Orbitrap Fusion mass spectrometer (Thermo Scientifc) using a Simultaneous Precursor Selection (SPS) based MS3 method (McAlister et al., 2014). MS2 spectra were assigned using a SEQUEST-based (Eng et al., 1994) proteomics analysis platform (Huttlin et al., 2010). Peptide and protein assignments were filtered to a false discovery rate of < 1 % employing the targetdecoy database search strategy (Elias and Gygi, 2007) and using linear discriminant analysis and posterior error histogram sorting (Huttlin et al., 2010). Peptides with sequences contained in more than one protein sequence from the UniProt database were assigned to the protein with most matching peptides (Huttlin et al., 2010). We extracted TMT reporter ion intensities as those of the most intense ions within a 0.03 Th window around the predicted reporter ion intensities in the collected MS3 spectra. Only MS3 with an average signal-to-noise value of larger than 20 per reporter ion as well as with an isolation specificity (Ting et al., 2011) of larger than 0.75 were considered for quantification. A two-step normalization of the protein TMT-intensities was performed by first normalizing the protein intensities over all acquired TMT channels for each protein based on the median average protein intensity calculated for all proteins. To correct for slight mixing errors of the peptide mixture from each sample a median of the normalized intensities was calculated from all protein intensities in each TMT channel and the protein intensities were normalized to the median value of these median intensities.
Proteomics network and GO analysis
To visualize potential reciprocal and intertwined interactions among the TERRA proteome, data from iDRiP-MS biological replicates was analyzed and the network was generated through the use of QIAGEN's Ingenuity Pathway Analysis (IPA®,QIAGEN Redwood City,www.qiagen.com/ingenuity)using IPA (Ingenuity pathway analysis, http://www.ingenuity.com/products/ipa). Gene ontology (GO) term was analyzed by DAVID Bioinformatics Resources 6.7 (https://david.ncifcrf.gov/) (Huang da et al., 2009a)
Immuno-FISH
Cells were cytospun, CSKT treated (10 mM PIPES, pH 6.8, 100 mM NaCl, 3 mM MgCl2, 0.3 M sucrose, 0.5% Triton X-100, adjust to pH 6.8), and fixed in 4 % paraformaldehyde and stored at 70% EtOH at -20°C. For immuno-RNA FISH, cover slips were blocked at 1% BSA/PBS with 1 mM EDTA and 0.8 U/μl of RNase inhibitor at 4°C for 1 hr. Cells were incubated with primary antibodies in blocking solution at 4°C for 2 hr, and washed with 0.2% Tween20/PBS 3 times at RT. Followed by incubation of secondary antibodies (in blocking solution) at 4°C for 30 min, cells were washed with PBS 3 times and fixed in 4 % paraformaldehyde for 10 minutes. RNA FISH was then performed as described previously. Antibodies were used against ATRX (Cat#: sc-15408, Santa Cruz), TRF2 (Cat#: sc-9143, Santa Cruz) and RAP1 (Cat#: sc-28197, Santa Cruz). For immuno-telomeric DNA FISH, cells were fixed as previously described, and were treated with RNaseA (400μg/ml) in PBS at 37°C for 30 min. After PBS washes, slides were dehydrated by EtOH, heated to 85°C on the heating block for 5 min. PNA probes (TelC-Alexa488 or TelG-Cy3) for telomeric DNA were heated at 85°C for 5 min in hybridization buffer (20mM Tri-HCl, pH 7.5, 70% formamide, 0.1 μg/ml salmon sperm DNA), added onto preheated slides, covered by coverslips, and then incubated at 85°C in a hybridization oven for 15 min. Followed by slowly decreasing the hybridization temperature by bringing the heating block (with slides on top of it) to room temperature (RT), slides were incubated in the dark at room temperature for 2 hrs. Slides were washed at 57°C (1× PBS, 0.02% Tween20) for 20 min, and washed again at RT. Slides were fixed at 4% paraformaldehyde for 5 min at RT, washed twice with PBS, incubated with blocking solution (1% BSA, PBS) at RT for 30 min, incubated with antibodies against phosphohistone H2A.X (Final Conc 1:400 dilution, Cat#05-636, clone JBW301, EMD Millipore) at 4°C overnight.
Electrophoretic mobility shift assay (EMSA)
EMSAs and competition assays were performed as described previously (Cifuentes-Rojas et al., 2014). Short ssDNA (30 nt), dsDNA (30 bp), RNA (30 nt) and long ssDNA (80 nt) were purchased from IDT (Integrated DNA technologies). Long RNA (83 nt) was generated by in vitro transcription. Long dsDNA (80bp) was generated by T4 DNA polymerase filling method using the same templates as in vitro transcription, and filling in DNA by adding T4 DNA polymerase and T7 oligos at 37°C for 15 min. All probes were PAGE-purified.
RQ-TRAP and TRAP assays
RQ-TRAP was performed and quantified as described in (Cristofari and Lingner, 2006) with minor modifications. Reactions were performed with iTaq Universal SYBR Green Supermix (Bio-Rad) supplemented with 0.5 mM MgCl2. Heat-inactivated cell extract (10 min. 95°C) was used as negative control for telomerase activity. TRAP assay was performed in parallel to validate the results seen by RQ-TRAP. TRAP was performed as described in (Chen et al., 2013). Briefly, undiluted (28 ng) and serial dilution of cell extracts in Chaps buffer were incubated at 30°C for 30 min. The 50 μl reactions contained: 1× TRAP buffer (20 mM Tris-HCl pH 8.3, 6.5 mM MgCl2, 63 mM KCl, 0.005% Tween-20, 1 mM EGTA, 0.1 mg/ml BSA), 25 μM dNTPS, 2 ng primer TS, 4 μCi dGTP[α-32P] (stock: 6000Ci/mmol). Following heat-inactivation at 94°C for 1 minute, 2U Taq polymerase and 2 ng primer ACX was added for 27 PCR cycles (30 seconds at 94°C and 30 seconds at 60°C). Following PCR-amplification, 10% of the reaction was resolved on a 12% polyacrylamide gel. The gel was dried, exposed to PhosphorImager screens prior to quantification using ImageQuant (GE Healthcare LS).
Knockdown ATRX by siRNA
Mouse ES cells were transfected with 20 nM of siRNAs using lipofectamine RNAiMAX (ThermoFisher) reagents for 48 hours in the feeders-cultured condition, and feeders were removed before harvesting ES cells. Two siRNAs (siRNA ID#s76136 and s76137, Silencer®Select, ThermoFisher) against ATRX and one control siRNA were used.
Metaphase analysis of telomeric integrity
After treatment of Colcemid (1μg/ml) for 1 hour, ES cells were collected. Followed by PBS wash, cells were incubated with 5 ml of ice-cold 0.56% KCl at RT for 6 minutes, and spun down at 1,000 rpm for 5 minutes. Cells were resuspended with 200 μl of 0.56% KCl and slowly supplied with 5 ml of ice-cold fixative (MeOH:Acetic acid∷3:1, one small drop each time). Cells were spun down and transferred to 1 ml tube, and washed with 1 ml of fixative for 3 times. Cells were resuspended in fixative and ready to drop. Slides were faced down into the steam of hot water bath (80°C) and 20 μl of cells were dropped to the slide. After drying the slide for overnight, cells were fixed in 4% paraformaldehyde for 5 minutes at RT. After several washes with PBS, telomere DNA FISH was performed using PNA probes as described above. Loss of telomeric integrity was manifested by occurrence of multiple aberrant telomeric phenotypes on metaphase chromosomes. (i) Loss of the (TTAGGG)n telomeric repeat sequence on both sister chromatids or just on one sister chromatid (“heterogeneous”); (ii) duplications of telomeric repeats at chromosomal ends; (iii) insertions of telomeric repeats within internal chromosomal regions; and (iv) fusions between sister chromatid telomeres that would create a “ring” structure on long arm of chromosomes.
Quantification and Statistical Analysis
Statistical parameters including the exact value of n, standard deviation (SD), standard errors (S.E.), Pearson's R correlation test and statistical significance are reported in the Figures and the Figure Legends. Statistically significant is determined by the value of p < 0.05 by two-tailed Student's t-test or Fisher exact test, or Chi-squared test, where appropriate.
Data and Software Availability
Raw data and processed files for the TERRA-CHIRT and RNA sequencing have been deposited in the NCBI Gene Expression Omnibus under accession number: intro
Supplementary Material
Figure S1. TERRA CHIRT-seq statistics.
This Figure relates to Figure 1.
A. TERRA colocalization counts with TRF2 for the data in Figure 1C. 414 out of 2014 TERRA foci (19.7%) were colocalized with TRF2 in mouse ES cells. n= number of counted nuclei.
B. RNA slotblot analysis showing that TERRA-AS specifically captured TERRA RNA by CHIRT. Total RNA was extracted from beads after probe hybridization without RNase H elution.
C. Scatterplot comparing Log2 coverages of biological replicates for TERRA CHIRT-seq analysis in ES cells. Pearson's r was shown. Replicate 1 (Rep1) was normalized with input. Replicate 2 (Rep2) was normalized to RNaseA pre-treated control.
D. Read statistics for two biological replicates of the TERRA CHIRT-seq analysis.
E. Scatterplot analysis comparing log2 coverages of TERRA CHIRT normalized using different methods. Pearson's r shown.
F. CEAS analysis shows significant over-representation of introns and noncoding regulatory regions. Exons are under-represented. ***, P<0.001; *, P<0.05 (one-sided binomial test). The genome reference was obtained from the CHIRT input.
G. CEAS analysis: Left panel, Pie chart showing relative representation of various genomic regions when the CHIRT analysis excludes genomic regions containing telomeric repeats. Right panel, Pie chart showing relative representation of various genomic regions when the CHIRT analysis is performed on genomic regions containing telomeric repeats.
H. CHIRT-seq tracks showing TERRA enrichment at the ends of various chromosomes in female ES cells. Different normalization methods reveal similar results (TERRA/input; TERRA/no RNase H; TERRA/sense). Note: TERRA-Sense CHIRT did not resemble TERRAAS-CHIRT.
Figure S2. RNA-seq analysis after TERRA knockdown by LNA gapmers.
This Figure relates to Figure 2.
A. RNA FISH confirming TERRA depletion after 1, 6 and 24 hours of LNA treatment in ES cells.
B. Scatterplots comparing log2 FPKM values show good correlation between biological replicates of RNA-seq in both Scr KD and TERRA KD in ES cells. Pearson's r is shown.
C. CHIRT-seq tracks (red) for TERRA binding sites near differentially upregulated genes after TERRA KD in ES cells. RNA-seq coverage is FPM (Fragments Per Million)-normalized and tracks are shown in blue.
D. CHIRT-seq tracks (red) for TERRA binding sites near differentially downregulated genes after TERRA KD in ES cells. RNA-seq coverage is FPM (Fragments Per Million)-normalized and tracks are shown in blue.
E. Quantitative RT-qPCR of Nfib and Erdr1 expression after Scr, sense, or TERRA LNA knockdown.
F. RNA-seq analysis of sense LNA knockdown controls show largely non-overlapping changes in comparison to TERRA-specific knockdown.
Figure S3. Gene ontology (GO) analysis of upregulated and downregulated genes following TERRA depletion.
This Figure relates to Figure 2.
Enriched pathways are identified by DAVID bioinformatics resources. P values determined by Fisher Exact test. Benjamini FDR shown.
Figure S4. TERRA iDRiP proteomics.
This Figure relates to Figure 3.
A. Top 30 candidates of TERRA iDRiP proteomics with the highest enrichment over the luciferase RNA capture are shown.
B. Top 30 candidates of TERRA iDRiP proteomics with the highest enrichment over the U1 RNA capture are shown.
C. Shelterin complex and telomere function associated proteins are enriched in TERRA iDRiP proteomics but not in the sense-probe or the U1 RNA proteomics. The intensities of indicated proteins were normalized to luciferase RNA iDRiP proteomics. Log2 fold enrichment was shown as the Y-axis.
Figure S5. Gene expression of ATRX-TERRA target genes after TERRA KD.
This Figure relates to Figure 4.
A. Metasite analysis as described in Figure 4A but with telomere-bound TERRA peaks subtracted from analysis. ChIP-seq coverage of indicated epitopes (y-axis) relative to averaged TERRA-binding site (x=0).
B. TERRA depletion results in Lphn2 and Fyco1 downregulation. Genome browser shot of two examples of TERRA targets, with RNA-seq, CHIRT-seq, and ChIP-seq data displayed.
C. Heatmap shows the downregulation genes (green, log2<0.5 of delta FPKM) and the upregulation (red, log2>0.5 of delta FPKM) genes for ATRX/TERRA target after TERRA depletion.
Figure S6. ATRX is enriched near the TSS of genes sensitive to TERRA depletion.
This Figure relates to Figure 4K. Relationship of ATRX, H3K4me3, and CTCF coverage profiles shown in metagene plots for genes that are upregulated (red) or downregulated (blue) after TERRA depletion. Note that ATRX coverage is enriched near the TSS of genes that are downregulated when TERRA is depleted. This trend was not observed for other epitopes, including H3K4me3 and CTCF.
Figure S7. TERRA-ATRX interactions are not competed away by DNA.
This Figure relates to Figure 5.
A. Competition assay: TERRA RNA shifted by ATRX cannot be competed away by increasing concentrations (0.6, 6, 60nM) of dsDNA (30bp) or ssDNA (30nt) of corresponding TERRA sequence (30nt). RNA EMSA with 0.2 nM RNA probes from indicated transcripts (top) and 60nM GST (G, control) or ATRX (A) protein. Bound probe (shifted), B. Unbound, U.
B. Additional examples of TERRA depletion (6hr knockdown) causing ATRX dispersal from pericentric heterochromatin and relocalization to telomeres in ES cells. Immuno-DNA-FISH staining for ATRX and telomeric DNA reveals large ATRX foci (red) on pericentric heterochromatin (dense DAPI staining) in control cells. TERRA depletion cells show dispersed ATRX signals that coincide with telomeric DNA (green). Asterisks are ATRX foci at pericentric heterochromatin. Arrowheads are ATRX foci at telomeres.
Table S1. Transcriptomic analysis of ES cells following TERRA knockdown.
This Table relates to Figure 2.
RNA-seq analysis with Log2 fold changes in gene expression in TERRA knockdown versus Scr knockdown ES cells shown as averages (base mean FPM) for two biological replicates. List contains only those whose expression significantly changed (P-adj < 0.05), either upwards (+ log2 fold change) or downwards (- log2 fold change).
Table S2. The TERRA protein interactome.
This Table relates to Figure 3.
Results of iDRiP-mass spectrometry analysis are shown for TERRA and multiple controls, including Sense (reverse complement of TERRA), luciferase, and U1 RNAs. Enrichment for candidate protein was determined by normalization to multiple controls (columns O,P,Q). Top candidates are rank-ordered. Two biological replicates are labelled “1” and “2” after each sample.
Highlights.
Epigenomic mapping shows that mouse TERRA RNA binds telomeres and select genes.
iDRiP proteomics reveals that ATRX is a major TERRA-interacting protein.
TERRA and ATRX antagonize each other functionally.
Loss of TERRA results in telomere dysfunction and instability.
The functions of the long noncoding RNA TERRA are revealed through a combination of genomic and proteomic approaches, with the helicase ATRX being an important binding partner for its ability to regulate telomere function.
Acknowledgments
We thank all members of the Lab for valuable discussions and feedback. We also thank C.-S. Wu for advising on IPA software. This work is supported by grants from the National Institutes of Health to J.T.L. (R01-GM58839), and to C.C.R. (K99-GM115868). J.T.L. is an Investigator of the Howard Hughes Medical Institute.
Footnotes
Author Contributions: H-P.C. and J.T.L. conceived of and designed the study. H-P.C. conducted CHIRT, iDRiP, RNA-seq and immune-FISH analyses. C.C.R performed EMSA. B.K and H-P.C. analyzed NGS datasets. H.L. analyzed ATRX ChIP-seq data. E.A. conducted TRAP experiments. H-P.C. and H.J.O. developed CHIRT. C.W. assisted with RNA-seq library preparation, M.B. and W.H. carried out quantitative proteomic experiments. H-P.C. and J.T.L. wrote the manuscript.
Publisher's Disclaimer: This is a PDF file of an unedited manuscript that has been accepted for publication. As a service to our customers we are providing this early version of the manuscript. The manuscript will undergo copyediting, typesetting, and review of the resulting proof before it is published in its final citable form. Please note that during the production process errors may be discovered which could affect the content, and all legal disclaimers that apply to the journal pertain.
References
- Anders S, Pyl PT, Huber W. HTSeq--a Python framework to work with high-throughput sequencing data. Bioinformatics. 2015;31:166–169. doi: 10.1093/bioinformatics/btu638. [DOI] [PMC free article] [PubMed] [Google Scholar]
- Azzalin CM, Lingner J. Telomeres: the silence is broken. Cell Cycle. 2008;7:1161–1165. doi: 10.4161/cc.7.9.5836. [DOI] [PubMed] [Google Scholar]
- Azzalin CM, Lingner J. Telomere functions grounding on TERRA firma. Trends Cell Biol. 2015;25:29–36. doi: 10.1016/j.tcb.2014.08.007. [DOI] [PubMed] [Google Scholar]
- Azzalin CM, Reichenbach P, Khoriauli L, Giulotto E, Lingner J. Telomeric Repeat Containing RNA and RNA Surveillance Factors at Mammalian Chromosome Ends. Science. 2007;318:798–801. doi: 10.1126/science.1147182. [DOI] [PubMed] [Google Scholar]
- Balk B, Maicher A, Dees M, Klermund J, Luke-Glaser S, Bender K, Luke B. Telomeric RNA-DNA hybrids affect telomere-length dynamics and senescence. Nat Struct Mol Biol. 2013;20:1199–1205. doi: 10.1038/nsmb.2662. [DOI] [PubMed] [Google Scholar]
- Barthel FP, Wei W, Tang M, Martinez-Ledesma E, Hu X, Amin SB, Akdemir KC, Seth S, Song X, Wang Q, et al. Systematic analysis of telomere length and somatic alterations in 31 cancer types. Nat Genet. 2017;49:349–357. doi: 10.1038/ng.3781. [DOI] [PMC free article] [PubMed] [Google Scholar]
- Bernardes de Jesus B, Blasco MA. Telomerase at the intersection of cancer and aging. Trends in genetics : TIG. 2013;29:513–520. doi: 10.1016/j.tig.2013.06.007. [DOI] [PMC free article] [PubMed] [Google Scholar]
- Blackburn EH, Greider CW, Szostak JW. Telomeres and telomerase: the path from maize, Tetrahymena and yeast to human cancer and aging. Nature medicine. 2006;12:1133–1138. doi: 10.1038/nm1006-1133. [DOI] [PubMed] [Google Scholar]
- Chen LY, Majerská J, Lingner J. Molecular basis of telomere syndrome caused by CTC1 mutations. Genes Dev. 2013;27:2099–2108. doi: 10.1101/gad.222893.113. [DOI] [PMC free article] [PubMed] [Google Scholar]
- Chu C, Qu K, Zhong FL, Artandi SE, Chang HY. Genomic maps of long noncoding RNA occupancy reveal principles of RNA-chromatin interactions. Mol Cell. 2011;44:667–678. doi: 10.1016/j.molcel.2011.08.027. [DOI] [PMC free article] [PubMed] [Google Scholar]
- Cifuentes-Rojas C, Hernandez AJ, Sarma K, Lee JT. Regulatory interactions between RNA and polycomb repressive complex 2. Mol Cell. 2014;55:171–185. doi: 10.1016/j.molcel.2014.05.009. [DOI] [PMC free article] [PubMed] [Google Scholar]
- Clynes D, Jelinska C, Xella B, Ayyub H, Scott C, Mitson M, Taylor S, Higgs DR, Gibbons RJ. Suppression of the alternative lengthening of telomere pathway by the chromatin remodelling factor ATRX. Nat Commun. 2015;6:7538. doi: 10.1038/ncomms8538. [DOI] [PMC free article] [PubMed] [Google Scholar]
- Consortium, E.P. Birney E, Stamatoyannopoulos JA, Dutta A, Guigo R, Gingeras TR, Margulies EH, Weng Z, Snyder M, Dermitzakis ET, et al. Identification and analysis of functional elements in 1% of the human genome by the ENCODE pilot project. Nature. 2007;447:799–816. doi: 10.1038/nature05874. [DOI] [PMC free article] [PubMed] [Google Scholar]
- Cristofari G, Lingner J. Telomere length homeostasis requires that telomerase levels are limiting. EMBO J. 2006;25:565–574. doi: 10.1038/sj.emboj.7600952. [DOI] [PMC free article] [PubMed] [Google Scholar]
- de Lange T. How telomeres solve the end-protection problem. Science. 2009;326:948–952. doi: 10.1126/science.1170633. [DOI] [PMC free article] [PubMed] [Google Scholar]
- de Silanes IL, Grana O, De Bonis ML, Dominguez O, Pisano DG, Blasco MA. Identification of TERRA locus unveils a telomere protection role through association to nearly all chromosomes. Nat Commun. 2014;5:4723. doi: 10.1038/ncomms5723. [DOI] [PMC free article] [PubMed] [Google Scholar]
- de Silanes ILop, d'Alcontres MS, Blasco MA. TERRA transcripts are bound by a complex array of RNA-binding proteins. Nature Communications. 2010;1:1–9. doi: 10.1038/ncomms1032. [DOI] [PubMed] [Google Scholar]
- Dejardin J, Kingston RE. Purification of proteins associated with specific genomic Loci. Cell. 2009;136:175–186. doi: 10.1016/j.cell.2008.11.045. [DOI] [PMC free article] [PubMed] [Google Scholar]
- Deng Z, Norseen J, Wiedmer A, Riethman H, Lieberman PM. TERRA RNA binding to TRF2 facilitates heterochromatin formation and ORC recruitment at telomeres. Mol Cell. 2009;35:403–413. doi: 10.1016/j.molcel.2009.06.025. [DOI] [PMC free article] [PubMed] [Google Scholar]
- Deng Z, Wang Z, Stong N, Plasschaert R, Moczan A, Chen HS, Hu S, Wikramasinghe P, Davuluri RV, Bartolomei MS, et al. A role for CTCF and cohesin in subtelomere chromatin organization, TERRA transcription, and telomere end protection. The EMBO Journal. 2012:1–14. doi: 10.1038/emboj.2012.266. [DOI] [PMC free article] [PubMed] [Google Scholar]
- Doksani Y, de Lange T. The role of double-strand break repair pathways at functional and dysfunctional telomeres. Cold Spring Harbor perspectives in biology. 2014;6:a016576. doi: 10.1101/cshperspect.a016576. [DOI] [PMC free article] [PubMed] [Google Scholar]
- Edwards A, Haas W. Multiplexed Quantitative Proteomics for High-Throughput Comprehensive Proteome Comparisons of Human Cell Lines. Methods Mol Biol. 2016;1394:1–13. doi: 10.1007/978-1-4939-3341-9_1. [DOI] [PubMed] [Google Scholar]
- Elias JE, Gygi SP. Target-decoy search strategy for increased confidence in large-scale protein identifications by mass spectrometry. Nat Methods. 2007;4:207–214. doi: 10.1038/nmeth1019. [DOI] [PubMed] [Google Scholar]
- Eng JK, McCormack AL, Yates JR. An approach to correlate tandem mass spectral data of peptides with amino acid sequences in a protein database. J Am Soc Mass Spectrom. 1994;5:976–989. doi: 10.1016/1044-0305(94)80016-2. [DOI] [PubMed] [Google Scholar]
- Fei Q, Yang X, Jiang H, Wang Q, Yu Y, Yi W, Zhou S, Chen T, Lu C, Atadja P, et al. SETDB1 modulates PRC2 activity at developmental genes independently of H3K9 trimethylation in mouse ES cells. Genome Res. 2015;25:1325–1335. doi: 10.1101/gr.177576.114. [DOI] [PMC free article] [PubMed] [Google Scholar]
- Grolimund L, Aeby E, Hamelin R, Armand F, Chiappe D, Moniatte M, Lingner J. A quantitative telomeric chromatin isolation protocol identifies different telomeric states. Nat Commun. 2013;4:2848. doi: 10.1038/ncomms3848. [DOI] [PubMed] [Google Scholar]
- Huang da W, Sherman BT, Lempicki RA. Bioinformatics enrichment tools: paths toward the comprehensive functional analysis of large gene lists. Nucleic Acids Res. 2009a;37:1–13. doi: 10.1093/nar/gkn923. [DOI] [PMC free article] [PubMed] [Google Scholar]
- Huang da W, Sherman BT, Lempicki RA. Systematic and integrative analysis of large gene lists using DAVID bioinformatics resources. Nat Protoc. 2009b;4:44–57. doi: 10.1038/nprot.2008.211. [DOI] [PubMed] [Google Scholar]
- Huttlin EL, Jedrychowski MP, Elias JE, Goswami T, Rad R, Beausoleil SA, Villen J, Haas W, Sowa ME, Gygi SP. A tissue-specific atlas of mouse protein phosphorylation and expression. Cell. 2010;143:1174–1189. doi: 10.1016/j.cell.2010.12.001. [DOI] [PMC free article] [PubMed] [Google Scholar]
- Ishikawa F, Matunis MJ, Dreyfuss G, Cech TR. Nuclear proteins that bind the pre-mRNA 3′ splice site sequence r(UUAG/G) and the human telomeric DNA sequence d(TTAGGG)n. Molecular and cellular biology. 1993;13:4301–4310. doi: 10.1128/mcb.13.7.4301. [DOI] [PMC free article] [PubMed] [Google Scholar]
- Kagey MH, Newman JJ, Bilodeau S, Zhan Y, Orlando DA, van Berkum NL, Ebmeier CC, Goossens J, Rahl PB, Levine SS, et al. Mediator and cohesin connect gene expression and chromatin architecture. Nature. 2010;467:430–435. doi: 10.1038/nature09380. [DOI] [PMC free article] [PubMed] [Google Scholar]
- Kharchenko PV, Tolstorukov MY, Park PJ. Design and analysis of ChIP-seq experiments for DNA-binding proteins. Nat Biotechnol. 2008;26:1351–1359. doi: 10.1038/nbt.1508. [DOI] [PMC free article] [PubMed] [Google Scholar]
- Kim D, Pertea G, Trapnell C, Pimentel H, Kelley R, Salzberg SL. TopHat2: accurate alignment of transcriptomes in the presence of insertions, deletions and gene fusions. Genome Biol. 2013;14:R36. doi: 10.1186/gb-2013-14-4-r36. [DOI] [PMC free article] [PubMed] [Google Scholar]
- Kung JT, Colognori D, Lee JT. Long noncoding RNAs: past, present, and future. Genetics. 2013;193:651–669. doi: 10.1534/genetics.112.146704. [DOI] [PMC free article] [PubMed] [Google Scholar]
- Kung JT, Kesner B, An JY, Ahn JY, Cifuentes-Rojas C, Colognori D, Jeon Y, Szanto A, del Rosario BC, Pinter SF, et al. Locus-specific targeting to the X chromosome revealed by the RNA interactome of CTCF. Mol Cell. 2015;57:361–375. doi: 10.1016/j.molcel.2014.12.006. [DOI] [PMC free article] [PubMed] [Google Scholar]
- Langmead B, Salzberg SL. Fast gapped-read alignment with Bowtie 2. Nat Methods. 2012;9:357–359. doi: 10.1038/nmeth.1923. [DOI] [PMC free article] [PubMed] [Google Scholar]
- Law MJ, Lower KM, Voon HP, Hughes JR, Garrick D, Viprakasit V, Mitson M, De Gobbi M, Marra M, Morris A, et al. ATR-X syndrome protein targets tandem repeats and influences allele-specific expression in a size-dependent manner. Cell. 2010;143:367–378. doi: 10.1016/j.cell.2010.09.023. [DOI] [PubMed] [Google Scholar]
- Le PN, Maranon DG, Altina NH, Battaglia CL, Bailey SM. TERRA, hnRNP A1, and DNA-PKcs Interactions at Human Telomeres. Frontiers in oncology. 2013;3:91. doi: 10.3389/fonc.2013.00091. [DOI] [PMC free article] [PubMed] [Google Scholar]
- Lee JT, Davidow LS, Warshawsky D. Tsix, a gene antisense to Xist at the Xinactivation centre. Nat Genet. 1999;21:400–404. doi: 10.1038/7734. [DOI] [PubMed] [Google Scholar]
- Love MI, Huber W, Anders S. Moderated estimation of fold change and dispersion for RNA-seq data with DESeq2. Genome Biol. 2014;15:550. doi: 10.1186/s13059-014-0550-8. [DOI] [PMC free article] [PubMed] [Google Scholar]
- Lovejoy CA, Li W, Reisenweber S, Thongthip S, Bruno J, de Lange T, De S, Petrini JH, Sung PA, Jasin M, et al. Loss of ATRX, genome instability, and an altered DNA damage response are hallmarks of the alternative lengthening of telomeres pathway. PLoS genetics. 2012;8:e1002772. doi: 10.1371/journal.pgen.1002772. [DOI] [PMC free article] [PubMed] [Google Scholar]
- Maicher A, Kastner L, Dees M, Luke B. Deregulated telomere transcription causes replication-dependent telomere shortening and promotes cellular senescence. Nucleic Acids Res. 2012;40:6649–6659. doi: 10.1093/nar/gks358. [DOI] [PMC free article] [PubMed] [Google Scholar]
- McAlister GC, Huttlin EL, Haas W, Ting L, Jedrychowski MP, Rogers JC, Kuhn K, Pike I, Grothe RA, Blethrow JD, et al. Increasing the multiplexing capacity of TMTs using reporter ion isotopologues with isobaric masses. Anal Chem. 2012;84:7469–7478. doi: 10.1021/ac301572t. [DOI] [PMC free article] [PubMed] [Google Scholar]
- McAlister GC, Nusinow DP, Jedrychowski MP, Wuhr M, Huttlin EL, Erickson BK, Rad R, Haas W, Gygi SP. MultiNotch MS3 enables accurate, sensitive, and multiplexed detection of differential expression across cancer cell line proteomes. Anal Chem. 2014;86:7150–7158. doi: 10.1021/ac502040v. [DOI] [PMC free article] [PubMed] [Google Scholar]
- Minajigi A, Froberg JE, Wei C, Sunwoo H, Kesner B, Colognori D, Lessing D, Payer B, Boukhali M, Haas W, et al. Chromosomes. A comprehensive Xist interactome reveals cohesin repulsion and an RNA-directed chromosome conformation. Science. 2015;349 doi: 10.1126/science.aab2276. [DOI] [PMC free article] [PubMed] [Google Scholar]
- Moravec M, Wischnewski H, Bah A, Hu Y, Liu N, Lafranchi L, King MC, Azzalin CM. TERRA promotes telomerase-mediated telomere elongation in Schizosaccharomyces pombe. EMBO Rep. 2016;17:999–1012. doi: 10.15252/embr.201541708. [DOI] [PMC free article] [PubMed] [Google Scholar]
- Pfeiffer V, Lingner J. TERRA promotes telomere shortening through exonuclease 1-mediated resection of chromosome ends. PLoS genetics. 2012;8:e1002747. doi: 10.1371/journal.pgen.1002747. [DOI] [PMC free article] [PubMed] [Google Scholar]
- Pinter SF, Sadreyev RI, Yildirim E, Jeon Y, Ohsumi TK, Borowsky M, Lee JT. Spreading of X chromosome inactivation via a hierarchy of defined Polycomb stations. Genome research. 2012;22:1864–1876. doi: 10.1101/gr.133751.111. [DOI] [PMC free article] [PubMed] [Google Scholar]
- Porro A, Feuerhahn S, Reichenbach P, Lingner J. Molecular dissection of telomeric repeat-containing RNA biogenesis unveils the presence of distinct and multiple regulatory pathways. Mol Cell Biol. 2010;30:4808–4817. doi: 10.1128/MCB.00460-10. [DOI] [PMC free article] [PubMed] [Google Scholar]
- Quinlan AR, Hall IM. BEDTools: a flexible suite of utilities for comparing genomic features. Bioinformatics. 2010;26:841–842. doi: 10.1093/bioinformatics/btq033. [DOI] [PMC free article] [PubMed] [Google Scholar]
- Redon S, Reichenbach P, Lingner J. The non-coding RNA TERRA is a natural ligand and direct inhibitor of human telomerase. Nucleic Acids Res. 2010;38:5797–5806. doi: 10.1093/nar/gkq296. [DOI] [PMC free article] [PubMed] [Google Scholar]
- Rippe K, Luke B. TERRA and the state of the telomere. Nature structural & molecular biology. 2015;22:853–858. doi: 10.1038/nsmb.3078. [DOI] [PubMed] [Google Scholar]
- Sandell LL, Gottschling DE, Zakian VA. Transcription of a yeast telomere alleviates telomere position effect without affecting chromosome stability. Proc Natl Acad Sci U S A. 1994;91:12061–12065. doi: 10.1073/pnas.91.25.12061. [DOI] [PMC free article] [PubMed] [Google Scholar]
- Sarma K, Cifuentes-Rojas C, Ergun A, Del Rosario A, Jeon Y, White F, Sadreyev R, Lee JT. ATRX directs binding of PRC2 to Xist RNA and Polycomb targets. Cell. 2014;159:869–883. doi: 10.1016/j.cell.2014.10.019. [DOI] [PMC free article] [PubMed] [Google Scholar]
- Scheibe M, Arnoult N, Kappei D, Buchholz F, Decottignies A, Butter F, Mann M. Quantitative interaction screen of telomeric repeat-containing RNA reveals novel TERRA regulators. Genome Res. 2013;23:2149–2157. doi: 10.1101/gr.151878.112. [DOI] [PMC free article] [PubMed] [Google Scholar]
- Schmidt JC, Zaug AJ, Cech TR. Live Cell Imaging Reveals the Dynamics of Telomerase Recruitment to Telomeres Cell. 2016;166:1188–1197.e1189. doi: 10.1016/j.cell.2016.07.033. [DOI] [PMC free article] [PubMed] [Google Scholar]
- Schoeftner S, Blasco MA. Developmentally regulated transcription of mammalian telomeres by DNA-dependent RNA polymerase II. Nature Cell Biology. 2007;10:228–236. doi: 10.1038/ncb1685. [DOI] [PubMed] [Google Scholar]
- Schoeftner S, Blasco MA. Developmentally regulated transcription of mammalian telomeres by DNA-dependent RNA polymerase II. Nat Cell Biol. 2008;10:228–236. doi: 10.1038/ncb1685. [DOI] [PubMed] [Google Scholar]
- Shin H, Liu T, Manrai AK, Liu XS. CEAS: cis-regulatory element annotation system. Bioinformatics. 2009;25:2605–2606. doi: 10.1093/bioinformatics/btp479. [DOI] [PubMed] [Google Scholar]
- Simon MD, Wang CI, Kharchenko PV, West JA, Chapman BA, Alekseyenko AA, Borowsky ML, Kuroda MI, Kingston RE. The genomic binding sites of a noncoding RNA. Proc Natl Acad Sci U S A. 2011;108:20497–20502. doi: 10.1073/pnas.1113536108. [DOI] [PMC free article] [PubMed] [Google Scholar]
- Ting L, Rad R, Gygi SP, Haas W. MS3 eliminates ratio distortion in isobaric multiplexed quantitative proteomics. Nat Methods. 2011;8:937–940. doi: 10.1038/nmeth.1714. [DOI] [PMC free article] [PubMed] [Google Scholar]
- Trapnell C, Hendrickson DG, Sauvageau M, Goff L, Rinn JL, Pachter L. Differential analysis of gene regulation at transcript resolution with RNA-seq. Nat Biotechnol. 2013;31:46–53. doi: 10.1038/nbt.2450. [DOI] [PMC free article] [PubMed] [Google Scholar]
- Webb CJ, Zakian VA. Telomerase RNA is more than a DNA template. RNA Biol. 2016;13:683–689. doi: 10.1080/15476286.2016.1191725. [DOI] [PMC free article] [PubMed] [Google Scholar]
- Wellinger RJ, Wolf AJ, Zakian VA. Origin activation and formation of singlestrand TG1-3 tails occur sequentially in late S phase on a yeast linear plasmid. Mol Cell Biol. 1993;13:4057–4065. doi: 10.1128/mcb.13.7.4057. [DOI] [PMC free article] [PubMed] [Google Scholar]
- Yu TY, Kao YW, Lin JJ. Telomeric transcripts stimulate telomere recombination to suppress senescence in cells lacking telomerase. Proc Natl Acad Sci U S A. 2014;111:3377–3382. doi: 10.1073/pnas.1307415111. [DOI] [PMC free article] [PubMed] [Google Scholar]
- Zhang LF, Ogawa Y, Ahn JY, Namekawa SH, Silva SS, Lee JT. Telomeric RNAs Mark Sex Chromosomes in Stem Cells. Genetics. 2009;182:685. doi: 10.1534/genetics.109.103093. [DOI] [PMC free article] [PubMed] [Google Scholar]
- Zhang Y, Liu T, Meyer CA, Eeckhoute J, Johnson DS, Bernstein BE, Nusbaum C, Myers RM, Brown M, Li W, et al. Model-based analysis of ChIP-Seq (MACS) Genome Biol. 2008;9:R137. doi: 10.1186/gb-2008-9-9-r137. [DOI] [PMC free article] [PubMed] [Google Scholar]
Associated Data
This section collects any data citations, data availability statements, or supplementary materials included in this article.
Supplementary Materials
Figure S1. TERRA CHIRT-seq statistics.
This Figure relates to Figure 1.
A. TERRA colocalization counts with TRF2 for the data in Figure 1C. 414 out of 2014 TERRA foci (19.7%) were colocalized with TRF2 in mouse ES cells. n= number of counted nuclei.
B. RNA slotblot analysis showing that TERRA-AS specifically captured TERRA RNA by CHIRT. Total RNA was extracted from beads after probe hybridization without RNase H elution.
C. Scatterplot comparing Log2 coverages of biological replicates for TERRA CHIRT-seq analysis in ES cells. Pearson's r was shown. Replicate 1 (Rep1) was normalized with input. Replicate 2 (Rep2) was normalized to RNaseA pre-treated control.
D. Read statistics for two biological replicates of the TERRA CHIRT-seq analysis.
E. Scatterplot analysis comparing log2 coverages of TERRA CHIRT normalized using different methods. Pearson's r shown.
F. CEAS analysis shows significant over-representation of introns and noncoding regulatory regions. Exons are under-represented. ***, P<0.001; *, P<0.05 (one-sided binomial test). The genome reference was obtained from the CHIRT input.
G. CEAS analysis: Left panel, Pie chart showing relative representation of various genomic regions when the CHIRT analysis excludes genomic regions containing telomeric repeats. Right panel, Pie chart showing relative representation of various genomic regions when the CHIRT analysis is performed on genomic regions containing telomeric repeats.
H. CHIRT-seq tracks showing TERRA enrichment at the ends of various chromosomes in female ES cells. Different normalization methods reveal similar results (TERRA/input; TERRA/no RNase H; TERRA/sense). Note: TERRA-Sense CHIRT did not resemble TERRAAS-CHIRT.
Figure S2. RNA-seq analysis after TERRA knockdown by LNA gapmers.
This Figure relates to Figure 2.
A. RNA FISH confirming TERRA depletion after 1, 6 and 24 hours of LNA treatment in ES cells.
B. Scatterplots comparing log2 FPKM values show good correlation between biological replicates of RNA-seq in both Scr KD and TERRA KD in ES cells. Pearson's r is shown.
C. CHIRT-seq tracks (red) for TERRA binding sites near differentially upregulated genes after TERRA KD in ES cells. RNA-seq coverage is FPM (Fragments Per Million)-normalized and tracks are shown in blue.
D. CHIRT-seq tracks (red) for TERRA binding sites near differentially downregulated genes after TERRA KD in ES cells. RNA-seq coverage is FPM (Fragments Per Million)-normalized and tracks are shown in blue.
E. Quantitative RT-qPCR of Nfib and Erdr1 expression after Scr, sense, or TERRA LNA knockdown.
F. RNA-seq analysis of sense LNA knockdown controls show largely non-overlapping changes in comparison to TERRA-specific knockdown.
Figure S3. Gene ontology (GO) analysis of upregulated and downregulated genes following TERRA depletion.
This Figure relates to Figure 2.
Enriched pathways are identified by DAVID bioinformatics resources. P values determined by Fisher Exact test. Benjamini FDR shown.
Figure S4. TERRA iDRiP proteomics.
This Figure relates to Figure 3.
A. Top 30 candidates of TERRA iDRiP proteomics with the highest enrichment over the luciferase RNA capture are shown.
B. Top 30 candidates of TERRA iDRiP proteomics with the highest enrichment over the U1 RNA capture are shown.
C. Shelterin complex and telomere function associated proteins are enriched in TERRA iDRiP proteomics but not in the sense-probe or the U1 RNA proteomics. The intensities of indicated proteins were normalized to luciferase RNA iDRiP proteomics. Log2 fold enrichment was shown as the Y-axis.
Figure S5. Gene expression of ATRX-TERRA target genes after TERRA KD.
This Figure relates to Figure 4.
A. Metasite analysis as described in Figure 4A but with telomere-bound TERRA peaks subtracted from analysis. ChIP-seq coverage of indicated epitopes (y-axis) relative to averaged TERRA-binding site (x=0).
B. TERRA depletion results in Lphn2 and Fyco1 downregulation. Genome browser shot of two examples of TERRA targets, with RNA-seq, CHIRT-seq, and ChIP-seq data displayed.
C. Heatmap shows the downregulation genes (green, log2<0.5 of delta FPKM) and the upregulation (red, log2>0.5 of delta FPKM) genes for ATRX/TERRA target after TERRA depletion.
Figure S6. ATRX is enriched near the TSS of genes sensitive to TERRA depletion.
This Figure relates to Figure 4K. Relationship of ATRX, H3K4me3, and CTCF coverage profiles shown in metagene plots for genes that are upregulated (red) or downregulated (blue) after TERRA depletion. Note that ATRX coverage is enriched near the TSS of genes that are downregulated when TERRA is depleted. This trend was not observed for other epitopes, including H3K4me3 and CTCF.
Figure S7. TERRA-ATRX interactions are not competed away by DNA.
This Figure relates to Figure 5.
A. Competition assay: TERRA RNA shifted by ATRX cannot be competed away by increasing concentrations (0.6, 6, 60nM) of dsDNA (30bp) or ssDNA (30nt) of corresponding TERRA sequence (30nt). RNA EMSA with 0.2 nM RNA probes from indicated transcripts (top) and 60nM GST (G, control) or ATRX (A) protein. Bound probe (shifted), B. Unbound, U.
B. Additional examples of TERRA depletion (6hr knockdown) causing ATRX dispersal from pericentric heterochromatin and relocalization to telomeres in ES cells. Immuno-DNA-FISH staining for ATRX and telomeric DNA reveals large ATRX foci (red) on pericentric heterochromatin (dense DAPI staining) in control cells. TERRA depletion cells show dispersed ATRX signals that coincide with telomeric DNA (green). Asterisks are ATRX foci at pericentric heterochromatin. Arrowheads are ATRX foci at telomeres.
Table S1. Transcriptomic analysis of ES cells following TERRA knockdown.
This Table relates to Figure 2.
RNA-seq analysis with Log2 fold changes in gene expression in TERRA knockdown versus Scr knockdown ES cells shown as averages (base mean FPM) for two biological replicates. List contains only those whose expression significantly changed (P-adj < 0.05), either upwards (+ log2 fold change) or downwards (- log2 fold change).
Table S2. The TERRA protein interactome.
This Table relates to Figure 3.
Results of iDRiP-mass spectrometry analysis are shown for TERRA and multiple controls, including Sense (reverse complement of TERRA), luciferase, and U1 RNAs. Enrichment for candidate protein was determined by normalization to multiple controls (columns O,P,Q). Top candidates are rank-ordered. Two biological replicates are labelled “1” and “2” after each sample.