Abstract
T lymphocytes stimulated through their antigen receptor (TCR) preferentially express mRNA isoforms with shorter 3´ untranslated regions (3´ UTRs) derived from alternative pre-mRNA cleavage and polyadenylation (APA). However, the physiological relevance of APA programs remains poorly understood. CD5 is a T-cell surface glycoprotein that negatively regulates TCR signaling from the onset of T-cell activation. CD5 plays a pivotal role in mediating outcomes of cell survival or apoptosis, and may prevent both autoimmunity and cancer. In human primary T lymphocytes and Jurkat cells we found three distinct mRNA isoforms encoding CD5, each derived from distinct poly(A) signals (PASs). Upon T-cell activation, there is an overall increase in CD5 mRNAs with a specific increase in the relative expression of the shorter isoforms. 3´UTRs derived from these shorter isoforms confer higher reporter expression in activated T cells relative to the longer isoform. We further show that polypyrimidine tract binding protein (PTB/ PTBP1) directly binds to the proximal PAS and PTB siRNA depletion causes a decrease in mRNA derived from this PAS, suggesting an effect on stability or poly(A) site selection to circumvent targeting of the longer CD5 mRNA isoform by miR-204. These mechanisms fine-tune CD5 expression levels and thus ultimately T-cell responses.
Keywords: CD5, alternative polyadenylation, PTB/PTBP1, miR-204, T lymphocyte activation
Introduction
CD5 is a transmembrane glycoprotein that belongs to the conserved scavenger receptor cysteine-rich (SRCR) family of receptors. This family contains extracellular domains homologous to the scavenger receptor type I of macrophages (1). While CD5 is a pan-T cell marker, it is also present on B1a lymphocytes (2, 3). Importantly, the CD5 protein is an inhibitor of TCR-mediated signaling (4). While this protein does not display intrinsic enzymatic activity, it couples to and impinges upon several signaling pathways through molecular associations mediated by its cytoplasmic tail (5–7). CD5 is expressed early in T lymphocyte ontogeny and acts as a fine-tuning regulator during positive and negative selection to promote the development of a high affinity repertoire of antigen receptors (8, 9). Paradoxically, during thymic positive selection as well as in activation of naïve T cells, expression levels of CD5 are proportional to the strength of T-cell responses. Indeed, high expression of CD5 identifies cells committed to activation and differentiation (9–12).
Many observations suggest a role for CD5 in autoimmune diseases (13, 14); however, the significance of the expression levels of CD5 in regard to disease is sometimes counterintuitive: although it is a negative regulator, disruption of the CD5 gene paradoxically predisposes stimulated T lymphocytes to activation-induced cell death. For example, in an animal model of multiple sclerosis, CD5-deficient mice develop only attenuated EAE upon injection of the encephalitogenic myelin peptide antigen, concomitant with a more ready initiation of T-cell programmed cell death (15). In further support of this mechanistic notion, auto reactive T cells from Fas-deficient mice similarly develop only mild EAE, since auto-reactive T cells responding to the agonist were desensitized in a dose-dependent manner (16). In this latter case, the lower T-cell reactivity was not related with decreased TCR expression or receptor affinity, but instead correlated with an increased expression of CD5.
In spite of clearly defined roles in TCR-mediated signaling and autoimmunity, the transcriptional mechanisms controlling CD5 mRNA expression are still poorly characterized. Polyadenylation is a co-transcriptional mechanism of pre-mRNA processing, consisting of the 3′ end endonucleolytic cleavage of the transcript and polymerization of a poly(A) tail (17–20). The cleavage site in the pre-mRNA, the poly(A) site, is typically defined by several cis-elements, including the hexamer AAUAAA or a similar sequence, a GU/-U rich downstream sequence element (DSE) and an upstream sequence element (USE) (20, 21). Over 70% of all mammalian genes generate diverse mRNA isoforms by alternative polyadenylation (APA) (22). APA has been correlated to a variety of cellular programs such as embryogenesis, differentiation, neurostimulation, leukocyte activation and cancer (23–28).
Alternative PAS selection is modulated by cis-elements and secondary structures present in the pre-mRNA and by several trans-acting factors (reviewed in (29–32). These consist of a myriad of protein regulators, including factors involved in cleavage/polyadenylation, splicing and transcription, and other RNA binding proteins. One of these factors is PTBP1 (PTB/hnRNPI; Polypyrimidine Tract Binding Protein 1). This multifunctional protein is involved in splicing (33) and also in mRNA 3´ end formation of the C2 complement (34, 35), COX 2, pro-thrombin, β-globin and β-adducin pre-mRNAs (36–39) by recruiting or impeding the binding of other protein factors to the pre-mRNA.
Genome-wide studies have shown that upon T-cell activation there is a preferential usage of proximal PASs resulting in an increased steady-state expression of mRNAs containing shorter 3′ UTRs (28, 40). Initial proof-of-concept studies revealed a potential physiological relevance for this phenomenon, specifically that reporter constructs fused to longer 3′ UTRs produced lower levels of protein in comparison with constructs fused to the shorter 3′ UTRs encoded by the same transcriptional unit. Shorter 3′ UTRs do not usually contain as many miRNA target sites as longer transcripts, and for some cases such as HIP2, the inhibitory effects conferred by the longer isoform could be rescued by deletion of miRNA target sites in the distal portion of the 3′ UTR (28). However, recent genome-wide studies also revealed that global 3′ UTR shortening is not always accompanied by increases in protein production (40, 41) or increased RNA stability (41). These newer observations suggest that the functional relevance of the shift in PAS usage observed in activated T cells must be analyzed for individual genes and in the proper cellular context.
Here we analyzed CD5 mRNA production and regulation in non-activated and TCR-stimulated primary T lymphocytes and Jurkat T cells. We report the identification of three human CD5 mRNA isoforms resulting from APA in the 3′ UTR (pA1, pA2 and pA3) and the characterization of molecular mechanisms involved in CD5 mRNA regulation. We show that CD5 pre-mRNA is alternatively polyadenylated, in agreement with previous high-throughput data (28), and also that the shorter 3’ UTRs encoded by the CD5 gene confer higher expression on a reporter than the longer isoforms. We also show that PTBP1 binds and increases the levels of pA1 mRNA and that miR-204 targets and partially silences the longer mRNA in activated T cells. Our results indicate that a combination of an increase in CD5 mRNA levels, PTBP1, and miR-204 silencing, all contribute for the increase in CD5 protein levels observed upon T-cell activation.
Results
Human CD5 produces three APA-derived mRNA isoforms
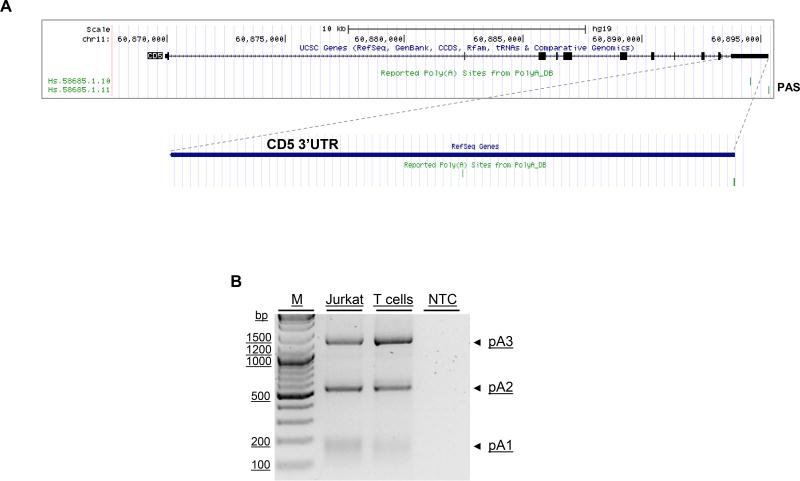
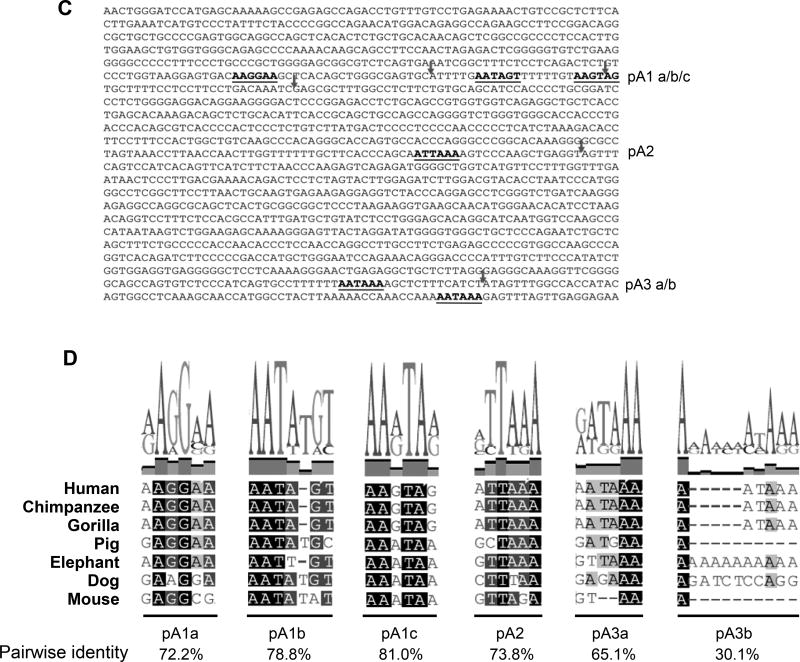
The CD5 gene is located in chromosome 11, contains eleven exons, and according to the UCSC genome browser (https://genome.ucsc.edu/) and the PolyA_DB database (42) contains two annotated PAS in its 3′ UTR (Fig. 1A, indicated by two vertical lines). In experimentally assessing the accuracy of these annotations via 3′ rapid amplification of cDNA ends (RACE), we identified additional PASs in human T cells and Jurkat (Fig.1B). A ~190 base pair (bp) product (pA1 in Fig. 1B) corresponds in fact to the usage of a set of three closely proximal PASs near the stop codon (AAGGAA, AAUAGU and AAGUAG, indicated in Fig. 1C as pA1a, b and c). As these are non-canonical PAS and positioned very closely together, it is possible that the transcription machinery does not discriminate between them; we hereafter name the whole set as pA1. The ~500 bp product (pA2 in Fig. 1B) corresponds to the usage of the AUUAAA PAS (indicated as pA2 in Fig.1C) and annotated in the UCSC Genome Browser. The ~1300 bp product (pA3 in Fig.1B) corresponds to the usage of distal AAUAAA hexamers, pA3a and b (represented in Fig.1C as pA3). To evaluate the level of conservation of the identified PAS, alignment of the CD5 genomic sequences (Ensembl) from seven representative mammalian species was performed using the Geneious v4.8 software (43) (Fig. 1D). Conservation of the three groups of PAS decreases from the proximal to the distal. Interestingly, although the sequences of human pA3a and pA3b correspond to the canonical signal AAUAAA, which has been reported as the most frequently used (44), these are the least conserved.
Figure 1. Identification and characterization of CD5 alternative polyadenylated mRNAs.
(A) Schematic representation of human CD5 gene and PAS (snapshot of UCSC Genome Browser, March 2015: https://genome.ucsc.edu/). Reported PAS from PolyA DB are indicated by vertical lines at the 3′ end of the gene. (B) CD5 3′ RACE representative gel using resting Jurkat E6.1 cells and human primary T cells. Three bands corresponding to the CD5 APA mRNA isoforms pA1, pA2 and pA3 are indicated by arrows. NTC: PCR non-template control; M: Molecular-weight size marker. (C) CD5 3′ UTR sequence. Arrows represent the cleavage sites of the mRNAs mapped by 3′ RACE and sequencing, PAS are indicated in bold and underlined. pA1 a/b/c corresponds to three close PAS and to band pA1 in panel B; pA2 is indicated in bold and underlined, and corresponds to pA2 in panel B; pA3a/b corresponds to two PAS and to band pA3 in panel B. (D) PAS conservation analysis performed by alignment of the CD5 3′ UTR sequences of seven mammalian species using the Geneious v4.8 software. PAS pairwise percentage identity is indicated. (B and C) Data shown are representative of 2 independent experiments.
Activated T cells preferentially use CD5 proximal PAS and produce higher CD5 protein levels
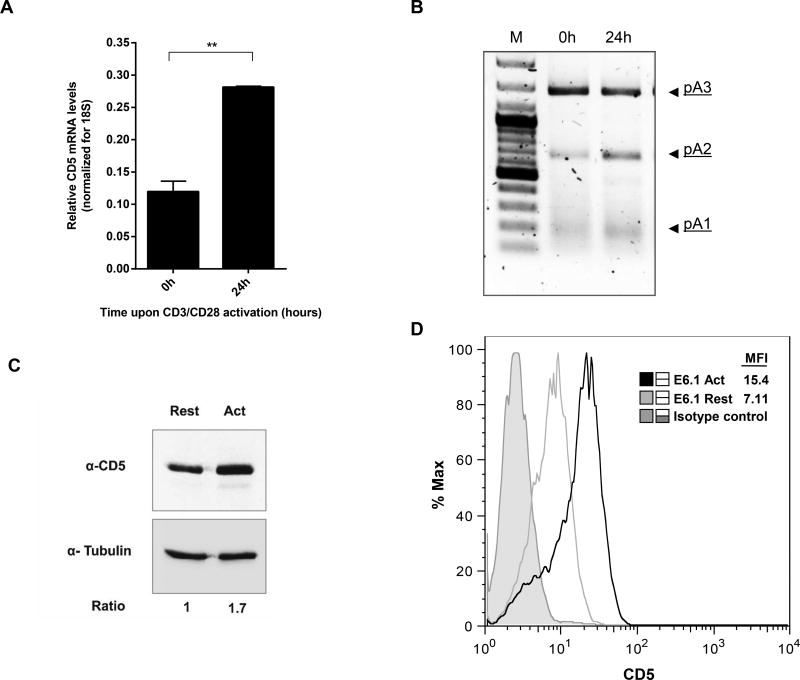
A global increase in the relative steady-state expression of mRNAs using the most proximal PAS has been reported to occur upon T-cell activation in both mice (28) and humans (40), however, this does not globally correspond to an increase in protein production (40). To investigate how CD5 APA impacts protein expression, we measured CD5 relative expression in resting and activated cells. Using RT-qPCR we show that aggregate CD5 mRNA expression is increased in activated T cells relative to the resting condition (Fig. 2A). Having established that the pattern of expression of CD5 mRNAs is similar in the Jurkat cell line and ex-vivo primary T lymphocytes (Fig. 1B), we assessed the relative expression of CD5 APA isoforms in activated Jurkat cells in comparison to the resting cells condition, by 3’ RACE (Fig. 2B). Upon 24h of activation with a combination of CD3 and CD28 mAb, we observed a bulk increase of the CD5 mRNA levels; CD5 Total pA mRNA showed a ~2-fold increase (Fig. 2A). However, we additionally observed an increase in the intensity of the bands correspondent to the shorter mRNAs (pA1 and pA2), suggesting that they are specifically increased in comparison to resting condition (Fig. 2B).
Figure 2. T-cell activation increases CD5 mRNAs and protein expression.
(A-D) Jurkat E6.1 cells were activated with anti-CD3 (OKT3) and anti-CD28 (28.2) or left untreated. (A) CD5 expression was determined by qRT-PCR in resting (0h) and upon 24h activation. Data is shown as mean +SD of three replicates pooled from 2 independent experiments. **p < 0.01; Student’s t-test. (B) 3'RACE of CD5 in resting (0h) and activated Jurkat cells (24h). (C) A representative western blot of CD5, detected using a monoclonal rabbit anti-human CD5 antibody. A mouse monoclonal anti-tubulin antibody was used to detect tubulin as a loading control. The ratios were determined using band densitometry. Blots are representative of 2 independent experiments. (D) FACS profile for CD5 cell surface expression in resting and activated (with anti-CD3/CD28) Jurkat E6.1 cells. Data shown are representative of 3 independent experiments
To ascertain the correspondence between changes in CD5 mRNA species and protein production during T-cell activation, we measured CD5 protein levels by immunoblot and flow cytometry in resting and activated Jurkat cells. As shown in Fig. 2C, there is a ~1.7 increase in total CD5 protein levels upon T-cell activation. This corresponds to a similar increase of CD5 (~2 fold) at the cell surface as shown by FACS after CD3/CD28 activation (Fig. 2D). Cells were confirmed to be in an activated state by the enhanced expression of the activation marker CD69 (Supporting Information Fig. 1). Therefore, the overall increase on mRNA levels upon T-cell activation, in particular those correspondent to proximal PAS usage, is accompanied by augmented levels of CD5 protein (absolute and at the cell surface).
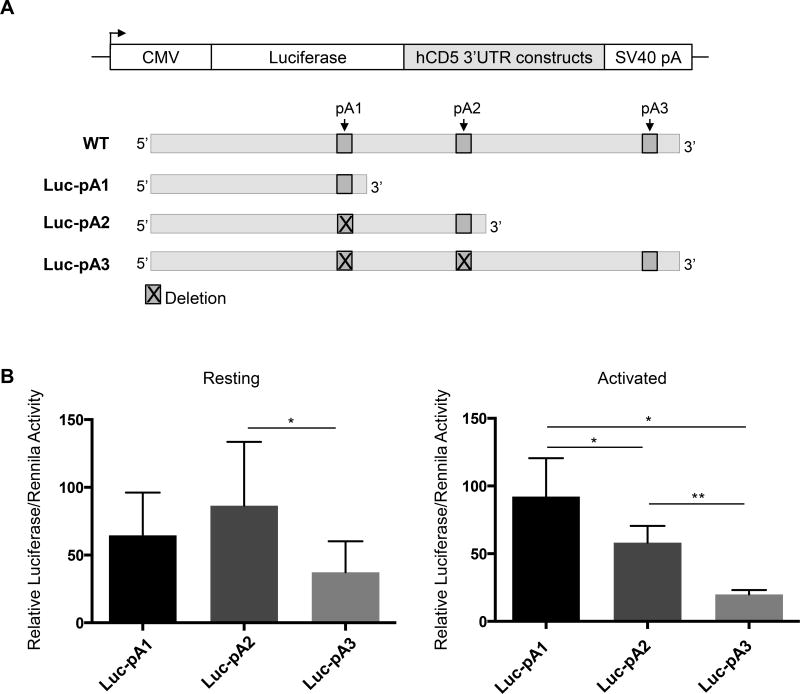
To understand the impact of the different CD5 3´ UTRs due to APA on protein expression in resting and activated cells, we subcloned the DNA fragments corresponding to the three different CD5 3´ UTRs downstream of a luciferase reporter gene. To ensure that we were assessing translational activity independently of cleavage and polyadenylation activity, we fused a strong SV40 PAS at the end of each CD5 3′ UTR. The alternative PAS were deleted by site-directed mutagenesis in the longer constructs to ensure usage of the SV40 PAS. The resulting constructs were named Luc-pA1, Luc-pA2 and Luc-pA3 (Fig. 3A). We confirmed that only the relevant mRNA was produced from each construct and that the endogenous CD5 PASs were inactivated via 3′ RACE (Supporting Information Fig. 2). These constructs were transiently transfected into Jurkat cells, either resting or activated with CD3/CD28, and the activity of the reporters was quantified via dual-luciferase assay, using Renilla (which was co-transfected together with firefly luciferase) as a control (Fig. 3B). The longest isoform (Luc-pA3) displayed significantly lower levels of Luciferase activity in resting and activated cells, compared with the shorter isoforms (Luc-pA1 and Luc-pA2, Fig. 3B), suggesting that shorter 3′ UTRs confer increased protein expression to the native CD5 mRNA transcripts. Although in resting cells Luc-pA1 and Luc-pA2 yielded similar luciferase levels, in activated cells Luc-pA1 originates significantly higher protein levels than Luc-pA2 (P <0.05). These results indicate that the 3′ UTR derived from pA1 usage produces increased amounts of protein in activated T cells.
Figure 3. Different CD5 3′ UTRs modulate protein activity in a T-cell activation dependent manner.
(A) Schematic representation of the three different CD5 3′ UTR luciferase reporter constructs that were transiently transfected in Jurkat E6.1 cells. To assure that each isoform was expressed and used the corresponding PAS at the end of the 3′ UTR, proximal PAS were deleted from Luc-pA2 and Luc-pA3. All constructs contain the SV40 PAS downstream of the CD5 3′ UTR to assure that the transcript is efficiently terminated. (B) Luciferase activity was measured in resting and activated (with anti-CD3/CD28) Jurkat E6.1 by a Synergy 2 Multi-Mode Microplate Reader. Levels of Luciferase activity were normalized for the levels of Renilla activity (control). Data are shown as mean +SD (n= 3 replicates) and are pooled from 3 independent experiments. *p<0.05, **p<0.01; Student’s t-test.
PTBP1 modulates CD5 mRNA levels
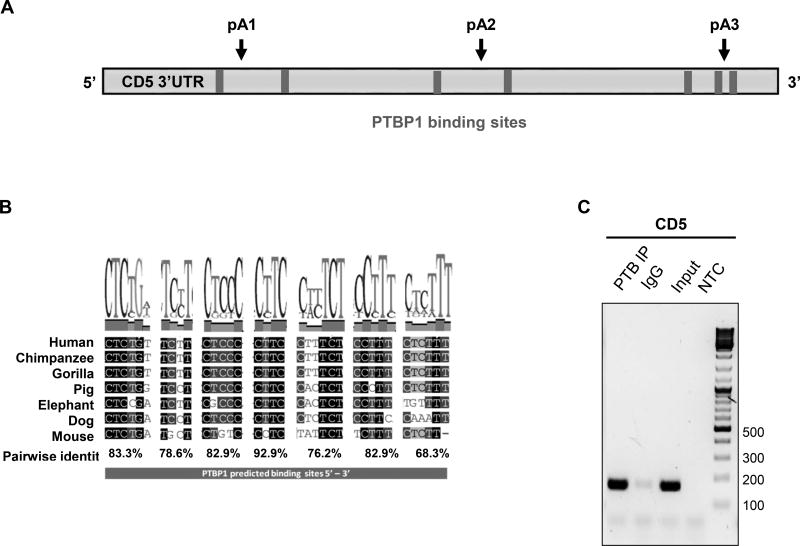
Several RNA binding proteins (RBPs) bind to the 3´UTR of pre-mRNAs and function in mRNA 3´ end processing. A subset of these RBPs are emerging as multifunctional regulators of lymphocyte development and function (45). To implicate candidate RBPs as regulators of CD5 APA, we used the SFmap predictor (46) (Suppl. Fig. 3). We found that CD5 3´ UTRs displayed predicted binding sites for several RBPs, including for PTBP1 (score > 0.8; Fig. 4A), a multifunctional protein that regulates alternative splicing (reviewed in (33)), mRNA 3´ end formation (34–39, 47) and APA (36, 38). Importantly, more than half of the predicted nucleotides of PTBP1 binding site are conserved between seven representative mammalian species, all displaying a high pairwise identity (Fig. 4B).
Figure 4. PTBP1 increases CD5 pA1 mRNA levels.
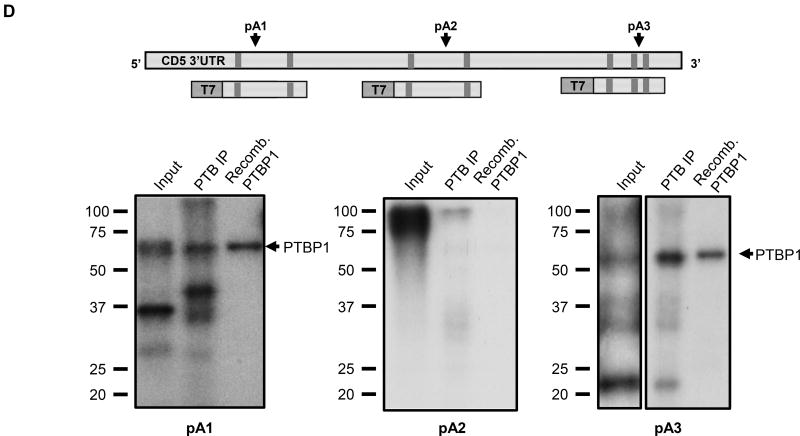
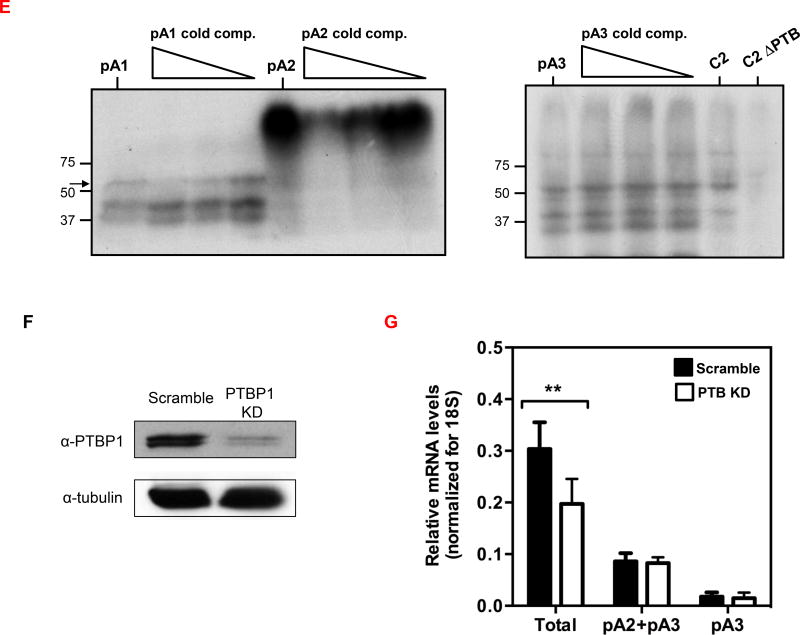
(A) PTBP1 putative binding sites were predicted in the CD5 3′ UTR sequence using SFmap predictor. Sequences with scores higher than 0.8 (0–1 range) are indicated. Arrows represent the PAS location on CD5 3′ UTR. (B) Conservation analysis of the seven putative PTBP1 binding sites performed by alignment of the CD5 3′ UTR sequences of seven representative mammalian species using the Geneious v4.8 software. Pairwise percentage identities are indicated. (C) RNA immunoprecipitation using an anti-PTBP1 antibody and analyzed by RT-PCR. Primers were designed in the proximity of CD5 pA1. (D) Top: schematic representation of the three DNA fragments used in the RNA in vitro transcription with the T7 promoter. Bottom: UV-crosslinking and immunoprecipitation assays using Jurkat nuclear extracts. First lane of each gel: input of UV-crosslinking samples; second lane: immunoprecipitation with anti-PTBP1 antibody after UV crosslinking; third lane: UV-crosslinking assay using recombinant PTBP1. (E) UV-crosslinking competition assays. Each radiolabeled pA1, pA2 and pA3 was incubated with 10, 5 and 1-fold molar excess of unlabeled pA1, pA2 and pA3 competitor transcript (Cold comp.). C2 and C2ΔPTB were used as positive and negative controls for PTB binding, respectively. (C-E) Data shown are representative of 2 independent experiments. (F) Knock-down of PTBP1 in Jurkat cells assessed by western blot using a PTBP1 specific antibody. An anti-α-tubulin antibody was used as loading control. (G) Relative expression of CD5 APA mRNA isoforms after PTBP1 knock-down (PTB KD). A Scramble sequence was used as control. Data are shown as mean + SD and are pooled from 4 independent experiments. ** p<.01; two-way ANOVA with Turkey’s multiple comparison test.
As PTBP1 has been shown to function in APA and the CD5 3´UTR contains PTBP1 predicted binding sites, we sought to investigate whether this RNA binding protein could modulate CD5 APA. First, we tested PTBP1 binding to CD5 mRNA, by RNA immunoprecipitation (RIP) assays, using primers in the vicinity of pA1. As depicted in Fig. 4C, PTBP1 binds to CD5 mRNA. Negative control mRNAs for PTB binding (ARRDC2 and DCAF4) were chosen using published (48)and unpublished PTB iCLIP data-sets (Elisa Monzon-Casanova, personal communication). We found that PTBP1 does not bind ARRDC2 by RIP in Jurkat and therefore used this as a negative control (Supporting Information Fig. 4)
Protein-RNA interactions can be detected by UV crosslinking assays where a radiolabeled RNA is incubated with a protein extract and the mixture is UV irradiated. UV radiation forms covalent bonds between the RNA and the proteins that are bound to, or in close proximity of the RNA. Proteins of interest can then be immunoprecipitated (CLIP method) from the mixture and separated by SDS-PAGE (49). To confirm PTBP1 binding in the predicted sites in CD5 3′ UTR, we thus performed UV-crosslinking as in (35), using the region in the vicinity of the three PAS as pre-mRNA templates with Jurkat nuclear extracts and with recombinant PTBP1 (Fig. 4D). Immunoprecipitation after UV crosslinking with anti-PTBP1 antibody showed that PTBP1 binds nearby pA1 and pA3 PAS (Fig. 4D) and this was confirmed using recombinant PTBP1 protein in the UV-crosslinking assays (third lane in each gel). No clear PTBP1 binding was observed for pA2 PAS. To demonstrate the specificity of PTB binding we performed UV crosslinking competition assays, where each radiolabeled RNA template (pA1, pA2 and pA3) was incubated together with increasing amounts of the correspondent unlabeled transcript (10, 5 and 1 fold molar excess). Increasing amounts of pA1 competitor strongly inhibited the crosslinking of PTB to pA1 RNA, without affecting the cross-linking of other proteins (Fig. 4E, left panel). However, pA3 unlabeled competitor used at the same concentrations does not disrupt the protein binding pattern suggesting that PTB binding to pA3 is nonspecific (Fig. 4E, right panel).
The C2 complement mRNA contains a well characterized PTB binding site within an Upstream Sequence Element, USE, localized upstream of its PAS (AUGCUUGUUUCACUUUCAC) (34, 35, 37, 50). Therefore, we used C2 complement (C2) as a positive control and C2ΔPTB, where the PTB binding site was mutated to AAGAAUGAAACACAAACAC (35) as a negative control for PTB binding. As expected, we observed a ~55 kDa protein band (Fig. 4E, right panel, C2 lane, ~55 kDa band), which is not detected when the C2ΔPTB transcript is used (Fig. 4E, right panel, C2ΔPTB lane). Taken together our results show that PTB binds specifically to CD5 pA1.
To investigate a function for PTBP1 in CD5 APA, we knocked-down PTBP1 using two different PTBP1 siRNAs in Jurkat cells. Since PTBP1 was efficiently depleted, as confirmed by mRNA levels (Supporting Information Fig.5) and western blotting (Fig. 4F), we asked whether this RNA binding protein modulates CD5 APA by measuring mRNA isoforms by qRT-PCR in comparison to samples treated with siRNA scrambled control (relative expression presented in Fig. 4G; Statistical analyses were made in relation to scramble control.). Although the expression levels of the longer pA2 and pA3 CD5 mRNA isoforms do not change significantly when PTBP1 is knocked-down, total CD5 mRNA levels significantly decreased by approximately one third, when compared with the scramble control (Fig. 4G). The decrease of total mRNA levels observed without a corresponding reduction of those of the longer mRNA isoforms, suggests that PTBP1 activates pA1 usage or stabilizes the shorter mRNA. Taken together, these results show that PTBP1 binds to CD5 pre-mRNA pA1 and increases pA1 mRNA levels.
The long CD5 mRNA isoform is regulated by miR-204
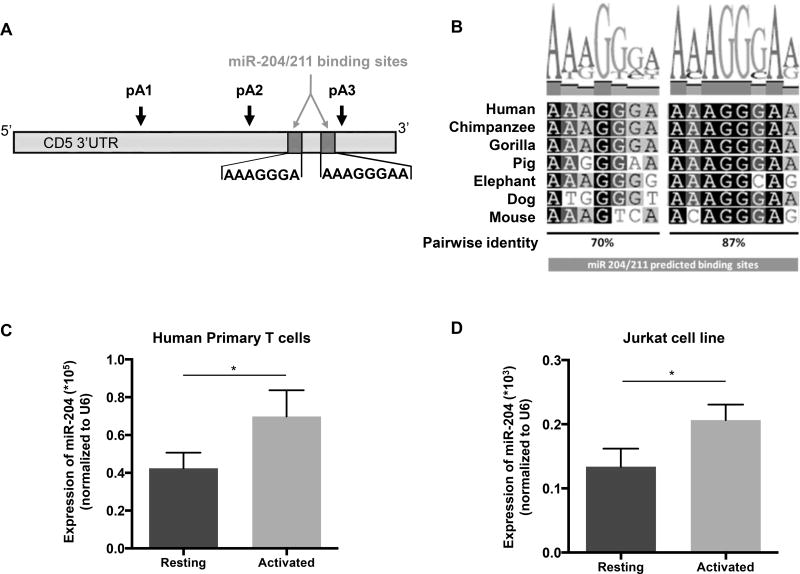
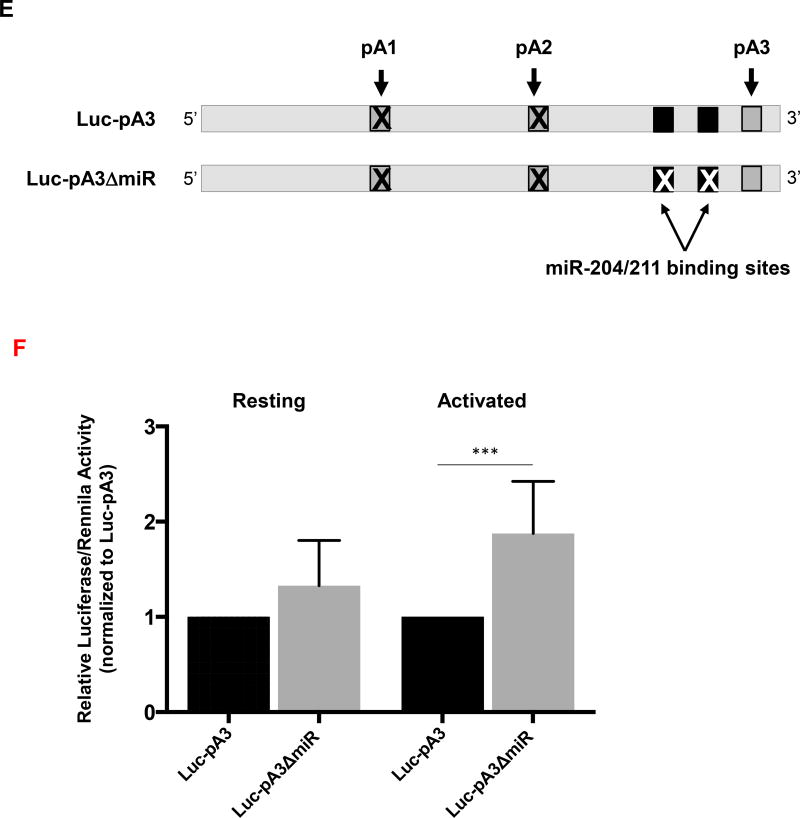
3′ UTRs contain a diverse set of cis-regulatory elements, including microRNA binding sites, which control gene expression. Having shown that the longer CD5 pA3 mRNA isoform originates low levels of luciferase protein (Fig. 3B), we went on to investigate the role of miRNAs in targeting the longer CD5 mRNA isoform. In order to identify potential miRNAS regulating CD5 APA-derived mRNA isoforms, we performed an in silico analysis of CD5 3′ UTR using TargetScanHuman (http://www.targetscan.org/) and found two putative miR-204/211 binding sites (Fig. 5A and Supporting Information Fig. 3). Alignment of the two putative miR-204/211 binding sites in seven mammalian species showed high conservation between mammalian species (≥ 70% pairwise identity) (Fig. 5B). Interestingly, both putative miR-204/211 binding sites target the 3′ UTR of the longer CD5 mRNA isoform produced after pA3 is used. To investigate whether this longer mRNA could be regulated by miR-204/211, we quantified the expression of miR-204 and miR-211 in resting and activated human primary T cells and Jurkat cells, by qRT-PCR. Expression of miR-211 is nearly undetectable (Supporting Information Fig. 6), we thus focused our studies on the function of miR-204 in CD5 expression in T cells. As shown in Fig. 5C and D, the expression of miR-204 is significantly increased upon activation of either human primary T cells or Jurkat cells.
Figure 5. miR-204 is upregulated in activated T cells and targets the longer CD5 APA mRNA isoform.
(A) The miR-204/211 putative binding sites were predicted on TargetScan using CD5 3′ UTR and the seed region sequences are indicated. Arrows represent the PAS location on CD5 3′ UTR. (B) Conservation analysis of miR-204/211 binding sites performed by alignment of the CD5 3′ UTR sequences of seven mammalian species using the Geneious v4.8 software. Pairwise percentage identities are indicated below. (C and D) qRT-PCR analysis of miR-204 expression in resting and activated human primary T cells and Jurkat cells. Data are shown as mean +SD (n= 3 replicates) and are pooled from 3 independent experiments. *p <0.05; Student’s t-test (E) The two miR-204/211 target sites located in the Luc-pA3 luciferase reporter plasmid were deleted by site-directed mutagenesis originating plasmid Luc-pA3ΔmiR. (F) Luciferase activity was quantified 48 hours after transfection of Jurkat in resting and activated state (using anti-CD3/CD28). Data are shown as mean +SD (n= 3 replicates) and are pooled from 3 independent experiments. ***p < 0.001; unpaired t test with Welch's correction.
To characterize the interaction of miR-204 with the longer CD5 mRNA isoform, we modified the Luc-pA3 luciferase reporter construct by deleting the two putative miR-204/211 binding sites within this reporter to generate the Luc-pA3ΔmiR construct (Fig. 5E). The Luc-pA3 and Luc-pA3ΔmiR luciferase reporter constructs were transiently transfected into Jurkat cells and luciferase assays were performed using resting or activated cells as described above. In resting cells, no significant changes in protein expression levels between the different constructs were observed (Fig. 5F) which may be due to miR-204 low levels in resting cells However, in activated cells there is a significant 2-fold increase of luciferase activity between the control and the construct devoid of miRNA binding sites (Fig. 5F). These results indicate that miR-204 targets the longest CD5 mRNA isoform. To elucidate the physiological significance of the pA3 transcript we specifically depleted this isoform using custom made siRNAs and quantified the CD5 protein expression at the T-cell surface. We observed that siRNA depletion of pA3 caused a decrease in CD5 at the cell surface (Supporting Information Fig. 7). Thus, although CD5 shorter 3’ UTRs confer greater expression to reporter constructs, these results demonstrate that the pA3 transcript continues to contribute to the expression of CD5 protein levels at the T-cell surface following stimulation.
Discussion
CD5 deregulation has been studied in the context of autoimmunity and anti-tumoral responses. Given the relevant role of this gene product in human disorders, it is of the utmost importance to elucidate the regulatory mechanisms involved in the control of CD5 expression.
Extracellular stimuli can drive temporal and spatial changes in the mRNA profiles of many genes, contributing to the continuous homeostasis of the cell and ultimately of the organism. A cell submitted to different functional programs such as proliferation, differentiation or development, often undergoes a switch in the PAS used (24, 26, 28), therefore, specific APA patterns resulting from the differential usage of proximal vs distal PAS in the 3´UTR have been correlated with various characteristic cellular states (24, 26, 28).
T cell activation results in a global shift towards the production of mRNAs containing shorter 3´UTRs, presumably due to an increased usage of the proximal PAS in most APA-containing genes (28). By shortening the length of the 3´ UTR, potential cis-regulatory sites are excluded from the transcript, predicting altered post-transcriptional regulation of affected mRNAs. However, if on the one hand there is a substantial number of APA-containing genes whose proximal vs distal PAS usage does not change, on the other hand there is no global correlation between 3´ UTR shortening and increase in protein production (40), be it in T-cell activation or in any other described biological system. For instance, we have shown that in the regulation of the gene polo of Drosophila melanogaster, increased protein production correlates instead with the usage of the longer transcript resulting from the usage of the distal PAS (51).
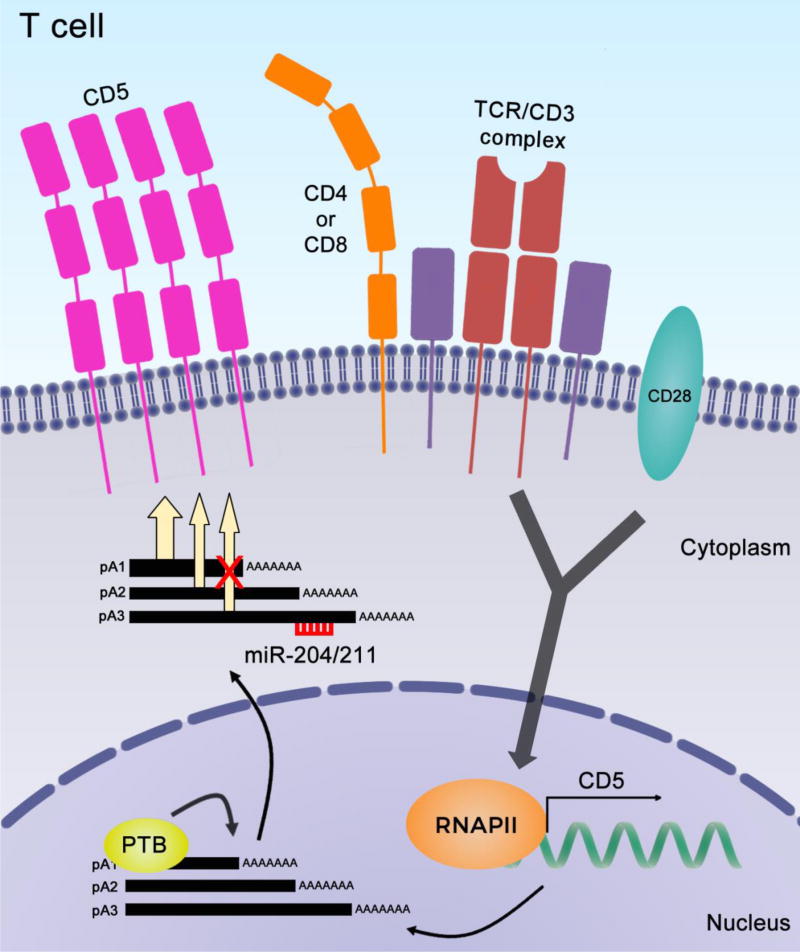
In the present study we used human primary T cells and a Jurkat T-cell line, to show that CD5 protein levels increase upon T-cell stimulation parallel to a complex post-transcriptional regulatory mechanism including PTB, APA, and miR-204 silencing (proposed model in Figure 6). In activated T cells, we observe an overall increase in the aggregate expression of CD5 mRNAs, although the relative expression of the longest CD5 mRNA isoform remains largely unchanged. Indeed, our data suggest that this longest isoform is negatively regulated in the activated state by an increase in relative expression of miR-204, which specifically recognizes the two conserved miRNA binding sites present only in this transcript. The relative increase in CD5 protein expression is thus due to increases in relative expression of the two shorter CD5 mRNA isoforms. While it is likely that both of these mRNAs ultimately contribute to the aggregate protein increase, we demonstrate that PTBP1 plays a direct role in the increase of relative expression of CD5 mRNAs derived from usage of the most coding-sequence proximal pA1, and that the resulting UTR confers the highest expression on a luciferase reporter.
Figure 6. Working model for regulation of CD5 expression in T cells.
CD5 expresses three alternatively polyadenylated CD5 mRNA isoforms that differ in their 3′ UTR length, all contributing for CD5 protein production by different levels. Signaling through the TCR leads to an increase in CD5 mRNAs levels and, in comparison to resting conditions, the shorter isoforms levels are specifically increased. PTBP1 increases the levels of the shorter mRNA either by preferential use of the proximal PAS or by stabilizing this mRNA isoform. The longer CD5 mRNA isoform is targeted by miR-204. These concerted mechanisms of APA, PTB and miR-204 fine-tune CD5 expression during T-cell activation.
We show that at rest, pA2 and pA3 are the predominant CD5 mRNAs (Fig. 1B and Fig. 2B). Upon T-cell activation, there is a ~2-fold increase in CD5 total mRNA levels and a similar increase in CD5 protein production. Although pA2 and pA3 are still the predominant isoforms in activated T cells, by 3’RACE we observe that they specifically increase in comparison to resting cells (Fig. 2B). This could be due to pA1 mRNA having a longer half-life than pA2 and pA3 mRNAs, which fits with a role for PTBP1 in increasing pA1 mRNA levels (Fig. 4) and for miR-204 in pA3 mRNA silencing (Fig. 5). PTBP1 is a multifunctional protein, with well-described functions in splicing, translation, polyadenylation and mRNA stability. In T cells, PTBP1 has been shown to bind to the 3′ UTR of the CD40 ligand (CD154) mRNA, stabilizing it during activation of T cells, which corresponds to the temporal expression of CD154 (52, 53). In other cell types, PTBP1 was shown to bind to cis-elements in the pre-mRNA and modulate PAS usage (34, 36–39, 47, 54, 55). In the case of the C2 complement and pro-thrombin genes, PTBP1 binds to an USE and modulates PAS efficiency (35, 37). Although PTBP1 binds to the vicinity of both pA1 and pA3 on CD5 pre-mRNA, we show that the binding to pA1 is specific, and that PTBP1 depletion results in a decrease of total CD5 mRNA levels. It is possible that this effect is due to preferential selection of pA1 or stabilization of this mRNA by PTBP1, resulting in an increase in mRNA levels. These results are consistent with a model in which PTBP1 activates CD5 expression by modulating the levels of CD5 mRNA isoforms. Predictably, many other factors and elements may contribute to the regulation of CD5 transcription and translation. For instance, PTBP1 may associate with different proteins or complexes whether binding to the vicinity of pA1 or pA3, as suggested by the UV-crosslinking results. miR-204 is involved in the regulation of multiple functions in different cell types. Namely, it is important to regulate multiple aspects of eye development being expressed at high levels in human and mouse retinal pigment epithelium (56, 57). Several studies have also shown that miR-204 is frequently down regulated in human cancers suggesting a function as a tumor suppressor in colorectal cancer (58), non-small cell lung cancer (59), in pancreatic cancer (60) and renal cell carcinoma (61), among others. We found that in T cells miR-204 targets the longest CD5 mRNA isoform, itself derived from distal PAS usage. We also found that pA3 siRNA depletion leads to a considerable decrease in CD5 protein levels (Supporting Information Fig 7). Although shorter CD5 3’ UTRs are responsible for augmented Luciferase protein production in reporter assays in comparison with longer 3’ UTRs, the results of the siRNA experiments are explained by the fact that the longest CD5 mRNA isoform is still the predominant mRNA isoform upon T-cell activation (Fig. 2B). Therefore, in pA3 siRNA depleted cells the shorter transcripts cannot compensate for the loss of pA3 mRNA because a large proportion of the total CD5 mRNA has been lost, resulting therefore in a decrease in CD5 protein levels.
Taken together, our results lead us to propose a working model where TCR-mediated activation causes an increase in CD5 protein at the T-cell surface, which is due to the combined action of several mechanisms (Figure 6). Overall CD5 transcription is increased leading to the production of three mRNA isoforms by APA all contributing, at different levels, for protein production. PTBP1 binds in the vicinity of pA1 leading to an increase in mRNA levels and miR-204 targets the longer CD5 mRNA. All these molecular mechanisms contribute to the increased CD5 protein expression observed in activated T cells.
The complex array of regulation that we observe in this context is perhaps a hallmark of the very precise and fine regulation that key regulatory proteins such as CD5 must have to guarantee an adequate yet balanced response to an activating stimulus. In contrast to immune activation response genes, which can be thought of to be expressed in transient or even binary fashion, basal levels of CD5 transcription are set during thymic education and stably maintained in the absence of antigen receptor engagement. Yet once productive antigen receptor engagement occurs, the relative expression and thus activity of CD5 must be finely modulated in response to the strength of the signal emanating from the receptor. The model that we put forth here allows for modulation of CD5 protein expression in both directions. Recognition of the longest CD5 mRNA isoform (which is the predominant species in unstimulated cells) by miR-204 allows negative regulation of CD5 protein expression, whereas PTB-mediated increased production of shorter CD5 mRNAs lacking miR-204 binding sites allows the possibility of increased production of CD5 protein, even in the context of simultaneous negative regulation. Given the central role of CD5 in the regulation of immune responses and its impact on autoimmunity and cancer (62, 63), a detailed description of the genetic mechanisms and the responsive elements and factors regulating the expression of CD5 in an activation-dependent manner is crucial to devise therapies to address CD5-dependent human diseases.
Materials and Methods
Human primary T-cell isolation
Buffy coats from healthy donors were provided by Hospital São João, Serviço de Imunohemoterapia (Porto, Portugal). T cells were extracted with the Easysep Human T-cell Enrichment Kit (StemCell Technologies) from peripheral blood mononuclear cells (PBMCs) previously isolated using Lympholyte-H (Cedarlane Laboratories) as described by the manufacturer.
Cell culture and T-cell activation
Jurkat E6.1 cells were grown and maintained at 37˚C with 5% of CO2 in RPMI 1640 Medium with GlutaMAX, supplemented with 10% heat-inactivated FBS and 1X Penicillin-Streptomycin (10,000 U/mL) (Gibco, Life Technologies). For T-cell stimulation, cultures were activated with 5 µg/mL of anti-CD3 (eBioscience) and 2 µg/mL of anti-CD28 antibodies (eBioscience).
Flow Cytometry
Cells were washed and resuspended in FACS buffer (1X PBS, 0.2% BSA, 0.1% NaN3). 5×10⁵ cells/well were incubated on ice with mAbs according to manufacturer’s instructions. After 40 min, cells were washed twice with FACS buffer and resuspended in 400 µL of 1X PBS for analysis on a FACS Calibur (Becton Dickinson). Antibodies: mouse PE-labeled monoclonal anti-human CD5-FITC (Abcam), mouse monoclonal CD69-PE (MACS); and FITC mouse IgG2a and PE mouse IgG1 (BD) as isotype controls.
RNA extraction and qRT-PCR
RNA was extracted using PureLink RNA Mini Kit (Ambion) following the manufacturer’s protocol and treated with DNase I (Roche) by the On-column PureLink DNase Treatment Protocol. cDNA was synthesized using Superscript III reverse transcriptase (Life Technologies) and random hexamers (Sigma) according to the Superscript III manufacturer’s protocol. qRT-PCR reactions were performed using SYBR Select Master Mix (Applied Biosystems) following the manufacturer’s instructions and the primers listed in Table S1. The qRT-PCR results were analyzed using the ΔCt method (Relative expression) or the ΔΔCt method (Normalized fold expression) (64) using 18S as the reference gene.
qRT-PCR for miRNA quantification
RNA was isolated by mirVanaTM RNA isolation kit (Life technologies). cDNA synthesis was made using 10 ng of total RNA using the TaqMan MicroRNA Reverse Transcription Kit (Life technologies) according to the manufacturer’s protocol. Real-time PCR for miRNA quantification was performed using TaqMan MicroRNA Assay kit (Applied Biosystems) according to the manufacturer’s protocol; U6 spliceosomal RNA was used for normalization. The relative expression level of miR-204 was normalized to that of the U6 internal control by using the 2−ΔΔCt cycle threshold method.
3′ RACE and CD5 mRNA isoforms mapping
cDNA was synthesized from Jurkat E6.1 and primary human T cells total RNA using the SMARTer RACE cDNA Amplification kit (Clontech) with the SMARTScribe™ Reverse Transcriptase. First and nested PCR reactions were performed with Phusion DNA Polymerase (Thermo Scientific) following the manufacturer’s protocols. The forward gene-specific primers RACE kit Fw1 and RACE kit Fw2 (Table S1) were designed according to kit protocol’s specificities. Nested PCR purified products were cloned into pCR2.1-TOPO vector using the TOPO-TA Cloning® Kit (Life Technologies) according to the manufacturer’s protocol. Plasmid DNA was extracted using PureLink Quick Plasmid Miniprep Kit (Life Technologies), following the manufacturer’s procedure and sequenced in GATC Biotech.
Human CD5 3′ UTR constructs
The IRES-GFP sequence was removed from pIRES2-EGFP using BamHI and NotI (New England Biolabs) and the hCD5 3′ UTR was inserted into SmaI to produce pIRES2-CD5_3´ UTR. Luciferase was obtained by PCR reaction from pAc5.1V5HisA Firefly plasmid using phosphorylated primers with NheI and XhoI restriction sites at the 5′ and 3′ end and inserted into pIRES2-CD5_3′ UTR. Final construct was named hCD5 3′ UTR wt. The different constructs containing the different CD5 3′ UTRs were obtained using site-directed mutagenesis and standard PCR techniques.
Cell Transfection
Jurkat E6.1 cells were transfected using Amaxa® Cell Line Nucleofector® Kit V (Lonza) and the X-005 program on the Nucleofector® Device, following manufacturer’s guidelines. For the Luciferase assays, 1.7 µg of construct and 0.5 µg of pcDNA-renilla plasmid were transfected. For PTBP1 knockdown two small interfering RNAs (siRNAs) (Sigma-Aldrich; PTBP1#1: 5′-GCACAGUGUUGAAGAUCAU-3′ and PTBP1#2: 5′-AACUUCCAUCAUUCCAGAGAA-3′) were transfected in a final concentration of 300 nM and cells were incubated for 48 h. A scramble sequence was used as negative control (GenePharma; 5′-UUCUCCGAACGUGUCACGU-3′).
For CD5 pA3 isoform knockdown a custom made siRNAs (Dharmacon; siCD5: 5′-GGUCCAAGCCGCAUAAUAAUU-3′) was transfected in a final concentration of 300 nM and cells were incubated for 60 h. A scramble sequence (siScramble) was used as negative control (GenePharma; 5′-UUCUCCGAACGUGUCACGU-3′).
Luciferase Assays
The Dual-Luciferase Reporter Assay kit (Promega) was used following the manufacturer’s protocol. Ninety µL of LAR II and 30 µL of PLB (Passive Lysis Buffer) lysate were added to the 96-well plate, and the Firefly Luciferase activity was measured 3 times with shaking in-between reads in a Synergy 2 Multi-Mode Microplate Reader (BioTek). Subsequently, 85 µL of STOP &Glo Reagent were added and Renilla Luciferase activity was measured by the same procedure. In these experiments a plasmid containing the renilla gene was used as a control and co-transfected together with the experimental luciferase plasmid. The renilla allows to monitor transfection efficiency and cell viability, which may impact the delivery of the plasmid to the nucleus of the cell and transcription.
Western blotting
Whole-cell lysates were resolved into a 10% SDS-PAGE, transferred with the iBlotgel device (Life Technologies) and the membrane incubated with anti-human PTBP1 rabbit polyclonal antibody diluted 1:5000 in TBS-0.2%Tween 20 containing 3% nonfat dried milk and with the goat anti-rabbit IgG-HRP secondary antibody (Santa Cruz Biotechnologies). Detection was made using enhanced luminescence (ECL Prime; GE Healthcare).
CD5 was detected using a monoclonal rabbit anti-human CD5 antibody and a HRP-coupled goat anti-rabbit secondary antibody. A mouse monoclonal anti-tubulin antibody followed by an HRP-coupled goat anti- mouse antibody were used to detect tubulin as a loading control.
RNA immunoprecipitation
RNA immunoprecipitation (RIP) with anti-hPTBP1 rabbit polyclonal antibody was performed using the EZ-MagnaRIP RNA-Binding Protein Immunoprecipitation Kit (Merck Millipore), following the manufacturer’s guidelines. The purified immunoprecipitated RNA was analyzed by RT-PCR using the primers RIP-CD5 Fw and RIP-CD5 Rev (Table S1).
UV-crosslinking immunoprecipitation assays
Radiolabeled probes and unlabeled (cold) RNA competitors were produced by in vitro transcription and UV crosslinking assays were performed as previously described (35)using 40 mg of Jurkat E6.1 nuclear extracts, prepared using the NE-PER nuclear and cytoplasmic extraction reagent Kit (Pierce) following the manufacturer’s protocol, or 500 ng of recombinant histidine-tagged PTBP1.For the competition assays, 1µl of RNA competitor with the appropriate concentration was added (10, 5 and 1-fold molar excess). For immunoprecipitation, 5 µL of the anti-hPTBP1 antibody, 100 µl Protein A Sepharose beads 50% slurry (Sigma-Aldrich) and 1 mL of IP-2 buffer (50 mM Tris-HCl [pH 7.9], 50 mM NaCl and 0.1% NP-40 [v/v]) were added to 50 µl of cross-linked material. The samples were separated on a 10% SDS-PAGE and exposed to a radiographic film. pA1, pA2 and pA3 DNAs for in vitro transcription were prepared by PCR using specific primers containing a T7 RNA polymerase promoter. C2 and C2ΔPTB plasmids were previously described (35).
Statistical analysis
Data presented in the graphics are from at least two independent experiments and presented as mean ± S.D. (standard deviation). Two-tailed Student’s t-test or two-way ANOVA with Turkey’s multiple comparison test was used to test differences. P values <0.05 were considered statistically significant and * p<0.05, ** p<0.01, *** p<0.001 and **** p<0.0001.
Supplementary Material
Acknowledgments
We thank Hospital São João, Serviço de Imunohemoterapia for the buffy coats and Chris Smith, Simon Davis, Nicholas Proudfoot, Bin Tian, Elisa Izaurralde, Elisa Monzon-Casanova, Miguel Coelho and Margarida Gama-Carvalho for kindly providing reagents and helpful discussions. We are very grateful to Jaime Freitas for helping with model drawing, and all current and past members of the laboratories for helpful suggestions.
Funding
This work was funded by FEDER - Fundo Europeu de Desenvolvimento Regional funds through the COMPETE 2020 - Operacional Programme for Competitiveness and Internationalisation (POCI) Portugal 2020, by Portuguese funds through FCT - Fundação para a Ciência e a Tecnologia/Ministério da Ciência, Tecnologia e Inovação in the framework of the project "Institute for Research and Innovation in Health Sciences" (POCI-01-0145-FEDER-007274), and through the Operational Competitiveness Programme – COMPETE under projects FCOMP-01-0124-FEDER-037277 (PEst-C/SAU/LA0002/2013), FCOMP-01-0124-FEDER-021201 (PTDC/SAU-GMG/116621/2010) and FCOMP-01-0124-FEDER-028252 (PTDC/BEX-BCM/0468/2012). IPC was funded by FCT through a post-doc fellowship with the reference SFRH/BPD/107901/2015. LO was partly funded by a fellowship from the American-Portuguese Biomedical Research Fund. JMF was supported by the Nancy Chang Award for Research Excellence.
Footnotes
Conflict of Interest
The authors have no conflict of interest to declare.
References
- 1.Resnick D, Pearson A, Krieger M. The SRCR superfamily: a family reminiscent of the Ig superfamily. Trends Biochem Sci. 1994;19(1):5–8. doi: 10.1016/0968-0004(94)90165-1. [DOI] [PubMed] [Google Scholar]
- 2.Antin JH, Emerson SG, Martin P, Gadol N, Ault KA. Leu-1+(CD5+) B cells. A major lymphoid subpopulation in human fetal spleen: phenotypic and functional studies. J Immunol. 1986;136(2):505–10. [PubMed] [Google Scholar]
- 3.Thomas Y, Glickman E, DeMartino J, Wang J, Goldstein G, Chess L. Biologic functions of the OKT1 T cell surface antigen. I. The T1 molecule is involved in helper function. J Immunol. 1984;133(2):724–8. [PubMed] [Google Scholar]
- 4.Tarakhovsky A, Kanner SB, Hombach J, Ledbetter JA, Muller W, Killeen N, et al. A role for CD5 in TCR-mediated signal transduction and thymocyte selection. Science. 1995;269(5223):535–7. doi: 10.1126/science.7542801. [DOI] [PubMed] [Google Scholar]
- 5.Bamberger M, Santos AM, Goncalves CM, Oliveira MI, James JR, Moreira A, et al. A new pathway of CD5 glycoprotein-mediated T cell inhibition dependent on inhibitory phosphorylation of Fyn kinase. J Biol Chem. 2011;286(35):30324–36. doi: 10.1074/jbc.M111.230102. [DOI] [PMC free article] [PubMed] [Google Scholar]
- 6.Dennehy KM, Broszeit R, Ferris WF, Beyers AD. Thymocyte activation induces the association of the proto-oncoprotein c-cbl and ras GTPase-activating protein with CD5. Eur J Immunol. 1998;28(5):1617–25. doi: 10.1002/(SICI)1521-4141(199805)28:05<1617::AID-IMMU1617>3.0.CO;2-7. [DOI] [PubMed] [Google Scholar]
- 7.Perez-Villar JJ, Whitney GS, Bowen MA, Hewgill DH, Aruffo AA, Kanner SB. CD5 negatively regulates the T-cell antigen receptor signal transduction pathway: involvement of SH2-containing phosphotyrosine phosphatase SHP-1. Mol Cell Biol. 1999;19(4):2903–12. doi: 10.1128/mcb.19.4.2903. [DOI] [PMC free article] [PubMed] [Google Scholar]
- 8.Azzam HS, Grinberg A, Lui K, Shen H, Shores EW, Love PE. CD5 expression is developmentally regulated by T cell receptor (TCR) signals and TCR avidity. J Exp Med. 1998;188(12):2301–11. doi: 10.1084/jem.188.12.2301. [DOI] [PMC free article] [PubMed] [Google Scholar]
- 9.Azzam HS, DeJarnette JB, Huang K, Emmons R, Park CS, Sommers CL, et al. Fine tuning of TCR signaling by CD5. J Immunol. 2001;166(9):5464–72. doi: 10.4049/jimmunol.166.9.5464. [DOI] [PubMed] [Google Scholar]
- 10.Fulton RB, Hamilton SE, Xing Y, Best JA, Goldrath AW, Hogquist KA, et al. The TCR’s sensitivity to self peptide-MHC dictates the ability of naive CD8(+) T cells to respond to foreign antigens. Nat Immunol. 2015;16(1):107–17. doi: 10.1038/ni.3043. [DOI] [PMC free article] [PubMed] [Google Scholar]
- 11.Mandl JN, Monteiro JP, Vrisekoop N, Germain RN. T cell-positive selection uses self-ligand binding strength to optimize repertoire recognition of foreign antigens. Immunity. 2013;38(2):263–74. doi: 10.1016/j.immuni.2012.09.011. [DOI] [PMC free article] [PubMed] [Google Scholar]
- 12.Weber KS, Li QJ, Persaud SP, Campbell JD, Davis MM, Allen PM. Distinct CD4+ helper T cells involved in primary and secondary responses to infection. Proc Natl Acad Sci U S A. 2012;109(24):9511–6. doi: 10.1073/pnas.1202408109. [DOI] [PMC free article] [PubMed] [Google Scholar]
- 13.Berland R, Wortis HH. Origins and functions of B-1 cells with notes on the role of CD5. Annu Rev Immunol. 2002;20:253–300. doi: 10.1146/annurev.immunol.20.100301.064833. [DOI] [PubMed] [Google Scholar]
- 14.Dalloul A. CD5: a safeguard against autoimmunity and a shield for cancer cells. Autoimmun Rev. 2009;8(4):349–53. doi: 10.1016/j.autrev.2008.11.007. [DOI] [PubMed] [Google Scholar]
- 15.Axtell RC, Webb MS, Barnum SR, Raman C. Cutting edge: critical role for CD5 in experimental autoimmune encephalomyelitis: inhibition of engagement reverses disease in mice. J Immunol. 2004;173(5):2928–32. doi: 10.4049/jimmunol.173.5.2928. [DOI] [PubMed] [Google Scholar]
- 16.Ryan KR, McCue D, Anderton SM. Fas-mediated death and sensory adaptation limit the pathogenic potential of autoreactive T cells after strong antigenic stimulation. J Leukoc Biol. 2005;78(1):43–50. doi: 10.1189/jlb.0205059. [DOI] [PubMed] [Google Scholar]
- 17.Bentley DL. Coupling mRNA processing with transcription in time and space. Nat Rev Genet. 2014;15(3):163–75. doi: 10.1038/nrg3662. [DOI] [PMC free article] [PubMed] [Google Scholar]
- 18.Proudfoot NJ, Furger A, Dye MJ. Integrating mRNA processing with transcription. Cell. 2002;108(4):501–12. doi: 10.1016/s0092-8674(02)00617-7. [DOI] [PubMed] [Google Scholar]
- 19.Wahle E, Ruegsegger U. 3'-End processing of pre-mRNA in eukaryotes. FEMS Microbiol Rev. 1999;23(3):277–95. doi: 10.1111/j.1574-6976.1999.tb00400.x. [DOI] [PubMed] [Google Scholar]
- 20.Zhao J, Hyman L, Moore C. Formation of mRNA 3' ends in eukaryotes: mechanism, regulation, and interrelationships with other steps in mRNA synthesis. Microbiol Mol Biol Rev. 1999;63(2):405–45. doi: 10.1128/mmbr.63.2.405-445.1999. [DOI] [PMC free article] [PubMed] [Google Scholar]
- 21.Tian B, Graber JH. Signals for pre-mRNA cleavage and polyadenylation. Wiley Interdiscip Rev RNA. 2012;3(3):385–96. doi: 10.1002/wrna.116. [DOI] [PMC free article] [PubMed] [Google Scholar]
- 22.Hoque M, Ji Z, Zheng D, Luo W, Li W, You B, et al. Analysis of alternative cleavage and polyadenylation by 3' region extraction and deep sequencing. Nat Methods. 2013;10(2):133–9. doi: 10.1038/nmeth.2288. [DOI] [PMC free article] [PubMed] [Google Scholar]
- 23.Flavell SW, Kim TK, Gray JM, Harmin DA, Hemberg M, Hong EJ, et al. Genome-wide analysis of MEF2 transcriptional program reveals synaptic target genes and neuronal activity-dependent polyadenylation site selection. Neuron. 2008;60(6):1022–38. doi: 10.1016/j.neuron.2008.11.029. [DOI] [PMC free article] [PubMed] [Google Scholar]
- 24.Ji Z, Lee JY, Pan Z, Jiang B, Tian B. Progressive lengthening of 3' untranslated regions of mRNAs by alternative polyadenylation during mouse embryonic development. Proc Natl Acad Sci U S A. 2009;106(17):7028–33. doi: 10.1073/pnas.0900028106. [DOI] [PMC free article] [PubMed] [Google Scholar]
- 25.Licatalosi DD, Mele A, Fak JJ, Ule J, Kayikci M, Chi SW, et al. HITS-CLIP yields genome-wide insights into brain alternative RNA processing. Nature. 2008;456(7221):464–9. doi: 10.1038/nature07488. [DOI] [PMC free article] [PubMed] [Google Scholar]
- 26.Mayr C, Bartel DP. Widespread shortening of 3'UTRs by alternative cleavage and polyadenylation activates oncogenes in cancer cells. Cell. 2009;138(4):673–84. doi: 10.1016/j.cell.2009.06.016. [DOI] [PMC free article] [PubMed] [Google Scholar]
- 27.Miura P, Shenker S, ndreu-Agullo C, Westholm JO, Lai EC. Widespread and extensive lengthening of 3' UTRs in the mammalian brain. Genome Res. 2013;23(5):812–25. doi: 10.1101/gr.146886.112. [DOI] [PMC free article] [PubMed] [Google Scholar]
- 28.Sandberg R, Neilson JR, Sarma A, Sharp PA, Burge CB. Proliferating cells express mRNAs with shortened 3' untranslated regions and fewer microRNA target sites. Science. 2008;320(5883):1643–7. doi: 10.1126/science.1155390. [DOI] [PMC free article] [PubMed] [Google Scholar]
- 29.Di GDC, Nishida K, Manley JL. Mechanisms and consequences of alternative polyadenylation. Mol Cell. 2011;43(6):853–66. doi: 10.1016/j.molcel.2011.08.017. [DOI] [PMC free article] [PubMed] [Google Scholar]
- 30.Danckwardt S, Hentze MW, Kulozik AE. 3' end mRNA processing: molecular mechanisms and implications for health and disease. The EMBO journal. 2008;27(3):482–98. doi: 10.1038/sj.emboj.7601932. [DOI] [PMC free article] [PubMed] [Google Scholar]
- 31.Elkon R, Ugalde AP, Agami R. Alternative cleavage and polyadenylation: extent, regulation and function. Nat Rev Genet. 2013;14(7):496–506. doi: 10.1038/nrg3482. [DOI] [PubMed] [Google Scholar]
- 32.Lutz CS, Moreira A. Alternative mRNA polyadenylation in eukaryotes: an effective regulator of gene expression. Wiley Interdiscip Rev RNA. 2011;2(1):22–31. doi: 10.1002/wrna.47. [DOI] [PubMed] [Google Scholar]
- 33.Kafasla P, Mickleburgh I, Llorian M, Coelho M, Gooding C, Cherny D, et al. Defining the roles and interactions of PTB. Biochem Soc Trans. 2012;40(4):815–20. doi: 10.1042/BST20120044. [DOI] [PubMed] [Google Scholar]
- 34.Castelo-Branco P, Furger A, Wollerton M, Smith C, Moreira A, Proudfoot N. Polypyrimidine tract binding protein modulates efficiency of polyadenylation. Mol Cell Biol. 2004;24(10):4174–83. doi: 10.1128/MCB.24.10.4174-4183.2004. [DOI] [PMC free article] [PubMed] [Google Scholar]
- 35.Moreira A, Takagaki Y, Brackenridge S, Wollerton M, Manley JL, Proudfoot NJ. The upstream sequence element of the C2 complement poly(A) signal activates mRNA 3′ end formation by two distinct mechanisms. Genes Dev. 1998;12(16):2522–34. doi: 10.1101/gad.12.16.2522. [DOI] [PMC free article] [PubMed] [Google Scholar]
- 36.Costessi L, Porro F, Iaconcig A, Nedeljkovic M, Muro AF. Characterization of the distal polyadenylation site of the ss-adducin (Add2) pre-mRNA. PLoS One. 2013;8(3):e58879. doi: 10.1371/journal.pone.0058879. [DOI] [PMC free article] [PubMed] [Google Scholar]
- 37.Danckwardt S, Kaufmann I, Gentzel M, Foerstner KU, Gantzert AS, Gehring NH, et al. Splicing factors stimulate polyadenylation via USEs at non-canonical 3' end formation signals. The EMBO journal. 2007;26(11):2658–69. doi: 10.1038/sj.emboj.7601699. [DOI] [PMC free article] [PubMed] [Google Scholar]
- 38.Hall-Pogar T, Liang S, Hague LK, Lutz CS. Specific trans-acting proteins interact with auxiliary RNA polyadenylation elements in the COX-2 3'-UTR. RNA. 2007;13(7):1103–15. doi: 10.1261/rna.577707. [DOI] [PMC free article] [PubMed] [Google Scholar]
- 39.Millevoi S, Decorsiere A, Loulergue C, Iacovoni J, Bernat S, Antoniou M, et al. A physical and functional link between splicing factors promotes pre-mRNA 3' end processing. Nucleic acids research. 2009;37(14):4672–83. doi: 10.1093/nar/gkp470. [DOI] [PMC free article] [PubMed] [Google Scholar]
- 40.Gruber AR, Martin G, Muller P, Schmidt A, Gruber AJ, Gumienny R, et al. Global 3' UTR shortening has a limited effect on protein abundance in proliferating T cells. Nat Commun. 2014;5:5465. doi: 10.1038/ncomms6465. [DOI] [PubMed] [Google Scholar]
- 41.Spies N, Burge CB, Bartel DP. 3' UTR-isoform choice has limited influence on the stability and translational efficiency of most mRNAs in mouse fibroblasts. Genome Res. 2013;23(12):2078–90. doi: 10.1101/gr.156919.113. [DOI] [PMC free article] [PubMed] [Google Scholar]
- 42.Zhang H, Hu J, Recce M, Tian B. PolyA_DB:a database for mammalian mRNA polyadenylation. Nucleic acids research. 2005;33(Database issue):D116–20. doi: 10.1093/nar/gki055. [DOI] [PMC free article] [PubMed] [Google Scholar]
- 43.Kearse M, Moir R, Wilson A, Stones-Havas S, Cheung M, Sturrock S, et al. Geneious Basic: an integrated and extendable desktop software platform for the organization and analysis of sequence data. Bioinformatics. 2012;28(12):1647–9. doi: 10.1093/bioinformatics/bts199. [DOI] [PMC free article] [PubMed] [Google Scholar]
- 44.Beaudoing E, Freier S, Wyatt JR, Claverie JM, Gautheret D. Patterns of variant polyadenylation signal usage in human genes. Genome Res. 2000;10(7):1001–10. doi: 10.1101/gr.10.7.1001. [DOI] [PMC free article] [PubMed] [Google Scholar]
- 45.Turner M, Hodson D. Regulation of lymphocyte development and function by RNA-binding proteins. Curr Opin Immunol. 2012;24(2):160–5. doi: 10.1016/j.coi.2012.01.011. [DOI] [PubMed] [Google Scholar]
- 46.Paz I, Akerman M, Dror I, Kosti I, Mandel-Gutfreund Y. SFmap:a web server for motif analysis and prediction of splicing factor binding sites. Nucleic acids research. 2010;38(Web Server issue):W281–W5. doi: 10.1093/nar/gkq444. [DOI] [PMC free article] [PubMed] [Google Scholar]
- 47.Lou H, Helfman DM, Gagel RF, Berget SM. Polypyrimidine tract-binding protein positively regulates inclusion of an alternative 3'-terminal exon. Mol Cell Biol. 1999;19(1):78–85. doi: 10.1128/mcb.19.1.78. [DOI] [PMC free article] [PubMed] [Google Scholar]
- 48.Coelho MB, Attig J, Bellora N, Konig J, Hallegger M, Kayikci M, et al. Nuclear matrix protein Matrin3 regulates alternative splicing and forms overlapping regulatory networks with PTB. The EMBO journal. 2015;34(5):653–68. doi: 10.15252/embj.201489852. [DOI] [PMC free article] [PubMed] [Google Scholar]
- 49.Ule J, Jensen K, Mele A, Darnell RB. CLIP: a method for identifying protein-RNA interaction sites in living cells. Methods (San Diego, Calif) 2005;37(4):376–86. doi: 10.1016/j.ymeth.2005.07.018. [DOI] [PubMed] [Google Scholar]
- 50.Moreira A, Wollerton M, Monks J, Proudfoot NJ. Upstream sequence elements enhance poly(A) site efficiency of the C2 complement gene and are phylogenetically conserved. The EMBO journal. 1995;14(15):3809–19. doi: 10.1002/j.1460-2075.1995.tb00050.x. [DOI] [PMC free article] [PubMed] [Google Scholar]
- 51.Pinto PA, Henriques T, Freitas MO, Martins T, Domingues RG, Wyrzykowska PS, et al. RNA polymerase II kinetics in polo polyadenylation signal selection. The EMBO journal. 2011;30(12):2431–44. doi: 10.1038/emboj.2011.156. [DOI] [PMC free article] [PubMed] [Google Scholar]
- 52.Barnhart B, Kosinski PA, Wang Z, Ford GS, Kiledjian M, Covey LR. Identification of a complex that binds to the CD154 3' untranslated region: implications for a role in message stability during T cell activation. J Immunol. 2000;165(8):4478–86. doi: 10.4049/jimmunol.165.8.4478. [DOI] [PubMed] [Google Scholar]
- 53.Matus-Nicodemos R, Vavassori S, Castro-Faix M, Valentin-Acevedo A, Singh K, Marcelli V, et al. Polypyrimidine tract-binding protein is critical for the turnover and subcellular distribution of CD40 ligand mRNA in CD4+ T cells. J Immunol. 2011;186(4):2164–71. doi: 10.4049/jimmunol.1003236. [DOI] [PMC free article] [PubMed] [Google Scholar]
- 54.Blechingberg J, Lykke-Andersen S, Jensen TH, Jorgensen AL, Nielsen AL. Regulatory mechanisms for 3'-end alternative splicing and polyadenylation of the Glial Fibrillary Acidic Protein, GFAP, transcript. Nucleic acids research. 2007;35(22):7636–50. doi: 10.1093/nar/gkm931. [DOI] [PMC free article] [PubMed] [Google Scholar]
- 55.Le SC, Lesimple M, Mereau A, Menoret S, Allo MR, Hardy S. PTB regulates the processing of a 3'-terminal exon by repressing both splicing and polyadenylation. Mol Cell Biol. 2005;25(21):9595–607. doi: 10.1128/MCB.25.21.9595-9607.2005. [DOI] [PMC free article] [PubMed] [Google Scholar]
- 56.Krol J, Busskamp V, Markiewicz I, Stadler MB, Ribi S, Richter J, et al. Characterizing light-regulated retinal microRNAs reveals rapid turnover as a common property of neuronal microRNAs. Cell. 2010;141(4):618–31. doi: 10.1016/j.cell.2010.03.039. [DOI] [PubMed] [Google Scholar]
- 57.Wang FE, Zhang C, Maminishkis A, Dong L, Zhi C, Li R, et al. MicroRNA-204/211 alters epithelial physiology. FASEB J. 2010;24(5):1552–71. doi: 10.1096/fj.08-125856. [DOI] [PMC free article] [PubMed] [Google Scholar]
- 58.Yin Y, Zhang B, Wang W, Fei B, Quan C, Zhang J, et al. miR-204-5p inhibits proliferation and invasion and enhances chemotherapeutic sensitivity of colorectal cancer cells by downregulating RAB22A. Clin Cancer Res. 2014;20(23):6187–99. doi: 10.1158/1078-0432.CCR-14-1030. [DOI] [PubMed] [Google Scholar]
- 59.Xia Y, Zhu Y, Ma T, Pan C, Wang J, He Z, et al. miR-204 functions as a tumor suppressor by regulating SIX1 in NSCLC. FEBS Lett. 2014;588(20):3703–12. doi: 10.1016/j.febslet.2014.08.016. [DOI] [PubMed] [Google Scholar]
- 60.Chen Z, Sangwan V, Banerjee S, Mackenzie T, Dudeja V, Li X, et al. miR-204 mediated loss of Myeloid cell leukemia-1 results in pancreatic cancer cell death. Mol Cancer. 2013;12(1):105. doi: 10.1186/1476-4598-12-105. [DOI] [PMC free article] [PubMed] [Google Scholar]
- 61.Mikhaylova O, Stratton Y, Hall D, Kellner E, Ehmer B, Drew AF, et al. VHL-regulated MiR-204 suppresses tumor growth through inhibition of LC3B–mediated autophagy in renal clear cell carcinoma. Cancer Cell. 2012;21(4):532–46. doi: 10.1016/j.ccr.2012.02.019. [DOI] [PMC free article] [PubMed] [Google Scholar]
- 62.Sigal LH. Basic science for the clinician 54: CD5. J Clin Rheumatol. 2012;18(2):83–8. doi: 10.1097/RHU.0b013e318247bc64. [DOI] [PubMed] [Google Scholar]
- 63.Tabbekh M, Mokrani-Hammani M, Bismuth G, Mami-Chouaib F. T-cell modulatory properties of CD5 and its role in antitumor immune responses. Oncoimmunology. 2013;2(1):e22841. doi: 10.4161/onci.22841. [DOI] [PMC free article] [PubMed] [Google Scholar]
- 64.Pfaffl MW. A new mathematical model for relative quantification in real-time RT-PCR. Nucleic acids research. 2001;29(9):e45. doi: 10.1093/nar/29.9.e45. [DOI] [PMC free article] [PubMed] [Google Scholar]
Associated Data
This section collects any data citations, data availability statements, or supplementary materials included in this article.


