Abstract
Skeletal muscles are composed of heterogeneous muscle fibers with various fiber types. These fibers can be classified into different classes based on their different characteristics. MALDI mass spectrometric imaging (MSI) has been applied to study and visualize different metabolomics profiles of different fiber types. Here, skeletal muscles were analyzed by atmospheric pressure scanning microprobe MALDI-MSI at high spatial and high mass resolution.
Keywords: Atmospheric pressure MALDI mass spectrometric imaging, Biomedicine, High mass resolution MS, High spatial resolution MS, Metabolomics, Skeletal muscle fiber type
MALDI mass spectrometric imaging (MSI) is a microprobe technique that ionizes large numbers of biomolecules directly from the sample surface, and enables the mapping of molecules across a sample surface without radiolabeling or fluorescent tagging. In MSI, MALDI is perhaps the most commonly used ionization technique for tissue biomolecule analysis because it is a relatively soft ionization technique with good spatial resolution. However, for some analyses, the spatial resolution of the laser limits the information attainable.
Skeletal muscles are heterogeneous tissues composed of fibers with different functional and metabolic characteristics. Rat muscle fibers can be divided into four general types, I, IIA, IIB, and IIX, depending on the fibers’ myosin heavy chain (MHC) expression. The type, number, and size of fibers are often measured to determine the health and function of skeletal muscles. Different fiber types are also known to adapt differently due to various stimuli. Although the MHC staining technique can identify the four fiber types of muscles, the chemical information of biomolecules within the tissue are often lost or neglected after histological treatment.
In a previous study, MALDI MSI was performed to analyze and successfully show that different metabolic information is obtained from bundles of muscle fiber of different types [1]. However, the spatial resolution attainable in the previous study was ca. 100 μm, whereas the skeletal muscle fibers typically are less than 30 μm in diameter; thus, the spatial resolution of the data acquired was limited by the instrument and visualization of individual fiber was not possible. Here, the skeletal muscle fibers were analyzed by MALDI MSI with high spatial (ca. 10 μm) and high mass resolution (140 000 at m/z 200).
All samples were prepared as described previously [1]. Briefly, the rats were sacrificed by rapid decapitation using a guillotine. Whole gastrocnemius muscle was removed from the animals, wrapped with aluminum foil, and flash frozen in liquid nitrogen. The tissue blocks were stored in a −80 °C freezer until sample preparation for analysis. Muscle transverse cross-sections were collected at 10 μm thickness using a Microm HM 505E cryostat (Walldorf, Germany) at −25 °C. Serial sections were collected and thaw-mounted atop glass microscope slides for MALDI MSI experiments and MHC immunofluorescence (IFL) fiber type staining analysis for comparison. The immunofluorescence fiber type staining analysis followed a previously published procedure [2].
For MSI analysis, the transverse cross sections were placed in a desiccator for 20 min, and subsequently a matrix application robot (SMALDIPrep, TransMIT GmbH, Giessen, Germany) based on pneumatic spraying was used to apply uniform matrix [3] of 30 mg/mL 2,5-dihydroxybenzoic acid in 1:1 v/v acetone/water, 0.1% TFA or 10 mg/mL 9-aminoacridine in 70:30 ethanol/water (EtOH:H2O) matrix solutions for positive and negative ion mode analysis, respectively. The matrix crystals size (<10 μm) and uniformity were check before the measurements. The matrix-coated slides were analyzed using atmospheric-pressure MALDI on a Thermo Q Exactive (San Jose, CA USA) equipped with a AP-SMALDI10 (Trans-MIT GmbH, Giessen, Germany) imaging ion source with a 10 μm spot size. The rastering step size was equal to the laser spot size. Mass spectrometric data were collected from m/z 250–1000 in positive ion mode with a mass resolution of 140 000 at m/z 200 and a lock mass of m/z 716.125; for negative ion mode, data were collected from m/z 225–900 with a mass resolution of 140 000 at m/z 200 and a lock mass of m/z 385.146. For data analysis, images were processed and generated using the Mirion software developed by the Spengler group from the Justus Liebig University [4].
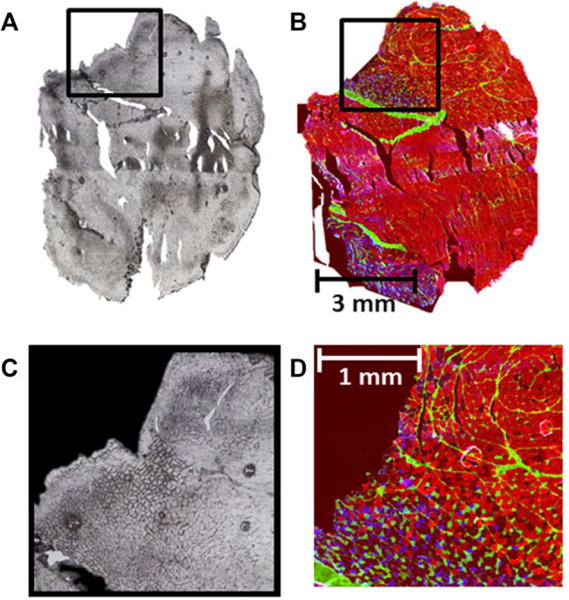
Gastrocnemius muscle was selected for this study because it has regionalization of different fiber types such that types I and IIA cluster together, as do types IIB and IIX [5]. Prior to MSI analysis, the boundary between the clusters was first identified in the cross-section based on the image collected from the MHC IFL stained section as shown in Fig. 1. The area around the boundary was submitted for MSI analysis from two different cross-sections adjacent to the MHC IFL stained section for positive and negative ion mode MSI analysis.
Figure 1.

The optical image of a cross section analyzed by MSI is shown in (A); the MHC IFL image of the section adjacent to the cross section analyzed by MSI is shown in (B); image (C) is the zoom in of the region of the optical image shown in (A) that was submitted for 10 μm spatial resolution MSI analysis., whereas image (D) shows the zoom in of the clustering region of image (B). In the MHC IFL images, the type I fibers were stained with blue fluorescence, type IIA fibers with green fluorescence, and type IIB fibers were stained with red fluorescence; Type IIX fibers were left unstained and give no fluorescence and appeared black.
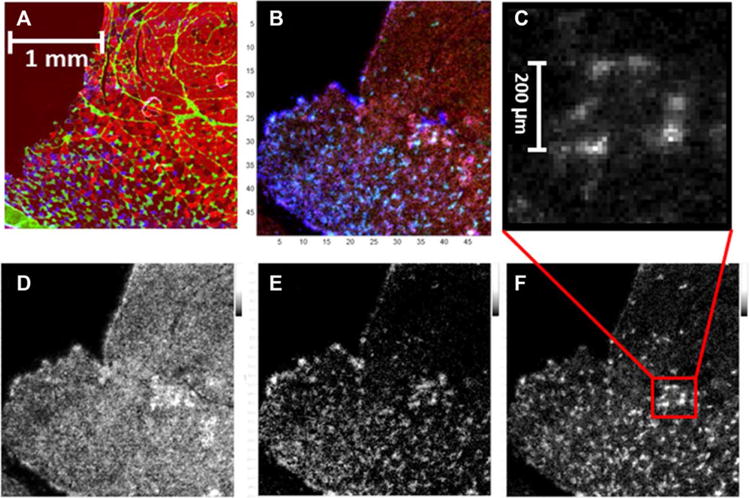
Mirion software was used for automatic extraction of MS images. Three MS images of selected ions, m/z 820.525, 832.582, and 872.557, putatively identified as [M+K]+ of phosphatidylcholine (36:4) (PC(36:4)), [M+Na]+ of PC(38:4), and [M+K]+ of PC (40:6), respectively, based on the accurate mass database search from the Metlin database, are displayed in Fig. 2D, E, and F. As shown in the images, the three ions showed higher intensity in the region where type I and IIA fibers clustered and displayed a fiber type-like pattern suggesting the potential of MALDI MSI as an analytical tool to analyze and visualize skeletal muscle fiber. Further optimization and analysis is necessary to improve analysis and resolution, but these initial results indicate the power of high spatial and high mass resolution in identifying individual muscle fibers.
Figure 2.

Display the MHC IFL image of a transverse cross section zoomed in to the region of boundary formed by the two clusters of fibers in (A). The image in (C) is a 10× zoomed-in MS image of m/z 872.557 from F. Figure (D), (E), and (F), are the MS images of m/z 820.525, 832.582, and 872.557, putatively identified as [M+K]+ of PC(36:4), [M+Na]+ of PC (38:4), and [M+K]+ of PC(40:6) based on the accurate mass database search from Metlin database. The image shown in (B) is the overlay of the three MS images in (D), (E), and (F), where panel (D) [M+K]+ of PC(36:2) is in red, panel (E) [M+Na]+ is in blue, and panel (F) [M+K]+ is in green.
One of the potential areas for improvement would be shortening cross-section storage time in the −80 °C freezer; that is, dry and spray coat the cross-section with matrix solutions as soon as it is thaw-mounted atop of the glass slide. Unlike our previous study [1], this experiment required sectioning and tissue staining weeks prior to MSI analysis. We observed that the storage of cross-sections in the freezer may have caused the loss of metabolically active analytes such as adenosine triphosphate and inosine monophosphate that were observed in the previous study but not in the current experiments [1]. We plan to further investigate this with future analyses. Another potential area of improvement will be to optimize signal intensity from small spot sizes, including sample preparation methods to produce smaller crystal sizes, including solvent-free methods such as sublimation [6].
Overall, the results of these experiments showed the ability of high spatial resolution to distinguish individual muscle fibers and provided unique chemical information contained in those fibers. Future analyses will include correlation between biomolecules and individual fiber types as well as optimization for higher signal response from the identified metabolites. This study suggests the potential of chemical-histological MS imaging analysis and visualization of skeletal muscle fibers.
Acknowledgments
This work was supported by the National Institute of Health (P30 AG028740, C.S. Carter, PI), the Clinical and Translational Science Institute (CTSI, UL1 TR000064, D.R. Nelson, PI), Southeast Center for Integrated Metabolomics (SECIM) (NIH grant #U24 DK097209, R.A. Yost, PI), and Deutsche Forschungsgemeinschaft (DFG grant Sp314/13-1). The travel to Justus Liebig University for Yu-Hsuan Tsai was funded in part by SECIM, and by travel grants from the UF International Center, Eastman Chemical, and Dr. Ken Wagener of the UF Chemistry Department. The authors would like to thank Lorraine Koerper of the Carter Lab and Dr. Paramita Chakrabarty from the Department of Neuroscience, Center for Translation Research in Neurodegenerative Disease (CTRND), University of Florida, for the assistance in acquiring immunofluorescence images.
Abbreviations
- IFL
immunofluorescence
- MHC
myosin heavy chain
- MSI
mass spectrometric imaging
Footnotes
The authors have declared no conflict of interest.
References
- 1.Tsai YH, Garrett TG, Carter C, Yost RA, et al. Metabolomic analysis of oxidative and glycolytic skeletal muscles by matrix-assisted laser desorption/ionizationmass spectrometric imaging (MALDI MSI) J Am Soc Mass Spectrom. 2015;26:915–923. doi: 10.1007/s13361-015-1133-y. [DOI] [PMC free article] [PubMed] [Google Scholar]
- 2.Bloemberg D, Quadrilatero J. Rapid determination of myosin heavy chain expression in rat, mouse, human skeletal muscle using multicolor immunofluorescence analysis. PLoS ONE. 2012;7:e35273. doi: 10.1371/journal.pone.0035273. [DOI] [PMC free article] [PubMed] [Google Scholar]
- 3.Bouschen W, Schulz O, Eikel D, Spengler B, et al. Matrix vapor deposition/recrystallization and dedicated spray preparation for high-resolution scanning microprobe matrix-assisted laser desorption/ionization imaging mass spectrometry (SMALDI-MS) of tissue and single cells. Rapid Commun Mass Spectrom. 2010;24:355–364. doi: 10.1002/rcm.4401. [DOI] [PubMed] [Google Scholar]
- 4.Paschke C, Leisner A, Hester A, Maass K, et al. Mirion–a software package for automatic processing of mass spectrometric images. J Am Soc Mass Spectrom. 2013;24:1296–1306. doi: 10.1007/s13361-013-0667-0. [DOI] [PubMed] [Google Scholar]
- 5.Wang LC, Kernell D. Quantification of fibre type regionalisation: an analysis of lower hindlimb muscles in the rat. J Anatomy. 2001;198:295–308. doi: 10.1046/j.1469-7580.2001.19830295.x. [DOI] [PMC free article] [PubMed] [Google Scholar]
- 6.Hankin JA, Barkley RM, Murphy RC. Sublimation as a method of matrix application for mass spectrometric imaging. J Am Soc Mass Spectrom. 2007;18:1646–1652. doi: 10.1016/j.jasms.2007.06.010. [DOI] [PMC free article] [PubMed] [Google Scholar]


