Abstract
Alternative splicing significantly contributes to proteomic diversity and mis-regulation of splicing can cause diseases in human. Although both genomic and chromatin features have been shown to associate with splicing, the mechanisms by which various chromatin marks influence splicing is not clear for the most part. Moreover, it is not known whether the influence of specific genomic features on splicing is potentially modulated by the chromatin context. Here we report a deep neural network (DNN) model for predicting exon inclusion based on comprehensive genomic and chromatin features. Our analysis in three cell lines shows that, while both genomic and chromatin features can predict splicing to varying degrees, genomic features are the primary drivers of splicing, and the predictive power of chromatin features can largely be explained by their correlation with genomic features; chromatin features do not yield substantial independent contribution to splicing predictability. However, our model identified specific interactions between chromatin and genomic features suggesting that the effect of genomic elements may be modulated by chromatin context.
Keywords: Deep Neural Network, Alternative splicing, Machine Learning, Chromatin, Exon skipping
General Terms: Algorithms, Measurement, Performance, Experimentation, Verification
1. INTRODUCTION
Almost all genes in human have multiple isoforms. Thus, alternative splicing (AS) is a major contributor to proteomic diversity [1,2]. Further, alternative splicing is much more prevalent in human and mouse compared to invertebrates [3], andhas direct role in normal development and disease [4]. Aberrant splicing is known to have major phenotypic consequence e.g. Hutchinson-Gilford Progeria Syndrome (HGPS), a rare and devastating disease manifesting early ageing symptoms, is caused by splicing aberrations in Lamin A gene [5]. In cancer, a wide array of splicing aberrations due to somatic mutations have been previously noted [6,7].
Splicing is catalyzed by the spliceosome complex, containing five ribonucleo-proteins U1, U2, U4, U5, U6 and many associated auxiliary proteins [8]. Splice site recognition and “exon definition” are critical steps in splicing regulation [9,10]. Specific genomic and chromatin context as well as availability of various proteins can result in alternative usage of splice sites resulting in alternative isoforms [9–12]. While “AG” at acceptor site and “GT” at donor site are hallmarks of exon definition during splicing, the choice of specific sites is influenced by auxiliary proteins (SR protein or hnRNPs) that bind to the splicing enhancer or silencer elements. The splicing enhancer and silencer are divided into four categories based on their locations and function: ESE (exonic splicing enhancer), ESS (exonic splicing silencer), ISE (intronic splicing enhancer), ISS (intronic splicing silencer). In addition, due to its coupling with transcription, splicing can also be influenced by chromatin state via multiple mechanisms [11,12]. For instance, Pol II elongation rate is known to influence the usage of specific splice site; slow elongation rate, influenced by nucleosome density, allows more time for splice machinery to recognize weak splicing sites, thus changing the relative proportion of alternative isoform [12]. Certain chromatin marks are associated with specific chromatin remodeling proteins that can recruit splicing factors thereby regulating splicing. Interestingly, the same chromatin mark can have opposing effect on splicing depending on the mediating partner. For instance, H3K36me3 can recruit SRSF1 via Psip1 to enhance exon inclusion [13]. However if H3K36me3 recruits PTB via MRG15, it represses inclusion [14].
Recent availability of RNA-seq data has spurred several computational investigations into the determinants of alternative splicing [15–19]. While several different types of alternative splicing events have been documented, due to ease and robustness of inference, most investigations have focused on alternative exon inclusion/exclusion events, specifically cassette exons, where an alternative internal exon is immediately flanked by two ubiquitously included exons. A previous work has suggested existence of a ‘splicing code’ composed of numerous genomics features including splice sites signals, conservation score, ESE, ESS, ISE, ISS, etc, that can accurately predict exon inclusion in a cell type relative to other cell types [17,18]. On the other hand, Shindo et al have shown correlation between several chromatin marks and splicing [19]; they found H3K36me3 and H3K79me1 around the exon-intron boundaries and within exons to be strongly correlated with splicing. Zhou et al have shown a correlation between H3K36me3 and splicing [16]. Another report suggested that DNA methylation within exon body may have a positive effect on exon inclusion [15]. Finally, a linear regression model to predict exon inclusion based on multiple chromatin features showed several chromatin features, especially H3K36me3 and H4K20me1 to be correlated with exon expression [20]. However, this previous approach suffers from a technical limitation in that it does not distinguish exon expression and gene expression, and an alternative measure – percentage-spliced-in (PSI), better quantifies alternative exon inclusion. Moreover, the ability of chromatin marks to affect splicing can be overestimated without using genomics features as control since genomics features can, presumably causally, predict chromatin features very accurately [21]. Overall, the relative contributions of genomic and chromatin contributions to alternative splicing, specifically, alternative exon inclusion event, is not clear. Here, based on deep neural network model, we carefully analyzed the relative contributions of genomic and chromatin features on exon inclusion levels, in multiple cell lines. To contrast our work with previous similar works, our focus is comparative assessment of genomic and chromatin features in terms of their effectiveness in predicting splicing, and not to develop a tool to predict splicing.
Our analyses showed that genomics features could predict exon inclusion much more accurately than chromatin features, and an integration of the two types of features does not improve the prediction accuracy. We specifically assessed the contributions made by either genomic or chromatin feature in addition to the other type of feature using multiple approaches, and found that, while genomic features make a significant additional contributions to predictability of exon inclusion, the converse is not true, suggesting that genomic features encode most of the information relevant to exon inclusion. Besides the assessment of predictability, we specifically model the position-specific contribution of each feature. Finally, even though chromatin features do not make a substantial contribution independent of the genomic features, our model detected specific interactions between genomic and chromatin features, suggesting that the effect of specific genomic features may be sensitive to the chromatin context.
Overall, we provide a first direct comparative assessment of genomic and chromatin features, and interaction thereof, in predicting cell type specific alternative splicing.
2. RESULTS
2.1 Approach Overview
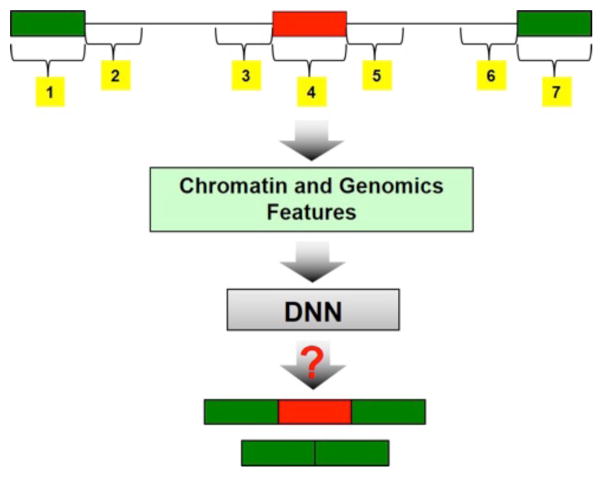
We obtained a list of 16,000 cassette exons based on prior annotations by MISO, which is based on integration of transcript data from a wide variety of cell types and conditions [22]. Given the annotation, for a given RNA-seq sample, we estimated the inclusion rate for each annotated cassette exon using MISO package and classified them as either skipped or included based on specific thresholds (M&M). For each annotated exon, we obtained 1,366 genomic and cell type-specific chromatin features, including the feature-location combinations, from ENCODE database (M&M). Broadly, our features, both genomic and chromatin, were quantified in 7 distinct genomic loci relative to the cassette exon (M&M and Fig. 9). We formulated the exon inclusion prediction problem as a 2-class supervised classification problem and, using deep neural network model (M&M), performed several analyses: (i) estimating splicing predictive power of genomic and chromatin feature independently in three tissues (GM12878, h1-hESC, K562), (ii) cross-tissue predictability of a model trained in one of the cell lines, (iii) prioritization and interpretation of most relevant features in splicing, (iv) estimating relative contributions made by chromatin features in addition to those made by the genomic features alone, and (v) characterization of interactions between genomic and chromatin features.
Figure 9. Predictive model for exon inclusion prediction. We extracted features from the 7 regions in yellow in the skipping exon event structure.
We employed deep neural network model to perform supervised learning to predict exon inclusion.
2.2 Chromatin Features are Weak Predictors of Exon Inclusion
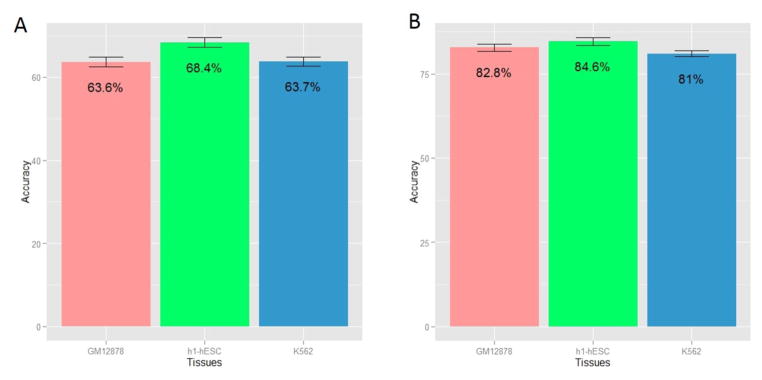
Previous studies have reported correlations between various types of splicing events and proximal chromatin features [15, 16, 19, 20]. We directly assessed the cross-validation predictability of exon inclusion using chromatin features alone. Fig. 1A shows the 8-fold cross-validation classification accuracy in three different cell lines. The prediction accuracies in all cell types are significantly higher than the random expectation of 50%, albeit, modest. Notably, prediction accuracy is much higher in h1-ESC relative to the other two cell lines. This may be either because the chromatin state is indeed more closely associated with splicing in pluripotent cells or alternatively, because of better quality of chromatin modification data in h1-ESC cell line; these need to be explored in future.
Figure 1. Cross-validation prediction accuracy of exon inclusion using chromatin features for three cell types.
GM12878 (blood), h1-hESC (human embryonic stem cell) and K562 (leukemia). The accuracy is the mean accuracy of 8-fold cross validation. (A) Prediction accuracy using chromatin features; (B) Prediction accuracy using genomic features.
2.3 Genomic Features are Robust Predictors of Exon Inclusion
Previous studies have shown that genomic features can accurately predict change in exon inclusion propensity in a cell line relative to other cell lines [17, 18]. We emphasize that our goal here is not necessarily to improve exon inclusion predictability, but rather to contrast the independent and synergistic contributions of chromatin and genomic features and also to assess location specificity of various features relative to splice sites. Nevertheless, we first establish a baseline for predictability of exon inclusion using genomic features in our datasets and using tissue-specific performance metric. Also, in contrast to previous genomic element-based relative exon inclusion prediction approach [17,18], here we only employ genomic features with a potential mechanistic link to splicing machinery and excluded features such as ‘exon translatability’ that was shown to be the single-most powerful predictor but is not linked to the splicing mechanisms per se. We used only the cis-elements discussed above to predict splicing. However, we note that by excluding translatability as a feature, our approach does not account for nonsense mediated decay of the mRNA caused by pre-mature stop codon [23,24].
Similar to chromatin features, we employed 8-fold cross validation to estimate prediction accuracy. As shown in Fig. 1B, genomic features can predict exon inclusion very accurately, consistent with previous studies [17,18], and importantly, much more accurately than chromatin features. This suggests that exon inclusion, even in a specific context, is largely determined by genomic sequences.
2.4 Location-Specific Map of Chromatin Features
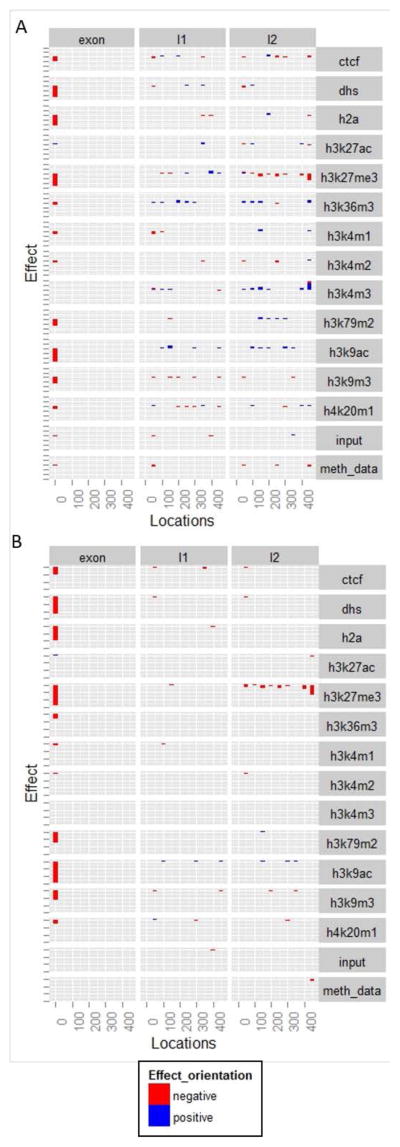
In our deep learning model, we assessed the effect of each chromatin mark in 3 regions (multiple sub-regions in each broad region) relative to the cassette exon; each mark-locus combination is a distinct feature in our model. Here we report the locus-specific effect size of various chromatin marks. Fig. 2A, S1, and S2, show, respectively for h1-hESC, GM12878, and K562, the most significant chromatin features (M&M) in all locations considered – the cassette exon, the 5′ flanking intron and in the 3′ flanking intron. Interestingly, by and large, almost all features in exonic regions have negative effect on exon skipping, i.e., their presence in specific exonic regions is associated with higher inclusion levels, discussed later. Also the trends are largely consistent across cell types, particularly across h1-hESC and K562.
Figure 2.
(A) The effect size of chromatin features at different genome locations in h1-hESC cell line; (B) The relevance of chromatin features at different genome locations in h1-hESC cell line.
We further ascertained the importance of features selected above as follows. We partitioned the entire set of exons into two sets based on the feature values (top and bottom half). We then randomly sampled (100 times) 1000 exons from each of the two groups and compared their inclusion levels using Wilcoxon test. We noted the fraction of tests (out of 100 tests) that yielded significant results consistent with the directionality of the feature’s effect according to the model above. To rank the features in terms of their overall relevance, which captures both significance and effect size, we multiplied each feature’s effect size (obtained from the model) with the fraction of Wilcoxon tests that were significant (significance). This procedure yields a view of every single feature’s independent contribution (without considering interactions). Fig. 2B, S3, S4 shows the relevance for all the three tissues (Fig. S3 and S4 are in the supplementary file). We ranked the features based on their relevance as estimated above. Our results suggest that H3K36me3 is one of the most relevant features consistent with previous reports [16,19]. The analysis also reveals H3K79me2, H4K20me1, H3K27me3, H3K9ac to be highly relevant to exon inclusion. Interestingly, we found that leukemia and stem cell lines have more and stronger feature signals for enhancing inclusion, however, blood cell lines have more features associated with repression of exon inclusion.
2.5 Chromatin features Contribute Very Little to Exon Inclusion Independent of Genomic Features
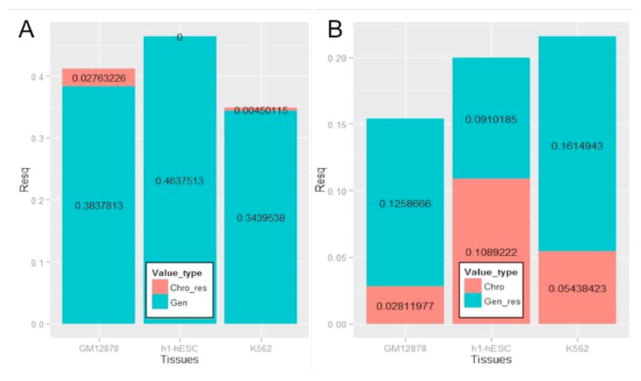
We have shown in section 2.3 that chromatin features are modestly predictive of exon inclusion. Even though specific mechanisms linking histone modifications to splicing have been reported [11, 12, 14], it is not clear to what extent the predictive power of chromatin features are independent of genomic features. To specifically investigate this, we assessed the extent to which chromatin features can explain the variance in exon inclusion that is unexplained by genomic features. We used two approaches to assess this: (i) we trained a model using chromatin (genomics respectively) features and then assessed the prediction accuracy using genomic (chromatin respectively) features with an additional feature representing the prediction score using the chromatin-based (genomic-based respectively) model; an improvement in prediction accuracy associated with the added feature represents additional contribution of that feature. (ii) we quantified the extent to which chromatin (genomics respectively) features could explain the residuals of a linear model based on genomic-based (chromatin-based respectively) model. A high explanatory power of the residual is consistent with an independent contribution.
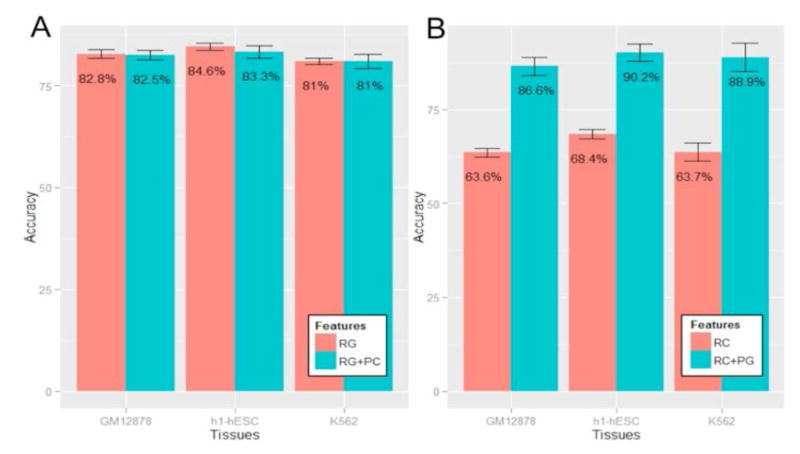
Fig 3A and 3B show the results for the first analysis, which suggest that while adding chromatin-based model score to genomic features does not improve prediction accuracy, adding genomic-based model score to chromatin features substantially improves the prediction accuracy. Analogously, Fig. 4A and 4B show the result of the residual analysis, consistent with the first analysis, namely, chromatin features explain very small fraction of variance of the residual from the genomics-based model, as opposed to the converse. Overall, these analyses strongly suggest that that genomics features provide robust prediction of exon inclusion, largely independent of chromatin features and that the previous observed associations between chromatin features and splicing can largely be explained by the links between genomics and chromatin features, also noted previously [21].
Figure 3. Cross-validation prediction accuracy using raw genomics (chromatin respectively) features and chromatin (genomics respectively) feature prediction score as an additional feature, for three cell types, GM12878 (blood), h1-hESC (human embryonic stem cell) and K562 (leukemia).
The accuracy is the mean accuracy of 8-fold cross validation. RG indicates the raw genomics features, PC indicates prediction score using chromatin features. RC indicates raw chromatin features, PG means prediction score using genomics features. (A) Comparison between accuracy using RG + PC and only RG; (B) Comparison between accuracy using RC + PG and only RC.
Figure 4. R-squared for explaining residuals of genomics feature prediction using chromatin features and residuals of chromatin feature prediction using genomics features, in three cell lines, GM12878 (blood), h1-hESC (human embryonic stem cell) and K562 (leukemia).
Chro-res: chromatin feature explain residuals of genomics model. Gen: genomics model. Gen_res: genomics feature explain residuals of chromatin model. Chro: chromatin model. (A) R-squared of Chro-res and Gen; (B) R-squared of Gen-res and Chro.
2.6 Cross Tissue Generalization of Chromatin and Genomics Predictors
Next, to assess the extent to which similar rules govern exon inclusion in different cell lines, for each pair of tissues we trained the model on one tissue and tested on the other. First, for chromatin-based modeling, as shown in Table 1, GM12878 model cannot predict exon inclusion in the other cell types and conversely, model trained on other cell types cannot predict exon inclusion in GM12878. However, cross-tissue predictability is much higher than random expectation between h1-hESC and K562. As shown in Table 2, genomics-based model exhibits a similar trend, however the absolute prediction is much greater for the genomics-based models. These results suggest that, even though a large portion of cis elements contribute to exon inclusion across cell types, exon inclusion also depends on specific cis elements that are recognized by cell type specific splicing factors (including splice enhancers and repressors). And the cross-cell type predictability for chromatin feature follow similar trend likely because chromatin features are largely encoded in cis elements [21].
Table 1.
Cross tissue test using chromatin model
| GM12878 | 49.2% | 51.6% |
|---|---|---|
| 46.8% | h1-hESC | 60.2% |
| 50.1% | 64.4% | K562 |
In each row, we used one tissue model to predict exon inclusion of the rest. Accuracy in red means not significant, ones in green means significant.
Table 2.
Cross tissue test using genomics model
| GM12878 | 80.56% | 78.9% |
|---|---|---|
| 75.82% | h1-hESC | 80.27% |
| 75.14% | 80.79% | K562 |
In each row, we used one tissue model to predict exon inclusion of the rest. Accuracy in red means not significant, ones in green means significant.
2.7 Interactions between Chromatin Features and Genomic Features
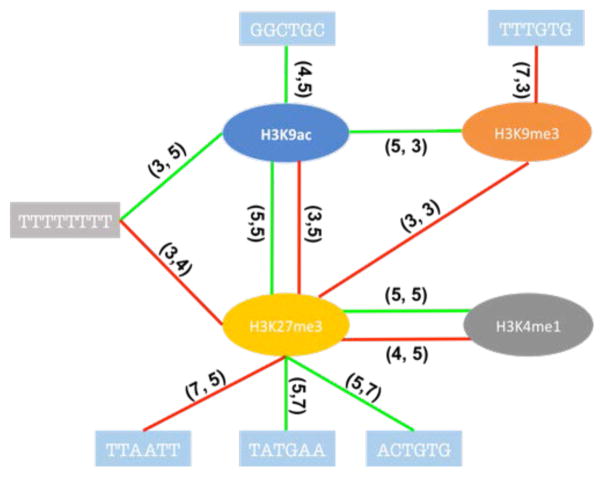
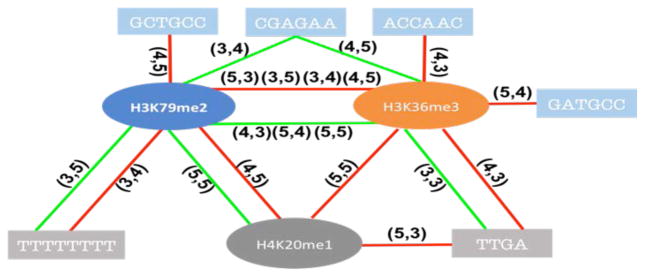
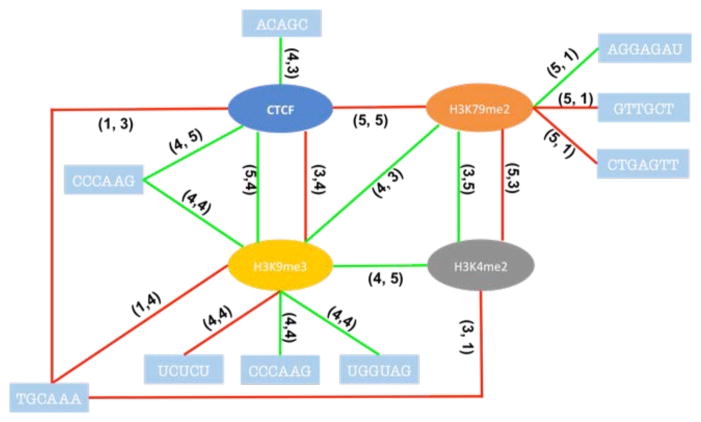
Our results thus far suggest that previously observed links between chromatin features and splicing may be largely explained by their correlations with genomic features, which are more directly and likely mechanistically linked with splicing. Nevertheless, it is possible that the effect of some of the location-specific genomic features may be modulated by chromatin context. In other words, there may be interactions between specific genomic and chromatin features. However, these interactions cannot be directly quantified in our DNN model. Therefore, we applied L1 norm to the first layer of the DNN model to make the connections sparse, then explicitly assessed the interactions among the selected features based on a linear regression model, using the model selection package “stepwiselm” in Matlab [25]. We investigated both chromatin-genomic and chromatin-chromatin interactions. The results are summarized in Fig. 5–7 for each cell line respectively. Our results suggest that chromatin context can potentially modulate the effect of genomic features on splicing. Moreover, both chromatin-genomic and chromatin-chromatin interactions are position specific, which is consistent with a mechanisms that relies on specific genomic and RNA conformation and binding of splicing factors. What’s more, many cis-elements within the skipped exons tend to interact with chromatin features. However, interactions between chromatin and genomic features in the context of splicing has not been studied before making it difficult to directly assess the observed interactions based on existing literature and more experimental work is needed to further investigate our findings.
Figure 5. Potential interactions for chromatins-genomics, chromatins-chromatins in GM12878.
The red line means negative to exon exclusion, green line means positive to that. The numbers on the line indicate feature location (Fig. 9).
Figure 7. Potential interactions for chromatins-genomics, chromatins-chromatins in K562.
The red line means negative to exon exclusion, green line means positive to that. The numbers on the line indicate feature location (Fig. 9).
3. MATERIAL AND METHODS
3.1 Training Datasets
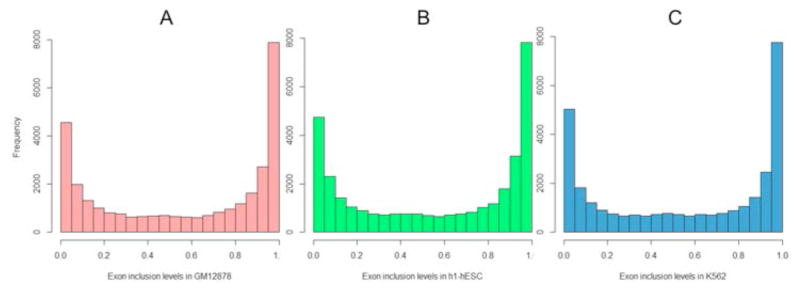
We downloaded MISO skipped exon splicing events annotations [22]. Based on the MISO skipped exon splicing events annotations and the RNA-seq data in three cell lines, we used MISO package [22] to estimate the sample-specific exon inclusion fractions for all annotated cassette exons. We excluded the genes which are not expressed in any given cell type based on expression data from Gene Expression Omnibus as an independently ascertained expression data. Figure 8 shows the distributions of exon inclusion levels in the three cell lines. Since the distributions are bimodal, suggesting that most exons tend to be either included or excluded in a given context. Moreover, these extreme cases are more likely to be robust. We therefore considered 40% of events from each end (total of 80% of data) of the distributions for three tissues for the investigation of determinants of exon inclusion. Exons whose inclusion levels are closer to 0 represent excluded exons, whereas the exons to the right of the spectrum are considered included exons. We thus formalize the problem as a two-class classification problem.
Figure 8. Distribution of exon inclusion level for three cell lines. X-axis is the exon inclusion level, which is between 0 and 1.
(A) Distribution for GM12878; (B) Distribution for h1-hESC; (C) Distribution for K562.
We obtained processed Histone modification (Chip-seq), CTCF (ChIP-seq), RNA-seq, DNA Methylation (Methyl RRBA), Dnase-seq data for each other for Blood tissue (GM12878), Embryonic Stem cell tissue (H1-hESC), Leukemia tissue (K562) respectively from ENCODE project (www.encode.org). The chromatin features include histone modifications (H2AFZ, H3K36me3, H3K27ac, h3K27me3, H3K4me1, H3K4me2, H3K4me3, H3K79me2, H3K9me3, H3K9ac, H4K20me1), DNA methylations, DNAse hypersensitivity (DHS), and CTCF binding. The genomics features include a total of 560 motifs (which include validated known splicing motifs [18,26] and new potential splicing motifs [27,28], splice sites scores, exon length, intron length and conservation scores for the 7 regions.
For each cassette exon, given the flanking exons and the introns, we selected seven regions for feature extraction as shown in Fig. 9. Regions 1, 4, 7 are exons whose length varied. Regions 2, 3, 5, 6 are 450 bps intron regions proximal to the 3 exons. A previous work used the regions 1–7 for genomics features [18]. For chromatin features we only used regions 3, 4, and 5 because we found signals from region 1, 2, 6, 7 not to be effective by comparing the prediction accuracies before and after we include these regions (results not shown). For each region, we divided it into 9 windows and used as the chromatin feature value, the fraction of the windows overlapping a broad peak for each feature.
3.2 Deep Neural Network Model
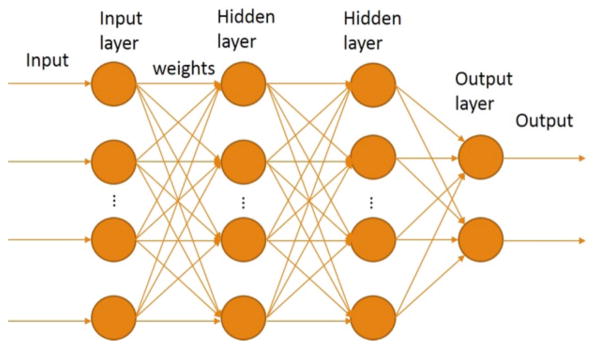
As mentioned earlier we treat the exon inclusion prediction problem as a two-class classification problem. We applied the deep neural network model, which has been widely used in computer vison and nature language processing field. DNNs are probabilistic generative network models with multiple hidden layers [29]. All nodes at a layer have complete directed connections to the nodes in the next layer. Each layer includes multiple neural units, which contain a transfer function. Transfer function can be customized based on the application.
The activation ac of each node depends on the input features f, connection weights w, the bias b and transfer function T:
We used logistic function as the transfer function:
The DNN architecture is shown in Fig. 10. There is a one-to-one mapping between features and the nodes in the input layer. The number of nodes for the output layer is two since this is a two-class classification problem; one of the nodes outputs the probability pe for an exon to be excluded, and the other node outputs the probability of being included pi. The predicted class c is based on maximum of the two probabilities:
Figure 10.
The deep neural network architecture we used.
We utilized previously developed convenient deep neural network toolbox [30].
3.3 Restricted Boltzmann Machine Pre-training
A Restricted Boltzmann Machine (RBM) is an undirected stochastic neural network model [31], composed of a visible layer and a hidden layer. In neural network architecture this model could efficiently provide better initialization compared to random initialization based on maximum likelihood approach [31]. We treat each pair of adjacent layers as RBMs to perform supervised learning pre-training greedily. Hinton et al. [31] have shown that RBM pre-training substantially improves the training with a backward fine-tuning phase.
3.4 Dropout
Overfitting is a potential concern in supervised learning, especially for complex model with numerous parameters. Dropout technique introduced by Hinton et al. [32] could be used to significantly reduce overfitting. Essentially, it tries to randomly drop some nodes along with all their connections in every round, followed by a fine-tuning phase. In this way, dropout can randomly sample diverse network structures and combine them in prediction step.
3.5 Feature Selection
We counted the occurrences of motifs within the regions of interest as motif features. For both chromatin states and sequence conservation, we determined the average signal within our regions of interest as feature values. We performed greedy feature selection based on the feature contributions derived from the first model. We used all the features to build the model and then employed Milne’s method [33] to calculate all the features’ contributions by making use of the connection weights from the model as follows:
Where 1h is the number of units in the first hidden layer, 2h indicates the number of units in the second hidden layer, rc(i) is the raw contribution of the ith feature, nc(i) is the normalized contribution of the ith feature, w is the connection weight, fea is the number of input features.
Then we ranked all features based on their contributions, and greedily added features to the feature set till convergence of prediction accuracy.
4. DISCUSSION
In this study, we formalized the exon inclusion prediction problem as a 2-class supervised learning problem. Our primary goals here were to assess the relative contributions of chromatin and genomic features and specifically test the possibility that the previous reported associations between chromatin features and exon skipping might be largely due to their correlations with genomic features [21]. Our additional goal was to test whether the effect of specific cis elements may be modulated by the chromatin context. Based on a comprehensive set of genomic and chromatin features in 7 and 3 regions respectively, and using deep learning model, we first verified that the genomics features are robust predictors of exon inclusion consistent with previous studies [17], [18]. At the same time we found that, not only chromatin features can only modestly predict exon inclusion, they do not lend substantial information beyond what is captured by genomic features. However, our analysis reveals specific significant interactions between chromatin and genomic features suggesting that the effect of latter on exon inclusion may depend on the context provided by the former.
We employed DNN with pre-training and dropout methods, which have been widely used and proved effective in computer vision and natural language processing domains, relative to other machine learning approaches [29], [31]. Essentially, DNN, as a model with greater number of hidden layers, can represent higher level of abstract features, which should contribute to modeling of the association between splicing inclusion and features, in a situation such as splicing where the precise mechanisms are not known and there are likely to be several interactions among features and stepwise decision being made,. However, complex model are more vulnerable to overfitting. Pre-training and dropout algorithms are meant to reduce overfitting. Finally, it is not easy to quantify interactions within this complicated network model. While we rely on DNN to rank features by significance, to assess interaction we employed a simpler model. In our study we used standard linear regression to model interactions because of their high interpretability.
Previous works relying entirely on genomic features have proposed a highly accurate context-specific splicing code [18]. We rely on the dictionary of cis elements compiled in these previous works. However, there are some notable differences between our work and these previous works. Our focus is not to optimize the prediction accuracy, but rather to explore relative contributions of genomic and chromatin features. We have therefore explicitly excluded operational, but non-mechanistic, features such as ‘translatability’. Moreover, while we estimate prediction accuracy within a cell line independent of other cell lines, these previous works in fact predict increase/decrease in exon inclusion in a cell line relative to other cell lines, and as such they rely on data from all cell lines simultaneously and boost the accuracy through information shared across cell lines. Therefore the absolute prediction accuracy reported here are not directly comparable to the previous reports.
Even though, by and large, the chromatin features are not highly predictive of exon inclusion, we found specific features to be highly significant. H3k36me3 is one of the most significant features and is consistent with previous report. For each feature revealed by our model as significant, we also directly verified the association between that specific feature and splicing inclusion, and examined the joint effect-size and significance as the feature relevance (Fig 2B, S3, S4). We found that most of the detected relevant features are consistent with previous correlation study [16,19,20]. In both GM12878 and h1-hESC, H3K36me3 is one of the most significant chromatin marks contributing to splicing, consistent with previous reports [16,19,20]. While previous computational association studies suggest that H3K36me3 at exon-intron boundary and exon has a positive effect on exon inclusion, in contrast, our analyses suggest that this mark can have both positive and negative effect in GM12878, depending on its precise location, which is consistent with various potential mechanisms based on experimental studies [11]. H4k20me1 is significant in all three tissues, consistent with [20]. Moreover, H3K79me2, H3K9ac, H3K27me3, H3K9me3 also showed varying degrees of significance. In addition, in stem cell most chromatin features within skipped exon have strong positive correlation with exon inclusion, which may imply that they can contribute to define exon or recruit SR proteins during splicing.
Our finding that genomic signals carry almost all of the information predictive of exon inclusion, and that predictive power of chromatin features is not independent of genomic elements should not come as a surprise. Despite previously shown associations between chromatin marks and splicing, it is likely that the chromatin signals themselves may be ultimately governed by the underlying genomic elements and the proteins binding to them. This could be true even in the rare cases where a direct mechanistic link has been inferred from a specific chromatin feature and splicing [12,14]. Recent reports showing highly accurate predictability of chromatin features by genomic sequence strongly suggests that not just for splicing, but, unsurprisingly, numerous other cellular processes, such as transcription initiation, poly-Adenylation, etc., even when there strong association and mechanistic links with chromatin features, the ultimate drivers are likely to be the underlying genomic elements.
We performed cross tissue test using genomics and chromatin model respectively. We found that the rules learnt from one cell type are reasonably applicable to a different cell type. The differences can be attributed to cell type specific splicing factors. We expect that chromatin features, after being largely determined by genomic features, should have conserved rules governing exon inclusion across cell types. We found high cross-cell type predictability for stem cell and leukemia. This specific observation is consistent with known broad similarities in active cellular processes between stem cell and cancers [34–36].
Even though our analyses suggest that chromatin features are not likely to be the primary drivers of alternative splicing, they might still be able to affect splicing at the molecular level, as suggested by our interaction study (Fig. 5, 6, 7). First, chromatin features may serve to provide the recognition specificity for specific factors, similar to genomics features. At the molecular level, in most of the reported potential mechanism, chromatin features interact with many other molecules to affect splicing, such as chromatin remodeling protein and SR protein. We speculate that the spatial position of those chromatin marks may influence their protein recruitment or conformational changes after recruiting other factors. Moreover, recruitment of different protein factors can have different effect on splicing. For example, H3K36me3 can both facilitate or suppress splicing by recruiting MRG15 or Psip1 respectively [12,14]. In GM12878 cell line, we observed interaction between H3K27me3 and H3K4me1, which have been suggested to together mark poised enhancer [37,38]; In h1-hESC cell line we identified interaction between CTCF and H3K9me3, which have been shown to co-localize [39]. In K562, we observed interactions between H3K79me2 and H3K36me3, which are both markers of gene bodies [40,41], that is likely to be important for exon definition process in splicing regulation. While we do observe interactions between chromatin and genomic features, very little is known in the literature to reasonably corroborate our findings. Moreover, the mapping between specific cis element and corresponding splicing factor is not known for the most part, making it difficult to interpret the results pertaining to cis element interactions. In GM12878 sample, we detected a potential interaction between H3K9ac and motif “GGCTGC”. Even though the protein interacting with the cis elements is not known, we speculate that a splicing repressor like hnRNP binds to the motif to repress inclusion when H3K9ac is present. In h1-hESC, we identified an interaction between SRSF9 protein and H3K79me2. However, the specific locations of the two features are genomically distal from each other (Fig. 6). Such distal interactions are entirely possible due to looping at both DNA and RNA level [42–44]. In K562 sample, the interactions of H3K36me3 with different motifs have different effects on exon inclusion suggesting diverse potential mechanisms discussed earlier.
Figure 6. Potential interactions for chromatins-genomics, chromatins-chromatins in h1-hESC.
The red line means negative to exon exclusion, green line means positive to that. The numbers on the line indicate feature location (Fig. 9).
5. CONCLUSION
We present a first comprehensive model-based comparison of relative contributions of genomic and chromatin features in determining exon inclusion. We have shown that both genomics and chromatin features are associated with exon inclusion, however genomics features are more robust and better predictors, and incorporating chromatin features does not improve splicing prediction substantially. Genomics elements are thus likely to be the ultimate drivers of splicing event, which can affect chromatin marks. However, in some cases, the effect of genomic elements on splicing may be modulated by the chromatin context.
Supplementary Material
Acknowledgments
This work is funded by NIH R01GM100335 to S.H. and Ellison Medical Foundation New Scholar Award and NIH R21 AG043801 to K.C. In addition we would like to thank Avinash Das, Justin Malin, Seung-Gu Park, Shrutii Sarda, and Dr. Steve Mount for constructive comments on the manuscript.
Footnotes
Categories and Subject Descriptors
G.3 [Probability and Statistics]: correlation and regression. analysis, experimental design, nonparametric statistics.
Contributor Information
Kun Wang, Center for Bioinformatics and Computational Biology, University of Maryland.
Kan Cao, Cell Biology Molecular Genetics, University of Maryland.
Sridhar Hannenhalli, Center for Bioinformatics and Computational Biology, University of Maryland.
References
- 1.Nilsen TW, Graveley BR. Expansion of the eukaryotic proteome by alternative splicing. Nature. 2010 Jan;463(7280):457–63. doi: 10.1038/nature08909. [DOI] [PMC free article] [PubMed] [Google Scholar]
- 2. [Accessed: 28-Jan-2015];Molecular Biology of the Cell, 5th Edition: The Problems Book/Edition 5 by John Wilson | 9780815341109 | Paperback | Barnes & Noble. [Online]. Available: http://www.barnesandnoble.com/w/molecular-biology-of-the-cell-5th-edition-john-wilson/1113964478?cm_mmc=google+product+search-_-q000000633-_-9780815341109pla-_-textbook_instock_under26_pt108-_-q000000633-_-9780815341109&ean=9780815341109&isbn=9780815341109&kpid=9780815341109&r=1.
- 3.Kim E, Magen A, Ast G. Different levels of alternative splicing among eukaryotes. Nucleic Acids Res. 2007 Jan;35(1):125–31. doi: 10.1093/nar/gkl924. [DOI] [PMC free article] [PubMed] [Google Scholar]
- 4.Wang ET, Sandberg R, Luo S, Khrebtukova I, Zhang L, Mayr C, Kingsmore SF, Schroth GP, Burge CB. Alternative isoform regulation in human tissue transcriptomes. Nature. 2008 Nov;456(7221):470–6. doi: 10.1038/nature07509. [DOI] [PMC free article] [PubMed] [Google Scholar]
- 5.Eriksson M, Brown WT, Gordon LB, Glynn MW, Singer J, Scott L, Erdos MR, Robbins CM, Moses TY, Berglund P, Dutra A, Pak E, Durkin S, Csoka AB, Boehnke M, Glover TW, Collins FS. Recurrent de novo point mutations in lamin A cause Hutchinson-Gilford progeria syndrome. Nature. 2003 May;423(6937):293–8. doi: 10.1038/nature01629. [DOI] [PMC free article] [PubMed] [Google Scholar]
- 6.Wang GS, Cooper TA. Splicing in disease: disruption of the splicing code and the decoding machinery. Nat Rev Genet. 2007 Oct;8(10):749–61. doi: 10.1038/nrg2164. [DOI] [PubMed] [Google Scholar]
- 7.Watson IR, Takahashi K, Futreal PA, Chin L. Emerging patterns of somatic mutations in cancer. Nat Rev Genet. 2013 Oct;14(10):703–18. doi: 10.1038/nrg3539. [DOI] [PMC free article] [PubMed] [Google Scholar]
- 8.Will CL, Lührmann R. Spliceosome structure and function. Cold Spring Harb Perspect Biol. 2011 Jul;3(7) doi: 10.1101/cshperspect.a003707. [DOI] [PMC free article] [PubMed] [Google Scholar]
- 9.Black DL. Mechanisms of alternative pre-messenger RNA splicing. Annu Rev Biochem. 2003 Jan;72:291–336. doi: 10.1146/annurev.biochem.72.121801.161720. [DOI] [PubMed] [Google Scholar]
- 10.Wang ET, Sandberg R, Luo S, Khrebtukova I, Zhang L, Mayr C, Kingsmore SF, Schroth GP, Burge CB. Alternative isoform regulation in human tissue transcriptomes. Nature. 2008 Nov;456(7221):470–6. doi: 10.1038/nature07509. [DOI] [PMC free article] [PubMed] [Google Scholar]
- 11.Zhou HL, Luo G, Wise JA, Lou H. Regulation of alternative splicing by local histone modifications: potential roles for RNA-guided mechanisms. Nucleic Acids Res. 2014 Jan;42(2):701–13. doi: 10.1093/nar/gkt875. [DOI] [PMC free article] [PubMed] [Google Scholar]
- 12.Luco RF, Allo M, Schor IE, Kornblihtt AR, Misteli T. Epigenetics in alternative pre-mRNA splicing. Cell. 2011 Jan;144(1):16–26. doi: 10.1016/j.cell.2010.11.056. [DOI] [PMC free article] [PubMed] [Google Scholar]
- 13.Pradeepa MM, Sutherland HG, Ule J, Grimes GR, Bickmore WA. Psip1/Ledgf p52 binds methylated histone H3K36 and splicing factors and contributes to the regulation of alternative splicing. PLoS Genet. 2012 Jan;8(5):e1002717. doi: 10.1371/journal.pgen.1002717. [DOI] [PMC free article] [PubMed] [Google Scholar]
- 14.Luco RF, Pan Q, Tominaga K, Blencowe BJ, Pereira-Smith OM, Misteli T. Regulation of alternative splicing by histone modifications. Science. 2010 Feb;327(5968):996–1000. doi: 10.1126/science.1184208. [DOI] [PMC free article] [PubMed] [Google Scholar]
- 15.Flores K, Wolschin F, Corneveaux JJ, Allen AN, Huentelman MJ, Amdam GV. Genome-wide association between DNA methylation and alternative splicing in an invertebrate. BMC Genomics. 2012 Jan;13:480. doi: 10.1186/1471-2164-13-480. [DOI] [PMC free article] [PubMed] [Google Scholar]
- 16.Zhou Y, Lu Y, Tian W. Epigenetic features are significantly associated with alternative splicing. BMC Genomics. 2012 Jan;13(1):123. doi: 10.1186/1471-2164-13-123. [DOI] [PMC free article] [PubMed] [Google Scholar]
- 17.Xiong HY, Barash Y, Frey BJ. Bayesian prediction of tissue-regulated splicing using RNA sequence and cellular context. Bioinformatics. 2011 Sep;27(18):2554–62. doi: 10.1093/bioinformatics/btr444. [DOI] [PubMed] [Google Scholar]
- 18.Barash Y, Calarco JA, Gao W, Pan Q, Wang X, Shai O, Blencowe BJ, Frey BJ. Deciphering the splicing code. Nature. 2010 May;465(7294):53–9. doi: 10.1038/nature09000. [DOI] [PubMed] [Google Scholar]
- 19.Shindo Y, Nozaki T, Saito R, Tomita M. Computational analysis of associations between alternative splicing and histone modifications. FEBS Lett. 2013 Mar;587(5):516–21. doi: 10.1016/j.febslet.2013.01.032. [DOI] [PubMed] [Google Scholar]
- 20.Zhu S, Wang G, Liu B, Wang Y. Modeling exon expression using histone modifications. PLoS One. 2013 Jan;8(6):e67448. doi: 10.1371/journal.pone.0067448. [DOI] [PMC free article] [PubMed] [Google Scholar]
- 21.Whitaker JW, Chen Z, Wang W. Predicting the human epigenome from DNA motifs. Nat Methods. 2014 Sep;12(3):265–272. doi: 10.1038/nmeth.3065. [DOI] [PMC free article] [PubMed] [Google Scholar]
- 22.Katz Y, Wang ET, Airoldi EM, Burge CB. Analysis and design of RNA sequencing experiments for identifying isoform regulation. Nat Methods. 2010 Dec;7(12):1009–15. doi: 10.1038/nmeth.1528. [DOI] [PMC free article] [PubMed] [Google Scholar]
- 23.Cusack BP, Arndt PF, Duret L, Roest Crollius H. Preventing dangerous nonsense: selection for robustness to transcriptional error in human genes. PLoS Genet. 2011 Oct;7(10):e1002276. doi: 10.1371/journal.pgen.1002276. [DOI] [PMC free article] [PubMed] [Google Scholar]
- 24.Wilke CO. Transcriptional robustness complements nonsense-mediated decay in humans. PLoS Genet. 2011 Oct;7(10):e1002296. doi: 10.1371/journal.pgen.1002296. [DOI] [PMC free article] [PubMed] [Google Scholar]
- 25.The MathWorks Inc. [Accessed: 22-May-2015];Create linear regression model using stepwise regression - MATLAB stepwiselm. [Online]. Available: http://www.mathworks.com/help/stats/stepwiselm.html.
- 26.Cartegni L. ESEfinder: a web resource to identify exonic splicing enhancers. Nucleic Acids Res. 2003 Jul;31(13):3568–3571. doi: 10.1093/nar/gkg616. [DOI] [PMC free article] [PubMed] [Google Scholar]
- 27.Fairbrother WG, Yeh RF, Sharp PA, Burge CB. Predictive identification of exonic splicing enhancers in human genes. Science. 2002 Aug;297(5583):1007–13. doi: 10.1126/science.1073774. [DOI] [PubMed] [Google Scholar]
- 28.Yeo G, Hoon S, Venkatesh B, Burge CB. Variation in sequence and organization of splicing regulatory elements in vertebrate genes. Proc Natl Acad Sci U S A. 2004 Nov;101(44):15700–5. doi: 10.1073/pnas.0404901101. [DOI] [PMC free article] [PubMed] [Google Scholar]
- 29. [Accessed: 23-May-2015];Deep Neural Networks for Acoustic Modeling in Speech Recognition - Microsoft Research. [Online]. Available: http://research.microsoft.com/apps/pubs/default.aspx?id=171498.
- 30. [Accessed: 24-Jul-2015];Prediction as a candidate for learning deep hierarchical models of data. [Online]. Available: http://www2.imm.dtu.dk/pubdb/views/publication_details.php?id=6284.
- 31.Hinton GE, Osindero S, Teh YW. A fast learning algorithm for deep belief nets. Neural Comput. 2006 Jul;18(7):1527–54. doi: 10.1162/neco.2006.18.7.1527. [DOI] [PubMed] [Google Scholar]
- 32.Srivastava N, Hinton G, Krizhevsky A, Sutskever I, Salakhutdinov R. Dropout: a simple way to prevent neural networks from overfitting. J Mach Learn Res. 2014 Jan;15(1):1929–1958. [Google Scholar]
- 33.Milne L. Feature Selection Using Neural Networks with Contribution Measures. [Google Scholar]
- 34.Li L, Neaves WB. Normal stem cells and cancer stem cells: the niche matters. Cancer Res. 2006 May;66(9):4553–7. doi: 10.1158/0008-5472.CAN-05-3986. [DOI] [PubMed] [Google Scholar]
- 35.Spike BT, Wahl GM. p53, Stem Cells, and Reprogramming: Tumor Suppression beyond Guarding the Genome. Genes Cancer. 2011 Apr;2(4):404–19. doi: 10.1177/1947601911410224. [DOI] [PMC free article] [PubMed] [Google Scholar]
- 36. [Accessed: 25-May-2015];Epigenetic similarities between Wilms tumor cells and normal kidney stem cells found -- ScienceDaily. [Online]. Available: http://www.sciencedaily.com/releases/2010/06/100603123720.htm.
- 37.Creyghton MP, Cheng AW, Welstead GG, Kooistra T, Carey BW, Steine EJ, Hanna J, Lodato MA, Frampton GM, Sharp PA, Boyer LA, Young RA, Jaenisch R. Histone H3K27ac separates active from poised enhancers and predicts developmental state. Proc Natl Acad Sci U S A. 2010 Dec;107(50):21931–6. doi: 10.1073/pnas.1016071107. [DOI] [PMC free article] [PubMed] [Google Scholar]
- 38.Rada-Iglesias A, Bajpai R, Swigut T, Brugmann SA, Flynn RA, Wysocka J. A unique chromatin signature uncovers early developmental enhancers in humans. Nature. 2011 Feb;470(7333):279–83. doi: 10.1038/nature09692. [DOI] [PMC free article] [PubMed] [Google Scholar]
- 39.Thomas BJ, Rubio ED, Krumm N, Broin PO, Bomsztyk K, Welcsh P, Greally JM, Golden AA, Krumm A. Allele-specific transcriptional elongation regulates monoallelic expression of the IGF2BP1 gene. Epigenetics Chromatin. 2011 Jan;4:14. doi: 10.1186/1756-8935-4-14. [DOI] [PMC free article] [PubMed] [Google Scholar]
- 40.Epigenetic regulation of RNA processing3: Nature ENCODE3. Nature Publishing Group; [Accessed: 23-May-2015]. [Online]. Available: http://www.nature.com/encode/threads/epigenetic-regulation-of-rna-processing. [Google Scholar]
- 41.RNA and chromatin modification patterns around promoters: Nature ENCODE3. Nature Publishing Group; [Accessed: 23-May-2015]. [Online]. Available: http://www.nature.com/encode/threads/rna-and-chromatin-modification-patterns-around-promoters. [Google Scholar]
- 42.Matthews KS. DNA looping. Microbiol Rev. 1992 Mar;56(1):123–36. doi: 10.1128/mr.56.1.123-136.1992. [DOI] [PMC free article] [PubMed] [Google Scholar]
- 43.Paek KY, Hong KY, Ryu I, Park SM, Keum SJ, Kwon OS, Jang SK. Translation initiation mediated by RNA looping. Proc Natl Acad Sci. 2015 Jan;112(4):201416883. doi: 10.1073/pnas.1416883112. [DOI] [PMC free article] [PubMed] [Google Scholar]
- 44.Rueda D, Lamichhane R, Auweter SD, Manatchal C, Austin KS, Valniuk O, Allain F. Evidence of RNA looping by PTB using Fluorescence Resonance Energy Transfer and NMR spectroscopy. The FASEB Journal. 2009 Apr;23(1_MeetingAbstracts) [Google Scholar]
Associated Data
This section collects any data citations, data availability statements, or supplementary materials included in this article.


