

Inhibiting DNA replication in C. elegans embryos causes loss of repressive histone modifications and generates epialleles.
Abstract
Impaired DNA replication is a hallmark of cancer and a cause of genomic instability. We report that, in addition to causing genetic change, impaired DNA replication during embryonic development can have major epigenetic consequences for a genome. In a genome-wide screen, we identified impaired DNA replication as a cause of increased expression from a repressed transgene in Caenorhabditis elegans. The acquired expression state behaved as an “epiallele,” being inherited for multiple generations before fully resetting. Derepression was not restricted to the transgene but was caused by a global reduction in heterochromatin-associated histone modifications due to the impaired retention of modified histones on DNA during replication in the early embryo. Impaired DNA replication during development can therefore globally derepress chromatin, creating new intergenerationally inherited epigenetic expression states.
INTRODUCTION
Multicopy transgene arrays are subject to epigenetic repression in the Caenorhabditis elegans germ line by the polycomb repressive complex 2 (PRC2) (1) and additional chromatin- and small RNA–related pathways (2–4). In C. elegans, modified histones and small RNAs are transmitted across generations (5, 6), acting as carriers of epigenetic information (7–10). In addition to germline silencing, multicopy transgene arrays also show variation in their somatic expression level, which, at least in some cases, can be epigenetically inherited between generations (11, 12).
RESULTS
To identify regulators of the heritable somatic repression of a daf-21::mCherry multicopy transgene array, we performed a genome-wide RNA interference (RNAi) screen (Fig. 1A). First-stage larval animals were fed in 96-well plates with bacteria expressing double-stranded RNA (dsRNA) targeting ~17,000 protein-coding genes, and expression from the array was scored in the adult worms of the same generation and in their larval progeny. Multiple RNAi clones that increased expression from the transgene targeted core components of the DNA replication machinery: DNA polymerase epsilon (pole-1 or pole-2), the polymerase α-primase complex (div-1, pri-2, or Y47D3A.29/POLA1), replication factor C (rfc-1 or rfc-3), and replication protein A (rpa-2) (Fig. 1B, fig. S1, and table S1).
Fig. 1. Impaired DNA replication during embryonic development derepresses a transgene array.
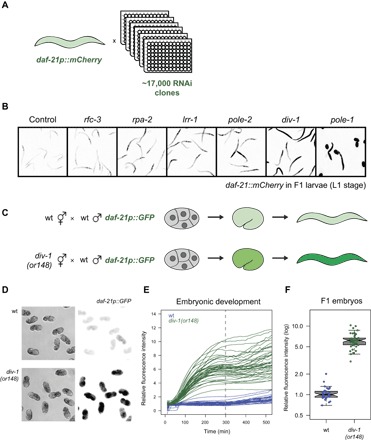
(A) Genome-wide RNAi screen to identify repressors of expression from a multicopy transgene array. (B) Expression of the daf-21p::mCherry transgene in F1 progeny when the indicated genes are inhibited by RNAi. (C) Male worms carrying a daf-21p::GFP multicopy transgene were crossed to wt or div-1(or148) mutant hermaphrodites. (D to F) Expression was quantified in F1 embryos by time-lapse microscopy. Quantification in (F) is at t = 300, indicated by the dashed line in (E) [6.2-fold difference, P = 1.4 × 10−46, two-sided t test; n = 33 and 42 for progeny of wt and div-1 hermaphrodites, respectively]. Crossing male div-1 animals to hermaphrodites carrying the daf-21p::mCherry did not result in an elevated transgene expression in the progeny (fig. S3), demonstrating that div-1(or148) heterozygosity in the progeny does not affect transgene expression during embyrogenesis. Effects on additional transgenes are summarized in table S4.
The core replication machinery is mostly encoded by essential genes, but we could confirm the RNAi phenotypes using a hypomorphic allele, or148, of the gene encoding the B subunit of DNA polymerase α-primase, div-1 (fig. S2) (13). This allele is a point mutation that causes delayed embryonic division due to prolonged S phase at 20°C and lethality at 25°C (13).
In C. elegans, the early stages of embryonic development are under maternal control (14). To test whether impaired DNA replication during embryonic development is sufficient to derepress the array, we crossed male animals carrying a daf-21p::GFP multicopy array to hermaphrodites carrying the div-1 mutation (Fig. 1C). In this way, the array is delivered from a wild-type (wt) father into an egg produced by mutant div-1 mothers, that is, containing mutant maternal div-1 mRNA and DIV-1 protein. Expression in the resulting progeny was strongly up-regulated from the onset of zygotic transcription (Fig. 1, D to F). In contrast, crossing mutant div-1 fathers to wt hermaphrodites carrying the array did not result in array derepression (fig. S3). Thus, impaired DNA replication during very early embryonic development results in increased expression from the start of zygotic transcription.
As in mammals, repressed chromatin in C. elegans is associated with specific histone modifications: trimethylation of histone H3 at lysine 27 (H3K27me3) and di- and trimethylation of H3 lysine 9 (H3K9me2/3) (15). In C. elegans, addition of H3K27me3 is catalyzed by the PRC2 (MES-2/3/6) complex (16). Inactivation of mes-2 (Fig. 2, A and B) strongly increased expression from the transgene array. Similarly, inactivation of MET-2, a putative histone methyltransferase required for mono- and dimethylation of H3K9 (3, 17), also strongly increased expression from the array (Fig. 2, A and B), as did inactivation of the putative H3K9me3 methyltransferase SET-25 (Fig. 2, A and B) (3). The very strong reduction in H3K9 methylation in a met-2;set-25 double mutant (3, 18) increased expression more than either single mutant (Fig. 2, A and B), and expression was highest in animals lacking H3K27me3 and H3K9me1/2/3 (mes-2;met-2;set-25 triple mutants; Fig. 2, A and B), consistent with multiple repressive pathways being partially redundantly involved in repression of the array.
Fig. 2. The absence of repressive histone modifications suppresses the effect of impaired replication on expression.
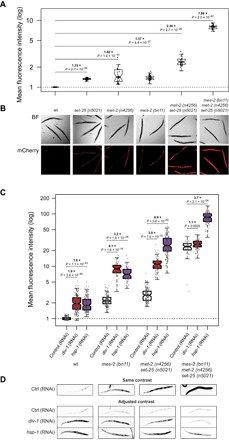
(A) Quantification of daf-21p::mCherry fluorescence intensity in adult worms with the indicated genotypes. Sample size: wt, 34; set-25, 37; met-2, 32; mes-2, 43; met-2;set-25, 32; mes-2;met-2;set-25, 29. (B) Representative images of mCherry fluorescence. BF, bright field. (C) Quantification of daf-21p::mCherry fluorescence intensity in L1 larvae with the indicated genotypes when either div-1 or hsp-1 is inhibited by RNAi. Each dot represents one worm. The y axis is in log scale. P values were calculated by two-sided t test. Sample size: wt (control, 153; div-1, 203; hsp-1, 180), mes-2 (control, 173; div-1, 32; hsp-1, 58), met-2;set-25 (control, 145; div-1, 73; hsp-1, 153), mes-2;met-2;set-25 (control, 55; div-1, 112; hsp-1, 97). (D) Representative images of mCherry fluorescence. Bottom: The contrast is adjusted for each genotype so that the change in expression relative to the control RNAi can be visualized. Ctrl, control.
We tested the effects of impaired DNA replication in embryos lacking these histone modifications alone and in combination. Impaired replication still resulted in a strong increase in expression in animals lacking H3K27me3 (Fig. 2, C and D), indicating that the effects of impaired replication are not simply due to altered inclusion of this modification. Similarly, the array was still strongly up-regulated when replication was impaired in animals lacking all H3K9 methylation (Fig. 2, C and D). Thus, the impact of impaired DNA replication cannot be due to alterations in just one of these repressive chromatin pathways. In contrast, the impact of impaired replication was strongly reduced in animals lacking both H3K27me3 and H3K9me1/2/3 (Fig. 2, C and D). This is not due to RNAi insensitivity or any saturation effect because inhibition of the chaperone HSP-1, which triggers a stress response and drives expression through the daf-21 promoter, still strongly increased expression from the array (Fig. 2, C and D). Increased expression from the array after pole-2(RNAi) treatment was also partially suppressed in mes-2;met-2;set-25 triple-mutant animals (fig. S4). This is consistent with impaired replication altering expression from the array by interfering with repression by multiple histone modifications (H3K27me3 and H3K9me1/2/3). In the absence of these modifications, impaired replication has a reduced effect on expression.
To characterize how the chromatin marks of the array are altered when replication is impaired, we first used chromatin immunoprecipitation (ChIP) to compare the levels of H3K27me3 in wt animals and in div-1 mutants. H3K27me3 was reduced on the array in animals with impaired replication (~3- and ~4-fold in the gene body and the promoter, respectively) (P < 0.01) (fig. S5). Impaired replication therefore interferes with the maintenance of H3K27me3 on the array. However, H3K27me3 levels changed similarly on four additional regions of the genome (fig. S5), indicating that the alterations to chromatin are not restricted to the high-copy array.
To investigate this further, we quantified the global levels of H3K27me3 in wt and div-1 chromatin from embryonic nuclei using immunofluorescence. Consistent with the ChIP results, H3K27me3 levels were globally reduced in the nuclei of early div-1 mutant embryos (Fig. 3A; 1.35-fold, P = 0.022). We used the same technique to quantify the levels of H3K9me3 and found that they were also globally depleted in the chromatin of div-1 embryos (Fig. 3B; 1.4-fold, P = 0.025). In contrast, the levels of a transcription activation–associated histone modification, H3K4me3, were increased in the div-1 embryos (Fig. 3C; 1.4-fold, P = 0.0055). All the embryos quantified were from the 2- to 10-cell stage, which is before the onset of major zygotic transcription, indicating that the changes in chromatin are not a secondary consequence of any changes in transcription. We also observed similar changes in late-stage div-1(RNAi) embryos (fig. S6), indicating that the changes in chromatin are maintained after the onset of transcription and during development. Depleting pole-2 confirmed the results obtained with div-1(RNAi) (fig. S7). The globally reduced levels of H3K27me3 and H3K9me3 were also confirmed by Western blotting (Fig. 3D and fig. S8). Impaired DNA replication therefore globally alters the histone modification levels in chromatin, including those before the onset of widespread zygotic transcription (19).
Fig. 3. Impaired DNA replication globally alters histone modifications.
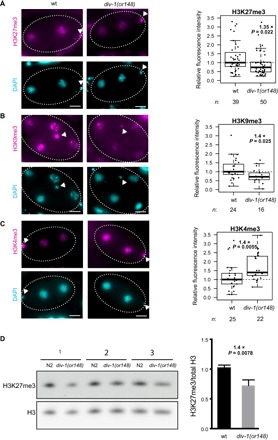
(A to C) Representative images and quantification of histone modification levels in wt and div-1 embryos derived from self-fertilizing hermaphrodites. Average of each embryo after subtracting the background is plotted. Fold change relative to wt and P values (two-sided t test) is indicated for each comparison. DAPI, 4′,6-diamidino-2-phenylindole. Scale bars, 50 μm. (D) Western blot analysis showing H3K27me3 and total H3. Samples are three biological replicates from synchronized wt and div-1(or148) L1s from hermaphrodite parents. Quantification is shown on the right (means + SD; two-sided t test). Antibodies used here were validated by us and others (5, 12).
To test whether loci other than the transgene array also have altered expression when replication is impaired, we sequenced RNA from wt and div-1 L1 stage larvae. Consistent with the response of the transgene array, many more genes had increased compared to decreased expression in the div-1 mutants [493 up-regulated genes versus 9 down-regulated genes at a false discovery rate (FDR) of <0.05].
To relate changes in expression to the normal chromatin state of each gene, we used data from the modENCODE consortium (15). Consistent with the response of the array, this revealed widespread up-regulation of genes with normally repressed chromatin states (Fig. 4). This derepression was observed for genes normally characterized by states defined by either high H3K9me2/3 or high H3K27me3 (Fig. 4). In contrast, genes without repressive chromatin states (15) in wt animals were not up-regulated as a group in div-1 mutants (Fig. 4). Together, these results show that impaired DNA replication during early development has a major impact on chromatin and gene expression, globally reducing the levels of repressive histone modifications and causing widespread up-regulation of heterochromatic genes in the resulting animals.
Fig. 4. Impaired DNA replication globally derepresses chromatin.

Fold change in expression of genes mapping to different modENCODE chromatin states between div-1 and wt L1 larvae. The number of genes assigned to each state is indicated.
A recent study demonstrated that paternal histones marked with H3K27me3 are transmitted from C. elegans sperm chromatin to the zygote (5). These paternally inherited histones marked with H3K27me3 are then recycled during replication and deposited on the two daughter DNA strands during each of the early embryonic divisions, even in the absence of a functional PRC2 complex (5). We hypothesized that the loss of heterochromatin-associated histone marks might result from reduced retention of heterochromatic histones on the genome during the embryonic cell divisions. To test this, we quantified the decay of paternally inherited histones marked with H3K27me3 in control and div-1(RNAi) embryos that were PRC2-deficient (Fig. 5). In this assay, there is no PRC2 activity in the early embryos because of the maternal mes-2 genotype, and only the paternal genome contributes H3K27me3-marked histones to the zygote. The dilution of these modified histones during the early embryonic cell divisions therefore quantifies the extent to which they are successfully transmitted to and retained on the DNA daughter strands during each replication cycle. Compared to in control embryos, the decay of H3K27me3-modified histones during the early cell cycles was accelerated in div-1(RNAi) animals (Fig. 5, B and C). Thus, impaired DNA replication induces the loss of H3K27me3 by impairing the retention of modified histones on the genome during the replication cycles of the early embryo. However, it is important to note that this assay does not exclude the possibility that impaired replication may also interfere with histone methyltransferase activity.
Fig. 5. Impaired replication interferes with the inheritance of H3K27me3-modified paternal histones.

(A) wt males were crossed to mes-2 mutant mothers either on control or div-1(RNAi) plates. Gravid worms were transferred to polylysine slides, gently squashed with a coverslip to allow embryos to extrude, and stained for H3K27me3. Images show H3K27me3 only in the paternal pronucleus. Scale bars, 50 μm. (B) Representative images of two-, four-, and eight-cell embryos from both groups stained with DAPI and an anti-H3K27me3 antibody. Scale bars, 50 μm. (C) Quantification of the H3K27me3 signal originating from the paternally deposited histones. Embryos were grouped according to the developmental stage, and a one-phase decay exponential curve was fitted through the data using Prism software. Decay rate constants for each curve are plotted in the inset. P values were calculated by two-sided t test. Sample size: control 1 (2 to 3, n = 19; 4 to 5, n = 15; 6 to 8, n = 6; 9 to 12, n = 8; 13 to 16, n = 7), control 2 (2 to 3, n = 21; 4 to 5, n = 11; 6 to 8, n = 11; 9 to 12, n = 10; 13 to 16, n = 7), control 3 (2 to 3, n = 16; 4 to 5, n = 17; 6 to 8, n = 7; 9 to 12, n = 2; 13 to 16, n = 1), div-1 1 (2 to 3, n = 16; 4 to 5, n = 23; 6 to 8, n = 15; 9 to 12, n = 9; 13 to 16, n = 5), div-1 2 (2 to 3, n = 36; 4 to 5, n = 27; 6 to 8, n = 16; 9 to 12, n = 22; 13 to 16, n = 5), div-1 3 (2 to 3, n = 28; 4 to 5, n = 22; 6 to 8, n = 10; 9 to 12, n = 4; 13 to 16, n = 1). Bars indicate SD, and the middle dots indicate the means. (D) Summary of the result of the experiment. Impaired DNA replication resulting from div-1 knockdown interferes with efficient transmission of H3K27me3 histones to daughter nuclei.
An important question in epigenetics is the extent to which acquired epigenetic states are transmitted between generations (20). We therefore tested what happens to the expression from the derepressed transgene array after normal DNA replication is restored. If the epigenetic state of the locus is not transmitted between generations, then restoration of normal DNA replication would result in the reestablishment of repression. In contrast, if the derepressed state is transmitted from parent to offspring, then expression would remain high in subsequent generations with normal replication.
To distinguish between these possibilities, we crossed wt males to div-1(or148) hermaphrodites (both carrying the daf-21p::mCherry transgene) and measured mCherry expression in the wt descendants for multiple generations (Fig. 6A). We found that the expression from the array was elevated for five generations after returning to the situation in which both animals and their parents had a wt div-1 genotype (Fig. 6B). Moreover, introducing the div-1(or148) mutation for a single generation before outcrossing was sufficient to induce transgenerationally inherited elevated expression (fig. S9). Thus, impaired DNA replication derepresses the transgene array, and this derepression takes multiple generations to completely reset after normal replication is restored. The return of the transgene expression to the basal level further demonstrates that the effect is epigenetic and not caused by genetic changes.
Fig. 6. Transgenerational epigenetic inheritance of acquired expression following DNA replication impairment.

(A) Experimental design. (B) Quantification of daf-21p::mCherry fluorescence intensity in wt (black) and div-1(or148) (red) animals and in their wt descendants following outcrossing of the or148 allele. At each generation, expression was normalized and compared to the control sample that was generated using the same batch of P0 males but crossed to wt ancestors and propagated in parallel in an analogous way. The y axis is in log scale. Sample size is indicated below each box plot. ****P < 0.0001; *P < 0.05; ns (not significant), P > 0.05 (Wilcoxon rank test).
DISCUSSION
Together, our results show that impaired DNA replication can have a major and directional epigenetic impact on a genome, resulting in a global loss of heterochromatic histone modifications, increased levels of euchromatic modifications, and increased expression from many normally heterochromatic genes. The mechanism underlying this is likely to be the impaired retention of modified histones on DNA during the early embryonic DNA replication cycles, as we have demonstrated for H3K27me3 (Fig. 7). Moreover, we have shown that the acquired expression changes following replication impairment can behave as “epialleles,” persisting for multiple generations before resetting (Fig. 7). The contribution of the individual histone marks affected by the perturbed replication to the process of inheritance remains to be investigated. The observation that inhibiting several epigenetic regulators also generates multigeneration changes in gene expression and phenotypes in C. elegans suggests that perturbed chromatin states may frequently be transmitted between generations in this species (8, 12, 21). Transient overexpression of a histone demethylase during mouse sperm development leads to reduced survival and developmental abnormalities for three subsequent generations (22), suggesting that similar phenomena might occur in mammals.
Fig. 7. Summary model.
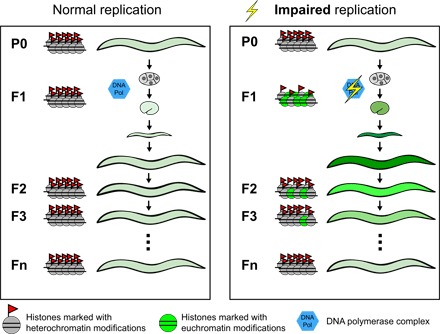
Impaired DNA replication during early embryonic divisions leads to inefficient retention of modified histones during chromatin replication, resulting in a reduction of heterochromatin-associated histone modifications and transgene derepression. Multiple generations are required to restore the repressed state.
Impaired replication is common in tumor cells (23) and also occurs during in vitro epigenetic reprogramming (24). Stalled replication forks can result in epigenetic alterations in chicken cells when repair pathways are inactivated (25), and persistent replication stress in Drosophila can generate polycomb-like phenotypes (26). In yeast, impaired DNA polymerase function (27) and deoxynucleotide triphosphate supply (28) can also have epigenetic consequences, and replication stress in mammalian cells alters the modifications detected on the pool of histones bound to the histone chaperone Asf1 (29). In future work, it will therefore be important to investigate the extent to which the rapid divisions and impaired cell cycle checkpoints (30–32) of early embryonic cells make their chromatin particularly vulnerable to impaired DNA replication, resulting in the global and directional changes in chromatin reported here. Moreover, it will be important to directly test the extent to which new epigenetic states in other species are transmitted through cell divisions and across generations, particularly given the limited transmission of modified histones to early embryos in mammals (33). Finally, we note that tumor cells also normally have impaired cell cycle checkpoints, suggesting that impaired DNA replication not only may be a driver of genomic instability but also perhaps may be a causal and directional driver of epigenetic alterations in cancer (34).
MATERIALS AND METHODS
Worm strains and culture conditions
All C. elegans strains used in this study are listed in table S2. Bristol N2 strain was used as the wt, and all other strains used were derived from it. Worms were cultured using standard conditions using NGM (nematode growth media) plates seeded with Escherichia coli OP-50 strain and grown at 20°C, including the div-1(or148) mutant strain, which is temperature-sensitive and exhibits 100% embryonic lethality at 25°C. The daf-21p::mCherry transgenic strain was generated by bombardment in an unc-119(ed3) background (35).
Genome-wide RNAi screen
The screen was carried out in high-throughput liquid feeding format in 96-well plates (36) using the Ahringer RNAi library (37). For the screen, a large number of embryos were harvested by bleaching, and the worms were hatched overnight in M9 to acquire a population of synchronized L1s. In the feeding plates, every well contained culture of one transformed E. coli clone, grown in 800 μl of LB + ampicillin (Amp) overnight at 37°C at 220 rpm. To set up the feeding, the worms were counted and diluted to have 5 worms/μl, and 10 μl of worms was dispensed into each well to have 50 to 75 worms per well. One hour before adding the E. coli cultures to the wells, double-stranded RNA synthesis was induced by adding 4 μl of 1 M isopropyl-β-d-thiogalactopyranoside (IPTG) to the cultures, which were then grown for 1 hour at 37°C at 220 rpm. The bacteria were pelleted at 2500g for 5 min and resuspended in 100 μl of NGM + Amp and IPTG. A total of 40 μl of the resuspended bacteria was added to each well of 50 to 75 worms. The worms were allowed to grow until most of the food had been consumed and the worms were gravid with some L1 larvae around (88 to 90 hours). Each 96-well plate included several wells of feeding with control RNAi to be used as a reference well for screening. The primary screen was carried out by eye with a Leica DMI6000 B microscope with a Lumen 200 metal arc lamp, observing the intensity of the transgene expression under the microscope with ×10 magnification. The secondary more stringent screen was carried out feeding the worms in triplicate with all the primary hits.
Additional RNAi experiments
The control RNAi strain used for all experiments produces dsRNA that does not map to any expressed sequence of the genome (Y95B8A_84.g). For the experiment in Fig. 2, the RNAi bacteria were spotted on NGM plates containing Amp and IPTG (38). Synchronized L4 worms were then transferred from OP50 plates and grown at 20°C for 24 hours. The F1 embryos were extracted from gravid animals through hypochloride treatment and allowed to hatch overnight in M9 buffer. Successfully hatched L1 animals were examined for expression of mCherry. For the mes-2 and met-2;mes-2;set-25 mutants, P0 worms showing a clear uncoordinated phenotype (hence homozygous for mes-2 mutation) were picked to ensure the correct genotype of the mothers. hsp-1 RNAi bacteria were diluted with three parts of control RNAi strain for one part of hsp-1 RNAi to reduce the severity of the phenotype and allow examination of expression in F1 progeny.
Time-lapse microscopy and expression quantification
When the goal was to analyze the progeny after the cross, the crosses were carried out at 20°C by picking about one male per hermaphrodite (L4 larvae). After 24 hours, for each cross, 60 fertilized hermaphrodites were transferred to a well of concave glass slide containing 50 μl of phosphate-buffered saline (PBS). The embryos were released by cutting the worms with surgical needles. The embryos were washed briefly with an equal volume of 5% hypochlorite solution followed by four rounds of washing with 2 volumes of PBS. Four-cell stage were collected with a mouth pipette, washed twice in 200 μl of PBS and transferred to the 96-well plates (optical bottom; Nunc) with 100 μl of PBS. The embryos were carefully moved with an eyelash pick to the center of the field view and imaged with a Leica DMI6000 B microscope. The two biological samples were processed in parallel, each on a separate slide. The selection of staged embryos was done within 5 min for each sample to ensure the synchrony of the embryos. For time lapse, the images were taken with a 10× objective every 10 min for 16 hours in bright field and green (green fluorescent protein) channels. The images were analyzed with ImageJ where the embryos were first selected in bright field, and the selection was transferred to the fluorescent images, from where the level of expression was quantified. For each embryo, a background area was selected from close proximity to which the intensity (“integrated intensity” in imageJ) was then normalized. The same process was carried out for all the time points, giving a transgene expression intensity curve that was visualized with R (version 2.15.3). All subsequent analysis was carried out with R.
ChIP–quantitative polymerase chain reaction
Synchronized worms were grown on OP50 feeding plates to obtain gravid adults (about 65 to 70 hours after L1) that were collected in M9. The samples were fixed in 1.5% formaldehyde at room temperature for 30 min and quenched with 0.25 M glycine at room temperature for 15 min. The samples were washed twice with M9 and once with FA buffer [50 mM Hepes-KOH (pH 7.5), 1 mM EDTA, 1% Triton X-100, 0.1% sodium deoxycholate, and 150 mM NaCl] with protease inhibitors (Mini EDTA-free, Roche cOmplete). The worm pellet was snap-frozen, and FA buffer (+ protease inhibitors) was added to the samples and sonicated using the Bioruptor Sonication System Diagenode version 1.1, at 4°C for 20 cycles (high power, 30 s on + 30 s off) to achieve chromatin fragment sizes of 200 to 600 base pairs (bp) and was centrifuged for 25 min at 4°C at 13,000 rpm. Protein (0.1 mg) was added into the primary antibody reaction in FA buffer (+ protease inhibitors) up to 500 μl with 2 μl of H3K27me3 (Millipore 07-449) antibody. From each experiment, 1% of the volume was stored as an input control at −20°C before adding the antibody. The first antibody reaction was rotated at 4°C overnight. The next day, 30 μl of unblocked protein A beads (Diagenode catalog no. kch-503-880) was washed with 500 μl of FA buffer. The chromatin/first antibody mix was added to the beads, followed by 2-hour rotation at 4°C. The beads were washed thrice with 1 ml of low-salt buffer [50 mM Hepes-KOH (pH 7.5), 150 mM NaCl, 1% Triton X-100] and once with 1 ml of high-salt buffer [50 mM Hepes-KOH (pH 7.5), 500 mM NaCl, and 1% Triton X-100]. All centrifugations were carried out for 3 min at 4°C at 3000 rpm. After the last wash, the beads were left to dry, and the samples were eluted along with the input samples in 100 μl of fresh elution buffer (1% SDS with 0.1 M NaHCO3) for 3 hours at 65°C at 1100 rpm. The beads were centrifuged at 3000 rpm, the supernatant was purified with QIAquick PCR Purification Kit (#28104), and the samples were eluted in 200 μl of polymerase chain reaction (PCR)–grade water. Quantitative PCR (qPCR) reactions were run in LightCycler 480 Multiwell Plate 384, each well containing 2 μl of the sample, 5 μl of the 2× LightCycler 480 SYBR Green I Master Mix, and 1 μM of reverse and forward primers.
From the qPCR analysis, the cycle threshold was first normalized to the input and with the Δ-Δ method (39), and the percent input was calculated. For each antibody, this value was then normalized to the percent input value of H3 total histone. For each biological replicate, two technical replicates were analyzed.
Immunofluorescence
Immunofluorescence was performed using a method adapted from the approach of the Seydoux laboratory (40). Gravid worms were picked into 5 μl of M9 on top of a polylysine-coated slide. A coverslip was placed, and the worms were gently squashed to allow embryos to extrude. The embryos were immediately freeze-cracked on liquid nitrogen and fixed with methanol for 10 min, followed by acetone for an additional 10 min. After three washes in PBS containing 0.25% Triton X-100 (PBS-T), slides were blocked in PBS-T with 0.5% bovine serum albumin (BSA) before overnight incubation with primary antibody [H3K9me3 (#61013, Active Motif), H3K4me3 (#ab8580, Abcam), or H3K27me3 (#07-449, Millipore)] at 4°C. The slides were then washed with PBS-T and incubated for 2 hours with secondary antibody (Alexa 555, Invitrogen) at room temperature. After three washes in PBS-T, the samples were mounted in Fluoroshield with DAPI mounting medium (Sigma). Images were taken using a Leica DMI6000 B microscope. Quantification was performed using ImageJ. Chromatin masks for each nucleus were created using the DAPI channel. Using these masks, histone modification fluorescence for each embryo was measured as the average of all the nuclei in the embryo. For each embryo, a background area with no nuclei was selected to which the intensity was then normalized. Embryo average fluorescence after subtracting the background was plotted. Metaphase nuclei were not taken into account for quantification. Considering only interphase nuclei did not change these results (fig. S10).
Western blotting
Synchronized L1 animals were obtained by bleaching gravid adults, followed by three washes and an overnight hatch in M9. Worms were counted, resuspended in sample buffer [2.36% SDS, 9.43% glycerol, 5% β-mercaptoethanol, 0.0945 M tris-HCl (pH 6.8), 0.001% bromophenol blue], snap-frozen in liquid nitrogen, and sonicated three times for 30 s at 15 W. Samples were then boiled for 2 min and loaded on a precast SDS–polyacrylamide gel electrophoresis (15%) gel (Invitrogen). Transfer to nitrocellulose membranes was done using iBlot (Thermo Fisher) system. The membranes were incubated with primary antibodies for 1 hour [H3K27me3 (#07-449, Millipore), H3 (ab1791, Abcam), and H3K9me3 (ab8898, Abcam)] and washed six times with PBS-T + BSA, followed by an incubation with horseradish peroxidase–conjugated anti-rabbit secondary antibody. For Fig. 3, membranes were stripped after exposure to H3K27me3 antibody. Secondary antibody incubation after stripping confirmed that H3K27me3 antibody had been completely removed before probing for total H3 as loading control. Images were taken with Amersham Imager 600, and quantification was performed with ImageJ.
RNA sequencing
L1 wt and div-1 larvae were harvested in triplicate, and RNA was extracted using TRIzol and freeze-cracking. Libraries were prepared using TruSeq Stranded mRNA Sample Prep Kit version 3 (reference no. RS-122-2101/2, Illumina) according to the manufacturer’s protocol. Briefly, 1 μg of total RNA was used for poly(A)-mRNA selection using streptavidin-coated magnetic beads and was subsequently fragmented to approximately 300 bp. Complementary DNA (cDNA) was synthesized using reverse transcriptase (SuperScript II, reference no. 18064-014, Invitrogen) and random primers. The second strand of the cDNA incorporated deoxyuridine triphosphate in place of deoxythymidine triphosphate. Double-stranded DNA was further used for library preparation and was subjected to A-tailing and ligation of the barcoded TruSeq adapters. Library amplification was performed by PCR using the primer cocktail supplied in the kit. All purification steps were performed using AMPure XP Beads (reference no. A63880, Beckman Coulter). Final libraries were analyzed using an Agilent DNA 1000 chip to estimate the quantity and to check size distribution and were then quantified by qPCR using the KAPA Library Quantification Kit (reference no. KK4835, Kapa Biosystems) before amplification with Illumina’s cBot. Indexed libraries were loaded at a concentration of 2 pM onto the flow cell (12 pM per lane) and were sequenced 1 × 50 on Illumina’s HiSeq 2000.
Sequence reads were mapped using TopHat2 version 2.1.0 (41), with default parameters against a custom genome consisting of the C. elegans genome assembly WS215 from WormBase and the sequence of the transgene vector. Reads aligning to different genomic features were counted using featureCounts version 1.5.0 (42) with the option -s 2 -M --fraction to include multimapping reads and weighting them by number of matches. We used the C. elegans genome annotation from Ensembl Release 70. Data scaling, normalization, and tests for differential expression were performed using DESeq2 package version 1.8.1 (43) for R 3.2.0 (R Core Team 2015). Chromatin state segmentation and description were from modENCODE (15) using the early-stage embryo chromatin. Each gene was assigned to all overlapping states.
Intergenerational inheritance of expression changes
Male P0 worms homozygous for the daf-21p::mCherry array where crossed to P0 hermaphrodites carrying the daf-21p::mCherry array in addition to either a wt [denoted as div-1(+)] or mutant div-1(or148) allele. Expression was quantified in these P0 hermaphrodites. F1 hermaphrodite progeny were picked at the L4 stage to separate plates and allowed to self. After 3 days, single F2 progeny L4 hermaphrodites were transferred to separate wells. Two days later, the adult worms were removed (leaving multiple laid F3 embryos and larvae in the well) and genotyped using PCR (forward primer, gaacggagcacttgggaaga; reverse primer, tgttcgtgggaccaatgaga), followed by 1-hour restriction digest with Bsr GI (New England Biolabs), cutting only the div-1(or148) allele product. F3 progeny of F2 worms identified as wt were subsequently followed and analyzed for expression of mCherry for several generations. All worms were picked and handled at a standard dissecting microscope with no fluorescence to avoid any biases. At each generation, mean fluorescence intensity in day-1 adults was used as a readout. We normalized the expression of div-1 descendants to the median expression of descendants of wt worms propagated in parallel.
Statistical analyses
Unless otherwise stated, all statistical analyses were performed using R (version 2.15.3). Box plots in all figure plots indicate median and first and third quartiles. Lower and upper whiskers extend to 1.5× the interquartile range (IQR) from the first and third quartiles, respectively. Notches, where present, extend 1.57 × IQR/. Sample size depended on the ease of preparation and was larger for L1 animals that were treated, imaged, and analyzed in bulk, in contrast to adult animals that were picked manually under a dissecting scope before imaging, resulting in a relatively smaller sample size. No animals were excluded from the analysis. No blinding or randomization was used.
Acknowledgments
All sequencing experiments were performed in the Centre for Genomic Regulation (CRG) Genomics Core Facility. Funding: This work was supported by a European Research Council Consolidator grant (616434), the Spanish Ministry of Economy and Competitiveness (BFU2011-26206 and “Centro de Excelencia Severo Ochoa 2013-2017” SEV-2012-0208), the AXA Research Fund, the Bettencourt-Schueller Foundation, Agencia de Gestio d’Ajuts Universitaris i de Recerca (AGAUR), FP7 project 4DCellFate (277899), and the European Molecular Biology Laboratory–CRG Systems Biology Program. A.K. was partially supported by a la Caixa Fellowship. E.C. and T.V. are supported by the Spanish Ministry of Economy and Competitiveness (grants BFU2015-70581 and IEDI-2016-00787). E.C. is supported by an FI AGAUR PhD fellowship. Author contributions: A.K., K.R., and C.H.-C. performed the experiments and data analyses. E.C. and T.V. designed and performed analyses of RNA sequencing data. A.K. and B.L. designed the experiments, interpreted the data, and wrote the manuscript. Competing interests: The authors declare they have no competing interests. Data and materials availability: All data needed to evaluate the conclusions in the paper are present in the paper and/or the Supplementary Materials. Additional data related to this paper may be requested from the authors. RNA sequencing data are available at Gene Expression Omnibus under the GSE95034 entry number.
SUPPLEMENTARY MATERIALS
Supplementary material for this article is available at http://advances.sciencemag.org/cgi/content/full/3/8/e1701143/DC1
fig. S1. Expression of the daf-21p::mCherry reporter in the progeny of animals treated with RNAi targeting different subunits of the DNA polymerase complex and its associated proteins.
fig. S2. Increased transgene expression in div-1 mutants.
fig. S3. Maternal div-1 deficiency results in elevated transgene expression in the offspring.
fig. S4. Transgene up-regulation following pole-2 knockdown is suppressed in the mes-2;met-2;set-25 triple-mutant background.
fig. S5. Impaired DNA replication reduces H3K27me3 levels on multiple loci.
fig. S6. Global reduction of repressive histone marks and a gain of activating histone marks in late div-1(or148) embryos.
fig. S7. Knockdown of pole-2 results in reduction of H3K27me3 mark and increase in H3K4me3 in early embryonic chromatin.
fig. S8. Reduction in H3K9me3 mark in div-1(or148) mutant L1s detected by Western blot.
fig. S9. Passage of the transgenic array through impaired replication for a single generation is sufficient to trigger a multigenerational effect.
fig. S10. Quantification of H3K27me3 in interphase nuclei.
table S1. List of genes whose knockdown results in upregulation of daf- 21p::mCherry transgene.
table S2. C. elegans strains used in this study.
table S3. Primers used in qPCR analyses.
table S4. Transgenes tested for derepression with div-1(RNAi).
REFERENCES AND NOTES
- 1.Kelly W. G., Fire A., Chromatin silencing and the maintenance of a functional germline in Caenorhabditis elegans. Development 125, 2451–2456 (1998). [DOI] [PMC free article] [PubMed] [Google Scholar]
- 2.Lehner B., Calixto A., Crombie C., Tischler J., Fortunato A., Chalfie M., Fraser A. G., Loss of LIN-35, the Caenorhabditis elegans ortholog of the tumor suppressor p105Rb, results in enhanced RNA interference. Genome Biol. 7, R4 (2006). [DOI] [PMC free article] [PubMed] [Google Scholar]
- 3.Towbin B. D., González-Aguilera C., Sack R., Gaidatzis D., Kalck V., Meister P., Askjaer P., Gasser S. M., Step-wise methylation of histone H3K9 positions heterochromatin at the nuclear periphery. Cell 150, 934–947 (2012). [DOI] [PubMed] [Google Scholar]
- 4.Wu X., Shi Z., Cui M., Han M., Ruvkun G., Repression of germline RNAi pathways in somatic cells by retinoblastoma pathway chromatin complexes. PLOS Genet. 8, e1002542 (2012). [DOI] [PMC free article] [PubMed] [Google Scholar]
- 5.Gaydos L. J., Wang W., Strome S., H3K27me and PRC2 transmit a memory of repression across generations and during development. Science 345, 1515–1518 (2014). [DOI] [PMC free article] [PubMed] [Google Scholar]
- 6.Sapetschnig A., Sarkies P., Lehrbach N. J., Miska E. A., Tertiary siRNAs mediate paramutation in C. elegans. PLOS Genetics 11, e1005078 (2015). [DOI] [PMC free article] [PubMed] [Google Scholar]
- 7.Rechavi O., Houri-Ze’evi L., Anava S., Goh W. S. S., Kerk S. Y., Hannon G. J., Hobert O., Starvation-induced transgenerational inheritance of small RNAs in C. elegans. Cell 158, 277–287 (2014). [DOI] [PMC free article] [PubMed] [Google Scholar]
- 8.Greer E. L., Maures T. J., Ucar D., Hauswirth A. G., Mancini E., Lim J. P., Benayoun B. A., Shi Y., Brunet A., Transgenerational epigenetic inheritance of longevity in Caenorhabditis elegans. Nature 479, 365–371 (2011). [DOI] [PMC free article] [PubMed] [Google Scholar]
- 9.Schott D., Yanai I., Hunter C. P., Natural RNA interference directs a heritable response to the environment. Sci. Rep. 4, 7387 (2014). [DOI] [PMC free article] [PubMed] [Google Scholar]
- 10.Tauffenberger A., Parker J. A., Heritable transmission of stress resistance by high dietary glucose in Caenorhabditis elegans. PLOS Genet. 10, e1004346 (2014). [DOI] [PMC free article] [PubMed] [Google Scholar]
- 11.Arico J. K., Katz D. J., van der Vlag J., Kelly W. G., Epigenetic patterns maintained in early Caenorhabditis elegans embryos can be established by gene activity in the parental germ cells. PLOS Genet. 7, e1001391 (2011). [DOI] [PMC free article] [PubMed] [Google Scholar]
- 12.Klosin A., Casas E., Hidalgo-Carcedo C., Vavouri T., Lehner B., Transgenerational transmission of environmental information in C. elegans. Science 356, 320–323 (2017). [DOI] [PubMed] [Google Scholar]
- 13.Encalada S. E., Martin P. R., Phillips J. B., Lyczak R., Hamill D. R., Swan K. A., Bowerman B., DNA replication defects delay cell division and disrupt cell polarity in early Caenorhabditis elegans embryos. Dev. Biol. 228, 225–238 (2000). [DOI] [PubMed] [Google Scholar]
- 14.Evans T. C., Hunter C. P., Translational control of maternal RNAs. WormBook 10, 1–11 (2005). [DOI] [PMC free article] [PubMed] [Google Scholar]
- 15.Ho J. W. K., Jung Y. L., Liu T., Alver B. H., Lee S., Ikegami K., Sohn K.-A., Minoda A., Tolstorukov M. Y., Appert A., Parker S. C. J., Gu T., Kundaje A., Riddle N. C., Bishop E., Egelhofer T. A., Hu S. S., Alekseyenko A. A., Rechtsteiner A., Asker D., Belsky J. A., Bowman S. K., Chen Q. B., Chen R. A.-J., Day D. S., Dong Y., Dose A. C., Duan X., Epstein C. B., Ercan S., Feingold E. A., Ferrari F., Garrigues J. M., Gehlenborg N., Good P. J., Haseley P., He D., Herrmann M., Hoffman M. M., Jeffers T. E., Kharchenko P. V., Kolasinska-Zwierz P., Kotwaliwale C. V., Kumar N., Langley S. A., Larschan E. N., Latorre I., Libbrecht M. W., Lin X., Park R., Pazin M. J., Pham H. N., Plachetka A., Qin B., Schwartz Y. B., Shoresh N., Stempor P., Vielle A., Wang C., Whittle C. M., Xue H., Kingston R. E., Kim J. H., Bernstein B. E., Dernburg A. F., Pirrotta V., Kuroda M. I., Noble W. S., Tullius T. D., Kellis M., MacAlpine D. M., Strome S., Elgin S. C. R., Liu X. S., Lieb J. D., Ahringer J., Karpen G. H., Park P. J., Comparative analysis of metazoan chromatin organization. Nature 512, 449–452 (2014). [DOI] [PMC free article] [PubMed] [Google Scholar]
- 16.Bender L. B., Cao R., Zhang Y., Strome S., The MES-2/MES-3/MES-6 complex and regulation of histone H3 methylation in C. elegans. Curr. Biol. 14, 1639–1643 (2004). [DOI] [PubMed] [Google Scholar]
- 17.Andersen E. C., Horvitz H. R., Two C. elegans histone methyltransferases repress lin-3 EGF transcription to inhibit vulval development. Development 134, 2991–2999 (2007). [DOI] [PubMed] [Google Scholar]
- 18.Garrigues J. M., Sidoli S., Garcia B. A., Strome S., Defining heterochromatin in C. elegans through genome-wide analysis of the heterochromatin protein 1 homolog HPL-2. Genome Res. 25, 76–88 (2015). [DOI] [PMC free article] [PubMed] [Google Scholar]
- 19.Edgar L. G., Wolf N., Wood W. B., Early transcription in Caenorhabditis elegans embryos. Development 120, 443–451 (1994). [DOI] [PubMed] [Google Scholar]
- 20.Klosin A., Lehner B., Mechanisms, timescales and principles of trans-generational epigenetic inheritance in animals. Curr. Opin. Genet. Dev. 36, 41–49 (2016). [DOI] [PubMed] [Google Scholar]
- 21.Greer E. L., Becker B., Latza C., Antebi A., Shi Y., Mutation of C. elegans demethylase spr-5 extends transgenerational longevity. Cell Res. 26, 229–238 (2016). [DOI] [PMC free article] [PubMed] [Google Scholar]
- 22.Siklenka K., Erkek S., Godmann M., Lambrot R., McGraw S., Lafleur C., Cohen T., Xia J., Suderman M., Hallett M., Trasler J., Peters A. H. F. M., Kimmins S., Disruption of histone methylation in developing sperm impairs offspring health transgenerationally. Science 350, aab2006 (2015). [DOI] [PubMed] [Google Scholar]
- 23.Gaillard H., García-Muse T., Aguilera A., Replication stress and cancer. Nat. Rev. Cancer 15, 276–289 (2015). [DOI] [PubMed] [Google Scholar]
- 24.Ruiz S., Lopez-Contreras A. J., Gabut M., Marion R. M., Gutierrez-Martinez P., Bua S., Ramirez O., Olalde I., Rodrigo-Perez S., Li H., Marques-Bonet T., Serrano M., Blasco M. A., Batada N. N., Fernandez-Capetillo O., Limiting replication stress during somatic cell reprogramming reduces genomic instability in induced pluripotent stem cells. Nat. Commun. 6, 8036 (2015). [DOI] [PMC free article] [PubMed] [Google Scholar]
- 25.Sarkies P., Reams C., Simpson L. J., Sale J. E., Epigenetic instability due to defective replication of structured DNA. Mol. Cell 40, 703–713 (2010). [DOI] [PMC free article] [PubMed] [Google Scholar]
- 26.Landais S., D’Alterio C., Jones D. L., Persistent replicative stress alters polycomb phenotypes and tissue homeostasis in Drosophila melanogaster. Cell Rep. 7, 859–870 (2014). [DOI] [PMC free article] [PubMed] [Google Scholar]
- 27.Iida T., Araki H., Noncompetitive counteractions of DNA polymerase ε and ISW2/yCHRAC for epigenetic inheritance of telomere position effect in Saccharomyces cerevisiae. Mol. Cell. Biol. 24, 217–227 (2004). [DOI] [PMC free article] [PubMed] [Google Scholar]
- 28.Singh G., Klar A. J. S., Mutations in deoxyribonucleotide biosynthesis pathway cause spreading of silencing across heterochromatic barriers at the mating-type region of the fission yeast. Yeast 25, 117–128 (2008). [DOI] [PubMed] [Google Scholar]
- 29.Jasencakova Z., Scharf A. N. D., Ask K., Corpet A., Imhof A., Almouzni G., Groth A., Replication stress interferes with histone recycling and predeposition marking of new histones. Mol. Cell 37, 736–743 (2010). [DOI] [PubMed] [Google Scholar]
- 30.Brauchle M., Baumer K., Gönczy P., Differential activation of the DNA replication checkpoint contributes to asynchrony of cell division in C. elegans embryos. Curr. Biol. 13, 819–827 (2003). [DOI] [PubMed] [Google Scholar]
- 31.Holway A. H., Kim S.-H., La Volpe A., Michael W. M., Checkpoint silencing during the DNA damage response in Caenorhabditis elegans embryos. J. Cell Biol. 172, 999–1008 (2006). [DOI] [PMC free article] [PubMed] [Google Scholar]
- 32.van den Heuvel S., Cell-cycle regulation. WormBook 2005, 1–16 (2005). [DOI] [PMC free article] [PubMed] [Google Scholar]
- 33.Casas E., Vavouri T., Sperm epigenomics: Challenges and opportunities. Front. Genet. 5, 330 (2014). [DOI] [PMC free article] [PubMed] [Google Scholar]
- 34.Jasencakova Z., Groth A., Replication stress, a source of epigenetic aberrations in cancer? Bioessays 32, 847–855 (2010). [DOI] [PubMed] [Google Scholar]
- 35.Burga A., Casanueva M. O., Lehner B., Predicting mutation outcome from early stochastic variation in genetic interaction partners. Nature 480, 250–253 (2011). [DOI] [PubMed] [Google Scholar]
- 36.Lehner B., Tischler J., Fraser A. G., RNAi screens in Caenorhabditis elegans in a 96-well liquid format and their application to the systematic identification of genetic interactions. Nat. Protoc. 1, 1617–1620 (2006). [DOI] [PubMed] [Google Scholar]
- 37.Kamath R. S., Ahringer J., Genome-wide RNAi screening in Caenorhabditis elegans. Methods 30, 313–321 (2003). [DOI] [PubMed] [Google Scholar]
- 38.Kamath R. S., Martinez-Campos M., Zipperlen P., Fraser A. G., Ahringer J., Effectiveness of specific RNA-mediated interference through ingested double-stranded RNA in Caenorhabditis elegans. Genome Biol. 2, RESEARCH0002 (2001). [DOI] [PMC free article] [PubMed] [Google Scholar]
- 39.Livak K. J., Schmittgen T. D., Analysis of relative gene expression data using real-time quantitative PCR and the 2–ΔΔCT method. Methods 25, 402–408 (2001). [DOI] [PubMed] [Google Scholar]
- 40.Wang J. T., Smith J., Chen B.-C., Schmidt H., Rasoloson D., Paix A., Lambrus B. G., Calidas D., Betzig E., Seydoux G., Regulation of RNA granule dynamics by phosphorylation of serine-rich, intrinsically disordered proteins in C. elegans. eLife 3, e04591 (2014). [DOI] [PMC free article] [PubMed] [Google Scholar]
- 41.Kim D., Pertea G., Trapnell C., Pimentel H., Kelley R., Salzberg S. L., TopHat2: Accurate alignment of transcriptomes in the presence of insertions, deletions and gene fusions. Genome Biol. 14, R36 (2013). [DOI] [PMC free article] [PubMed] [Google Scholar]
- 42.Liao Y., Smyth G. K., Shi W., featureCounts: An efficient general purpose program for assigning sequence reads to genomic features. Bioinformatics 30, 923–930 (2014). [DOI] [PubMed] [Google Scholar]
- 43.Love M. I., Huber W., Anders S., Moderated estimation of fold change and dispersion for RNA-seq data with DESeq2. Genome Biol. 15, 550 (2014). [DOI] [PMC free article] [PubMed] [Google Scholar]
Associated Data
This section collects any data citations, data availability statements, or supplementary materials included in this article.
Supplementary Materials
Supplementary material for this article is available at http://advances.sciencemag.org/cgi/content/full/3/8/e1701143/DC1
fig. S1. Expression of the daf-21p::mCherry reporter in the progeny of animals treated with RNAi targeting different subunits of the DNA polymerase complex and its associated proteins.
fig. S2. Increased transgene expression in div-1 mutants.
fig. S3. Maternal div-1 deficiency results in elevated transgene expression in the offspring.
fig. S4. Transgene up-regulation following pole-2 knockdown is suppressed in the mes-2;met-2;set-25 triple-mutant background.
fig. S5. Impaired DNA replication reduces H3K27me3 levels on multiple loci.
fig. S6. Global reduction of repressive histone marks and a gain of activating histone marks in late div-1(or148) embryos.
fig. S7. Knockdown of pole-2 results in reduction of H3K27me3 mark and increase in H3K4me3 in early embryonic chromatin.
fig. S8. Reduction in H3K9me3 mark in div-1(or148) mutant L1s detected by Western blot.
fig. S9. Passage of the transgenic array through impaired replication for a single generation is sufficient to trigger a multigenerational effect.
fig. S10. Quantification of H3K27me3 in interphase nuclei.
table S1. List of genes whose knockdown results in upregulation of daf- 21p::mCherry transgene.
table S2. C. elegans strains used in this study.
table S3. Primers used in qPCR analyses.
table S4. Transgenes tested for derepression with div-1(RNAi).