Abstract
Variants of the SLC22A4 gene are associated with susceptibility to rheumatoid arthritis and Crohn's disease. SLC22A4 codes for an integral membrane protein, OCTN1, that has been presumed to carry organic cations like tetraethylammonium across the plasma membrane. Here, we show that the key substrate of this transporter is in fact ergothioneine (ET). Human OCTN1 was expressed in 293 cells. A substrate lead, stachydrine (alias proline betaine), was identified by liquid chromatography MS difference shading, a new substrate search strategy. Analysis of transport efficiency of stachydrine-related solutes, affinity, and Na+ dependence indicates that the physiological substrate is ET. Efficiency of transport of ET was as high as 195 μl per min per mg of protein. By contrast, the carnitine transporter OCTN2 from rat did not transport ET at all. Because ET is transported >100 times more efficiently than tetraethylammonium and carnitine, we propose the functional name ETT (ET transporter) instead of OCTN1. ET, all of which is absorbed from food, is an intracellular antioxidant with metal ion affinity. Its particular purpose is unresolved. Cells with expression of ETT accumulate ET to high levels and avidly retain it. By contrast, cells lacking ETT do not accumulate ET, because their plasma membrane is virtually impermeable for this compound. The real-time PCR expression profile of human ETT, with strong expression in CD71+ cells, is consistent with a pivotal function of ET in erythrocytes. Moreover, prominent expression of ETT in monocytes and SLC22A4 polymorphism associations suggest a protective role of ET in chronic inflammatory disorders.
Keywords: erythrocyte, inflammation
Very recently, two independent groups have reported an association between chronic inflammatory diseases (rheumatoid arthritis and Crohn's disease) and polymorphisms within the SLC22A4 gene (1, 2). SLC22A4 codes for OCTN1, which belongs to the amphiphilic solute facilitator (ASF) family of integral membrane transporters (3). OCTN1 was independently cloned by us and others some years ago (GenBank accession no. Y09881). In the first publication, OCTN1 (novel organic cation transporter) was shown to transport tetraethylammonium (TEA) and was suggested to operate as a H+/organic cation antiporter (4). Later, OCTN1 was designated as a “multispecific” cationic drug transporter with a broad substrate specificity (5, 6). Alternatively, because of sequence similarity with the carnitine transporter OCTN2 (7), OCTN1 was suggested to be another carnitine transporter (8). However, in our experiments the transport activity of OCTN1 from human both for TEA and carnitine was always very low. Because an alignment of sequences of OCTN1 and OCTN2 indicates a series of distinct amino acid differences that are each conserved among rat and human orthologues, we presumed that the substrate specificity of OCTN1 was unresolved. Thus, we have developed a strategy of comprehensive substrate search and applied it to OCTN1.
Methods
For drugs, calculations and statistics, see Supporting Methods, which is published as supporting information on the PNAS web site.
Cell Culture. 293 cells (American Type Culture Collection CRL-1573), a transformed cell line derived from human embryonic kidney, were grown at 37°C in a humidified atmosphere (5% CO2) in plastic culture flasks (Falcon 3112, Becton Dickinson). The medium was DMEM (Life Technologies 31885-023, Invitrogen) supplemented with 10% FCS (Life Technologies). The medium was changed every 2–3 days, and the culture was split every 7 days.
Functional Expression of Human Ergothioneine Transporter (ETTh), Rat ETT (ETTr), and OCTN2r in 293 Cells. The Flp-In T-REx system (FIT) (Invitrogen) was used for stable, inducible transporter expression in 293 cells. Transporter cDNAs were inserted into the polylinker of plasmid pcDNA5/FRT/TO (Invitrogen). The cDNA sequence of ETTh corresponds to GenBank entry Y09881. The 5′ interface between cDNA and vector is TCTGCAGAT TCGA gccacc ATGCGGGAC (polylinker in bold, Kozak motif in lowercase, start codon underlined), and the 3′ interface is ATTTCTAGA TCCAGCAC (cDNA underlined, polylinker in bold). The cDNA of OCTN1 from rat (ETTr) was kindly provided by V. Ganapathy (Medical College of Georgia, Augusta). The cDNA sequence corresponds to GenBank entry AF169831 (6). The 5′ interface between cDNA and vector is CTTAAGCTT gccacc ATGAGGGAC (polylinker in bold, Kozak motif in lowercase, start codon underlined), and the 3′ interface is GGCAAACTG A25 GCGGCCGCT (cDNA underlined, polylinker in bold). The cDNA sequence of OCTN2r corresponds to GenBank entry AJ001933 (3). The 5′ interface between cDNA and vector is CTTAAGCTT TGGGAGGCTG (polylinker in bold, cDNA underlined), and the 3′ interface is TTTTTAAAT A22 GCGGCCGCT (cDNA underlined, polylinker in bold).
With these plasmids, stably transfected cell lines were generated based on the Flp-In T-REx-293 cell line according to the FIT system protocols (Invitrogen). Regulation of transporter expression was verified by Northern analysis and functional assays. To turn on transporter expression, cells were cultivated for at least 20 h in regular growth medium supplemented with 1 μg/ml doxycycline (195044, MP Biomedicals, Eschwege, Germany).
Transport Assays. For measurement of uptake of radiolabeled solutes, cells were grown in surface culture on 60-mm polystyrol dishes (Nunclon 150288, Nunc) precoated with 0.1 g/liter poly(l-ornithine) in 0.15 M boric acid-NaOH (pH 8.4). Cells were used for uptake experiments at a confluence of at least 70%. Uptake was measured at 37°C. After preincubation for at least 20 min in 4 ml of uptake buffer (125 mmol/liter NaCl/25 mmol/liter Hepes-NaOH, pH 7.4/5.6 mmol/liter (+)glucose/4.8 mmol/liter KCl/1.2 mmol/liter KH2PO4/1.2 mmol/liter CaCl2/1.2 mmol/liter MgSO4), the buffer was replaced with 3 ml of 3H-labeled substrate (at 100 nmol/liter if not noted otherwise) in uptake buffer. Incubation was stopped (after 1 min if not noted otherwise) by rinsing the cells four times with each 4 ml of ice-cold uptake buffer. Subsequently, the cells were solubilized with 0.1% vol/vol Triton X-100 in 5 mmol/liter Tris·HCl (pH 7.4), and radioactivity was determined by liquid scintillation counting. In this study, no inhibitor was present during preincubation.
Uptake of unlabeled solutes was determined by liquid chromatography (LC) electrospray ionization MS/MS. Cells were assayed and washed as described above, solubilized with 4 mmol/liter HClO4, and stored at –20°C. After centrifugation (1 min at 16,000 × g and 20°C) of the thawed lysates, 100 μl of the supernatant was mixed with 10 μl of 1-methyl-4-phenylpyridinium iodide (MPP+) (5.0 ng/μl), which served as the internal standard. Of this mixture, 20-μl samples were analyzed by LC-MS/MS on a triple quadrupole mass spectrometer (TSQ Quantum, Thermo Electron). Atmospheric pressure ionization with positive electrospray was used. The LC system consisted of a Surveyor LC pump, an autosampler, and a Waters Atlantis HILIC silica column (length, 100 mm; diameter, 3 mm; particle size, 5 μm). The solvent for isocratic chromatography (flow rate, 250 μl/min) was made of methanol (70%) and 0.1% formic acid (30%). For quantification by selected reaction monitoring (SRM) (scan time 0.3 s), at first, the optimal collision energy (CE) for argon-induced fragmentation in the second quadrupole was determined for each analyte. From the product ion spectra, the following fragments were selected for SRM (m/z parent, m/z fragment, and CE): ET, 230, 186, and 16 V; stachydrine, 144, 84, and 30 V; betonicine, 160, 88, and 26 V; γ-butyrylbetaine, 146, 87, and 20 V; proline, 116, 70, and 24 V; N-methylproline, 130, 82, and 20 V; MPP+, 170, 128, and 25 V. For each analyte, the area of the intensity vs. time peak was integrated and divided by the area of the MPP+ peak to yield the analyte response ratio. Linear calibration curves (R2 > 0.99) were constructed from at least six standards, which were prepared by using control cell lysates as solvent. Sample analyte content was calculated from the analyte response ratio and the slope of the calibration curve, obtained by weighted linear regression.
For a meaningful comparison of various solutes, initial rates of uptake into ETTh cells, after subtraction of uptake into control cells (nonspecific uptake), were divided by substrate concentration (10 μmol/liter for LC-MS/MS and 0.1 μmol/liter for radiotracer analysis). The result, known as clearance, is directly proportional to kcat/Km and thus a valid measure of efficiency of transport (provided that the substrate concentration is much smaller than the respective Km) (9).
For radiotracer assays, protein was measured by the bicinchoninic acid (BCA) assay (10) with BSA as standard. The protein content of MS samples was estimated from the response ratio for proline, calibrated against the BCA assay (four to six matched cell dishes) for each MS session.
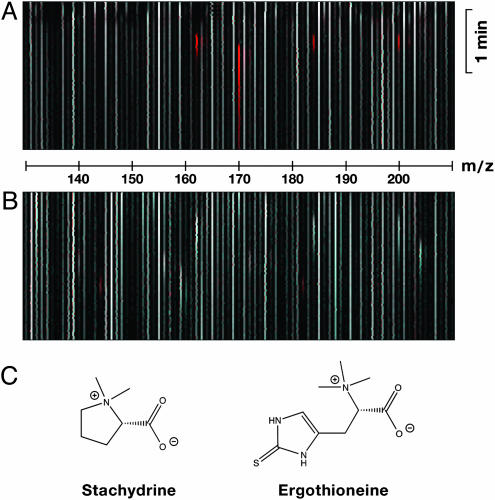
Substrate Elucidation by LC-MS Difference Shading. Our strategy of massively parallel substrate search is based on color-coded comparative image analysis of data of cell lysates. A stable cell line was created based on 293-FIT cells in which the expression of ETTh can be turned on by the addition of doxycycline to the culture medium. Cells with and without transporter expression were incubated in paired assays with diluted human plasma (a complex mixture of potential substrates), washed, and lysed with 4 mmol/liter HClO4 to release cellular contents. Lysates were directly analyzed by LC-MS, which generates large data sets with dimensions of m/z, time, and intensity. To detect robustly differences between both data sets, the intensities are first sigmoidally converted to 256 scales of gray, so that in a 2D image with m/z and time axes, low intensities are rendered black and high intensities are rendered white. In the second stage, a difference image is created based on RGB pixel information, combining the red channel from the transporter active image with the green and blue channels from the transporter inactive image. This algorithm will highlight compounds only present in the active or inactive set in red or cyan, respectively, whereas compounds present in equal amounts in both sets remain scales of gray (Fig. 1A).
Fig. 1.
Results from LC-MS difference shading. (A) Difference image of uptake buffer plus 1-methyl-4-phenylpyridinium (m/z = 170) and carnitine (m/z = 162), each at 1 μmol/liter, with uptake buffer. Both peaks are clearly marked by red color. (B) Difference image of cell lysates. 293-FIT-ETTh cells were cultivated for 1 day in the presence (to express ETTh) or absence (control) of 1 μg/ml doxycycline in growth medium. 293 cells do not originally express OCTN1h (Fig. 8). In the uptake experiment, cells were preincubated in uptake buffer for 20 min and then incubated for 1 min with a 1:1 mixture of human plasma and uptake buffer. Cells were washed with ice-cold uptake buffer and lysed with 4 mmol/liter HClO4. For full-scan LC-MS, a m/z-range of 50–500 was recorded (scan time, 2 s). (C) Structures of stachydrine and ET.
Expression Profiling by Real-Time PCR. For relative quantitation of ETTh mRNA levels in human cells and tissues, a TaqMan real-time PCR assay was used on a 7900 HT sequence detection system (Applied Biosystems) according to the manufacturer's protocols. For first-strand cDNA synthesis, 85 μg of total RNA was incubated for 1.5 h at 37°C with 2 units/μl Omniscript reverse transcriptase (Qiagen) in the supplied buffer plus 9.5 μM random hexamer primer, 0.5 mM per dNTP, and 3,000 units of RNaseOUT (Invitrogen) in a final volume of 680 μl. The resulting cDNA was diluted 1:10 with water and directly used in PCR (5 μl per reaction). A PCR reaction mix (25 μl) contained, in addition to cDNA, 0.2 μM per ETTh amplification primer (forward, 5′-GCT CCT CGG CTC CTT CGT; reverse, 5′-GCC ATG GTT GCG AAG AGA AC), 0.2 μM FAM/TAMRA-labeled ETTh probe (5′-CAG CTG TCA GAC AGG TTT GGC AGG AAG), 0.2 mM dATP, dCTP, dGTP, and dUTP, 5.5 mM MgCl2, 0.01 units/μl AmpErase uracil N-glycosylase, and 0.025 units/μl AmpliTaq Gold DNA polymerase in TaqMan buffer A. The thermal protocol was set to 2 min at 50°C, followed by 10 min at 95°C, and then by 40 cycles of 15 s at 95°C and 1 min at 60°C. To normalize the amount of cDNA per assay, the expression of multiple housekeeping genes (e.g., hypoxanthine phosphoribosyltransferase, glyceraldehyde-3-phosphate dehydrogenase, and β-actin) was measured in parallel assays. The relative expression of ETTh was then calculated by using the normalized expression values.
Results
Analysis of Transport Efficiency of OCTN1h. Uptake of solutes into the 293-FIT cell line of OCTN1h (h, human) was analyzed by LC-MS difference shading. A clear signal was reproducibly found at m/z = 144 (Fig. 1B). An echo at 183 suggested the presence of a carboxylate moiety, complexed with K+ instead of H+. Fragmentation analysis by LC-MS/MS produced two main fragments at 84 and 58. The underlying compound was identified as stachydrine, alias proline betaine, by comparison with the product ion spectrum of pure substance.
To prove that stachydrine is indeed a substrate of OCTN1h and not just a compound increased indirectly, cells with and without transporter expression were incubated for 1 min with 10 μmol/liter unlabeled stachydrine in simple physiological buffer, washed, and lysed. Lysates were quantitatively analyzed for stachydrine content by LC-MS/MS. Control cells showed no detectable uptake of stachydrine, but OCTN1h cells showed marked uptake at 180 ± 10 pmol per min per mg of protein (limit of quantification at signal-to-noise ratio >3, 0.5 ng/ml; this translates into ≈2 pmol per min per mg of protein). Neither cell line contained detectable amounts of stachydrine when incubated in buffer without stachydrine. These data imply that OCTN1h transports stachydrine.
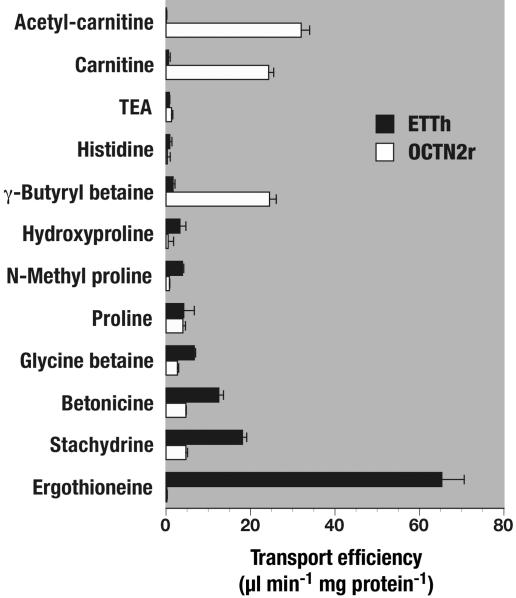
With stachydrine as the lead structure, we tested related compounds for uptake into OCTN1h cells and control cells to define the substrate specificity further. In addition to LC-MS/MS analysis, some compounds (e.g., glycine betaine and proline, which are originally present in 293 cells in high concentration and thus create a background in LC-MS/MS too high for accurate measurement of transport) were determined by conventional radiotracer methods. From early results, the notion emerged that OCTN1h requires the glycine betaine backbone in its better substrates (Fig. 2). Proline and N-methyl proline are transported 4-fold less efficiently than stachydrine, which bears a fully alkylated (quarternary) nitrogen. Similarly, hydroxyproline is a worse substrate than its betaine betonicine. A structure database search revealed a limited number of amino acid betaine derivatives that occur in human. Of these, ET (Fig. 1C) was found to be an excellent substrate of OCTN1h, with an efficiency of transport of 65 ± 5 μl per min per mg of protein, almost 4-fold higher than that for stachydrine (18 ± 1 μl per min per mg of protein) and almost 100-fold higher than those for the reputed substrates TEA and carnitine (0.8 ± 0.1 and 0.6 ± 0.4 μl per min per mg of protein, respectively). Strikingly, the closely related carnitine transporter OCTN2 from rat (74% amino acid identity), measured in parallel, did not transport ET at all (0.2 ± 0.1 μl per min per mg of protein). OCTN2r was active in our assays; it efficiently transported carnitine, acetyl-carnitine, and gamma-butyryl betaine (Fig. 2).
Fig. 2.
Transport efficiency profiles of ETTh and OCTN2r. Initial rates of uptake were determined for the indicated solutes and cell lines at 37°C with an uptake period of 1 min. Shown is mean ± SEM of specific uptake rates (n = 3) divided by substrate concentration {10 μmol/liter for all LC-MS/MS assays [γ-butyryl betaine, N-methyl proline (alias hygric acid), betonicine (alias hydroxyproline betaine), stachydrine (alias proline betaine), and ET], and 0.1 μmol/liter for all radiotracer assays}. For radiotracer assays, specific uptake equals total uptake minus nonspecific uptake, which was determined with control cells without transporter expression. For LC-MS/MS assays, which determine total cellular content rather than flux of radiotracer, specific uptake equals total content minus endogenous content divided by uptake time minus nonspecific uptake. The endogenous content of solute was determined in parallel by incubation of transporter-expressing cells merely with uptake buffer.
Results were corroborated with OCTN1 from rat. Specific uptake into transiently transfected 293 cells was highest for ET (44 ± 2 μl per min per mg of protein), followed by stachydrine (16 ± 2 μl per min per mg of protein) and betonicine (9 ± 1 μl per min per mg of protein).
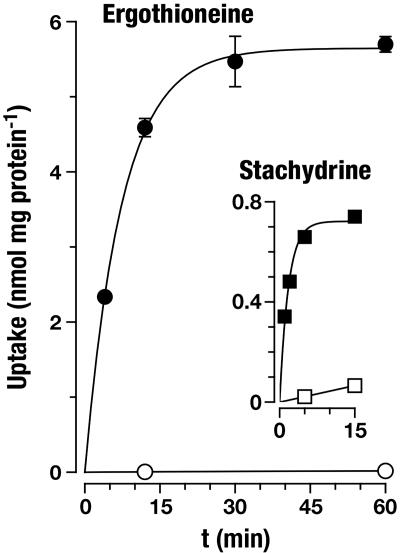
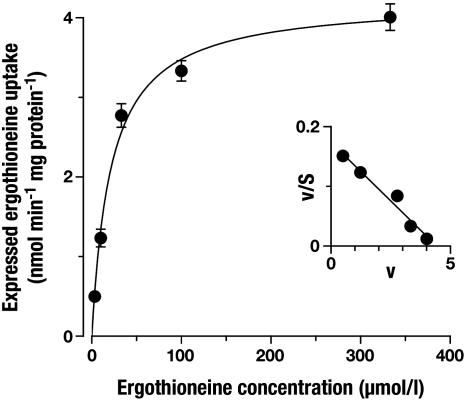
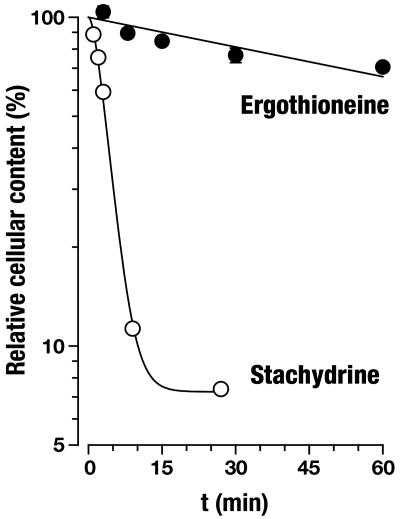
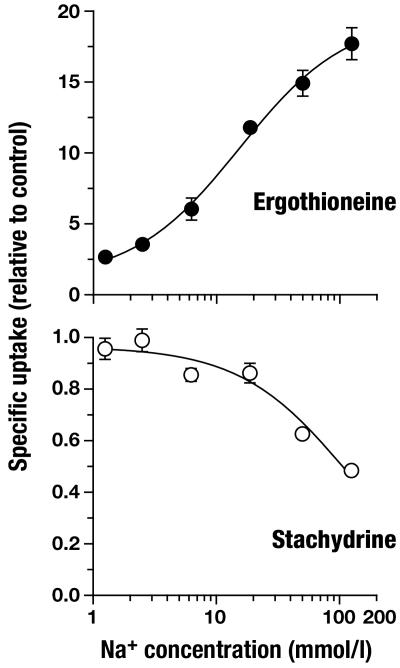
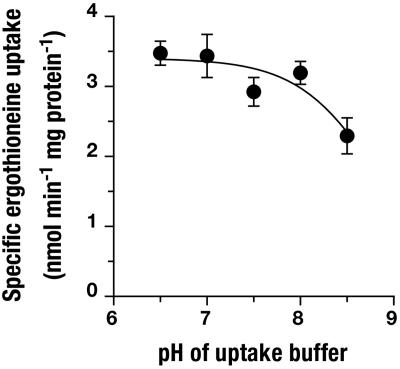
ET Is the Physiological Substrate of OCTN1. OCTN1h-mediated transport of ET was characterized in detail and compared with transport of stachydrine. From the time course of uptake, it is apparent that ET accumulates to much higher levels in 293 cells than does stachydrine (Fig. 3). In the experiment shown with an extracellular ET concentration of 10 μmol/liter, cells with transporter expression reached an intracellular concentration of 850 μmol/liter after a 60-min incubation (calculated with an intracellular water space of 6.7 μl per mg of protein). By contrast, cell membranes lacking the transporter are virtually impermeable to ET (2.6 μmol/liter after 60 min). Saturation analysis (Fig. 4) of initial rates of OCTN1h-catalyzed uptake revealed a Km of 21 μmol/liter (95% confidence interval, 16–28), which for a transport protein indicates high affinity. The affinity of OCTN1h for stachydrine was much lower [Ki = 270 (210–350) μmol/liter; not shown]. With this low Km for ET, our above analysis of transport efficiency (at 10 μmol/liter substrate concentration) underestimates the power of OCTN1 because of partial saturation. The value calculated from Vmax/Km is 195 μl per min per mg of protein, 10-fold higher than that for stachydrine. Total initial uptake into control cells presumably via diffusion was very low (0.32 μl per min per mg of protein). Thus, at an extracellular ET concentration of, e.g., 1 μmol/liter, the expression of OCTN1 increased initial cellular uptake by a factor of ≈600. In an efflux experiment, intracellular stachydrine was released rapidly from the cells (Fig. 5). In the same assay, the cellular ET content decreased only very slowly. Surprisingly, uptake of stachydrine was inhibited by physiological extracellular Na+ concentration versus sodium-free control (Fig. 6). By contrast, uptake of ET was stimulated 18-fold. Identical results for ET were obtained when Na+ was replaced with K+ or N-methyl-d-glucosamine. However, when Na+ was replaced by Li+, there was ≈40% residual uptake (not shown). This disparate Na+ dependence offers an explanation for the avid retention of ET versus stachydrine within the cell: low intracellular sodium favors the carrier-mediated efflux of stachydrine but inhibits efflux of ET. Uptake of ET was only slightly—and in a trend not consistent with H+ antiport—affected by changes in extracellular pH (Fig. 7). Collectively, our data strongly suggest that ET represents the physiological substrate of OCTN1. For a meaningful functional name of this carrier we therefore propose ETT.
Fig. 3.
Time course of uptake of ET and stachydrine into 293 cells expressing ETTh. Cells grown in dishes were incubated at 37°C with 10 μmol/liter substrate in uptake buffer for the indicated periods. Shown is mean ± SEM (n = 3) of total uptake. Exponential functions were fitted to the experimental data for control cells (293-FIT cells, not transfected; open symbols; ET, kin = 0.04 ± 0.01 μl per min per mg of protein, kout = 0.02 ± 0.01 min–1; stachydrine, kin = 0.4 ± 0.1 μl per min per mg of protein, kout = 0.00 ± 0.03 min–1) and ETTh cells (293-FIT-ETTh cells, induced with doxycycline; filled symbols; ET, kin = 77 ± 6 μl per min per mg of protein, kout = 0.14 ± 0.01 min–1; stachydrine, kin = 42 ± 2 μl per min per mg of protein, kout = 0.58 ± 0.04 min–1).
Fig. 4.
Saturation of ETTh-mediated uptake of ET. An uptake period of 1 min was chosen to approximate initial rates of transport. Shown is mean ± SEM (n = 3). Expressed uptake equals total content minus endogenous content divided by uptake time minus nonspecific uptake (see legend of Fig. 2). Nonspecific uptake increased linearly with ET concentration: slope = 0.32 μl per min per mg of protein. Vmax = 4.2 ± 0.14 nmol per min per mg of protein. (Inset) Eadie–Scatchard transformation.
Fig. 5.
Efflux of ET and stachydrine from 293 cells expressing ETTh. Cells were loaded with substrate by preincubation (10 μmol/liter in uptake buffer; 1 h). After washing, cells were incubated for the indicated times in uptake buffer to follow efflux of substrate. Shown is mean ± SEM (n = 3) of cellular content of substrate relative to t = 0. In this experiment, 100% corresponded to 27 ± 1 nmol per mg of protein ET and 0.73 ± 0.01 nmol/mg stachydrine. To exclude extensive metabolism, it was confirmed in a separate experiment that intracellular loss corresponds to extracellular increase of substrate.
Fig. 6.
Sodium dependence of ETTh-mediated uptake of ET and stachydrine. Cells were rapidly washed with modified uptake buffers in which N-methyl-d-glucosamine isoosmotically substituted Na+ as indicated and then assayed for uptake in the same buffer. Control uptake buffers were completely free of Na+. Shown is mean ± SEM (n = 3) of specific initial rates of uptake (uptake period, 1 min). From curve fitting of ET data, a Hill coefficient of 1.1 resulted. For stachydrine, a Ki of 114 mmol/liter was obtained.
Fig. 7.
pH dependence of ETTh-mediated uptake of ET. Cells were rapidly washed with uptake buffers with altered pH and then assayed for uptake in the same buffer. Shown is mean ± SEM (n = 3) of specific initial rates of uptake (uptake period, 1 min).
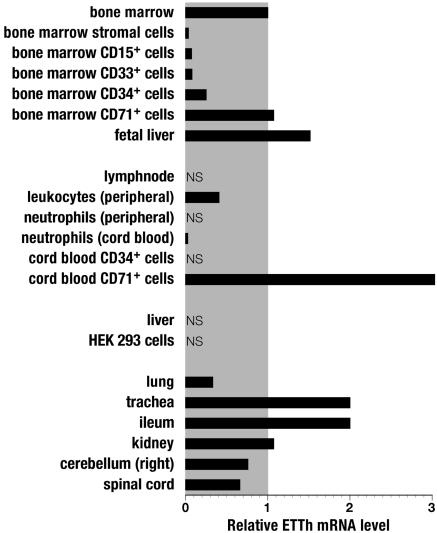
Expression Profile of ETTh. The tissue distribution of human ETT was analyzed by quantitative real-time RT-PCR (Fig. 8). Our results indicate high levels of ETT mRNA specifically in CD71+ cells from bone marrow, cord blood, and fetal liver (the embryological organ of erythropoiesis). CD71 corresponds to the transferrin receptor, which is most prominently expressed in erythrocyte progenitor cells like pronormoblasts and basophilic normoblasts (11) to provide Fe2+ ions for hemoglobin synthesis. In contrast, no or little mRNA was detected in neutrophils and eosinophils (CD15), and stem and blast cells (CD34). Peripheral leukocytes, but not lymph node, gave a clear signal. Strong signals were obtained for trachea, ileum, and kidney. Note that no signal was obtained for liver.
Fig. 8.
Tissue distribution of ETTh analyzed by real-time PCR. Results are given relative to the mRNA level of bone marrow. NS, no signal.
Discussion
From our comparison of transport efficiency it is clear that the transporter hitherto called OCTN1 specifically and very efficiently transports ET. Transport of the reputed substrates TEA and carnitine, although measurable, is negligible compared with transport of ET. We thus suggest ETT as a new and meaningful functional name of this carrier (human gene symbol SLC22A4). ETTh has high affinity for its key substrate (Km = 21 μmol/liter). Cotransport with Na+ accounts for high accumulation and avid retention of intracellular ET. Collectively, our data suggest that ETT serves to effectively charge cells with ET. By contrast, cells without expression of ETT do not accumulate ET, because their plasma membrane is virtually impermeable for this compound.
ETT represents the first molecular marker of ET activity. Our real-time PCR data on the distribution of ETT indicate a tissue-specific function. Strong expression of ETT in the bone marrow and fetal liver can be explained from expression in CD71+ cells, which correspond primarily to nucleated erythrocyte progenitor cells (11, 12). The high concentrations of ET in mature erythrocytes of all mammalian species examined (13, 14) can now be attributed to expression of a particular carrier. Synchronous uptake of ET via ETT and iron via the transferrin receptor might indicate a physiological link. Our localization data further agree with and extend earlier PCR results (1): ETTh is thus strongly expressed in monocytes (CD14) but is virtually absent from stem and blast cells including early hematopoietic progenitor cells (CD34), myeloid blasts and promyelocytes (CD33), neutrophils, eosinophils (CD15), and lymphocytes (CD4, CD8, and CD19). High expression of ETT in ileum and kidney presumably serves initial absorption and reabsorption of ET, respectively. The origin of the strong trachea signal is unclear.
The existence of a specific transporter suggests an essential function for ET. ET is biosynthesized exclusively by fungi and mycobacteria and is captured by plants through their roots. As an ingredient of human food, ET is distributed very unevenly. By far, the highest levels of ET have been found in mushrooms (0.1–1 mg/g dried material) (13). ET is rapidly cleared from the circulation and then avidly retained with minimal metabolism: the whole-body half-life of ingested ET in rats is ≈1 month (15). The content of ET varies greatly among tissues and is strongly dependent on its dietary level (14). In addition to erythrocytes and bone marrow, high ET levels have also been found in seminal fluid (16). The precise physiological role of ET has remained elusive since its discovery in 1909 (14). Most authors consider it an intracellular antioxidant. However, in terms of typical intracellular concentration, e.g., in erythrocytes, ET (0.1 to 1 mmol/liter) is outnumbered by a factor of 10 by the ubiquitous hydrophilic antioxidants glutathione (GSH) and ascorbate (17). When compared with GSH or cysteine, another common thiol compound, what is the unique benefit from ET? Two features are evident from previous work. (i) ET is a peculiar, very stable antioxidant, because it, e.g., does not autooxidize at physiological pH and does not promote the generation of hydroxyl radical from H2O2 and Fe2+ ions (Fenton reaction). This is a consequence of the prevailing thione (rather than thiol) moiety (14). ET is not consumed because mature erythrocytes do not take up additional ET (13), and the ET content of erythrocytes drops only very slowly over their entire life span. In a general sense, ET has been suggested to serve as a powerful catalytic scavenger of oxidizing species that are not free radicals (17). By contrast, GSH and ascorbate have been regarded as scavengers of free radicals. (ii) ET has conspicuous affinity for metal cations of, e.g., Fe and Cu. Complexes consist of two molecules of ET per divalent metal cation. The order of available cumulative stability constants follows the Irving–Williams series, with Cu2+ at log K1 + log K2 = 18.5 at the top (18, 19). It must be stressed, however, that ET does not bind free Cu2+ any more strongly than histidine or cysteine (19).
In erythrocytes, we expect ET not to affect native hemoglobin (HbFeII) but only to bind to or react with ferryl hemoglobin (HbFeIV O). The HbFeIV
 O species is a highly reactive intermediate in the autocatalytic oxidation of HbFeIIO2 caused by many xenobiotics such as, e.g., nitrite, chlorate, and aminophenols (20, 21). Autocatalytic oxidation of hemoglobin can generate methemoglobin (HbFeIII) at a rate too rapid for ascorbate and GSH-based repair systems such as NADH- and NADPH-dependent methemoglobin reductases to cope with. Pronounced methemoglobinemia causes hemolysis, hypoxia, and cyanosis, and will eventually be fatal. HbFeIV
 O is also considered a starting point for detrimental radical chain reactions (leading, e.g., to lipid peroxidation) via superoxide radical anion, NO, and peroxynitrite (22, 23). Thus, we strongly endorse the view (24) that ET serves as a safety catch in the autocatalytic oxidation of hemoglobin, or more generally, that ET protects against HbFeIV
 O-based erythrocyte damage. Indeed, it has been shown for rats and rabbits that dietary ET blocks nitrite-induced methemoglobin formation in vivo (25, 26). An ET deficiency is thus probably phenotypically silent unless the organism is challenged with a powerful methemoglobin-forming agent. This hypothesis may explain why ET does not yet have a vitamin status (13). Putative oxidized intermediates have been proposed to recycle to ET, at the expense of GSH (27).
The target of ET in monocytes is unclear. At first we considered myeloperoxidase, which generates HOCl for the respiratory burst (28). Myeloperoxidase is, however, the most abundant protein in neutrophils, which, according to our PCR data, are devoid of ETT. Nevertheless, ET appears to have a pivotal protective role in monocytes, because the occurrence of rheumatoid arthritis (1) and Crohn's disease (2) has very recently been linked to variant ETTh genes (gene symbol SLC22A4). It is presently unresolved whether ETT is still active after conversion of monocytes to tissue macrophages that also carry the CD14 marker.
In conclusion, we have discovered a specific transporter for ET. ETT represents the first molecular marker of ET activity. Based on the expression profile, we judge ETT to be necessary for the supply of ET primarily to erythrocyte progenitor cells and to monocytes. In erythrocytes, ET is expected to protect hemoglobin from autocatalytic oxidation via HbFeIV O caused, e.g., by nitrite. By analogy, in monocytes the unknown target of ET is also expected to contain a heme prosthetic group. It is now possible to investigate the link between polymorphisms of the SLC22A4 gene and chronic inflammatory disorders established just recently (1, 2). Our findings may pave the way for new therapeutic strategies, i.e., to substitute ET to overcome partial transporter dysfunction, an option that works very well with carnitine in primary systemic carnitine deficiency due to OCTN2 dysfunction.
Supplementary Material
Acknowledgments
We thank Beatrix Steinrücken, Katja Rolshofen, and Kristine Helfert for skillful technical assistance, Dr. V. Ganapathy for providing the cDNA of OCTN1r, and Dr. H. Löster (University Hospital, Leipzig, Germany) for providing a crotonobetaine precursor. This work was supported by Deutsche Forschungsgemeinschaft Grants SCHO 373/3-4 and SCHO 373/4-1.
Author contributions: D.G., S.H., S.G., and A.G. designed research; D.G., S.H., S.G., and A.G. performed research; D.G., A.L., R.B., N.J., and A.R. contributed new reagents/analytic tools; D.G., S.H., S.G., A.G., and E.S. analyzed data; and D.G. wrote the paper.
This paper was submitted directly (Track II) to the PNAS office.
Abbreviations: ET, ergothioneine; ETT, ET transporter; TEA, tetraethylammonium.
References
- 1.Tokuhiro, S., Yamada, R., Chang, X., Suzuki, A., Kochi, Y., Sawada, T., Suzuki, M., Nagasaki, M., Ohtsuki, M., Ono, M., et al. (2003) Nat. Genet. 35, 341–348. [DOI] [PubMed] [Google Scholar]
- 2.Peltekova, V. D., Wintle, R. F., Rubin, L. A., Amos, C. I., Huang, Q., Gu, X., Newman, B., Van Oene, M., Cescon, D., Greenberg, G., et al. (2004) Nat. Genet. 36, 471–475. [DOI] [PubMed] [Google Scholar]
- 3.Schömig, E., Spitzenberger, F., Engelhardt, M., Martel, F., Örding, N. & Gründemann, D. (1998) FEBS Lett. 425, 79–86. [DOI] [PubMed] [Google Scholar]
- 4.Tamai, I., Yabuuchi, H., Nezu, J.-I., Sai, Y., Oku, A., Shimane, M. & Tsuji, A. (1997) FEBS Lett. 419, 107–111. [DOI] [PubMed] [Google Scholar]
- 5.Yabuuchi, H., Tamai, I., Nezu, J.-I., Sakamoto, K., Oku, A., Shimane, M., Sai, Y. & Tsuji, A. (1999) J. Pharmacol. Exp. Ther. 289, 768–773. [PubMed] [Google Scholar]
- 6.Wu, X., George, R. L., Huang, W., Wang, H., Conway, S. J., Leibach, F. H. & Ganapathy, V. (2000) Biochim. Biophys. Acta 1466, 315–327. [DOI] [PubMed] [Google Scholar]
- 7.Tamai, I., Ohashi, R., Nezu, J., Yabuuchi, H., Oku, A., Shimane, M., Sai, Y. & Tsuji, A. (1998) J. Biol. Chem. 273, 20378–20382. [DOI] [PubMed] [Google Scholar]
- 8.Tamai, I., Ohashi, R., Nezu, J. I., Sai, Y., Kobayashi, D., Oku, A., Shimane, M. & Tsuji, A. (2000) J. Biol. Chem. 275, 40064–40072. [DOI] [PubMed] [Google Scholar]
- 9.Gründemann, D., Liebich, G., Kiefer, N., Köster, S. & Schömig, E. (1999) Mol. Pharmacol. 56, 1–10. [DOI] [PubMed] [Google Scholar]
- 10.Smith, P. K., Krohn, R. I., Hermanson, G. T., Mallia, A. K., Gartner, F. H., Provenzano, M. D., Fujimoto, E. K., Goeke, N. M., Olson, B. J. & Klenk, D. C. (1985) Anal. Biochem. 150, 76–85. [DOI] [PubMed] [Google Scholar]
- 11.McAdams, T. A., Miller, W. M. & Papoutsakis, E. T. (1998) Br. J. Haematol. 103, 317–325. [DOI] [PubMed] [Google Scholar]
- 12.Okumura, N., Tsuji, K. & Nakahata, T. (1992) Blood 80, 642–650. [PubMed] [Google Scholar]
- 13.Melville, D. B. (1958) Vitam. Horm. 17, 155–204. [Google Scholar]
- 14.Hartman, P. E. (1990) Methods Enzymol. 186, 310–318. [DOI] [PubMed] [Google Scholar]
- 15.Kawano, H., Otani, M., Takeyama, K., Kawai, Y., Mayumi, T. & Hama, T. (1982) Chem. Pharm. Bull. 30, 1760–1765. [DOI] [PubMed] [Google Scholar]
- 16.Mann, T. & Leone, E. (1953) Biochem. J. 53, 140–148. [DOI] [PMC free article] [PubMed] [Google Scholar]
- 17.Chaudiere, J. & Ferrari-Iliou, R. (1999) Food Chem. Toxicol. 37, 949–962. [DOI] [PubMed] [Google Scholar]
- 18.Hanlon, D. P. (1971) J. Med. Chem. 14, 1084–1087. [DOI] [PubMed] [Google Scholar]
- 19.Motohashi, N., Mori, I., Sugiura, Y. & Tanaka, H. (1974) Chem. Pharm. Bull. 22, 654–657. [DOI] [PubMed] [Google Scholar]
- 20.Kosaka, H. & Tyuma, I. (1987) Environ. Health Perspect. 73, 147–151. [DOI] [PMC free article] [PubMed] [Google Scholar]
- 21.Lissi, E. (1998) Free Radical Biol. Med. 24, 1535–1536. [DOI] [PubMed] [Google Scholar]
- 22.Nagababu, E. & Rifkind, J. M. (2000) Biochemistry 39, 12503–12511. [DOI] [PubMed] [Google Scholar]
- 23.Everse, J. & Hsia, N. (1997) Free Radical Biol. Med. 22, 1075–1099. [DOI] [PubMed] [Google Scholar]
- 24.Arduini, A., Mancinelli, G., Radatti, G. L., Hochstein, P. & Cadenas, E. (1992) Arch. Biochem. Biophys. 294, 398–402. [DOI] [PubMed] [Google Scholar]
- 25.Mortensen, R. A. (1953) Arch. Biochem. Biophys. 46, 241–243. [DOI] [PubMed] [Google Scholar]
- 26.Spicer, S. S., Wooley, J. G. & Kessler, V. (1951) Proc. Soc. Exp. Biol. Med. 77, 418–420. [DOI] [PubMed] [Google Scholar]
- 27.Arduini, A., Eddy, L. & Hochstein, P. (1990) Arch. Biochem. Biophys. 281, 41–43. [DOI] [PubMed] [Google Scholar]
- 28.Winterbourn, C. C., Vissers, M. C. & Kettle, A. J. (2000) Curr. Opin. Hematol. 7, 53–58. [DOI] [PubMed] [Google Scholar]
Associated Data
This section collects any data citations, data availability statements, or supplementary materials included in this article.


