

Abstract
Current atherosclerosis treatment strategies primarily focus on limiting further cholesteryl esters (CE) accumulation by reducing endogenous synthesis of cholesterol in the liver. No therapy is currently available to enhance the removal of CE, a crucial step to reduce the burden of the existing disease. Given a central role of hepatic cholesteryl ester hydrolase (CEH) in intrahepatic hydrolysis of CE and subsequent removal of the resulting free cholesterol, in this work, we applied galactose-functionalized polyamidoamine (PAMAM) dendrimer G5 (Gal-G5) for hepatocyte-specific delivery of CEH expression vector. The data presented herein show increased specific uptake of Gal-G5 by the hepatocytes in vitro and in vivo. Furthermore, the upregulated CEH expression in the hepatocytes significantly enhanced intracellular hydrolysis of HDL-CE and subsequent conversion/secretion of hydrolyzed free cholesterol (FC) as bile acids. Increased CEH expression in the liver significantly increased the flux of HDL-CE to biliary as well as fecal FC and bile acids. Meanwhile, Gal-G5 did not induce hepatic or renal toxicity. It was not immunotoxic. Because of these encouraging pre-clinical testing results, using this safe and highly efficient hepatocyte-specific gene delivery platform to enhance the hepatic processes involved in cholesterol elimination is a promising strategy for alleviation of atherosclerosis.
Keywords: Atherosclerosis, PAMAM dendrimer, Galactose, CEH, Hepatocyte targeting, Gene delivery
1. Introduction
Cardiovascular disease (CVD) continues to be the number one cause of morbidity and mortality in the Western World including the USA [1, 2]. The most common cause of CVD is atherosclerosis characterized with deposition of cholesteryl ester (CE)-laden macrophage foam cells in the arterial wall, a process starting in the teenage years and progressing silently for years before the manifestation of clinical symptoms [3, 4]. A common therapeutic strategy is to reduce plasma cholesterol by restricting cholesterol intake or reducing de novo cholesterol biosynthesis. The rationale behind this strategy is to reduce the influx of cholesterol into the macrophages, hence reducing new foam cell formation and halting the plaque progression. Nonetheless, to reduce the lipid burden in the existing plaque, the only plausible way is to enhance the removal of CE from the macrophage foam cells [5]. More beneficially, reduction in the lipid core of the plaques may help increase plaque stability, hence likely reducing acute cardiovascular events such as heart attacks [6]. Although the importance of increasing the flux of cholesterol from macrophages to liver for final elimination (or reverse cholesterol transport, RCT) is widely recognized, no therapy is available to enhance the removal of CE from existing plaque and facilitate plaque regression and/or increase plaque stability [7].
Under a normal physiological setting, a homeostatic balance between cholesterol influx (unregulated uptake of modified low density lipoprotein (mLDL)) and efflux (removal of un-esterified or free cholesterol (FC) by apolipoprotein A1, ApoA1 or high density lipoprotein (HDL)) restricts pathological accumulation of CE in macrophages. However, a disrupted balance between cholesterol influx and efflux leads to excessive accumulation of CE within the macrophage foam cells, causing pathological consequences. With the failure to show any therapeutic improvement in clinical trials aimed at increasing HDL-C by niacin (AIM-HIGH and HPS2-Thrive) or cholesteryl ester transfer protein (CETP) inhibitor [8], focus has recently shifted to the efflux ability of HDL to remove cholesterol from macrophage foam cells [4]. Correlation between the HDL efflux capacity and CVD has been established clinically [9–11]. It must be noted that while macrophage foam cells store cholesterol in the form of CE, only FC is available for efflux to ApoA1 or HDL via the membrane cholesterol transporters ABCA1 and ABCG1, thus making intracellular CE hydrolase (CEH)-mediated conversion of CE into FC an important and likely rate-limiting step in cholesterol efflux pathway [12, 13].
Liver is the central organ for the clearance of cholesterol from the body. Cholesterol removed from the peripheral organs including plaque associated macrophages returns to the liver via HDL, which contains >80 % of cholesterol in the form of CE [14]. HDL receptor SR-BI on the hepatocyte surface facilitates the selective delivery of HDL-associated CE and FC. While HDL-FC is thought to be rapidly secreted into bile, the fate of HDL-CE is not completely defined [7]. We have confirmed that hepatic CEH plays a central role in HDL-CE hydrolysis. We observed that liver-specific transgenic expression of human liver CEH enhanced flux of HDL-CE to bile and feces and reduced Western-diet induced atherosclerosis [15–17]. Enhanced bile acid secretion was found to reduce the CVD risk [18, 19]. These studies validated the unidirectional flux of cholesterol from macrophage foam cells to liver and to bile/feces as an anti-atherogenic step. Therefore, novel anti-atherogenic agents can be developed to promote hepatic hydrolysis of HDL-CE. Liver-specific delivery of CEH gene represents one such approach.
With these concepts in mind, here we used polyamidoamine (PAMAM) G5 to design a hepatocyte-specific delivery system to deliver CEH expression vector and enhance its expression in the liver so as to increase final elimination of cholesterol (see Scheme 1). PAMAM dendrimers have distinct merits as non-viral gene delivery vectors, including well-defined nanoscale spherical architecture, large number of surface amine groups capable of efficiently complexing with genes though electrostatic interactions, as well as endosomal-lysosomal escape ability due to the proton-sponge effect [20–23]. Moreover, PAMAM dendrimers have been widely modified with various targeted ligands, such as carbohydrate moieties [24], antibodies [25], peptides [26] and aptamers [27] to enhance targeting specificity. Although the majority of cells (60–80 %) in the liver are parenchymal hepatocytes, most nanoparticles are typically taken up by non-parenchymal Kupffer cells (mononuclear phagocyte system, MPS) [28–30]. Thus, maximizing the active uptake by hepatocytes meanwhile minimizing the passive clearance by MPS in liver is an important consideration for development of hepatocyte-specific non-viral gene delivery platforms [31, 32]. Taking advantage of hepatocyte-specific expression of asialoglycoprotein receptor (ASGPR) and strong affinity of this receptor for galactose [33–35], G5 was functionalized with galactose (Gal) via a long PEG spacer (35 kDa) to form Gal-G5, where long PEG spacer will likely reduce the toxicity from the enormous G5 surface cations. Liver-targeted anticancer drug delivery using lactobionic acid-functionalized dendrimers has been reported [36, 37]. For the first time, we used Gal-functionalized PAMAM dendrimer for liver-specific gene delivery. The data presented here demonstrate specific uptake of Gal-G5 by hepatocytes in vitro and in vivo. Furthermore, we confirmed the ability of Gal-G5 to efficiently deliver CEH expression vector and increase the hepatic hydrolysis of HDL-CE to FC and subsequently to bile acids. Development of such a safe, liver hepatocyte-specific efficient dendrimer-based delivery system for CEH expression vector offers a possible solution to regressing the existing atherosclerotic plaques.
Scheme 1. Design of a hepatocyte-specific anti-atherogenic gene delivery system.
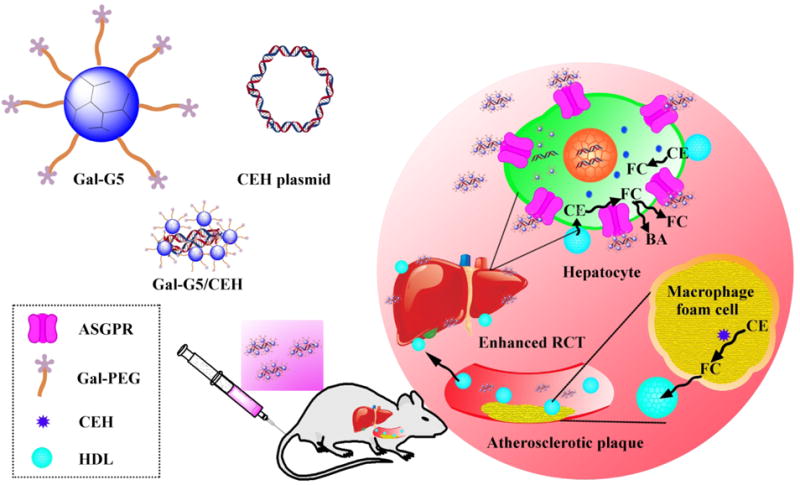
Cholesterol (>80 % in the form of cholesteryl esters (CE)) is transported by HDL from atherosclerotic plaque-associated macrophage foam cells to the liver by the process of reverse cholesterol transport (RCT), subsequently converted to bile acids (BA), and eliminated from bile/feces. Galactose-functionalized PAMAM dendrimer G5, i.e., Gal-G5, is developed as a hepatocyte-specific gene delivery system to deliver CEH expression vector. Galactose facilitates ASGPR-mediated endocytosis of Gal-G5/CEH complexes into hepatocytes in the liver and increases CEH expression. The overexpressed CEH would enhance the hydrolysis of HDL-CE into free cholesterol (FC), which is either directly secreted into bile or converted to bile acids followed by elimination from the body - a process proposed to regress the existing atherosclerotic plaques.
2 Materials and Methods
2.1 Materials
Ethylenediamine (EDA) core polyamidoamine (PAMAM) dendrimer generation 5 (G5) (technical grade) was purchased from Dendritech (Midland, MI). Fluorescein isothiocyanate (FITC) and D-(+)-galactose were purchased from Sigma-Aldrich (St. Louis, MO). IRDye 800CW-NHS ester was obtained from Li-COR Biotechnology (Lincoln, NE). Galactose-PEG-NHS (Mn=35000 g/mol) was purchased from JenKem Technology (Plano, TX, USA). SnakeSkin dialysis tubing with 7000 molecular weight cut-off (MWCO) was purchased from Thermo Scientific (Rockford, IL). WST-1 reagent was purchased from Roche Applied Science (Grand Island, NY). Collagenase type I was obtained from Worthington Biochemical Corp. William’s E medium. Fetal bovine serum (FBS) and Dulbecco’s phosphate-buffered saline (DPBS) were obtained from Gibco BRL (Carlsbad, CA, USA). Trypsin-EDTA (0.25 %), streptomycin and penicillin were obtained from Invitrogen Co., USA. Label IT® Cy3 control plasmid was purchased from Mirus Bio (Madison, WI). Vectashield mounting media were purchased from Vector Laboratories (Burlingame, CA). RNeasy® Mini Kit was purchased from QIAGEN GmbH. High Capacity cDNA Reverse Transcription Kit and TaqMan Universal PCR Master Mix, no AmpErase UNG were obtained from Applied Biosystems. Human macrophage CEH plasmid (Accession No. AY268104, referred to as CEH hereafter) was constructed and characterized in our lab [38]. Unless noted, the rest chemicals were purchased from Sigma-Aldrich (St. Louis, MO).
2.2 Animals
Six-week-old C57BL/6 mice (20 ± 3 g body weight, both genders) were obtained from the Jackson Laboratory (Bar Harbor, ME). All the mice were kept in pathogen-free conditions with 12 h dark/light cycle. All procedures were approved by the Virginia Commonwealth University Institutional Animal Care and Use Committee.
2.3 Isolation and culture of primary mouse hepatocytes
Primary mouse hepatocytes were isolated by collagenase-perfusion technique as described previously [39]. The hepatocytes were plated in collagen-coated wells in William’s E medium supplemented with heat-inactivated FBS (10 %), insulin (1.5 μM), streptomycin (100 U/mL) and penicillin (100 U/mL). After 3 h, the medium containing detached dead cells was aspirated and replaced with fresh medium prior to any treatment. Unless noted, hepatocytes at ~90 % confluence were used throughout the experiments.
2.4 Evaluation of Gal-G5
2.4.1 Synthesis and characterization
Fifteen mg of PAMAM dendrimer G5 was dissolved in 0.1 M sodium bicarbonate solution (pH 8.3–8.5) (10 mL), to which was added 275 mg of Galactose-PEG-NHS (the molar ratio of Galactose-PEG-NHS to G5 was approximately 15:1). The reaction proceeded overnight at room temperature followed by dialysis and lyophilization to obtain Gal-G5. Following the same chemistry, Gal-G5 and G5 were reacted with IRDye 800CW NHS ester to form IRDye 800CW-labeled Gal-G5 and G5. To monitor intracellular uptake and trafficking, Gal-G5 and G5 were labeled with FITC following a reported procedure [40]. 1H NMR spectra were recorded on a Varian superconducting Fourier-transform NMR spectrometer (Mercury-300) [20]. D2O was used as the solvent.
2.4.2 Cytotoxicity assessment
Primary mouse hepatocytes were seeded in 48-well collagen-coated cell culture plates (n=6) at a density of 5×10⁴ cells/well and cultured in William's E medium containing 10 % FBS overnight. The cells were then incubated with increasing concentrations of Gal-G5 or G5 (1 to 500 nM) for an additional 24 h, washed with DPBS three times, and then subjected to WST-1 assay. In a separate experiment, hepatocytes were treated 100 nM Gal-G5 or G5 for 24 h, rinsed with DPBS, stained with cell-impermeable fluorescent dye (DAPI) for 30 s, washed with DPBS again three times, and imaged at a magnification of 400×.
2.4.3 In vitro uptake by hepatocytes
Primary mouse hepatocytes were incubated with 50 nM FITC-Gal-G5 or FITC-G5 for various lengths of time (2, 8, or 24 h). At the end of each treatment, the cells were washed with DPBS three times, fixed with 4 % buffered formalin PBS at room temperature for 30 min, and permeabilized with 0.15 % Triton X-100 for 5 min. The cells were washed with DPBS three times, counterstained with DAPI, and imaged using a fluorescence microscope.
In a separate experiment, primary mouse hepatocytes cultured in the collagen-coated 60-mm dishes were incubated with 50 nM FITC-Gal-G5 or FITC-G5 for 2, 8 or 24 h. At the end of each treatment, the hepatocytes were collected and analyzed by using Canto-BD FACSCanto™ II Analyzer (BD, USA) for quantification of nanoparticle uptake in terms of mean fluorescence intensity (MFI).
2.4.4 Competitive inhibition assay
Primary mouse hepatocytes were seeded on 4-chamber slides, cultured overnight, and incubated with free galactose (0, 3 or 30 μM) for 30 min followed by addition of 50 nM FITC-Gal-G5. After 2 h, the cells were counterstained with DAPI and imaged by using fluorescent microscopy. An identical experiment was conducted, and the cells were collected for quantitative analysis of nanoparticle uptake by using flow cytometry.
2.4.5 Uptake by mouse peritoneal macrophages
Mouse peritoneal macrophages were isolated following a published protocol [41]. The cell pellets were collected after centrifugation at 2000 rpm for 5 min, re-suspended in William's E medium supplemented with 10 % FBS and 1 % antibiotics and plated. Non-adherent cells were removed after 2 h. The cells were incubated with 50 nM FITC-G5 or FITC-Gal-G5 for 6 h and then processed for fluorescence imaging and flow cytometry.
2.5 In vitro evaluation of Gal-G5/CEH complexes
2.5.1 Gel retardation assay
Gal-G5/CEH complexes (2.5, 5, 10, 20, 40 and 50, w/w) and G5/CEH (0.25, 0.5, 1, 2, 4 and 8, w/w) were prepared following a procedure described earlier [23, 42]. The complexes were mixed with loading buffer and loaded onto a 0.8 % agarose gel containing ethidium bromide. The 1 kb DNA ladder (New England Biolabs, Ipswich, MA) was included as a control. Electrophoresis was performed in Tris-acetate-EDTA buffer at 100 V for 40 min. The DNA bands were visualized with a UV-light system.
2.5.2 Colloidal stability test
Gal-G5/CEH (20:1, w/w) and G5/CEH (4:1, w/w) were chosen and studied for the rest work. The hydrodynamic diameters of freshly prepared complexes were measured at room temperature using a Malvern Zetasizer Nano ZS90 (Malvern Instruments, Worcestershire, UK). Furthermore, their size change during 24 h-incubation at 37 °C was monitored. The colloidal stability of the complexes following 24 h-incubation at 37 °C in PBS or PBS with 10 % FBS was examined using gel retardation assay.
2.5.3 Transmission electron microscopy (TEM)
Gal-G5 and Gal-G5/CEH (20:1, w/w) sample suspensions were loaded onto a 300 mesh carbon coated copper grid, air dried at room temperature, and imaged under a transmission electron microscope (TEM) (JEM-3010, JEOL, Tokyo, Japan).
2.5.4 Intracellular trafficking study
Label IT® Cy3® plasmid delivery control (referred to as Cy3 plasmid hereafter) was used a model compound. Hepatocytes were seeded in 2-well chamber slides and allowed to attach overnight. The cells were incubated with FITC-Gal-G5/Cy3 plasmid (5 μg/0.25 μg) or FITC-G5/Cy3 plasmid (1 μg/0.25 μg) in 500 μL of William's E medium with 10 % FBS at 37 °C for 6 h. Afterwards, the medium in each chamber was replaced with fresh growth medium containing 10 % FBS. The cells were cultured for an additional 6 or 24 h. At the end of incubation, the cells were rinsed with DPBS, fixed with 4 % buffered formalin PBS, permeabilized with 0.15 % Triton X-100 and counterstained with DAPI. The cells were then imaged under a Zeiss LSM 700 confocal laser scanning microscope.
2.5.5 Transfection and biological activity studies
Hepatocytes were cultured in 6-well plates (~90 % confluence) and transfected with Gal-G5/CEH (5 μg/0.25 μg), Gal-G5/empty control vector (pCMV) (5 μg/0.25 μg), G5/CEH (1 μg/0.25 μg), or G5/pCMV (1 μg/0.25 μg) in William's E medium with 10 % FBS for 24 h. After the medium in each well was replaced with fresh growth medium containing 10 % FBS, the cells were cultured for an additional 24 or 48 h. CEH mRNA expression was quantified using RT-qPCR as described our previous work [15, 43, 44]. CEH mRNA expression-mediated by Gal-G5 or G5 relative to the expression observed in the hepatocytes transfected with pCMV-mediated with the same carrier was determined. CEH enzymatic activity was determined by monitoring the intracellular hydrolysis of HDL-delivered 3H-CE that was added to a separate set of hepatocytes following 24 h-transfection. CEH enzymatic activity was assessed in terms of 3H-FC accumulation in the cells, and the effects of increased CEH expression on flux of HDL-3H-CE to bile acids was assessed by monitoring the release of 3H-BA in the medium as described earlier [15, 43]. CEH enzymatic activity in non-transfected hepatocytes was examined as control.
2.6 In vivo studies
2.6.1 Biodistribution
IRDye 800CW-labeled Gal-G5/CEH (20:1, w/w) or IRDye 800CW-labeled G5/CEH (4:1, w/w) was administered to C57BL/6 mice via tail vein injection. Both formulations were adjusted to have an equivalent amount of total fluorescent intensity (0.5 mg IRDye 800CW/kg in 0.2 mL, balanced in osmolality with the addition of DPBS). At each pre-determined time point up to 168 h, a group of 3 mice for each formulation were euthanized. Major organs (heart, liver, spleen, lung and kidney) were harvested and imaged using an Odyssey® Fc Imaging System (LI-COR, Nebraska USA) at ex/em = 780/800 nm followed by quantitative image analysis of fluorescence signals [45–47].
2.6.2 Tissue analysis of CEH mRNA expression
C57BL/6 mice received a bolus of Gal-G5/CEH (20:1, w/w) or G5/CEH (4:1, w/w) (n=3) via tail vein injection (0.3 mg CEH/kg in 200 μL, balanced in osmolality with the addition of DPBS) via tail vein. At 24, 48, and 72 h-post injection, a group of 3 mice for each formulation were scarified. The major organs (heart, liver, lung, kidney, and spleen) were harvested and processed for quantification of CEH gene expression using RT-qPCR. To distinguish CEH expression between hepatocytes and Kupffer cells in the liver, one extra group of 3 mice treated with Gal-G5/CEH or G5/CEH were sacrificed at 48 h-post injection, and the hepatocytes and Kupffer cells in the liver were isolated and subjected to RT-qPCR analysis [48].
2.6.3 Acute toxicity studies
C57BL/6 mice were received a bolus dose of Gal-G5/CEH (20:1, w/w) or G5/CEH (4:1, w/w) (0.6 mg CEH/kg) (n=3 per group) via tail vein injection and maintained on chow diet. Untreated C57BL/6 mice (n=3) were included as control. The mice were sacrificed at 24 h-post administration. To assess hepatic toxicity, renal toxicity and immunotoxicity of the formulations, blood was collected and analyzed for aspartate aminotransferase (AST), alanine aminotransferase (ALT), blood urea nitrogen (BUN), IL-6 and TNF-α [33]. Tissues (heart, liver, spleen, lung, and kidney) were processed for H&E staining.
2.6.4 Flux of HDL-3H-CE to feces
C57BL/6 mice received a bolus dose of Gal-G5/CEH (20:1, w/w) (0.6 mg CEH/kg) or plain Gal-G5 (12 mg/kg, equivalent to that used in the Gal-G5/CEH group) (n=3 per group) via tail vein injection and maintained on chow diet. At 48 h-post injection, one dose of HDL-3H-CE (1.63×10⁶ dpm/mouse) was administered to the mice via tail vein injection. The mice were transferred to metabolic cages and maintained for an additional 48 h until they were euthanized. The blood, whole liver, gall bladder bile as well as feces were collected. CEH expression in the liver was quantified with RT-qPCR. Total radio activity in plasma, liver, and gall bladder was quantified [48]. Furthermore, 3H-BA and 3H-FC were extracted from liver, gall bladder bile and feces and quantified [15, 17, 49].
2.7 Statistical analysis
The data are expressed as mean ± SD. Student’s t-test was used for statistical analysis, and P < 0.05 was considered statistically significant.
3 Results and Discussions
3.1 Synthesis and characterization of Gal-G5
Gal-G5 (Figure 1A) was synthesized by directly coupling Gal-PEG-NHS to PAMAM G5 via NHS ester-amine reaction. 1H NMR was used to check the purity and conjugation of galactose-modified dendrimer. The spectrum (Figure 1B) confirms the relative high purity of the synthesized Gal-G5 as interfering proton peaks from reactants, intermediates, or reaction solvent are not seen. The methylene protons of branching units of G5 has multiple peaks between 2.2 and 3.4 ppm. The repeat units of PEG from Gal-PEG-NHS has a singlet peak at 3.6 ppm. According to the proton peak integration, an average of 11 Gal-PEG chains were conjugated to G5.
Figure 1. Chemical structure and characterization of Gal-G5.
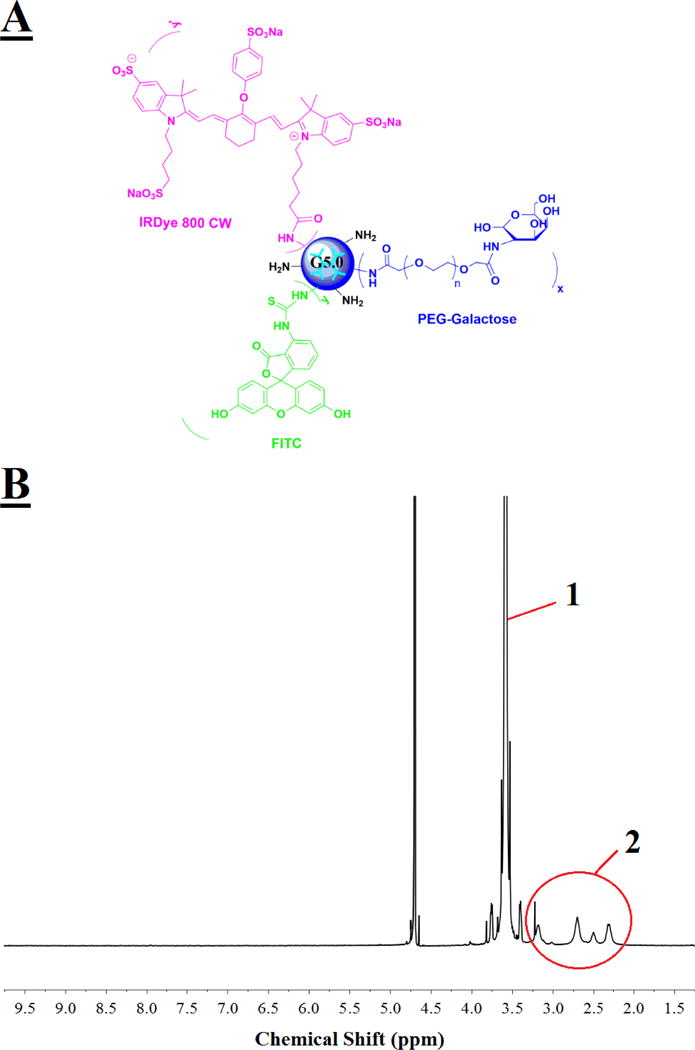
(A) PAMAM dendrimer G5 functionalized with hepatocyte specific ligand galactose alone or along with fluorescence dye (FITC or IRDye 800CW). (B) 300 MHz 1H NMR spectrum of Gal-G5. multiple proton peaks 2 between 2.2 and 3.4 ppm are assigned to the methylene protons of G5 branching units, while a singlet peak 1 at 3.6 ppm is assigned to the ethylene protons of the repeat units of PEG.
Gal-G5 showed enhanced cytocompatibility. It remained nontoxic to hepatocytes when the concentration was increased to 100 nM (Figure 2A). In contrast, the toxicity of G5 at 100 nM was strong, causing cell viability to drop to 62 %. The cell viability was further decreased to 30 % by G5 at 500 nM. In contrast, 65 % of cells remained viable in the presence of 500 nM Gal-G5, indicating its relatively higher cytocompatibility. After DAPI staining, a significant fraction of dead cells are clearly seen in the G5/100 nM group (Figure 2B), whereas such observation is not seen in the Gal-G5/100 nM group. Galactose functionalized G5 obtained significantly improved cytocompatibility likely due to the effective charge shielding effect of PEG chains and decreased number of amines on the dendrimer surface as reported in the literature [50–52].
Figure 2. Gal-G5 shows high cytocompatibility.
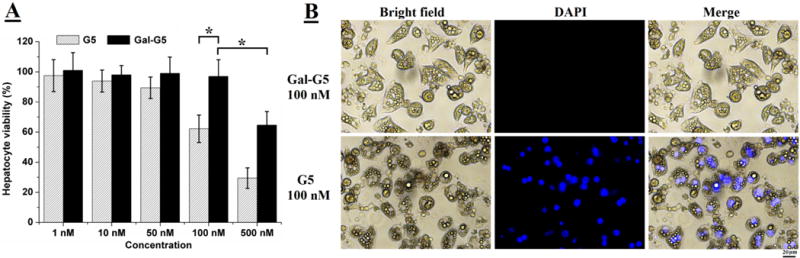
Primary mouse hepatocytes were treated with Gal-G5 or G5 at the indicated concentrations for 24 h and then assessed with the WST-1 assay for viability. (A) Gal-G5 is more tolerated by primary mouse hepatocytes. *P<0.05 (n=5). (B) Representative images of the cells treated with G5 or Gal-G5 at 100 nM. The cells stained with fluorescent dye DAPI are dead cells due to the lack of an intact cell membrane. Scale bar: 20 μm.
3.2 Hepatocyte-specificity of Gal-G5 in vitro
Cellular uptake kinetics of FITC-G5 (50 nM) and FITC-Gal-G5 (50 nM) by primary hepatocytes was monitored by using fluorescence microscopy (Figure 3A). Increased cellular uptake of nanoparticles with increasing incubation time was observed in both groups, but a much stronger florescence signal was seen in the FITC-Gal-G5 group at any time point as compared to FITC-G5. Consistent with the imaging data, FITC-Gal-G5 shows much higher cellular uptake (measured as mean fluorescent intensity, MFI) (Figure 3B). For instance, the MFI of FITC-Gal-G5 is 7000 ± 300 at 24 h, which is ten-fold stronger than that of FITC-G5.
Figure 3. Gal-G5 shows enhanced uptake by hepatocytes.
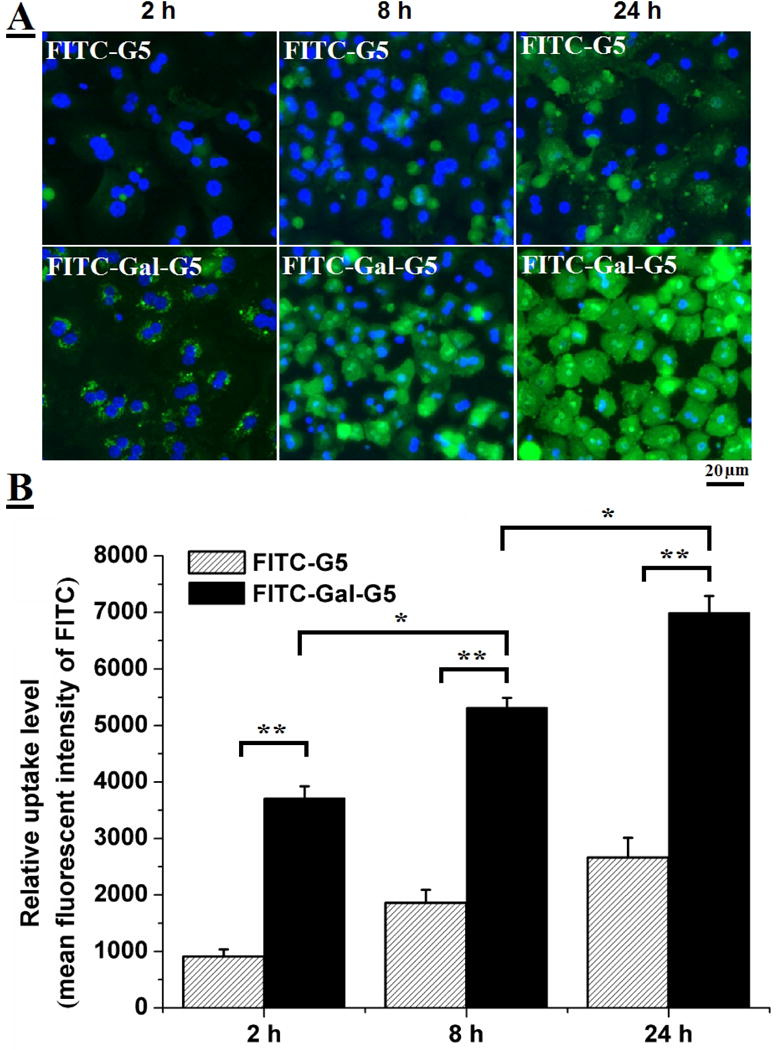
Primary mouse hepatocytes were incubated with 50 nM FITC-Gal-G5 or FITC-G5 for various lengths of time (2, 8, or 24 h) and then subjected to fluorescent imaging or FACS analysis. (A) Representative fluorescence images. (B) Quantification of nanoparticle uptake as a function of time reported as mean fluorescence intensity (MFI) of FITC. n=3, *P<0.05, **P<0.01.
Uptake of FITC-Gal-G5 via ASGPR was confirmed using competitive inhibition assay. As shown in Figure 4A, fluorescence signal of FITC-Gal-G5 was reduced significantly with increasing exogenous galactose concentration. Flow cytometry was used to quantify the uptake and MFI values are shown in Figure 4B. Compared to the uptake observed in the absence of galactose, significantly lower uptake was seen in the presence of 3 μM free galactose (24 % decrease, P<0.05) and 30 μM (77 % decrease, P<0.01). Free galactose selectively binds ASGPR. The presence of free galactose suppressed the uptake of FITC-Gal-G5 because it bound to the receptors and blocked the access of FITC-Gal-G5 to the same receptors. These data clearly demonstrate that the galactose functionalization of G5 effectively increased the uptake by hepatocyte in comparison to G5 mainly through the ASGPR that has a high affinity for galactose. These observations are consistent with other studies reporting galactose-mediated increase in hepatocyte uptake of nanoparticles [53–55].
Figure 4. Receptor-mediated endocytosis of Gal-G5 by hepatocytes: competitive inhibition study.
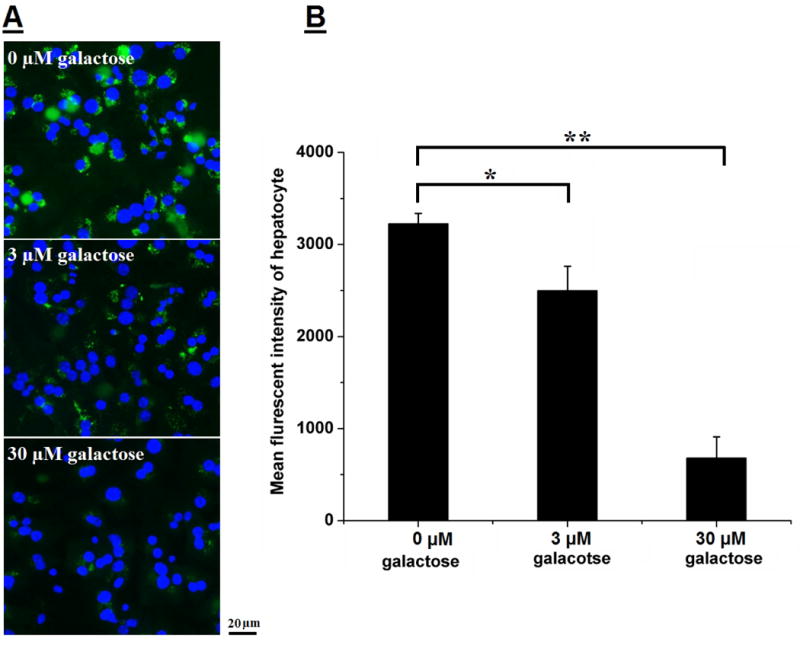
Freshly isolated mouse hepatocytes were pre-incubated with galactose (0, 3, or 30 μM) for 30 min at 37 °C and then with 50 nM Gal-G5 for 2 h. Uptake of FITC-Gal-G5 was monitored by fluorescent microscopy (A) and quantified by FACS (B). n=3, *P<0.05, and **P<0.01.
Additionally, the effect of galactose modification on the uptake of G5 by mouse peritoneal macrophages, one of the most aggressive scavengers, was investigated. The results showed that the uptake of Gal-G5 by macrophages was 4-fold lower than that of plain G5 (Figure 5A and 5B). The reduced uptake by macrophages is likely due to low expression of galactose receptor ASGPR on the macrophages. In addition, PEGylation of Gal-G5 helped reduced non-specific uptake as results of surface charge shielding effect [56–59].
Figure 5. Gal-G5 shows reduced uptake by macrophages.
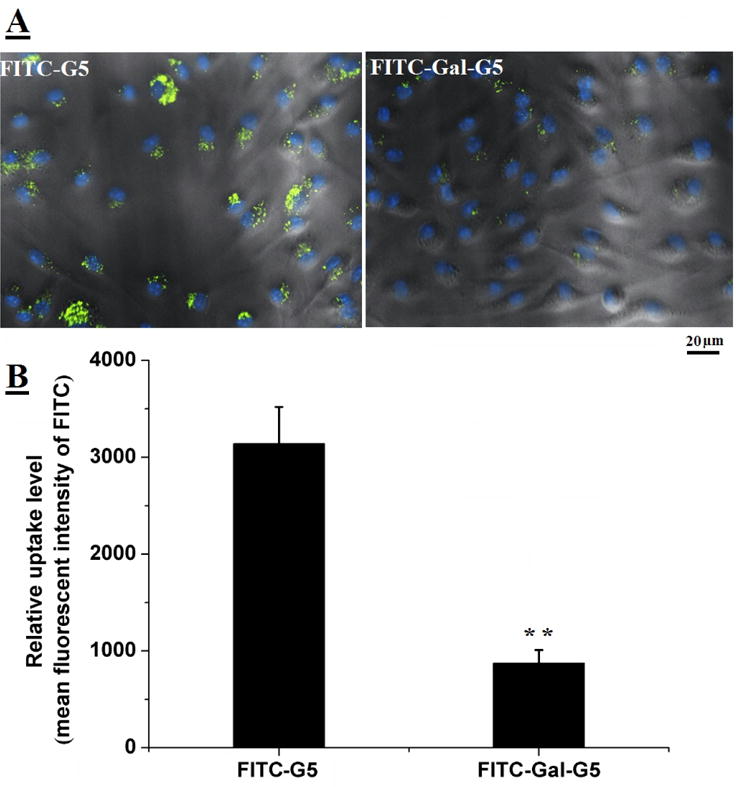
Mouse peritoneal macrophages were incubated with 50 nM FITC-Gal-G5 or FITC-G5 for 6 h and then subjected to fluorescent imaging or FACS analysis. (A) Representative fluorescence images. (B) Quantification of nanoparticle uptake reported as mean fluorescence intensity (MFI) of FITC. n=3, **P<0.01.
3.3 Characterization of dendrimer/CEH complexes
Formation of dendrimer/CEH complexes was initially evaluated by using gel retardation assay. As shown in Figure 6A, G5 and CEH plasmid forms stable complexes at a weight ratio of 4 or higher. A weight ratio of 20 or higher is needed for Gal-G5 to complex with CEH plasmid stably, presumably due to the charge shielding effect of long PEG chains evidenced by zeta potential decrease from 30 mV for G5 to 2 mV for Gal-G5. Nonetheless, the DNA compaction ability of Gal-G5 is deemed sufficient. Hydrodynamic size determination results (Figure 6B) show that size significantly increased from ~10 nm for Gal-G5 alone to 114.9 nm for Gal-G5/CEH. As shown in the TEM images, the Gal-G5/CEH complexes have a much larger size than Gal-G5.
Figure 6. Characterization of dendrimer/CEH complexes.
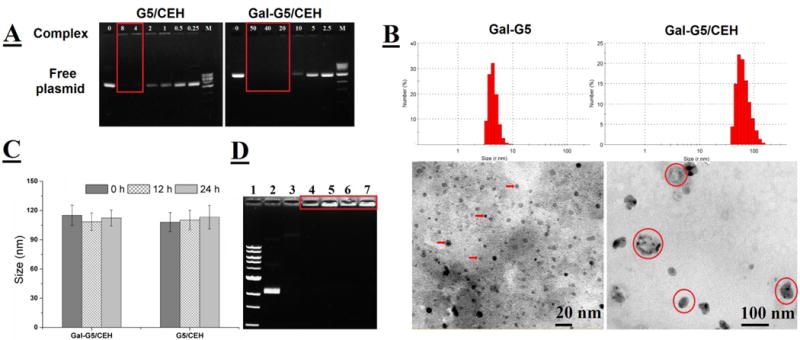
(A) Gel retardation assay on G5/CEH and Gal-G5/CEH complexes freshly prepared at different weight ratios. M: the DNA ladder. The stable complexes remained immobile as highlighted. (B) DLS (room temperature) and TEM images of Gal-G5 and freshly prepared Gal-G5/CEH complexes (20:1, w/w). Some Gal-G5 particles are pointed with arrows and Gal-G5/CEH complexes are highlighted in red circles. (C) Hydrodynamic size change of Gal-G5/CEH (20:1, w/w) and G5/CEH (4:1, w/w) at 37 °C in PBS over a period of 24 h. (D) Gel retardation assay on G5/CEH (4:1, w/w) and Gal-G5/CEH (20:1, w/w) following 24 h-incubation 37 °C in PBS or PBS with 10 % FBS. Lane 1: the DNA ladder; Lane 2: CEH in PBS; Lane 3: CEH in 10 % FBS; Lane 4: G5/CEH in PBS; Lane 5: G5/CEH in 10 % FBS; Lane 6: Gal-G5/CEH in PBS; Lane 7: Gal-G5/CEH in 10 % FBS. Both G5/CEH and Gal-G5/CEH maintained good colloidal stability and did not release CEH plasmid as highlighted.
The colloidal stability of these complexes in salt solution (PBS) as well as in the presence of serum was tested. As shown in the Figure 6C, no significant change in the hydrodynamic diameter of complexes at 37 °C for 24 h suggested that formulation stability of complexes can be maintained for at least 24 h. Figure 6D showed that naked plasmid DNA (lane 3) was completely digested in the presence of serum likely due to associated nucleases during the 24 h-incubation. In contrast, both dendrimers/CEH gene complexes were not destroyed by serum (lane 5 for G5/CEH and lane 7 for Gal-G5/CEH) and were retained in the loading wells similar to the corresponding controls in the absence of serum (lane 4 for C5/CEH and lane 6 for Gal-G5/CEH). These results demonstrate that both G5 and Gal-G5 are able to protect the complexed DNA from degradation by serum nucleases and maintain good colloidal stability, supporting their suitable use in in vitro and in vivo studies.
3.4 Intracellular trafficking of complexes
Effective dissociation and subsequent movement of DNA to the nucleus is critical for expression of the delivered gene. Intracellular localization and dissociation Gal-G5/Cy3-labeled plasmid and G5/Cy3-labeled plasmid were examined. After 6 h, Cy3-plasmid was tightly complexed with both vectors. Dissociation of Cy3-plasmid from FITC-Gal-G5 became evident at 24 h, while no appreciable dissociation of Cy3-plasmid and FITC-G5 was observed (Figure 7, highlighted, clear separation of green Gal-G5 and red plasmid, and some red plasmid also entered the nucleus mediated by Gal-G5/CEH). The dissociation was attributed to the weakened electrostatic interactions between dendrimer and plasmid by long PEG spacer. It was a critical step before released plasmid could further translocate into the nucleus for transcription and translation. Those observations are consistent with facilitated gene transfection delivered by PEGylated-PAMAM dendrimer reported by other researchers [60, 61].
Figure 7. Intracellular dissociation of Cy3 plasmid from G5 or Gal-G5 in mouse hepatocytes.
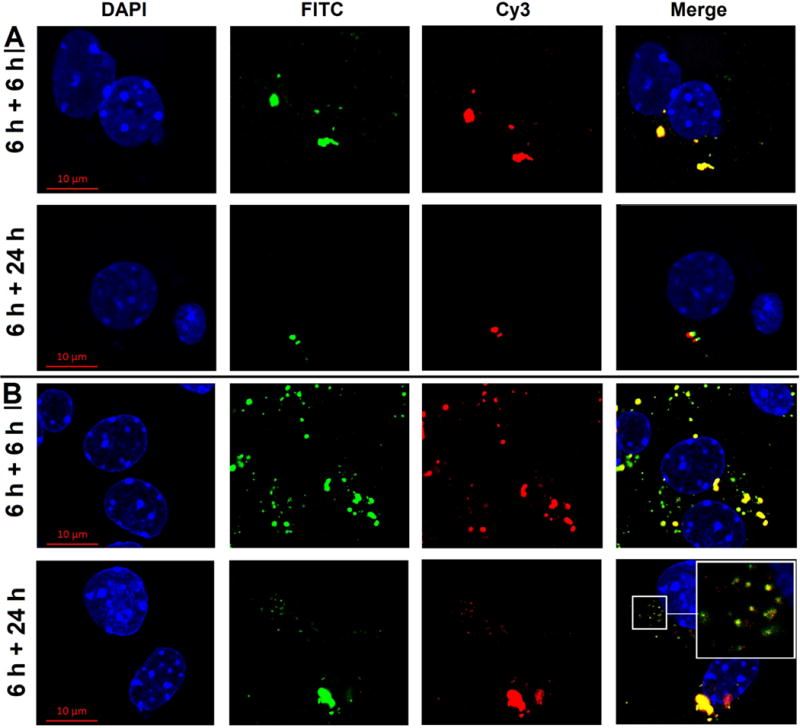
Primary mouse hepatocytes were incubated with FITC-G5/Cy3 plasmid (4:1, w/w) (A) or FITC-Gal-G5/Cy3 plasmid (20:1, w/w) (B) in William's E medium supplemented with 10 % FBS for 6 h. The medium was replaced with fresh medium/10 % FBS, and the hepatocytes were incubated for an additional 6 or 24 h. At the end of the incubation, the cells were rinsed with DPBS, and the nuclei stained with DAPI and imaged by using confocal microscopy (630×). Blue, DAPI; Green, FITC; Red, Cy3. A magnified view of the area outlined by the smaller squared box is presented in the top right corner to show dissociation of plasmid from the carrier.
3.5 Increased CEH expression and activity in hepatocytes mediated by Gal-G5/CEH complex in vitro
To directly examine whether galactose functionalization indeed increases the ability of Gal-G5 to deliver CEH expression vector to hepatocytes in vitro, CEH mRNA expression in hepatocytes was quantified by using RT-qPCR. CEH expression vector where CEH expression was driven by a constitutive CMV promoter was used along with empty vector pCMV serving as a control. Fold increase in CEH mRNA expression was determined relative to the expression observed in hepatocytes treated with dendrimer/pCMV. It should be noted that no Ct value was obtained when RNA from hepatocytes treated with G5/pCMV or Gal-G5/pCMV complexes since the PCR probes used were specific for human CEH. As shown in Figure 8A, expression of CEH delivered by Gal-G5 was about 2- and 6-fold higher than that by G5 (P<0.01) after 24 and 48 h exposure, respectively, demonstrating the higher efficiency of CEH delivery achieved with Gal-G5.
Figure 8. Delivery of CEH plasmid via Gal-G5 results in increased CEH expression and associated biological activity.
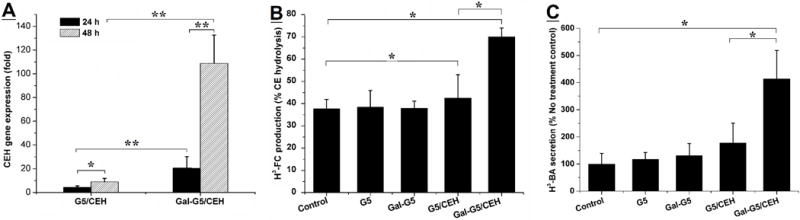
(A) CEH expression enhanced by Gal-G/CEH. Primary mouse hepatocytes were treated with G5/pCMV (4:1, w/w) (control), G5/CEH (4:1: w/w), Gal-G5/pCMV (20:1, w/w) (control) or Gal-G5/CEH (20:1, w/w) for 24 h. Following replacement with fresh growth medium, the hepatocytes were incubated for an additional 24 or 48 h. At the end of the treatment, total RNA was isolated and CEH gene expression was determined by using RT-qPCR. CEH expression induced by G5/CEH or Gal-G5/CEH relative to that induced by the corresponding control is presented. n=3, *P<0.05 and **P<0.01. (B) Intracellular hydrolysis of HDL-CE promoted by Gal-G5/CEH. Primary mouse hepatocytes were incubated with G5, Gal-G5, G5/CEH (4:1, w/w), or Gal-G5/CEH (20:1, w/w) for 24 h. Then the hydrolysis of HDL-3H-CE in each group was monitored. n=3, *P<0.05. (C) The flux of FC to bile acids as a result of CEH-mediated hydrolysis of HDL-3H-CE was assessed by monitoring the appearance of [3H]-BA in the culture medium. n=3, *P<0.05.
We have earlier demonstrated that increase in hepatic CEH not only leads to increase in the hydrolysis of HDL-CE but also increases the flux of cholesterol from HDL-CE to bile acids providing the mechanism underlying the anti-atherosclerotic effects of hepatic CEH [17, 44]. The long term objective of developing a non-viral platform for targeted delivery of CEH to the liver is to establish it as a novel anti-atherosclerotic strategy. Towards this goal, it is critical to establish that Gal-G5-delivered CEH is biologically active or functional. To examine whether increased CEH mRNA expression leads to increase in intracellular CE hydrolysis, conversion of HDL-3H-CE to 3H-FC and final conversion of 3H-FC to 3H-BA was monitored. Consistent with the increased CEH mRNA expression, compared to hepatocytes exposed to G5/CEH, significantly higher hydrolysis of HDL-CE was noted in hepatocytes exposed to Gal-G5/CEH complexes (Figure 8B, 70 ± 4 % versus only 39 ± 7 %, P<0.05). Furthermore, increased conversion of HDL-CE derived FC to bile acids was also noted in hepatocytes treated with Gal-G5/CEH complexes (Figure 8C, 417 ± 100 % versus 182 ± 63 %, P<0.05). Consistent with our earlier data showing increased conversion of HDL-CE to BA following transgenic CEH overexpression in hepatocyte [15, 17, 44], these data confirm that Gal-G5-mediated delivery of CEH gene leads to the elimination of HDL-CE to BA.
3.6 Enhanced liver-specific delivery in vivo
The final step in establishing the validity of galactose functionalized G5 as a platform for delivery of CEH or any other expression vector to liver to modulate in vivo expression, it is important to not only demonstrate selective uptake by liver but also show that such a delivery does not induce toxicity. For this purpose, time-dependent in vivo bio-distribution of Gal-G5 and G5 was monitored after intravenous injection. Figure 9A shows that 800CW-labled Gal-G5 rapidly targeted liver after 1 h intravenous administration and the accumulation gradually increased with highest intensity in liver seen after 48 h. The infrared dye 800CW intensity persisted for at least 7 days post-administration. This higher liver accumulation of 800CW-labled Gal-G5 in comparison to the 800CW-labled G5 was consistent with higher in vitro hepatocyte uptake described before validating the liver-specific delivery due to galactose functionalization. Compared to G5, PEG modifications from galactose resulted in a decrease of the passive RES uptake by spleen and renal clearance consistent with known effects of PEGylation, namely, biocompatibility and non-immunogenicity, and increased blood circulation time after intravenous injection by reducing opsonization by proteins and hindering the uptake by macrophages in the RES. Similar accumulation in RES organs (liver and spleen) was observed in mice administrated with 800CW-labled G5. Furthermore, obvious accumulation of fluorescent intensity was also observed in kidney from both groups. This is likely due to filtration and secretion of same size dendrimer (less than 10 nm) after dissociation of complex. However, compared with group-treated with IRDye 800CW-labled G5, the lower fluorescent signal in kidney from the 800CW-labled Gal-G5-treated group within 48 h was probably attributed to extended circulation time induced by PEGylation. These data are not only consistent with in vitro observation but also clearly demonstrate the ability of Gal-G5 to selectively deliver gene to the liver. The fluorescence intensity of each tissue was quantitatively analyzed by CLx infrared imaging system software and plotted in the Figure 9B.
Figure 9.

Enhanced in vivo liver uptake of Gal-G5. C57BL/6 mice were administered with 800CW-labeled Gal-G5/CEH or 800CW-label G5/CEH via tail vein injection. (A) Major organs were harvested at indicated time points and imaged using the Odyssey® Fc Imaging System at ex/em = 780/800 nm (heart, liver, spleen, lung and kidney, from left to right). (B) Quantitative analysis of fluorescent signal intensities of the major organs at different time points (n=3).
3.7 Gal-G5 mediated liver-specific delivery increases CEH expression in vivo
In vivo CEH gene expression analysis (Figure 10A) revealed that Gal-G5/CEH resulted in the much higher CEH expression (shown as copy number of CEH mRNA) in liver in comparison to the G5/CEH at all three time points. The highest CEH expression in liver was seen in the group-treated with Gal-G5/CEH at 48 h, which was around 3 fold (P<0.01) higher than G5/CEH group. Higher CEH expression in spleen was observed among the mice-treated with G5/CEH post-48 h injection; the decrease in CEH copy number in liver at 72 h could be related to mRNA stability/degradation. CEH expression in other tissues such as heart, lung and kidney was very low for both complexes consistent with low accumulation in both heart and lung. Despite the accumulation of NIR dye in the kidney likely due to filtration/accumulation of uncomplexed or free dendrimer, there was no significant expression of CEH indicating negligible delivery of CEH expression vector. While the Gal-G5/CEH complexes mediated increase in CEH expression seen here is 10 fold lower than the transient adenovirus-mediated CEH expression in liver previously achieved by our lab (~5 × 10⁶ copies/μg total RNA) [44], only a two-fold increase in CEH activity in liver-specific CEH transgenic mice was sufficient to attenuate diet-induced atherosclerosis in Ldlr−/− mice [44]. Therefore, this non-viral gene delivery platform still holds promise as a novel alternative with safe application, low cost and simple construction. Liver consists of hepatocytes as well as resident macrophages, i.e., Kupffer cells. Although in vitro data showed negligible uptake of Gal-G5 by isolated macrophages, relative expression of CEH was further examined in hepatocytes and Kupffer cells for comparison. As shown in Figure 10B, there was significantly higher increase in CEH expression in hepatocytes versus Kupffer cells in the mice-treated with Gal-G5/CEH compared to G5/CEH (350-fold higher for Gal-G5/CEH versus 5-fold higher for G5/CEH, P<0.01). Taken together with the in vitro data, these results confirm the hepatocyte-specific delivery of CEH by Gal-G5.
Figure 10.
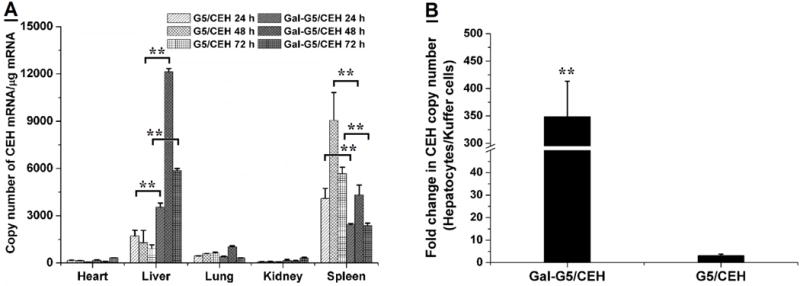
Enhanced in vivo CEH expression in hepatocytes in the liver by Gal-G5/CEH. (A) CEH expression in the major organs at selected time points, i.e., 24, 48 and 72 h post-injection was quantified with RT-qPCR. n=3, **P<0.01. (B) In a parallel experiment, hepatocytes and Kupffer cells were isolated from the livers of the treated mice at 48 h-post injection, and CEH expression in the isolated cells was quantified with RT-qPCR. A significant increase in CEH expression in hepatocyte relative to that in Kupffer cells was achieved by Gal-G5/CEH. n=3, **P<0.01.
3.8 In vivo tissue safety of Gal-G5/CEH
Acute systemic toxicity and inflammatory reaction was investigated 24 hours after intravenous administration to examine the biocompatibility of two kinds of complexes. There were no obvious histological differences between the major organs of treated and untreated mice (Figure 11). Plasma levels of alanine transaminase (ALT) and aspartate transaminase (AST) for liver toxicity, blood urea nitrogen (BUN) for kidney toxicity and TNF-α and IL-6 for induction of inflammatory reaction were determined and the data are summarized in Table 1. Gal-G5/CEH group showed excellent tissue compatibility. No significant differences in these parameters were seen between the Gal-G5/CEH group and the untreated control group. However, significant increases in the levels of ALT, AST and IL-6 were observed in the G5/CEH. These results suggest the toxicity of G5/CEH to tissues or organs including the metabolically active liver. Given the toxicity and low hepatocyte specificity of G5/CEH, only Gal-G5/CEH was evaluated for in vivo delivery of CEH to the liver.
Figure 11. In vivo delivery of CEH by Gal-G5 does not cause tissue toxicity.
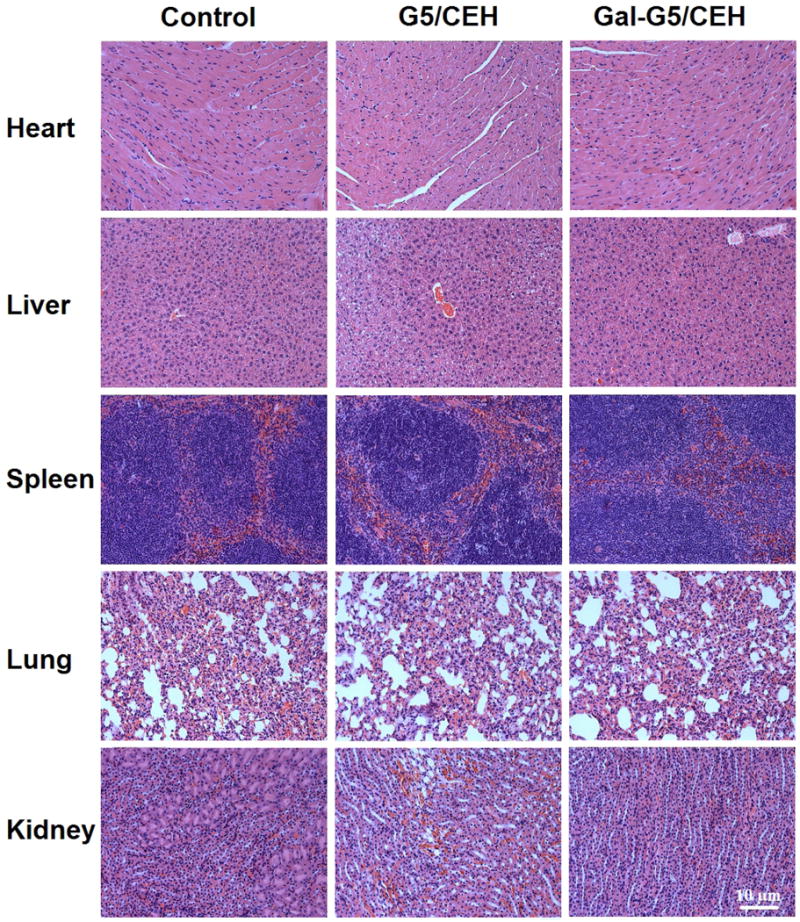
C57BL/6 mice were injected (i.v.) with Gal-G5 or G5, and major organs were harvested 24 h post-injection. Untreated C57BL/6 mice were used as control. H&E-stained sections of the major organs are shown. Scale bar: 10 μm.
Table 1.
Quantification of hematological biomarkers of hepatic and renal toxicity as well as cytokine biomarkers of immunotoxicity.
| Treatment | AST (U/L) | ALT (U/L) | BUN (mg/dL) | IL 6 (ng/mL) | TNF-α (ng/mL) |
|---|---|---|---|---|---|
| Control | 65 ± 10.3 | 34 ± 3.5 | 22 ± 0.6 | 1.1 ± 0.10 | 0.6 ± 0.11 |
| G5/CEH | 315 ± 114.9** | 169 ± 81.8** | 27 ± 6.1 | 3.6 ± 0.20** | 0.7 ± 0.12 |
| Gal-G5/CEH | 71 ± 13.2 | 37 ± 8. 2 | 26 ± 5.6 | 1.6 ± 0.05 | 0.5 ± 0.05 |
Note: n=3,
P<0.01 vs. the control.
3.9 Gal-G5 mediated delivery of CEH to liver increases the flux of HDL-CE to bile and feces in vivo
The mechanism underlying the anti-atherogneic effects of hepatic CEH is its ability to hydrolyze CE delivered by HDL and enhance the flux of resulting FC to bile acids for biliary secretion and elimination in feces. To determine whether Gal-G5-mediated delivery of CEH expression vector modulates this critical step in vivo, flux of radiolabeled-CE from HDL in circulation to liver and then to bile acids and feces was monitored. It must be emphasized that the 3H-label in these studies is associated with the cholesterol moiety of CE permitting the tracking of this label to monitor hydrolysis of HDL-CE in the liver, its conversion to bile acids and final secretion into feces. As shown in Figure 12, Gal-G5/CEH complex significantly increased the CEH expression in liver compared with blank vector Gal-G5 (P<0.01, Panel A). Following intravenous administration of HDL-3H-CE, lower radioactivity in plasma (P<0.05, Panel B) and higher radioactivity in whole liver (P<0.05, Panel C) were observed in animals-treated with Gal-G5/CEH complex in comparison to animals-treated with Gal-G5, suggesting that increased CEH expression in liver increased clearance of HDL-3H-CE from the blood and corresponding increase in uptake by the liver. It should be noted that radioactivity associated with the liver is the sum of 3H-CE delivered to the liver via HDL receptor SR-BI and the downstream metabolic products of 3H-CE including 3H-FC as well as 3H-BA. To directly evaluate the effects of increased CE expression in the liver, radioactivity associated with hepatic FC and BA was determined. Consistent with the increased expression of CEH in mice treated with Gal-G5/CEH complexes, higher radioactivity was associated with hepatic FC and BA (P<0.05, Panel D) indicating that increased CEH expression led to increase in intracellular CE hydrolysis into FC and final conversion of FC to BA. Following synthesis, BA is secreted into bile that is stored in the gall bladder and timely released into the intestine to facilitate digestion. To examine the effects of increased CEH expression in the liver in mediating the flux of cholesterol from HDL to biliary BA, radioactivity associated with BA extracted from gall bladder bile was monitored. Significantly higher level of radiolabel was associated with biliary BA in Gal-G5/CEH complex-treated mice (P<0.05, Panel E and Panel F); there was no significant difference between radiolabel associated with FC. Biliary BA and FC are finally secreted into feces and this represents the only physiological mechanism for final elimination of cholesterol from the body. It is noteworthy that lack of enzymes to cleave the steroid nucleus necessitates the conversion of hydrophobic cholesterol into hydrophilic bile acids by hydroxylation to facilitate elimination in feces. Therefore, any mechanism that can stimulate removal of cholesterol returning to the liver from the peripheral tissues (as CE in HDL particle), including arterial-plaque associated macrophage foam cells, will potentially reduce cholesterol burden and be antiatherogenic. Therefore, as a final step, effects of Gal-G5 delivered CEH expression vector on fecal elimination of cholesterol derived from HDL was monitored. Significantly higher radioactivity was also associated with fecal BA and FC in mice injected with Gal-G5/CEH complex compared with mice injected with Gal-G5 (P<0.05, Panel G). These data are consistent with earlier studies from our laboratory showing increased flux of HDL-CE to bile and feces by hepatic over-expression of CEH [15, 17, 44, 48] that promotes intracellular hydrolysis of HDL delivered CE and thus enhances the elimination of cholesterol from the body. Indeed, transgenic over expression of CEH attenuates atherosclerosis in Ldlr−/− mice and these data provide a non-genetic/non-viral approach to enhancing the expression of CEH in the liver as a potentially novel anti-atherogenic strategy.
Figure 12. Increased CEH expression in the liver promotes RCT in vivo.
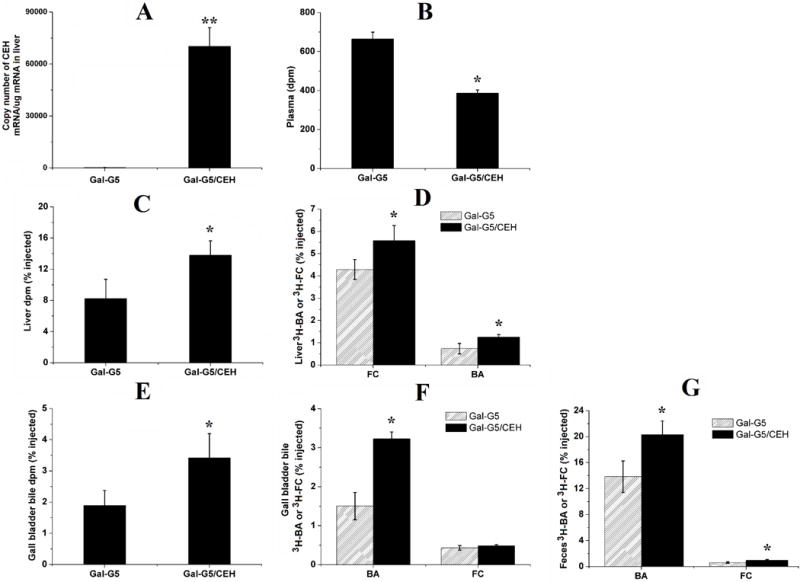
WT C57BL/6 mice were administered with Gal-G5 or Gal-G5/CEH via tail vein injection. After 48 h, mice were intravenously injected with [3H]-CE-labeled HDL. After an additional 48 h, blood, liver, gall bladder bile and feces were collected and analyzed. Radioactivity data (n = 3) are presented as the percentage of the total injected radiolabeled dose. (A) CEH expression in the liver (**P < 0.01); (B) radioactivity in plasma (*P < 0.05); (C) total radioactivity in the liver (*P < 0.05); (D) 3H-FC and 3H-BA in the liver (*P < 0.05); (E) total radioactivity in gall bladder bile (*P < 0.05); (F) 3H-FC and 3H-BA in gall bladder bile (*P < 0.05); (G) 3H-FC and 3H-BA in feces (*P < 0.05).
4 Conclusions
Inhibition of pathological processes central to the development of disease, by pharmacologically active small molecules [62] or genetic manipulation by siRNA/miRNA/ASOs [63–65], is the most widely accepted/used strategy to reduce the progression of diseases. However, enhancing an endogenous biological process that is necessary for the prevention of disease progression, and more importantly the reversal of established disease, has proven to be challenging mainly because of the lack of suitable platforms for the introduction of the critical gene required to increase the affected pathway. Based on the significant residual CVD risk present despite reaching the target LDL-C levels and failure of risk reduction by merely increasing HDL-C levels has shifted the paradigm from lipoprotein associated cholesterol to flux of cholesterol from arterial plaque associated macrophages to liver and final elimination from the body [66]. The fact that cholesterol is carried within the lipoproteins as CE but only FC is secreted in bile either directly or following conversion to bile acids underscores the importance of hepatic CE hydrolysis and earlier studies from our laboratory have established the anti-atherogenic role of hepatic CEH. Currently, endogenous regulation of CEH remains largely unknown in mice or humans although reduced CEH expression is reported in human carotid artery plaques [4]. With the objective to address the as yet unmet need for novel strategies for enhancing the removal of cholesterol from body, the data presented herein demonstrates the suitability of Gal-G5 to deliver CEH to the liver and increase the flux of cholesterol from HDL-CE to FC and bile acids by increasing CE hydrolysis within the hepatocytes. Furthermore, functionalization of G5 with galactose not only increases liver-specific delivery, but use of long PEG spacer for galactose attachment, also reduces the toxicity associated with high positive charges on the surface of unmodified G5. The development of this relatively non-toxic and efficient liver-specific gene delivery platform is an encouraging step towards the clinical translation of strategies based on enhancing removal of cholesterol from the body to reduce the existing atherosclerotic plaque burden (or plaque regression) for which no therapeutics are currently available. It is noteworthy that hepatocyte-specific CEH over-expression significantly attenuates western diet-induced atherosclerosis without having any effect on plasma lipoprotein profile [44]. Future studies will be focused on the pre-clinical evaluation of Gal-G5 mediated increase in cholesterol elimination from the body and its impact on reducing atherosclerotic plaque burden.
Acknowledgments
This work was supported, in part, by VCU’s CTSA (UL1TR000058 from the National Center for Advancing Translational Sciences) and the CCTR Endowment Fund of Virginia Commonwealth University to HY and SG as well as NSF CAREER award CBET0954957.
Footnotes
Publisher's Disclaimer: This is a PDF file of an unedited manuscript that has been accepted for publication. As a service to our customers we are providing this early version of the manuscript. The manuscript will undergo copyediting, typesetting, and review of the resulting proof before it is published in its final citable form. Please note that during the production process errors may be discovered which could affect the content, and all legal disclaimers that apply to the journal pertain.
References
- 1.D’Agostino RB, Russell MW, Huse DM, Ellison RC, Silbershatz H, Wilson PW, Hartz SC. Primary and subsequent coronary risk appraisal: new results from the Framingham study. Am Heart J. 2000;139(2):272–281. doi: 10.1067/mhj.2000.96469. [DOI] [PubMed] [Google Scholar]
- 2.Libby P. Inflammation in atherosclerosis. Arterioscler Thromb Vasc Biol. 2012;32(9):2045–2051. doi: 10.1161/ATVBAHA.108.179705. [DOI] [PMC free article] [PubMed] [Google Scholar]
- 3.Moore KJ, Sheedy FJ, Fisher EA. Macrophages in atherosclerosis: a dynamic balance. Nature Reviews Immunology. 2013;13(10):709–721. doi: 10.1038/nri3520. [DOI] [PMC free article] [PubMed] [Google Scholar]
- 4.Ghosh S. Macrophage cholesterol homeostasis and metabolic diseases: critical role of cholesteryl ester mobilization. Expert Rev Cardiovasc Ther. 2011;9(3):329–340. doi: 10.1586/erc.11.16. [DOI] [PMC free article] [PubMed] [Google Scholar]
- 5.Ghosh S, Zhao B, Bie J, Song J. Macrophage cholesteryl ester mobilization and atherosclerosis. Vascul Pharmacol. 2010;52(1):1–10. doi: 10.1016/j.vph.2009.10.002. [DOI] [PMC free article] [PubMed] [Google Scholar]
- 6.Mulder WJ, Jaffer FA, Fayad ZA, Nahrendorf M. Imaging and nanomedicine in inflammatory atherosclerosis. Sci Transl Med. 2014;6(239):239sr1. doi: 10.1126/scitranslmed.3005101. [DOI] [PMC free article] [PubMed] [Google Scholar]
- 7.Ghosh S, Zhao B, Bie J, Song J. Role of cholesteryl ester hydrolase in atherosclerosis. Clin Lipidol. 2009;4(5):573–585. [Google Scholar]
- 8.Ghosh S, Bie J, Wang J, Yuan Q, Ghosh SS. Cholesterol removal from plaques and elimination from the body: change in paradigm to reduce risk for heart disease. Clin Lipidol. 2014;9(4):429–440. [Google Scholar]
- 9.Rohatgi A, Khera A, Berry JD, Givens EG, Ayers CR, Wedin KE, Neeland IJ, Yuhanna IS, Rader DR, de Lemos JA. HDL cholesterol efflux capacity and incident cardiovascular events. N Engl J Med. 2014;371(25):2383–2393. doi: 10.1056/NEJMoa1409065. [DOI] [PMC free article] [PubMed] [Google Scholar]
- 10.Saleheen D, Scott R, Javad S, Zhao W, Rodrigues A, Picataggi A, Lukmanova D, Mucksavage ML, Luben R, Billheimer J. Association of HDL cholesterol efflux capacity with incident coronary heart disease events: a prospective case-control study. Lancet Diabetes Endocrinol. 2015;3(7):507–513. doi: 10.1016/S2213-8587(15)00126-6. [DOI] [PMC free article] [PubMed] [Google Scholar]
- 11.Khera AV, Cuchel M, de la Llera-Moya M, Rodrigues A, Burke MF, Jafri K, French BC, Phillips JA, Mucksavage ML, Wilensky RL. Cholesterol efflux capacity, high-density lipoprotein function, and atherosclerosis. N Engl J Med. 2011;364(2):127–135. doi: 10.1056/NEJMoa1001689. [DOI] [PMC free article] [PubMed] [Google Scholar]
- 12.GHOSH S. Cholesteryl ester hydrolase in human monocyte/macrophage: cloning, sequencing, and expression of full-length cDNA. Physiol Genomics. 2000;2(1):1–8. doi: 10.1152/physiolgenomics.2000.2.1.1. [DOI] [PubMed] [Google Scholar]
- 13.Zhao B, Fisher BJ, Clair RWS, Rudel LL, Ghosh S. Redistribution of macrophage cholesteryl ester hydrolase from cytoplasm to lipid droplets upon lipid loading. J Lipid Res. 2005;46(10):2114–2121. doi: 10.1194/jlr.M500207-JLR200. [DOI] [PubMed] [Google Scholar]
- 14.Connelly MA, Williams DL. Scavenger receptor BI: a scavenger receptor with a mission to transport high density lipoprotein lipids. Curr Opin Lipidol. 2004;15(3):287–295. doi: 10.1097/00041433-200406000-00008. [DOI] [PubMed] [Google Scholar]
- 15.Bie J, Wang J, Marqueen KE, Osborne R, Kakiyama G, Korzun W, Ghosh SS, Ghosh S. Liver-specific cholesteryl ester hydrolase deficiency attenuates sterol elimination in the feces and increases atherosclerosis in ldlr−/− mice. Arterioscler Thromb Vasc Biol. 2013;33(8):1795–1802. doi: 10.1161/ATVBAHA.113.301634. [DOI] [PMC free article] [PubMed] [Google Scholar]
- 16.Bie J, Zhao B, Ghosh S. Atherosclerotic lesion progression is attenuated by reconstitution with bone marrow from macrophage-specific cholesteryl ester hydrolase transgenic mice. Am J Physiol Regul Integr Comp Physiol. 2011;301(4):R967–R974. doi: 10.1152/ajpregu.00277.2011. [DOI] [PMC free article] [PubMed] [Google Scholar]
- 17.Zhao B, Song J, Ghosh S. Hepatic overexpression of cholesteryl ester hydrolase enhances cholesterol elimination and in vivo reverse cholesterol transport. J Lipid Res. 2008;49(10):2212–2217. doi: 10.1194/jlr.M800277-JLR200. [DOI] [PubMed] [Google Scholar]
- 18.Charach G, Grosskopf I, Rabinovich A, Shochat M, Weintraub M, Rabinovich P. The association of bile acid excretion and atherosclerotic coronary artery disease. Therap Adv Gastroenterol. 2011;4(2):95–101. doi: 10.1177/1756283X10388682. [DOI] [PMC free article] [PubMed] [Google Scholar]
- 19.Simonen H, Miettinen TA. Coronary artery disease and bile acid synthesis in familial hypercholesterolemia. Atherosclerosis. 1987;63(2–3):159–166. doi: 10.1016/0021-9150(87)90116-x. [DOI] [PubMed] [Google Scholar]
- 20.Yang H, Morris JJ, Lopina ST. Polyethylene glycol-polyamidoamine dendritic micelle as solubility enhancer and the effect of the length of polyethylene glycol arms on the solubility of pyrene in water. J Colloid Interface Sci. 2004;273(1):148–154. doi: 10.1016/j.jcis.2003.12.023. [DOI] [PubMed] [Google Scholar]
- 21.Figueroa ER, Lin AY, Yan J, Luo L, Foster AE, Drezek RA. Optimization of PAMAM-gold nanoparticle conjugation for gene therapy. Biomaterials. 2014;35(5):1725–1734. doi: 10.1016/j.biomaterials.2013.11.026. [DOI] [PMC free article] [PubMed] [Google Scholar]
- 22.Mallick S, Choi JS. Polyamidoamine (PAMAM) dendrimers modified with short oligopeptides for early endosomal escape and enhanced gene delivery. Int J Pharm. 2015;492(1):233–243. doi: 10.1016/j.ijpharm.2015.07.017. [DOI] [PubMed] [Google Scholar]
- 23.Yuan Q, Yeudall WA, Yang H. PEGylated polyamidoamine dendrimers with bis-aryl hydrazone linkages for enhanced gene delivery. Biomacromolecules. 2010;11(8):1940–1947. doi: 10.1021/bm100589g. [DOI] [PMC free article] [PubMed] [Google Scholar]
- 24.Liu H, Wang H, Xu Y, Guo R, Wen S, Huang Y, Liu W, Shen M, Zhao J, Zhang G. Lactobionic acid-modified dendrimer-entrapped gold nanoparticles for targeted computed tomography imaging of human hepatocellular carcinoma. ACS Appl Mater Interfaces. 2014;6(9):6944–6953. doi: 10.1021/am500761x. [DOI] [PubMed] [Google Scholar]
- 25.Yuan Q, Fu Y, Kao WJ, Janigro D, Yang H. Transbuccal delivery of CNS therapeutic nanoparticles: synthesis, characterization, and in vitro permeation studies. ACS Chem Neurosci. 2011;2(11):676–683. doi: 10.1021/cn200078m. [DOI] [PMC free article] [PubMed] [Google Scholar]
- 26.Ke W, Shao K, Huang R, Han L, Liu Y, Li J, Kuang Y, Ye L, Lou J, Jiang C. Gene delivery targeted to the brain using an Angiopep-conjugated polyethyleneglycol-modified polyamidoamine dendrimer. Biomaterials. 2009;30(36):6976–6985. doi: 10.1016/j.biomaterials.2009.08.049. [DOI] [PubMed] [Google Scholar]
- 27.Wang H, Zheng L, Peng C, Shen M, Shi X, Zhang G. Folic acid-modified dendrimer-entrapped gold nanoparticles as nanoprobes for targeted CT imaging of human lung adencarcinoma. Biomaterials. 2013;34(2):470–480. doi: 10.1016/j.biomaterials.2012.09.054. [DOI] [PubMed] [Google Scholar]
- 28.Zhang YN, Poon W, Tavares AJ, McGilvray ID, Chan WC. Nanoparticle-liver interactions: Cellular uptake and hepatobiliary elimination. J Control Release. 2016;240:332–348. doi: 10.1016/j.jconrel.2016.01.020. [DOI] [PubMed] [Google Scholar]
- 29.Li L, Wang H, Ong ZY, Xu K, Ee PLR, Zheng S, Hedrick JL, Yang YY. Polymer-and lipid-based nanoparticle therapeutics for the treatment of liver diseases. Nano Today. 2010;5(4):296–312. [Google Scholar]
- 30.Hubbell JA, Chilkoti A. Nanomaterials for drug delivery. Science. 2012;337(6092):303–305. doi: 10.1126/science.1219657. [DOI] [PubMed] [Google Scholar]
- 31.Yang XC, Niu YL, Zhao NN, Mao C, Xu FJ. A biocleavable pullulan-based vector via ATRP for liver cell-targeting gene delivery. Biomaterials. 2014;35(12):3873–3884. doi: 10.1016/j.biomaterials.2014.01.036. [DOI] [PubMed] [Google Scholar]
- 32.Ren Y, Li RQ, Cai YR, Xia T, Yang M, Xu FJ. Effective Codelivery of lncRNA and pDNA by Pullulan‐Based Nanovectors for Promising Therapy of Hepatocellular Carcinoma. Adv Funct Mater. 2016;26(40):7314–7325. [Google Scholar]
- 33.Hu Y, Haynes MT, Wang Y, Liu F, Huang L. A highly efficient synthetic vector: nonhydrodynamic delivery of DNA to hepatocyte nuclei in vivo. ACS nano. 2013;7(6):5376–5384. doi: 10.1021/nn4012384. [DOI] [PMC free article] [PubMed] [Google Scholar]
- 34.Tachibana Y, Munisso MC, Kamata W, Kitagawa M, Harada-Shiba M, Yamaoka T. Quick nuclear transportation of siRNA and in vivo hepatic ApoB gene silencing with galactose-bearing polymeric carrier. J Biotechnol. 2014;175:15–21. doi: 10.1016/j.jbiotec.2014.01.029. [DOI] [PubMed] [Google Scholar]
- 35.Lee MH, Han JH, Kwon PS, Bhuniya S, Kim JY, Sessler JL, Kang C, Kim JS. Hepatocyte-targeting single galactose-appended naphthalimide: a tool for intracellular thiol imaging in vivo. J Am Chem Soc. 2012;134(2):1316–1322. doi: 10.1021/ja210065g. [DOI] [PubMed] [Google Scholar]
- 36.Huang J, Gao F, Tang X, Yu J, Wang D, Liu S, Li Y. Liver-targeting doxorubicin-conjugated polymeric prodrug with pH-triggered drug release profile. Polymer International. 2010;59(10):1390–1396. [Google Scholar]
- 37.Fu F, Wu Y, Zhu J, Wen S, Shen M, Shi X. Multifunctional lactobionic acid-modified dendrimers for targeted drug delivery to liver cancer cells: investigating the role played by PEG spacer. ACS Appl Mater Interfaces. 2014;6(18):16416–25. doi: 10.1021/am504849x. [DOI] [PubMed] [Google Scholar]
- 38.Zhao B, Natarajan R, Ghosh S. Human liver cholesteryl ester hydrolase: cloning, molecular characterization, and role in cellular cholesterol homeostasis. Physiol Genomics. 2005;23(3):304–310. doi: 10.1152/physiolgenomics.00187.2005. [DOI] [PubMed] [Google Scholar]
- 39.Wang J, Bie J, Ghosh S. Intracellular Cholesterol Transport Proteins Enhance Hydrolysis of HDL-delivered Cholesteryl Esters and Facilitate Preferential Elimination of Resulting Cholesterol into Bile. J Lipid Res. 2016 doi: 10.1194/jlr.M069682. jlr. M069682. [DOI] [PMC free article] [PubMed] [Google Scholar]
- 40.Yang H, Kao WJ. Synthesis and characterization of nanoscale dendritic RGD clusters for potential applications in tissue engineering and drug delivery. Int J Nanomedicine. 2007;2(1):89–99. doi: 10.2147/nano.2007.2.1.89. [DOI] [PMC free article] [PubMed] [Google Scholar]
- 41.Tran TH, Krishnan S, Amiji MM. MicroRNA-223 Induced Repolarization of Peritoneal Macrophages Using CD44 Targeting Hyaluronic Acid Nanoparticles for Anti-Inflammatory Effects. PloS one. 2016;11(5):e0152024. doi: 10.1371/journal.pone.0152024. [DOI] [PMC free article] [PubMed] [Google Scholar]
- 42.Xu L, Kittrell S, Yeudall WA, Yang H. Folic acid-decorated polyamidoamine dendrimer mediates selective uptake and high expression of genes in head and neck cancer cells. Nanomedicine. 2016;11(22):2959–2973. doi: 10.2217/nnm-2016-0244. [DOI] [PMC free article] [PubMed] [Google Scholar]
- 43.Zhao B, Bie J, Wang J, Marqueen SA, Ghosh S. Identification of a novel intracellular cholesteryl ester hydrolase (carboxylesterase 3) in human macrophages: compensatory increase in its expression after carboxylesterase 1 silencing. Am J Physiol Cell Physiol. 2012;303(4):C427–35. doi: 10.1152/ajpcell.00103.2012. [DOI] [PMC free article] [PubMed] [Google Scholar]
- 44.Bie J, Wang J, Yuan Q, Kakiyama G, Ghosh SS, Ghosh S. Liver-specific transgenic expression of cholesteryl ester hydrolase reduces atherosclerosis in Ldlr−/− mice. J Lipid Res. 2014;55(4):729–738. doi: 10.1194/jlr.M046524. [DOI] [PMC free article] [PubMed] [Google Scholar]
- 45.Kim K, Kim JH, Park H, Kim YS, Park K, Nam H, Lee S, Park JH, Park RW, Kim IS. Tumor-homing multifunctional nanoparticles for cancer theragnosis: simultaneous diagnosis, drug delivery, and therapeutic monitoring. J Control Release. 2010;146(2):219–227. doi: 10.1016/j.jconrel.2010.04.004. [DOI] [PubMed] [Google Scholar]
- 46.Bi Y, Liu L, Lu Y, Sun T, Shen C, Chen X, Chen Q, An S, He X, Ruan C. T7 peptide-functionalized PEG-PLGA micelles loading with carmustine for targeting therapy of glioma. ACS Appl Mater Interfaces. 2016;8(41):27465–27473. doi: 10.1021/acsami.6b05572. [DOI] [PubMed] [Google Scholar]
- 47.Cruz LJ, Stammes MA, Que I, van Beek ER, Knol-Blankevoort VT, Snoeks TJ, Chan A, Kaijzel EL, Löwik CW. Effect of PLGA NP size on efficiency to target traumatic brain injury. J Control Release. 2016;223:31–41. doi: 10.1016/j.jconrel.2015.12.029. [DOI] [PubMed] [Google Scholar]
- 48.Zhao B, Song J, Chow WN, Clair RWS, Rudel LL, Ghosh S. Macrophage-specific transgenic expression of cholesteryl ester hydrolase significantly reduces atherosclerosis and lesion necrosis in Ldlr–/–mice. J Clin Invest. 2007;117(10):2983–2992. doi: 10.1172/JCI30485. [DOI] [PMC free article] [PubMed] [Google Scholar]
- 49.Bligh EG, Dyer WJ. A rapid method of total lipid extraction and purification. Can J Biochem Physiol. 1959;37(8):911–917. doi: 10.1139/o59-099. [DOI] [PubMed] [Google Scholar]
- 50.Jevprasesphant R, Penny J, Jalal R, Attwood D, McKeown N, D’emanuele A. The influence of surface modification on the cytotoxicity of PAMAM dendrimers. Int J Pharm. 2003;252(1):263–266. doi: 10.1016/s0378-5173(02)00623-3. [DOI] [PubMed] [Google Scholar]
- 51.Wang W, Xiong W, Wan J, Sun X, Xu H, Yang X. The decrease of PAMAM dendrimer-induced cytotoxicity by PEGylation via attenuation of oxidative stress. Nanotechnology. 2009;20(10):105103. doi: 10.1088/0957-4484/20/10/105103. [DOI] [PubMed] [Google Scholar]
- 52.Yang H, Lopina ST, DiPersio LP, Schmidt SP. Stealth dendrimers for drug delivery: correlation between PEGylation, cytocompatibility, and drug payload. J Mater Sci Mater Med. 2008;19(5):1991–1997. doi: 10.1007/s10856-007-3278-0. [DOI] [PubMed] [Google Scholar]
- 53.Kim SK, Park KM, Singha K, Kim J, Ahn Y, Kim K, Kim WJ. Galactosylated cucurbituril-inclusion polyplex for hepatocyte-targeted gene delivery. Chem Commun. 2010;46(5):692–694. doi: 10.1039/b920753h. [DOI] [PubMed] [Google Scholar]
- 54.Lakshminarayanan A, Reddy BU, Raghav N, Ravi VK, Kumar A, Maiti PK, Sood A, Jayaraman N, Das S. A galactose-functionalized dendritic siRNA-nanovector to potentiate hepatitis C inhibition in liver cells. Nanoscale. 2015;7(40):16921–16931. doi: 10.1039/c5nr02898a. [DOI] [PubMed] [Google Scholar]
- 55.Lai CH, Lin CY, Wu HT, Chan HS, Chuang YJ, Chen CT, Lin CC. Galactose encapsulated multifunctional nanoparticle for HepG2 cell internalization. Adv Funct Mater. 2010;20(22):3948–3958. [Google Scholar]
- 56.Zahr AS, Davis CA, Pishko MV. Macrophage uptake of core-shell nanoparticles surface modified with poly (ethylene glycol) Langmuir. 2006;22(19):8178–8185. doi: 10.1021/la060951b. [DOI] [PubMed] [Google Scholar]
- 57.Zhang Y, Kohler N, Zhang M. Surface modification of superparamagnetic magnetite nanoparticles and their intracellular uptake. Biomaterials. 2002;23(7):1553–1561. doi: 10.1016/s0142-9612(01)00267-8. [DOI] [PubMed] [Google Scholar]
- 58.Lipka J, Semmler-Behnke M, Sperling RA, Wenk A, Takenaka S, Schleh C, Kissel T, Parak WJ, Kreyling WG. Biodistribution of PEG-modified gold nanoparticles following intratracheal instillation and intravenous injection. Biomaterials. 2010;31(25):6574–6581. doi: 10.1016/j.biomaterials.2010.05.009. [DOI] [PubMed] [Google Scholar]
- 59.Pelaz B, del Pino P, Maffre P, Hartmann R, Gallego M, Rivera-Fernandez S, de la Fuente JM, Nienhaus GU, Parak WJ. Surface functionalization of nanoparticles with polyethylene glycol: effects on protein adsorption and cellular uptake. ACS nano. 2015;9(7):6996–7008. doi: 10.1021/acsnano.5b01326. [DOI] [PubMed] [Google Scholar]
- 60.Luong D, Kesharwani P, Deshmukh R, Amin MCIM, Gupta U, Greish K, Iyer AK. PEGylated PAMAM dendrimers: Enhancing efficacy and mitigating toxicity for effective anticancer drug and gene delivery. Acta Biomater. 2016;43:14–29. doi: 10.1016/j.actbio.2016.07.015. [DOI] [PubMed] [Google Scholar]
- 61.Shen W, van Dongen MA, Han Y, Yu M, Li Y, Liu G, Holl MMB, Qi R. The role of caveolin-1 and syndecan-4 in the internalization of PEGylated PAMAM dendrimer polyplexes into myoblast and hepatic cells. Eur J Pharm Biopharm. 2014;88(3):658–663. doi: 10.1016/j.ejpb.2014.07.010. [DOI] [PMC free article] [PubMed] [Google Scholar]
- 62.Liu L, He H, Zhang M, Zhang S, Zhang W, Liu J. Hyaluronic acid-decorated reconstituted high density lipoprotein targeting atherosclerotic lesions. Biomaterials. 2014;35(27):8002–8014. doi: 10.1016/j.biomaterials.2014.05.081. [DOI] [PubMed] [Google Scholar]
- 63.Sun T, Simmons R, Huo D, Pang B, Zhao X, Kim CW, Jo H, Xia Y. Targeted Delivery of Anti‐miR‐712 by VCAM1‐Binding Au Nanospheres for Atherosclerosis Therapy. ChemNanoMat. 2016;2(5):400–406. [Google Scholar]
- 64.Wolfram JA, Donahue JK. Gene therapy to treat cardiovascular disease. J Am Heart Assoc. 2013;2(4):e000119. doi: 10.1161/JAHA.113.000119. [DOI] [PMC free article] [PubMed] [Google Scholar]
- 65.Fredman G, Kamaly N, Spolitu S, Milton J, Ghorpade D, Chiasson R, Kuriakose G, Perretti M, Farokhzad O, Tabas I. Targeted nanoparticles containing the proresolving peptide Ac2-26 protect against advanced atherosclerosis in hypercholesterolemic mice. Sci Transl Med. 2015;7(275):275ra20. doi: 10.1126/scitranslmed.aaa1065. [DOI] [PMC free article] [PubMed] [Google Scholar]
- 66.Tuteja S, Rader DJ. High‐Density Lipoproteins in the Prevention of Cardiovascular Disease: Changing the Paradigm. Clin Pharmacol Ther. 2014;96(1):48–56. doi: 10.1038/clpt.2014.79. [DOI] [PubMed] [Google Scholar]