

Abstract
Oligodendrocytes and Schwann cells not only form myelin in the central and peripheral nervous system, but also provide metabolic and trophic support to the axons they ensheathe. Acetyl-CoA is potentially a key molecule in Schwann cells and oligodendrocytes because it is at the crossroads of cellular lipid biosynthesis and energy generation. The main route for acetyl-CoA production is the oxidation of pyruvate by the pyruvate dehydrogenase complex (PDC). PDC deficiency in humans results in neurodegeneration and developmental impairments in both white and gray matter structures. To address the importance of PDC in myelinating glia, we deleted Pdha1 gene specifically in oligodendrocytes and Schwann cells. Surprisingly, sciatic and optic nerve morphology and the motor performance of Pdha1f/Y ; CnpCre/+ mice are undistinguishable from those of controls at 1 month of age. In addition, myelin is stably maintained for at least 10 months. However, Pdha1f/Y ; CnpCre/+ mice showed reduced fiber density and signs of axonal degeneration in both sciatic and optic nerves from 6 months of age. In contrast, 10 month-old mice bearing a floxed Pdha1 gene with either P0-Cre (expressed only by Schwann cells) or NG2-CreER (expressed in oligodendrocyte precursor cells) do not show any sign of axonal pathology or alterations in myelin structure or thickness. This indicates that the axonopathy is specific to the Pdha1f/Y ; CnpCre/+ mice. Taken together, these results suggest that acetyl-CoA derived from pyruvate is not necessary for myelin maintenance and, thus, myelin-forming cells are not likely to contribute to the pathophysiology of PDC deficiency.
Keywords: Pyruvate Dehydrogenase complex deficiency, PDC, oligodendrocyte, Schwann cell, myelin
TOC Image

Introduction
Oligodendrocytes (OLs) and Schwann cells (SCs) are myelinating glial cells and insulate axons in central nervous system (CNS) and peripheral nervous system (PNS), respectively. However, their functions go beyond the electrical insulation and include, among others, mechanical protection and trophic support of axons (Monk et al., 2015; Nave, 2010). As a consequence, a great variety of myelin and axonal pathologies arises when myelinating cells are impaired, such as in multiple sclerosis (Lassmann, 2014), leukodystrophies and peripheral neuropathies (Berger et al., 2006; Nave, 2010). Nonetheless, the neuroprotective actions of SCs and OLs seem to be independent from the presence of myelin. Indeed, OLs and SCs are essential for neuronal survival and protection of axons (Beirowski et al., 2014; Funfschilling et al., 2012; Lee et al., 2012; Viader et al., 2011; Yin et al., 2016). Also, studies in the last decades have shown that myelin loss is not directly linked to axonal damage, since one can occur independently of the other in different animal models, such as Mbp mutant mice (shiverer) (Rosenbluth, 1980), Plp-null mice (Griffiths et al., 1998), Long-Evans Shaker rat (Smith et al., 2013) and Cnp-null mice (Lappe-Siefke et al., 2003).
Brain neurons require large amount of energy and consume up to 20% of the glucose in the blood and a similar amount of oxygen. The vast majority (estimated at 89%) of the energy is needed to produce action potentials and maintain synaptic communication (Attwell et al., 2001), processes that usually take place away from the neuronal cell body. Because most of molecules are synthesized in the neuronal soma, it is likely that some support to axons derives from adjacent cells (Hirrlinger et al., 2014; Nave, 2010). Thus, it has been proposed that one way myelinating glial cells protect neurons is to provide lactate and other metabolites to axons (Lee et al., 2012). However, this unforeseen role of myelinating glial cells is not completely understood. Moreover, it is not known if these cells developed unique metabolic adaptations to carry out this function.
Acetyl-CoA is potentially a key molecule in OLs and SCs because it is at the crossroads of lipid metabolism (serving as a substrate for lipid biosynthesis) and energetics (conveying the carbons from glucose to be oxidized in the tricarboxylic acid cycle). Pyruvate generated from glucose oxidation is converted to acetyl-CoA by the mitochondrial pyruvate dehydrogenase complex (PDC). Acetyl-CoA can then be mobilized to the tricarboxylic acid (TCA) cycle and follow oxidative steps that culminate with ATP production through the electron transport chain (Rich, 2003).
Interestingly, unlike in other tissues, a high proportion (~70%) of PDC in the brain is maintained in its dephosphorylated (active) form (Halim et al., 2010; Siess et al., 1971). Consistently, the human pathology associated with PDC deficiency is primarily manifested as neurological dysfunctions caused by neurodegeneration and developmental impairments in both white and gray matter structures. This phenotype is recapitulated in conditional knockout mice that express a Pdha1 gene floxed around exon 8 and Cre recombinase under control of adenovirus EIIa promoter (inducing mosaic recombination in many embryonic tissues before implantation) (Johnson et al., 2001; Pliss et al., 2013; Pliss et al., 2004) or Nes promoter (inducing recombination in both neuron and glial progenitors) (Johnson et al., 2001; Pliss et al., 2013; Pliss et al., 2004). Pdha1 is an X-linked gene that codes for the alpha (α) subunit of the first component of the pyruvate dehydrogenase complex (PDHα). PDH catalyses the rate-limiting step of the PDC. The integrity of Pdha1 exon 8 is fundamental for its function, since deletion reduces the activity of the PDC by 99% in embryonic stem cells (Johnson et al., 2001). However, the relative contributions of glia to the pathological findings in PDC deficiency are still not well characterized.
Thus, we deleted the Pdha1 gene in myelinating glial cells to understand the importance of PDC activity and acetyl-CoA production from pyruvate. We generated mice expressing a floxed Pdha1 gene in conjunction with Cre recombinase under the promoter of either Cnp (expressed in both OLs and SCs), P0 (expressed only by SCs) or NG2 (expressed in oligodendrocyte precursor cells). We report that myelinating glial cells are unlikely to be the main contributors in the pathology associated with pyruvate dehydrogenase complex deficiency.
Materials and Methods
Animal models
All experiments involving animals followed experimental protocols approved by the Roswell Park Cancer Institute and University at Buffalo. Pdha1 floxed, Mpz-Cre transgenic (P0-Cre), Cspg4-CreER transgenic (NG2-CreER) and Cnp knock-in (CnpCre/+) mice were described previously (Feltri et al. 1999; Johnson et al. 2001; Lappe-Siefke et al. 2003; Zhu et al. 2011), were maintained in the congenic C57BL6/NCrl background. Since Pdha1 is an X-linked gene, the gender of animals is also indicated in the genotypes (Pdha1f/f for females and Pdha1f/Y for males). Both males and females were included in the study and only littermates were compared. However, as Mendelian distribution of females carrying Pdha1f/f ; CnpCre/+ alleles was altered (Supplementary Table 1), all analyses were carried out separated by gender. No animals were excluded from the study. Animals were housed in cages of at most 5 animals in 12 h light/dark cycles. The majority of the experiments were conducted with 3 animals per age and per genotype. For NG2-CreER mice, five 10 μl injection of oil or tamoxifen 5 mg ml−1 were performed from postnatal day 2 every 12 h.
Morphological assessments
Mutant and control littermates were euthanized at the indicated ages, and sciatic nerves, spinal cord and optic nerves were dissected. Nerves were prepared as in (Quattrini et al., 1996). Briefly, tissues were fixed in 2 % buffered glutaraldehyde and post fixed in 1 % osmium tetroxide. After alcohol dehydration, the samples were embedded in Epon. Transverse sections (0.5 – 1 nm thick) were stained with toluidine blue and examined by light microscopy. Ultrathin sections were stained with uranile acetate and lead citrate and examined by electron microscopy. For G-ratio analysis of sciatic nerves (axon diameter/fiber diameter), 4 images per semithin section were acquired at the 100× objective. Axon and fiber diameters were quantified using the Leica QWin software (Leica Microsystem). For G-ratio analysis of the optic nerve, the myelin thickness and axon diameter of at least 50 fibers per animal were quantified in electron micrographs using ImageJ (imagej.nih.gov/ij). Myelinated fibers were also quantified using ImageJ (imagej.nih.gov/ij). Data were analyzed using GraphPad Prism 6.01. Images were blindly evaluated during analysis.
Polymerase chain reaction
Genotyping of mutant mice was performed by PCR on tail genomic DNA, as described previously (Feltri et al., 1999; Johnson et al., 2001; Lappe-Siefke et al., 2003; Zhu et al., 2011). Region surrounding exons 7 and 8 of Pdha1 alleles were amplified with primers Pdha1S1 5′ AGCAGCCAGCACGGACTACT 3′ and Pdha1AS2 5′ GCAGCCAAACAGATTACACC 3′. The sizes of amplification products using these primers were 700 bp for wt allele, 800 bp for floxed allele and 400 bp for recombined allele.
Behavioural analyses
Rotarod analyses was performed as described (Poitelon et al., 2012). Control and mutant littermates were tested in two sessions of three trials each per day (6 h rest between the two daily sessions) for 2 consecutive days. For grid walking analysis, hindpaw placement errors (faults) were determined as a proportion of total hindpaw steps on horizontal grid mesh with openings of 1.2 × 1.2 cm. Errors were defined as passage of the hindpaw through an opening in the grid. Littermate animals were tested in six trials of 5 min each, with the first three trials considered as training period.
Electrophysiological analyses
Animals were analyzed at 30 days of age. Mice were anesthetized with tribromoethanol, 0.4 mg g−1 of body weight, and placed under a heating lamp to avoid hypothermia. Sciatic nerve motor conduction velocity and amplitude were obtained with subdermal steel monopolar needle electrodes: a pair of stimulating electrodes was inserted subcutaneously near the nerve at the ankle, then at the sciatic notch, and finally at the paraspinal region at the level of the iliac crest to obtain three distinct sites of stimulation, proximal and distal, along the nerve. Compound motor action potentials were recorded with an active electrode inserted in muscles in the middle of the paw and a reference needle in the skin between the first and second digits. Electrophysiological studies comprising motor and sensory nerve conduction studies were conducted using a Medelec Synergy electromyography device.
Immunohistochemistry
Primary Schwann cells were prepared and maintained as described (Feltri et al., 1992). For Mitotracker staining, Schwann cells were incubated for 45 min with 0.2 μM of MitoTrackerTM (Invitrogen, M7512) then washed with PBS. For immunostaining, Schwann cells and sciatic nerve cross sections were fixed in 10 min in PFA 4 %, washed in PBS, blocked for 1 h in 10 % fetal calf serum, 2 % BSA, 0.1 % Triton X-100 in 1 X PBS and incubated overnight with the following antibodies: anti-PDH 1/400 (Pliss et al., 2004) and Biolegend anti-NFH 1/500 (822701). Specimens were then incubated for 1 h with Jackson DyLight 488 or 549-conjugated 1/1,000 secondary antibodies, stained with DAPI and mounted with Vectashield (Vector Laboratories). Images were acquired with a confocal microscope Leica SP5II. Maximum intensity projection was created with Fiji (fiji.sc).
Western Blot
Spinal cord and sciatic nerves were dissected and the epineurium was removed from sciatic nerves. Tissues were frozen in liquid nitrogen, pulverized, resuspended in lysis buffer and processed by SDS-PAGE as described (Poitelon et al., 2015). Blots were then blocked with 5 % BSA in 1 X PBS, 0.05 % Tween-20 and incubated overnight with the appropriate antibody: anti-PDH 1/1000 (Pliss et al., 2004), and Sigma anti-Calnexin 1/3000 (C4731). Membranes were then rinsed in 1 X PBS and incubated for 1 h with secondary antibodies. Blots were developed using Odyssey CLx infrared imaging system (Li-Cor). Western blots were quantified using Image J software (imagej.nih.gov/ij). Each experiment was performed at least two times. All uncropped blots are presented in Supplementary Figure 6.
Metabolic measurements
Sciatic nerves were sampled, removed from the epineurium, frozen in liquid nitrogen and pulverized. Lactate and ATP/ADP measurements were performed immediately after. ATP and ADP were quantified with ATP/ADP ratio assay kit (bioluminescent) (Abcam, ab 65313), according to manufacturer’s recommendations. Lactate was quantified with Lactate assay kit (Sigma, MAK064), according to manufacturer’s recommendations.
Statistical analyses
Experiments were not randomized, but data collection and analysis were performed blind to the conditions of the experiments. Data excluded are reported in the legend of the figures. Data are presented as mean ± s.e.m or s.d. Two-tailed Student t-test, One-way ANOVA and Two-way ANOVA were used for statistical analysis of the differences between multiple groups according to the number of sample groups. Values of P ≤ 0.05 were considered to represent a significant difference.
Data availability
The authors declare that the data supporting the findings of this study are available within the article and its supplementary information files. All original data are available from the corresponding author upon request.
Results
Pdha1f/Y ; CnpCre/+ do not present myelin defects at 1 month
Pyruvate dehydrogenase complex (PDC) is a mitochondrial enzymatic complex and the primary link between glycolysis and the TCA cycle. Accordingly, PDC is localized in SCs’ mitochondria (Fig. 1a, b). Animals haploinsufficient for Pdha1 present hypotrophic gray and white matter structures similarly to patients affected by PDC deficiency (Pliss et al., 2013). As myelin represents half of the white matter volume, we hypothesized that impairment in myelin formation and maintenance could contribute to the pathology. To determine the role of PDC in myelinating glia, we developed a conditional knock-out mouse model expressing Pdha1 floxed allele in conjunction with a Cre recombinase under the promoter of Cnp (CnpCre/+). Cnp is expressed in differentiating myelinating glia, as early as E13 in spinal cord and E14.5 in sciatic nerve, and is maintained at high levels during myelin synthesis, thus allowing the recombination of Pdha1 both in OLs and SCs (Genoud et al., 2002; Grigoryan et al., 2013; Lappe-Siefke et al., 2003; Reynolds et al., 1988). PCR analyses of Pdha1 showed that CnpCre/+ recombined the Pdha1 floxed allele in white matter structures of the nervous system (Fig. 1c, d). Yet, the reduction of PDHα, encoded by Pdha1, could only be observed at the protein level in sciatic nerves, probably because their cellular composition is enriched in myelinating glial cells as opposed to spinal cord samples (Fig. 1e). Another potential explanation is that residual PDH protein may still present in OLs at 30 days of age, as it has been suggested for other mitochondrial proteins in OLs (Funfschilling et al., 2012). We also observed a reduction of the beta subunit of PDH, encoded by Pdhb (Fig. 1e). The reduced level of PDHβ is due the mutual stabilizing interaction between PDHα and PDHβ (Johnson et al., 2001).
Figure 1.

Pdha1 recombination in glial cells. (a–b) Pyruvate dehydrogenase (PDH) localizes in Schwann cells mitochondria. PDH (yellow) was costained with (a) Phalloidin or (b) Mitotracker (cyan) and Dapi (magenta). PDH is detected solely in mitochondria. Bar 5 μm. (c) Schematic representation of the region surrounding exon 7 and 8 of Pdha1 gene. The red triangles represent loxP sites. The location of primers, forward (fw) and reverse (rv) and the expected size for each allele are indicated. (d–e) PCR amplifications (d) and Western blot (e) analysis of PDH E1α following recombination with CnpCre/+ in sciatic nerve, spinal cord and optic nerve at 1 month. Size of amplification products show that recombination occurs in all glial structures but reduction of PDH E1α protein level is visible only in sciatic nerve (−37 %). Note that PDHβ, encoded by Pdhb, protein level is also reduced. n = 3 mice per genotype, two-tailed unpaired Student’s t test t = 2.712 df = 4, P = 0.05. Error bars indicate s.e.m.
At 1 month, no sign of developmental defects is present in optic nerves (ONs) of the Pdha1f/Y ; CnpCre/+ animals. The myelin thickness (G-ratio = axon diameter/fiber diameter) is comparable to their littermate controls (Fig. 2a–b), as is the density of myelinated fibers (Fig. 2c). Similarly, ablation of Pdha1 in SCs did not affect myelination in sciatic nerves (SNs), and Pdha1f/Y ; CnpCre/+ mice showed no visible morphological alteration (Fig. 2d), normal g-ratio (Fig. 2e) and no alteration in the quantity of myelinated fibers per nerve (Fig. 2f). Finally, motor performance of 1 month-old Pdha1f/Y ; CnpCre/+ and control animals was similar (Fig. 2g, Supplementary Fig. 1 and 2). Therefore, myelination appears to be normal in Pdha1f/Y ; CnpCre/+ mice.
Figure 2.

Pdha1f/Y ; CnpCre/+ mice present normal myelin at 1 month in both CNS and PNS. (a) Electron microscopy comparing optic nerve cross sections from control and Pdha1f/Y ; CnpCre/+ mice. n = 3 animals per genotype. Bar 1 μm (b) Average G-ratio from optic nerves of control and Pdha1f/Y ; CnpCre/+ animals. n = 3 animals per genotype. (c) The number of myelinated axons at 1 month is comparable between genotypes. n = 3 animals per genotype. (d) Semithin cross-sections of sciatic nerves stained with toluidine blue from control and Pdha1f/Y ; CnpCre/+ at 1 month. Bar 20 μm. (e) Ablation of Pdha1 does not impact the average G-ratio. n = 3 animals per genotype. (f) The total number of myelinated axons in sciatic nerves of conditional null animals is comparable with that of the control littermates. n = 3 mice per genotype. (g) Rotarod analysis of motor function in control and Pdha1f/Y ; CnpCre/+ does not show any significant difference. n = 4 male controls, 8 males CnpCre/+.
Expression of Pdha1 in OLs is dispensable for the long-term maintenance of CNS myelination
Considering that myelin is not affected by Pdha1 conditional knock-out in 1-month old animals, we then sought to answer whether myelin structure is maintained long-term. Myelin structure in optic nerves was comparable between Pdha1f/f ; CnpCre/+ animals and controls at 10 months (Fig. 3b–d). However, Pdha1f/f ; CnpCre/+ mice showed a reduction in the general size of the optic nerve (Fig. 3a). In addition, Pdha1f/f ; CnpCre/+ animals presented a significant reduction of the number of myelinated fibers in ONs, and morphological signs of axonal degeneration (Fig. 3b–c, e). We asked if metabolic changes could explain the difference in phenotypes seen between 1 and 10 months old mice. However, in optic nerves of Pdha1f/f ; CnpCre/+ animals, lactate levels remained similar to those of controls at 1 month (1399 ± 208 nmol g−1 in controls and 1532 ± 278 nmol g−1 in Pdha1f/f ; CnpCre/+) and at 10 months (524 ± 150 nmol g−1 in controls and 657 ± 140 nmol g−1 in Pdha1f/f ; CnpCre/+). This could be explained by a rapid local metabolization of lactate in the CNS (Funfschilling et al., 2012).
Figure 3.

Axon pathology is present in optic nerves of Pdha1f/Y ; CnpCre/+ animals, but not in Pdha1f/Y ; NG2-CreER mice. (a–b) Semithin cross-sections of optic nerves from control, Pdha1f/Y ; CnpCre/+ and Pdha1f/Y ; NG2-CreER at 10 months stained with toluidine blue. n = 3 optic nerve per genotype. The surface area of optic nerve is significantly smaller in Pdha1f/Y ; CnpCre/+ as compared to control. Two-tailed unpaired Student’s t test, P = 0.0023, t = 6.901, df = 4. Bar 100 μm (a) and 20μm (b). (c) Electron micrograph cross-sections of optic nerves from control, Pdha1f/Y ; CnpCre/+ and Pdha1f/Y ; NG2-CreER at 10 months. Myelinated fiber density is reduced in Pdha1f/Y ; CnpCre/+ nerves. In addition, there is the presence of axon degeneration (upper-right inset). In contrast, the morphology of Pdha1f/Y ; NG2-CreER is similar to control optic nerves. Bar 2 μm. (d) G-ratio analysis does not show any difference between groups in the average g-ratio. n = mice (3 males of each genotype). (e) Number of myelinated axons at 10 months in control, Pdha1f/Y ; CnpCre/+ and Pdha1f/Y ; NG2-CreER show loss of fibers in Pdha1f/Y ; CnpCre/+, but not in Pdha1f/Y ; NG2-CreER optic nerves. n = optic nerves (4 males control, 4 Pdha1f/Y ; CnpCre/+ and 3 Pdha1f/Y ; NG2-CreER). One way ANOVA with Bonferroni post hoc test. F (2, 8) = 9.638, P = 0.007, CnpCre/+ P = 0.0098. Error bars indicate s.e.m. ** P < 0.01.
In addition to our CnpCre/+ model targeting all myelinating glia cells, we also generated Pdha1f/f ; NG2-CreER mice, which allow postnatal recombination of Pdha1 specifically in OL precursor cells upon tamoxifen injection (Zhu et al., 2011). As demonstrated by PCR, recombination was generated in the desired tissue (Fig. 4a), resulting in a marked reduction of Pdha1 mRNA levels in optic nerves of NG2-CreER mice (Fig. 4b). Similarly to CnpCre/+, myelin structure in optic nerves was comparable between NG2-CreER animals and controls at 10 months (Fig. 3a–d). Yet, in contrast to CnpCre/+, the size of the optic nerve and number of myelinated axon remained normal in Pdha1f/f ; NG2-CreER mice (Fig. 3a–c,e).
Figure 4.

NG2-CreER and CnpCre/+ recombine Pdha1f/Y in optic nerves with equal efficiency. (a) PCR amplifications of Pdha1 genomic DNA following recombination with NG2-CreER in optic nerve at 1 month. Amplification products show that recombination occurs in optic nerve upon injection with tamoxifen. (See Fig. 1 c for schematic of PCR products) (b) Real time PCR amplifications show reduced levels of Pdha1 mRNA in optic nerves of conditional null animals compared to littermate controls. n = 3 independent reverse transcription reactions of a pool of 2 optic nerve samples per genotype. Two-tailed unpaired Student’s t test CnpCre/+, t = 5.388 df = 4, P = 0.0057, NG2-CreER, t = 16.65 df = 4, P < 0.0001. Error bars indicate s.d. ** P < 0.01, **** P < 0.0001.
These results indicate that acetyl-CoA production from pyruvate is not required for long-term myelin maintenance by OLs. On the other hand, axonal survival is impaired specifically in Pdha1f/Y ; CnpCre/+ mice as indicated by the presence of degenerating axons (Fig. 3c). Since Pdha1 expression in ONs was similarly diminished using either NG2-CreER or CnpCre/+ (Fig. 4b), the axonopathy in Pdha1 floxed ; CnpCre/+ mice might not be a simple consequence of the Pdha1 knock-out in OLs.
Acetyl-CoA production by PDC in SCs is not necessary for preservation of myelin in the PNS
To further investigate the role of PDC specifically in SCs, we then analysed the PNS phenotype of Pdha1f/Y ; CnpCre/+ animals at 10 months. Morphological analyses of Pdha1f/Y ; CnpCre/+ mice revealed a severe reduction (~ 40 %) of the number of myelinated fibers in the SN (Fig. 5a–c) and hypomyelination (Fig. 5d, e), causing an impairment of compound muscle action potentials, nerve conduction velocity and resulting in motor deficits (Fig. 5f–i, Supplementary Figs. 1 and 2, Supplementary Movie 1). Pdha1f/Y ; CnpCre/+ animals also presented axonal swelling, which could be the cause of the increase in the G-ratio (axon diameter/fiber diameter) (Fig. 5d, e). Nonetheless, myelin remained organized and compacted even in large diameter axons, and Remak bundle organization was not affected (Supplementary Fig. 3). The phenotype observed in Pdha1f/Y ; CnpCre/+ appeared to be progressive. No defects were found at 1 month (Fig. 2d–f, Supplementary Figs. 1 and 2) but impairments were present in 6 month-old animals (Supplementary Figs. 1, 2 and 4) and worsened at 10 months (Fig. 5, Supplementary Figs. 1, 2).
Figure 5.

Ablation of Pdha1 exclusively in Schwann cells does not affect myelination or axonal survival. (a–b) Semithin cross-sections of sciatic nerves from control, Pdha1f/Y ; CnpCre/+ and Pdha1f/Y ; P0-Cre at 10 months stained with toluidine blue. Myelinated fiber density and nerve size are reduced in Pdha1f/Y ; CnpCre/+. Semithin sections were cut 1 mm distally to the sciatic notch. n = 3 animals per genotype. Bar 20 μm (a) and 100μm (b). (c) Number of myelinated axons from control, Pdha1f/Y ; CnpCre/+ and Pdha1f/Y ; P0-Cre in sciatic nerves at 10 months. Pdha1f/Y ; CnpCre/+, but not in Pdha1f/Y ; P0-Cre, showed a loss of axons. n = mice (4 males control, 3 males Pdha1f/Y ; CnpCre/+ and 3 males Pdha1f/Y ; P0-Cre), One way ANOVA with Bonferroni post hoc test. F (2, 17) = 41.67, P = 0.0001, CnpCre/+ P = 0.0001. (d–e) G-ratio from control, Pdha1f/Y ; CnpCre/+ and Pdha1f/Y ; P0-Cre at 10 months. (d) G-ratio as a function of axon diameter. Axon diameter is increased in Pdha1f/Y ; CnpCre/+, associated with thinning of myelin. n = 3 animals per genotype (note the presence of axons larger than 9 μm exclusively in SNs of Pdha1f/Y ; CnpCre/+ mice). (e) Average G-ratio. One way ANOVA with Bonferroni post hoc test. F (2, 6) = 8.443, P = 0.018, CnpCre/+ P = 0.0106. (f) Motor functions are impaired in 10 month-old Pdha1f/Y ; CnpCre/+ mice, but not in Pdha1f/Y ; P0-Cre mice. n = mice (9 males control, 3 males CnpCre/+, 7 males P0-Cre), Two way repeated measures ANOVA with Bonferroni post hoc test. F (2, 16) = 66.17, P < 0.0001, Trial 1 P < 0.0001, Trial 2 P < 0.0001, Trial 3 P < 0.0001, Trial 4 P < 0.0001. (g–i) Electrophysiological analysis of control, Pdha1f/Y ; CnpCre/+ and Pdha1f/Y ; P0-Cre mice at 10 months revealed decreased amplitude of compound muscle action potentials (g–h) and reduced nerve conduction velocities (i) in Pdha1f/Y ; CnpCre/+, suggesting axonal pathology and thinner myelin. n = sciatic nerves (7 for control mice, 5 for Pdha1f/Y ; CnpCre/+ and 8 for Pdha1f/Y ; P0-Cre), One way ANOVA with Bonferroni post hoc test. Velocity F (2, 17) = 46.62, P < 0.0001, CnpCre/+ P < 0.0001. Amplitude F (2, 17) = 13.3, P = 0.0003, CnpCre/+ P = 0.0011. Error bars indicate s.e.m. ** P < 0.01, *** P < 0.001, **** P < 0.0001.
We also generated Pdha1f/f ; P0-Cre mice, which expressed Cre recombinase under the promoter of Mpz (P0-Cre), inducing recombination solely in SCs starting at E13.5 (Feltri et al., 1999). As demonstrated by immunofluorescence and western blot, Pdha1 is efficiently knocked out in SCs of Pdha1f/Y; P0-Cre mice (Fig. 6a, b). We then analysed the PNS phenotype of Pdha1f/Y; P0-Cre animals at 10 months, but we did not find any morphological, behavioural or functional alteration (Fig. 5).
Figure 6.

PDH is reduced in sciatic nerves of females in both Pdha1f/f ; CnpCre/+ and Pdha1f/f ; P0-Cre animals. (a) Western blot analysis of PDHα following recombination with CnpCre/+ and P0-Cre in sciatic nerves at 10 months. PDHα protein level is decreased in both mutants. Note that PDHβ, encoded by Pdhb, protein level is also reduced. n = mice (4 females control, 2 females Pdha1f/f ; CnpCre/+ and 2 females Pdha1f/f ; P0-Cre), One way ANOVA with Bonferroni post hoc test. F (2, 5) = 6.706, P = 0.0384. CnpCre/+ P = 0.0488, P0-Cre P = 0.0791. (b) Immunolocalization of PDH on cross sections of Pdha1f/f ; P0-Cre sciatic nerves at 10 months. PDH (yellow) was costained with Neurofilament (magenta). PDH is absent in Schwann cells of Pdha1f/f ; P0-Cre animals. Bar 25 μm. Error bars indicate s.e.m. * P < 0.05.
We postulated that axonal degeneration in Pdha1f/Y ; CnpCre/+ could be the result of an alteration of Schwann cell lipid metabolism leading to a toxic accumulation of acylcarnitines (Viader et al., 2013). We analysed the phosphorylation level of acetyl-CoA carboxylase, which controls fatty acid synthesis by catalysing acetyl-CoA carboxylation. However, we did not find any difference between control and Pdha1f/Y ; CnpCre/+ mice (Supplementary Fig. 5).
We next investigated the possibility that the axon phenotype in the Pdha1f/Y ; CnpCre/+ mice could result from damage to the neuronal cell body of neurons in the spinal cord. We analysed cross sections of both control, Pdha1f/Y ; CnpCre/+ and Pdha1f/Y; NG2-CreER in adult mice and did not identify any gross morphological or quantitative difference in motor neurons of the ventral horn of spinal cord (Fig. 7). In addition, the myelin structure is also similar between the conditional null animals and controls (Fig. 7c).
Figure 7.
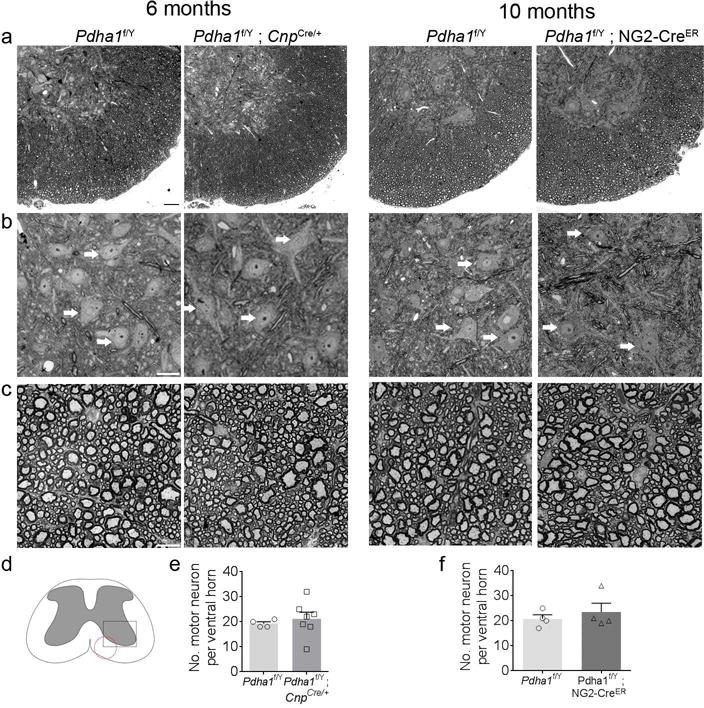
Grey and white matter integrity are preserved in Pdha1f/Y ; CnpCre/+ and Pdha1f/Y ; NG2-CreER spinal cords. (a–c) Semithin cross-sections of spinal cord (vertebrae L1) from control, Pdha1f/Y ; CnpCre/+ at 6 months and vertebrae L3 from control, Pdha1f/Y ; NG2-CreER at 10 months stained with toluidine blue. (b) Motor neurons from the ventral horn. Three motor neurons per image have been indicated with arrows. (c) Density of myelinated fibers in spinal cord white matter is maintained. n = 3 animals per genotype. Bar 100 μm (a) and 10 μm (b, c) (d) Schematic representation of the spinal cord. The square marks the ventral horn area where motor neurons where quantified. The circle indicates the area where myelinated fiber images were acquired. (e) Quantification of motor neurons in ventral horn of spinal cord stained with toluidine blue. Motor neurons were identified by their location in the ventral horn, presence of primary dendrites, and large soma size. Number of motor neurons per section was similar between control and Pdha1f/Y ; CnpCre/+ littermates. n = spinal cord ventral horn (4 control and 7 Pdha1f/Y ; CnpCre/+). Error bars indicate s.e.m. (f) Number of motor neurons in the ventral horn of spinal cords is also comparable between control and Pdha1f/Y ; NG2-CreER littermates. n = spinal cord ventral horn (4 control and 4 Pdha1f/Y ; NG2-CreER). Error bars indicate s.e.m.
We then asked whether there was any difference in the energetic adaptations triggered in these two animal models that could explain the phenotypic differences. Metabolic measurements showed that ablation of Pdha1 with either CnpCre/+ or P0-Cre led to similar increased lactate levels and diminished ATP/ADP ratio in sciatic nerves at 10 months (Table 1).
Table 1.
Metabolic alterations in Pdha1f/Y ; CnpCre/+ and Pdha1f/Y ; P0-Cre sciatic nerves. A decrease of the ATP/ADP ratio and an increase of lactate levels can be observed at 10 months in both mutants, as compared to control mice. The alteration of ATP/ADP ratio can be observed as early as 1 month in Pdha1f/Y ; CnpCre/+, but the difference is not statistically significant. n = mice (ATP 1 month: 3 males control and 2 males Pdha1f/Y ; CnpCre/+, lactate 1 month : 3 males control and 5 males Pdha1f/Y ; CnpCre/+, ATP and lactate 10 months : 8 males controls, 4 males Pdha1f/Y ; CnpCre/+ and 4 males Pdha1f/Y ; P0-Cre), two-tailed unpaired Student’s t test. ATP/ADP CnpCre/+ 1 month t = 1.953, df = 3, ATP/ADP CnpCre/+ 10 months t = 2.791, df = 6, ATP/ADP P0-Cre 10 months t = 2.514, df = 6, lactate CnpCre/+ 10 months t=4.523 df=6, lactate P0-Cre 10 months t=2.64 df=6. One outlier data point from lactate 1 month CnpCre/+ was excluded. The results are presented as means ± s.e.m.
| Age | Genotype | ATPa | ATP/ADP ratio | P | Lactateb | P |
|---|---|---|---|---|---|---|
| 1 month | Pdha1f/Y | 3.945 ± 0.87 | 0.92 ± 0.15 | 930 ± 145 | ||
| Pdha1f/Y ; CnpCre/+ | 1.533 ± 0.16 | 0.53 ± 0.008 | 0.14 | 942 ± 175 | ||
|
| ||||||
| 10 months | Pdha1f/Y | 4.149 ± 0.43 | 7.79 ± 0.34 | 1171 ± 86 | ||
| Pdha1f/Y ; CnpCre/+ | 3.187 ± 0.69 | 4.64 ± 0.63 | 0.009 | 1920 ± 72 | 0.004 | |
| Pdha1f/Y ; P0-Cre | 3.022 ± 0.41 | 6.85 ± 0.40 | 0.05 | 1690 ± 178 | 0.03 | |
expressed as arbitrary units.
expressed as nmol g−1 of tissue.
Taken together, these data indicate that, even though ablation of Pdha1 does alter SCs metabolism (reducing available ATP and increasing the conversion of pyruvate to lactate) in both conditional null animals, this is not enough to cause impairment of myelin wrapping or myelin stability. However, it is possible that these metabolic imbalances in SCs caused non-autonomous effects on axons only in the CnpCre/+ ; Pdha1 floxed mice.
Discussion
Acetyl-CoA is a key metabolic product of major catabolic pathways including the oxidation of pyruvate and β-oxidation of fatty acids. In catabolic normoxic conditions, acetyl-CoA is generated in the mitochondrial matrix where it is essential to fuel oxidative metabolism (for review see (Pietrocola et al., 2015)). Here we show for the first time that the production of acetyl-CoA from pyruvate is not required for myelin maintenance in vivo. Pdha1 deletion results in a deficiency of pyruvate dehydrogenase complex, the sole enzyme allowing the conversion of pyruvate to acetyl-CoA (Johnson et al., 2001). As a consequence, we observed a significant reduction of ATP/ADP ratio (~ 30 %) followed by an increase of lactate level (~ 50 %) in peripheral nerves of animals ablated for Pdha1 in SCs. Nonetheless, these metabolic alterations did not affect the capacity of SCs to produce and maintain myelin. Since integrity of both peripheral and central nervous system structures were preserved in Pdha1f/Y ; P0-Cre and Pdha1f/Y ; NG2-CreER animals, it is likely that alterations of the white matter structures observed in Pdha1 haploinsufficient animals and PDC-deficient patients are not primary defects of myelinating glial cells.
We expected that ablation of PDC in myelinating cells, presumably reducing the pool of available acetyl-CoA, would drastically affect the functions and survival of OLs and SCs. Acetyl-CoA is a central molecule of metabolism, representing the starting point of the TCA cycle and being a key precursor for fatty acids. Moreover, acetyl-CoA is also required for cholesterol synthesis, which is indispensable for the production of myelin membranes (Saher et al., 2005; Saher et al., 2009). In addition, acetyl-CoA is necessary for protein acetylation and other post translational modifications, i.e. O-GlcNAcylation through the hexosamine biosynthetic pathway (Kim et al., 2016), which are critical for myelin maintenance. Nonetheless, ablating PDC in both OLs and SCs, surprisingly had no detectable effect on their myelin synthesis function.
Our understanding of the metabolic interactions between neurons and myelinating glial cells is still in its infancy. Yet a clearer picture started to emerge in the last decade and we now have evidence that the metabolism of myelinating cells and neurons is coupled. Glucose is readily taken up by OLs and SCs and is metabolized primarily through aerobic glycolysis or the pentose phosphate pathway as opposed to full oxidation in the TCA cycle (Amaral et al., 2016; Pooya et al., 2014). Enwrapping glial cells are maintained in a Warburg-like state, partially oxidizing their substrates to generate enough energy for their housekeeping functions, while suppling axons with the remaining energy-rich metabolites (i.e.: pyruvate or lactate) through monocarboxylate transporters (Funfschilling et al., 2012; Lee et al., 2012; Volkenhoff et al., 2015) and utilizing cytosolic acetyl-CoA to promote lipid synthesis for myelin production. In this sense, our results corroborate the hypothesis that both OLs and SCs are mainly glycolytic, and impairing the production of acetyl-CoA from pyruvate does not affect myelin maintenance or cell survival.
On the other hand, there is evidence that oxidative metabolism is stimulated during late stages of differentiation and active myelination in SCs, possibly to promote generation of citrate, which is then exported from mitochondria to serve as carbon source for lipid synthesis (Pooya et al., 2014). Moreover, previous observations indicate that aerobic glycolysis can suffice for the basic functions of OLs but not SCs (Funfschilling et al., 2012). We showed that in animals ablated for PDC in SCs, lactate levels are increased and ATP/ADP ratio is reduced in sciatic nerves. Previous data have shown that lactate is efficiently metabolized by myelinated axons (Funfschilling et al., 2012); thus, it is unlikely that lactate would accumulate in axons without being metabolized. Therefore, the lactate accumulation and ATP/ADP ratio reduction are probably reflective of the metabolic changes in SCs. This supports the hypothesis that, in adult animals, SCs use aerobic respiration and ablation of PDC induces a metabolic shift towards a more glycolytic phenotype. Thus, while mitochondrial function and aerobic respiration are necessary for SC development and myelination (Funfschilling et al., 2012; Viader et al., 2011), our results indicate that pyruvate-derived acetyl-CoA is dispensable for timely and adequate myelin formation and myelin maintenance in SCs. It remains unclear if myelinating glia metabolism is robust enough to cope with a reduction of acetyl-CoA levels or if they are able to compensate for PDC absence by generating acetyl-CoA from sources other than pyruvate.
In addition to glucose, OLs can efficiently uptake and metabolize acetate (Amaral et al., 2016; Marin-Valencia et al., 2012) and ketone bodies (Edmond et al., 1987), which might be particularly important during early postnatal development, since milk is the main nutrient source (Patel et al., 1977). Additionally, catabolism of several amino acids can generate acetyl-CoA without passing through the PDC reaction in the mitochondria. Another well-studied example is N-Acetylaspartate (NAA), a metabolite produced exclusively by neurons that reaches astonishing concentrations (up to 10 mM) in the CNS and has been proposed to be transferred to OLs to further support myelination. NAA can be taken up by OLs and be hydrolysed by aspartoacylase to generate acetate (Moffett et al., 2011), which is then used to synthesize fatty acids that are incorporated into myelin (Moffett et al., 2007). However, the individual contributions of these different substrates to OLs and SCs metabolism in vivo remains to be defined.
Myelinating cells support axons through trophic substances and metabolites (e.g. lactate, pyruvate). Thus, axon damage can be caused when this axon-glial interaction is perturbed, for example by loss of cell contact due to demyelination or by glial impairments that lead to release of toxic substances (e.g. acylcarnitines). We showed that Pdha1 floxed animals expressing CnpCre/+ recombinase exhibit axonal degeneration in sciatic and optic nerves, while P0-Cre and NG2-CreER animals do not present axon pathologies. This could be a consequence of haploinsufficiency for Cnp in animals expressing CnpCre/+, since the Cre recombinase is knocked-in in one of the Cnp alleles (Lappe-Siefke et al., 2003). The molecular function of CNP in myelinating glia is still unknown, but CNP was identified in the mitochondrial fraction, might play a role in mitochondrial permeability (Azarashvili et al., 2014; McFerran et al., 1997), and can have a neuroprotective function in OLs (Verrier et al., 2013). Interestingly, mice deficient or haplodeficient for Cnp developed axonal swelling and neurodegeneration in the nervous system at 3.5 months and 19 months, respectively (Hagemeyer et al., 2012; Lappe-Siefke et al., 2003), two features also observed in Pdha1f/Y ; CnpCre/+ axonopathy. Thus, it is possible that in a genetic context that predisposes to axonal loss, metabolic alterations caused by PDC ablation lead to production of compounds that are detrimental for axonal maintenance. For example, acidification of glial cells, which can be caused by accumulation of lactate, has already been linked to neuronal death through excitotoxicity (Beppu et al., 2014). In addition, CNP loss of function can be an important disease modifier in PDC deficiency. A role for CNP in the establishment of the first OL-axon contact as well as the organization of cytoplasmic channels in myelin has also been proposed (Edgar et al., 2009; Snaidero et al., 2017). As a consequence, metabolic coupling between axons and myelin forming glia could be perturbed in CNP haploinsufficient animals. Therefore, the axonopathy of Pdha1f/Y ; CnpCre/+ mice could be due to decreased production of metabolites from TCA products associated to impaired capacity of OLs and SCs to transport these metabolites to axons.
An alternative explanation for the axonopathy would be that Cnp expression is not exclusive to myelinating glial cells. Indeed, it has been shown that Cnp is expressed prenatally by motor neurons and by retinal ganglion cells of lower vertebrates (Ballestero et al., 1999; Genoud et al., 2002; Heath et al., 1986), and radial glial cells and other progenitors can transiently express Cnp at low levels (Tognatta et al., 2017). Overall, the use of CnpCre/+ animals to study long-term metabolism of myelinating glial cells should be carefully considered.
In conclusion, efficient Schwann cell-specific and oligodendrocyte-specific ablation of PDC has no detectable effect on the development and maintenance of myelin. Thus, OLs are likely to be a minor contributor in the pathophysiology of PDC deficiency. Our findings corroborate the growing body of evidence suggesting the metabolism of myelinating glial cells is highly adaptable, but primarily relies on aerobic glycolysis. It is now essential to better characterize the metabolic adaptations that allow the massive and rapid membrane expansion during myelinogenesis and the long-term support of the highly energy-demanding axons. Deciphering some points of this interaction could reveal new physiological targets for drug development and lead to advances in medical methodologies aiming to restore nerve function or prevent the axon damage in many demyelinating and neurodegenerative diseases.
Supplementary Material
Main Points.
Oligodendrocytes are unlikely to be the main contributors in the pathology associated with pyruvate dehydrogenase complex deficiency. Production of acetyl-CoA from pyruvate is dispensable for the maintenance of myelin.
Acknowledgments
We thank E. Hurley for superb technical assistance and Klaus Nave for the CnpCre/+ mice and critical comments on the paper. This work was funded by grants R01NS045630 and R01NS100464 (to M.L.F.) and Empire State Development Corporation—Working Capital; Contract grant number: W753 (to LW.).
Footnotes
The authors declare no competing financial interests.
Author contributions. G.D.N., M.L.F. and Y.P. designed research and interpreted data; G.D.N. and Y.P. performed experiments with L.M. assistance; N.S. performed electrophysiological analyses; M.S.P. contributed analytical tools; G.D.N., M.L.F. and Y.P. analyzed data; Y.P. and G.D.N. wrote the manuscript; and M.S.P., N.S., L.W. and M.L.F. critically reviewed the manuscript.
References
- Amaral AI, Hadera MG, Tavares JM, Kotter MR, Sonnewald U. Characterization of glucose-related metabolic pathways in differentiated rat oligodendrocyte lineage cells. Glia. 2016;64(1):21–34. doi: 10.1002/glia.22900. [DOI] [PMC free article] [PubMed] [Google Scholar]
- Attwell D, Laughlin SB. An energy budget for signaling in the grey matter of the brain. J Cereb Blood Flow Metab. 2001;21(10):1133–1145. doi: 10.1097/00004647-200110000-00001. [DOI] [PubMed] [Google Scholar]
- Azarashvili T, Krestinina O, Galvita A, Grachev D, Baburina Y, Stricker R, Reiser G. Identification of phosphorylated form of 2′, 3′-cyclic nucleotide 3′-phosphodiesterase (CNPase) as 46 kDa phosphoprotein in brain non-synaptic mitochondria overloaded by calcium. J Bioenerg Biomembr. 2014;46(2):135–145. doi: 10.1007/s10863-014-9541-4. [DOI] [PubMed] [Google Scholar]
- Ballestero RP, Dybowski JA, Levy G, Agranoff BW, Uhler MD. Cloning and characterization of zRICH, a 2′,3′-cyclic-nucleotide 3′-phosphodiesterase induced during zebrafish optic nerve regeneration. J Neurochem. 1999;72(4):1362–1371. doi: 10.1046/j.1471-4159.1999.721362.x. [DOI] [PubMed] [Google Scholar]
- Beirowski B, Babetto E, Golden JP, Chen YJ, Yang K, Gross RW, Patti GJ, Milbrandt J. Metabolic regulator LKB1 is crucial for Schwann cell-mediated axon maintenance. Nat Neurosci. 2014;17(10):1351–1361. doi: 10.1038/nn.3809. [DOI] [PMC free article] [PubMed] [Google Scholar]
- Beppu K, Sasaki T, Tanaka KF, Yamanaka A, Fukazawa Y, Shigemoto R, Matsui K. Optogenetic countering of glial acidosis suppresses glial glutamate release and ischemic brain damage. Neuron. 2014;81(2):314–320. doi: 10.1016/j.neuron.2013.11.011. [DOI] [PubMed] [Google Scholar]
- Berger P, Niemann A, Suter U. Schwann cells and the pathogenesis of inherited motor and sensory neuropathies (Charcot-Marie-Tooth disease) Glia. 2006;54(4):243–257. doi: 10.1002/glia.20386. [DOI] [PubMed] [Google Scholar]
- Edgar JM, McLaughlin M, Werner HB, McCulloch MC, Barrie JA, Brown A, Faichney AB, Snaidero N, Nave KA, Griffiths IR. Early ultrastructural defects of axons and axon-glia junctions in mice lacking expression of Cnp1. Glia. 2009;57(16):1815–1824. doi: 10.1002/glia.20893. [DOI] [PubMed] [Google Scholar]
- Edmond J, Robbins RA, Bergstrom JD, Cole RA, de Vellis J. Capacity for substrate utilization in oxidative metabolism by neurons, astrocytes, and oligodendrocytes from developing brain in primary culture. J Neurosci Res. 1987;18(4):551–561. doi: 10.1002/jnr.490180407. [DOI] [PubMed] [Google Scholar]
- Feltri ML, D’Antonio M, Previtali S, Fasolini M, Messing A, Wrabetz L. P0-Cre transgenic mice for inactivation of adhesion molecules in Schwann cells. Ann N Y Acad Sci. 1999;883:116–123. [PubMed] [Google Scholar]
- Feltri ML, Scherer SS, Wrabetz L, Kamholz J, Shy ME. Mitogen-expanded Schwann cells retain the capacity to myelinate regenerating axons after transplantation into rat sciatic nerve. Proc Natl Acad Sci U S A. 1992;89(18):8827–8831. doi: 10.1073/pnas.89.18.8827. [DOI] [PMC free article] [PubMed] [Google Scholar]
- Funfschilling U, Supplie LM, Mahad D, Boretius S, Saab AS, Edgar J, Brinkmann BG, Kassmann CM, Tzvetanova ID, Mobius W, Diaz F, Meijer D, Suter U, Hamprecht B, Sereda MW, Moraes CT, Frahm J, Goebbels S, Nave KA. Glycolytic oligodendrocytes maintain myelin and long-term axonal integrity. Nature. 2012;485(7399):517–521. doi: 10.1038/nature11007. [DOI] [PMC free article] [PubMed] [Google Scholar]
- Genoud S, Lappe-Siefke C, Goebbels S, Radtke F, Aguet M, Scherer SS, Suter U, Nave KA, Mantei N. Notch1 control of oligodendrocyte differentiation in the spinal cord. J Cell Biol. 2002;158(4):709–718. doi: 10.1083/jcb.200202002. [DOI] [PMC free article] [PubMed] [Google Scholar]
- Griffiths I, Klugmann M, Anderson T, Yool D, Thomson C, Schwab MH, Schneider A, Zimmermann F, McCulloch M, Nadon N, Nave KA. Axonal swellings and degeneration in mice lacking the major proteolipid of myelin. Science. 1998;280(5369):1610–1613. doi: 10.1126/science.280.5369.1610. [DOI] [PubMed] [Google Scholar]
- Grigoryan T, Stein S, Qi J, Wende H, Garratt AN, Nave KA, Birchmeier C, Birchmeier W. Wnt/Rspondin/beta-catenin signals control axonal sorting and lineage progression in Schwann cell development. Proc Natl Acad Sci U S A. 2013;110(45):18174–18179. doi: 10.1073/pnas.1310490110. [DOI] [PMC free article] [PubMed] [Google Scholar]
- Hagemeyer N, Goebbels S, Papiol S, Kastner A, Hofer S, Begemann M, Gerwig UC, Boretius S, Wieser GL, Ronnenberg A, Gurvich A, Heckers SH, Frahm J, Nave KA, Ehrenreich H. A myelin gene causative of a catatonia-depression syndrome upon aging. EMBO Mol Med. 2012;4(6):528–539. doi: 10.1002/emmm.201200230. [DOI] [PMC free article] [PubMed] [Google Scholar]
- Halim ND, McFate T, Mohyeldin A, Okagaki P, Korotchkina LG, Patel MS, Jeoung NH, Harris RA, Schell MJ, Verma A. Phosphorylation status of pyruvate dehydrogenase distinguishes metabolic phenotypes of cultured rat brain astrocytes and neurons. Glia. 2010;58(10):1168–1176. doi: 10.1002/glia.20996. [DOI] [PMC free article] [PubMed] [Google Scholar]
- Heath AR, Hindman HM. CNPase activity in the vertebrate retina, retinal pigmented epithelium, and choroid. J Exp Zool. 1986;238(2):183–191. doi: 10.1002/jez.1402380208. [DOI] [PubMed] [Google Scholar]
- Hirrlinger J, Nave KA. Adapting brain metabolism to myelination and long-range signal transduction. Glia. 2014;62(11):1749–1761. doi: 10.1002/glia.22737. [DOI] [PubMed] [Google Scholar]
- Johnson MT, Mahmood S, Hyatt SL, Yang HS, Soloway PD, Hanson RW, Patel MS. Inactivation of the murine pyruvate dehydrogenase (Pdha1) gene and its effect on early embryonic development. Mol Genet Metab. 2001;74(3):293–302. doi: 10.1006/mgme.2001.3249. [DOI] [PubMed] [Google Scholar]
- Kim S, Maynard JC, Sasaki Y, Strickland A, Sherman DL, Brophy PJ, Burlingame AL, Milbrandt J. Schwann Cell O-GlcNAc Glycosylation Is Required for Myelin Maintenance and Axon Integrity. J Neurosci. 2016;36(37):9633–9646. doi: 10.1523/JNEUROSCI.1235-16.2016. [DOI] [PMC free article] [PubMed] [Google Scholar]
- Lappe-Siefke C, Goebbels S, Gravel M, Nicksch E, Lee J, Braun PE, Griffiths IR, Nave KA. Disruption of Cnp1 uncouples oligodendroglial functions in axonal support and myelination. Nat Genet. 2003;33(3):366–374. doi: 10.1038/ng1095. [DOI] [PubMed] [Google Scholar]
- Lassmann H. Mechanisms of white matter damage in multiple sclerosis. Glia. 2014;62(11):1816–1830. doi: 10.1002/glia.22597. [DOI] [PubMed] [Google Scholar]
- Lee Y, Morrison BM, Li Y, Lengacher S, Farah MH, Hoffman PN, Liu Y, Tsingalia A, Jin L, Zhang PW, Pellerin L, Magistretti PJ, Rothstein JD. Oligodendroglia metabolically support axons and contribute to neurodegeneration. Nature. 2012;487(7408):443–448. doi: 10.1038/nature11314. [DOI] [PMC free article] [PubMed] [Google Scholar]
- Marin-Valencia I, Good LB, Ma Q, Malloy CR, Patel MS, Pascual JM. Cortical metabolism in pyruvate dehydrogenase deficiency revealed by ex vivo multiplet (13)C NMR of the adult mouse brain. Neurochem Int. 2012;61(7):1036–1043. doi: 10.1016/j.neuint.2012.07.020. [DOI] [PMC free article] [PubMed] [Google Scholar]
- McFerran B, Burgoyne R. 2′,3′-Cyclic nucleotide 3′-phosphodiesterase is associated with mitochondria in diverse adrenal cell types. J Cell Sci. 1997;110(Pt 23):2979–2985. doi: 10.1242/jcs.110.23.2979. [DOI] [PubMed] [Google Scholar]
- Moffett JR, Arun P, Ariyannur PS, Garbern JY, Jacobowitz DM, Namboodiri AM. Extensive aspartoacylase expression in the rat central nervous system. Glia. 2011;59(10):1414–1434. doi: 10.1002/glia.21186. [DOI] [PMC free article] [PubMed] [Google Scholar]
- Moffett JR, Ross B, Arun P, Madhavarao CN, Namboodiri AM. N-Acetylaspartate in the CNS: from neurodiagnostics to neurobiology. Prog Neurobiol. 2007;81(2):89–131. doi: 10.1016/j.pneurobio.2006.12.003. [DOI] [PMC free article] [PubMed] [Google Scholar]
- Monk KR, Feltri ML, Taveggia C. New insights on Schwann cell development. Glia. 2015;63(8):1376–1393. doi: 10.1002/glia.22852. [DOI] [PMC free article] [PubMed] [Google Scholar]
- Nave KA. Myelination and support of axonal integrity by glia. Nature. 2010;468(7321):244–252. doi: 10.1038/nature09614. [DOI] [PubMed] [Google Scholar]
- Patel MS, Owen OE. Development and regulation of lipid synthesis from ketone bodies by rat brain. J Neurochem. 1977;28(1):109–114. doi: 10.1111/j.1471-4159.1977.tb07715.x. [DOI] [PubMed] [Google Scholar]
- Pietrocola F, Galluzzi L, Bravo-San Pedro JM, Madeo F, Kroemer G. Acetyl coenzyme A: a central metabolite and second messenger. Cell Metab. 2015;21(6):805–821. doi: 10.1016/j.cmet.2015.05.014. [DOI] [PubMed] [Google Scholar]
- Pliss L, Hausknecht KA, Stachowiak MK, Dlugos CA, Richards JB, Patel MS. Cerebral Developmental Abnormalities in a Mouse with Systemic Pyruvate Dehydrogenase Deficiency. PLoS One. 2013;8(6):e67473. doi: 10.1371/journal.pone.0067473. [DOI] [PMC free article] [PubMed] [Google Scholar]
- Pliss L, Pentney RJ, Johnson MT, Patel MS. Biochemical and structural brain alterations in female mice with cerebral pyruvate dehydrogenase deficiency. J Neurochem. 2004;91(5):1082–1091. doi: 10.1111/j.1471-4159.2004.02790.x. [DOI] [PubMed] [Google Scholar]
- Poitelon Y, Bogni S, Matafora V, Della-Flora Nunes G, Hurley E, Ghidinelli M, Katzenellenbogen BS, Taveggia C, Silvestri N, Bachi A, Sannino A, Wrabetz L, Feltri ML. Spatial mapping of juxtacrine axo-glial interactions identifies novel molecules in peripheral myelination. Nat Commun. 2015;6:8303. doi: 10.1038/ncomms9303. [DOI] [PMC free article] [PubMed] [Google Scholar]
- Poitelon Y, Kozlov S, Devaux J, Vallat JM, Jamon M, Roubertoux P, Rabarimeriarijaona S, Baudot C, Hamadouche T, Stewart CL, Levy N, Delague V. Behavioral and molecular exploration of the AR-CMT2A mouse model Lmna (R298C/R298C) Neuromolecular Med. 2012;14(1):40–52. doi: 10.1007/s12017-012-8168-z. [DOI] [PubMed] [Google Scholar]
- Pooya S, Liu X, Kumar VB, Anderson J, Imai F, Zhang W, Ciraolo G, Ratner N, Setchell KD, Yoshida Y, Jankowski MP, Dasgupta B. The tumour suppressor LKB1 regulates myelination through mitochondrial metabolism. Nat Commun. 2014;5:4993. doi: 10.1038/ncomms5993. [DOI] [PMC free article] [PubMed] [Google Scholar]
- Quattrini A, Previtali S, Feltri ML, Canal N, Nemni R, Wrabetz L. Beta 4 integrin and other Schwann cell markers in axonal neuropathy. Glia. 1996;17(4):294–306. doi: 10.1002/(SICI)1098-1136(199608)17:4<294::AID-GLIA4>3.0.CO;2-#. [DOI] [PubMed] [Google Scholar]
- Reynolds R, Wilkin GP. Development of macroglial cells in rat cerebellum. II. An in situ immunohistochemical study of oligodendroglial lineage from precursor to mature myelinating cell. Development. 1988;102(2):409–425. doi: 10.1242/dev.102.2.409. [DOI] [PubMed] [Google Scholar]
- Rich PR. The molecular machinery of Keilin’s respiratory chain. Biochem Soc Trans. 2003;31(Pt 6):1095–1105. doi: 10.1042/bst0311095. [DOI] [PubMed] [Google Scholar]
- Rosenbluth J. Central myelin in the mouse mutant shiverer. J Comp Neurol. 1980;194(3):639–648. doi: 10.1002/cne.901940310. [DOI] [PubMed] [Google Scholar]
- Saher G, Brugger B, Lappe-Siefke C, Mobius W, Tozawa R, Wehr MC, Wieland F, Ishibashi S, Nave KA. High cholesterol level is essential for myelin membrane growth. Nat Neurosci. 2005;8(4):468–475. doi: 10.1038/nn1426. [DOI] [PubMed] [Google Scholar]
- Saher G, Quintes S, Mobius W, Wehr MC, Kramer-Albers EM, Brugger B, Nave KA. Cholesterol regulates the endoplasmic reticulum exit of the major membrane protein P0 required for peripheral myelin compaction. J Neurosci. 2009;29(19):6094–6104. doi: 10.1523/JNEUROSCI.0686-09.2009. [DOI] [PMC free article] [PubMed] [Google Scholar]
- Siess E, Wittmann J, Wieland O. Interconversion and kinetic properties of pyruvate dehydrogenase from brain. Hoppe Seylers Z Physiol Chem. 1971;352(3):447–452. doi: 10.1515/bchm2.1971.352.1.447. [DOI] [PubMed] [Google Scholar]
- Smith CM, Cooksey E, Duncan ID. Myelin loss does not lead to axonal degeneration in a long-lived model of chronic demyelination. J Neurosci. 2013;33(6):2718–2727. doi: 10.1523/JNEUROSCI.4627-12.2013. [DOI] [PMC free article] [PubMed] [Google Scholar]
- Snaidero N, Velte C, Myllykoski M, Raasakka A, Ignatev A, Werner HB, Erwig MS, Mobius W, Kursula P, Nave KA, Simons M. Antagonistic Functions of MBP and CNP Establish Cytosolic Channels in CNS Myelin. Cell Rep. 2017;18(2):314–323. doi: 10.1016/j.celrep.2016.12.053. [DOI] [PMC free article] [PubMed] [Google Scholar]
- Tognatta R, Sun W, Goebbels S, Nave KA, Nishiyama A, Schoch S, Dimou L, Dietrich D. Transient Cnp expression by early progenitors causes Cre-Lox-based reporter lines to map profoundly different fates. Glia. 2017;65(2):342–359. doi: 10.1002/glia.23095. [DOI] [PMC free article] [PubMed] [Google Scholar]
- Verrier JD, Jackson TC, Gillespie DG, Janesko-Feldman K, Bansal R, Goebbels S, Nave KA, Kochanek PM, Jackson EK. Role of CNPase in the oligodendrocytic extracellular 2′,3′-cAMP-adenosine pathway. Glia. 2013;61(10):1595–1606. doi: 10.1002/glia.22523. [DOI] [PMC free article] [PubMed] [Google Scholar]
- Viader A, Golden JP, Baloh RH, Schmidt RE, Hunter DA, Milbrandt J. Schwann cell mitochondrial metabolism supports long-term axonal survival and peripheral nerve function. J Neurosci. 2011;31(28):10128–10140. doi: 10.1523/JNEUROSCI.0884-11.2011. [DOI] [PMC free article] [PubMed] [Google Scholar]
- Viader A, Sasaki Y, Kim S, Strickland A, Workman CS, Yang K, Gross RW, Milbrandt J. Aberrant Schwann cell lipid metabolism linked to mitochondrial deficits leads to axon degeneration and neuropathy. Neuron. 2013;77(5):886–898. doi: 10.1016/j.neuron.2013.01.012. [DOI] [PMC free article] [PubMed] [Google Scholar]
- Volkenhoff A, Weiler A, Letzel M, Stehling M, Klambt C, Schirmeier S. Glial Glycolysis Is Essential for Neuronal Survival in Drosophila. Cell Metab. 2015;22(3):437–447. doi: 10.1016/j.cmet.2015.07.006. [DOI] [PubMed] [Google Scholar]
- Yin X, Kidd GJ, Ohno N, Perkins GA, Ellisman MH, Bastian C, Brunet S, Baltan S, Trapp BD. Proteolipid protein-deficient myelin promotes axonal mitochondrial dysfunction via altered metabolic coupling. J Cell Biol. 2016;215(4):531–542. doi: 10.1083/jcb.201607099. [DOI] [PMC free article] [PubMed] [Google Scholar]
- Zhu X, Hill RA, Dietrich D, Komitova M, Suzuki R, Nishiyama A. Age-dependent fate and lineage restriction of single NG2 cells. Development. 2011;138(4):745–753. doi: 10.1242/dev.047951. [DOI] [PMC free article] [PubMed] [Google Scholar]
Associated Data
This section collects any data citations, data availability statements, or supplementary materials included in this article.
Supplementary Materials
Data Availability Statement
The authors declare that the data supporting the findings of this study are available within the article and its supplementary information files. All original data are available from the corresponding author upon request.