Abstract
There is a need for imaging and sensing instrumentation that can monitor transitions in a biofilm structure in order to better understand biofilm development and emergent properties such as anti-microbial resistance. Herein, we describe the design, manufacture, and use of a microfluidic flow cell to visualize the surface structure of bacterial biofilms with white-light interferometry (WLI). The novel imaging chip enabled the use of this non-disruptive imaging method for the capture of high resolution three-dimensional profile images of biofilm growth over time. The fine axial resolution (3 nm) and the wide field of view (>1 mm by 1 mm) enabled the detection of biofilm formation as early as 3 h after inoculation of the flow cell with a live bacterial culture (Pseudomonas fluorescens). WLI imaging facilitated the monitoring of the early stages of biofilm development and subtle variations in the structure of mature biofilms. Minimally-invasive imaging enabled the monitoring of biofilm structure with surface metrology metrics (e.g., surface roughness). The system was used to observe a transition in the biofilm structure that occurred in response to exposure to a common antiseptic. In the future, WLI and the biofilm imaging cell described herein may be used to test the effectiveness of biofilm-specific therapies to combat common diseases associated with biofilm formation such as cystic fibrosis and periodontitis.
I. INTRODUCTION
Bacterial biofilms, structured communities of bacteria embedded in an extracellular polymeric matrix and attached to a surface, are universal both in natural environments and in manmade ecosystems. Biofilms contribute to numerous chronic diseases such as periodontitis, cystic fibrosis pneumonia, and infections associated with indwelling medical devices such as catheters, heart valves, and prostheses.1 Biofilms are more resistant to antimicrobial agents than are planktonic cultures of the same organisms, and their structure and architecture are thought to contribute to their resistance.2
Biofilms are often subject to dramatic structural transitions. For example, dental biofilms are frequently subject to brushing and other hygiene practices aimed at removing bacteria,3,4 and Pseudomonas aeruginosa infections in cystic fibrosis patients are treated with chronic suppressive antibiotic therapy and physical disruption.5 In situ non-destructive imaging techniques that can monitor structural transitions in microbiomes and biofilms would facilitate our understanding of biofilm dynamics and provide a means to monitor the effects of different perturbations on the biofilm architecture over time.6 Here, we present a new method to study structural dynamics in bacterial biofilms with white-light interferometry (WLI), a high resolution optical imaging technique.
High resolution biofilm imaging requires carefully controlled growth and imaging conditions, and significant research aimed at leveraging flow cells and microfluidic devices to create such conditions has been carried out.7–9 Flow cells may be used to grow biofilms for ex situ or in situ monitoring, and microfluidic platforms for continuous biofilm growth and viscosity measurements have been developed.10,11 These systems typically use light, epifluorescence, and confocal laser scanning microscopy (CLSM) to visualize the biofilms;8 however, a common limitation of microscopy techniques is the inability to survey a large area with a single scan without sacrificing desired resolution.
White-light interferometry is a specialized optical technique for imaging and surface metrology that is unique in its ability to maintain high axial (z-direction) resolution, regardless of magnification. WLI uses light reflected from a sample to reconstruct a three-dimensional (3D) image of the sample surface with resolution as low as 3 nm. It is routinely used to inspect defects in silicon wafers and printed circuit boards and to assess the roughness, deformation, and corrosion of machined objects.12–14 Despite the potential benefits, the use of WLI for imaging live biological samples and biofilms has been limited due to the difficulty in growing and maintaining live cultures under conditions that are also suitable for interferometric imaging.
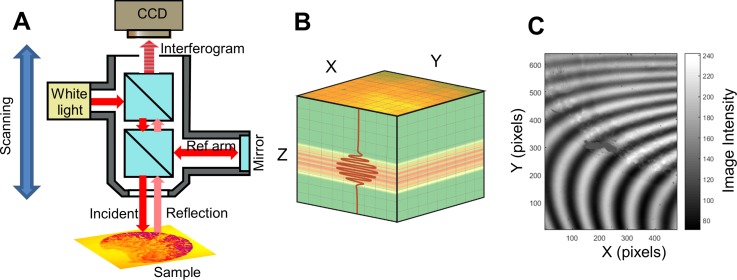
WLI imaging systems are based on traditional upright optical microscopes, though their objective lenses have components necessary to make an interferometer—a beam splitter and a reference mirror in the case of the traditional Michelson-style interferometer. Light that is directed toward the sample is split, so that when it is reflected from both the sample and the reference mirror and recombined it creates interference fringes on the image sensor. WLI systems also typically have a finely tuned vertical scanning system so that the modulation in light intensity across the image can be used to determine the relative axial position of each pixel. Further illustration of the WLI imaging system and light intensity modulation is shown in Fig. 1. The figure shows the main components of a WLI system including a Michelson-type interferometric objective lens. Figure 1(b) illustrates the data cube that results from a WLI scan, and Fig. 1(c) shows a single frame in the data cube with multiple interference fringes being visible. The movement of the fringes during a vertical scan results in an interferogram (or correlogram) for each pixel. Analysis of each interferogram results in assigning a Z-position to each pixel. The short coherence length of the light source (typically a broad spectrum light emitting diode) ensures that each pixel can be assigned an absolute position that does not suffer from fringe order ambiguity common to high-coherence sources such as lasers.
FIG. 1.
(a) Schematic of a typical Michelson-type white-light interferometry imaging system and (b) the resulting image cube. An interferometric objective lens enables the collection of data that can be used to construct a 3D profile of the sample surface. Light from a low-coherence source (white light) enters the objective and is split to illuminate a reference mirror and the sample. The reflected light from both arms recombine and interfere when optical path lengths are equal. A charge coupled device (CCD) camera records a series of images of the sample as the entire optical system is scanned vertically. The resulting raw data are a cube of images; (b) may contain an image of the X-Y plane for every ∼100 nm of the vertical (Z) scan distance. Interference manifests in the image cube as a series of modulations of image intensity. The observed image intensity at each Z-position results in an interferogram (correlogram) for each pixel in the X-Y image plane (represented as an overlaid red line). An absolute z-position of the surface can be assigned to each pixel by performing an envelope fit of each interferogram. (c) Interference fringes are visible in a single frame captured during a WLI image scan of a biofilm. The fringes appear as the objective lens and camera are scanned vertically. Modulations in pixel intensity that result from the scanning process results in the interferogram.
Nonetheless, WLI requires a reflective interface and a clear or well-defined optical path—conditions that are difficult to achieve in the existing microfluidic imaging systems. In a previous study, microreflectors were used to identify and image the interface of a soft liquid-immersed film.15 In our previous work, we described a method for observing biofilms under static conditions with WLI by introducing an air bubble over the imaging area.16–18 Herein, the use of a novel microfluidic flow cell to observe the growth dynamics of biofilms is reported.
II. EXPERIMENTAL METHODS
A. Design and fabrication of flow cells for WLI imaging
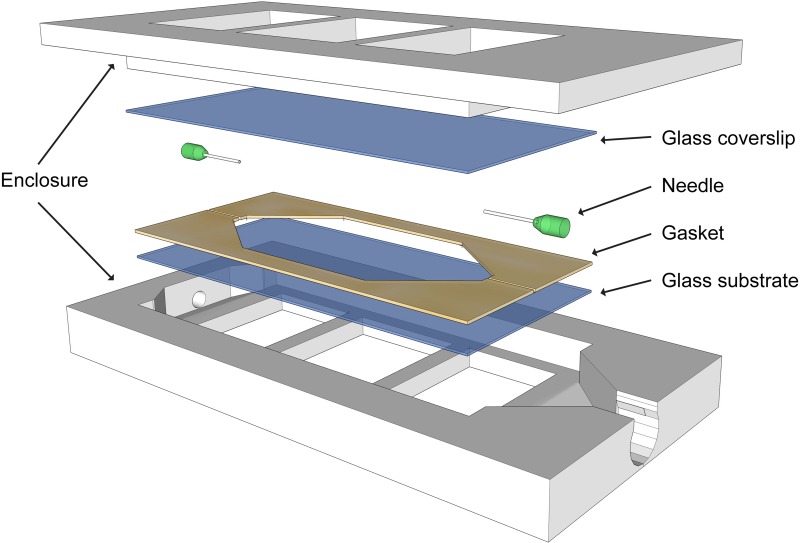
The flow cell used for dynamic imaging in this study is shown in an exploded view in Fig. 2. The cell has a sandwich design that secures two viewing windows within a 3D-printed encasing. The encasing was printed using inexpensive acrylonitrile butadiene styrene (a common thermoplastic) on a Flashforge Dreamer 3D printer and sealed with silicone adhesive. Selection of the viewing window is an important consideration for compatibility with WLI—it must be thin enough that it does not shift the image out of the focal plane of the objective lens.17 The viewing windows were 25 mm by 50 mm No. 2 microscope cover glass that is 190 μm to 250 μm thick (Ted Pella). A 260 μm diameter hypodermic needle (purchased from VWR International) placed between the viewing windows supplied nutrient media to a narrow bacterial growth region. A latex gasket (300 μm thickness) was used to seal the growth region. Silicone tubing was used to connect the flow cell to a reservoir of liquid media and to a waste container. A peristaltic pump (Ismatec REGLO Analog) was used to flow media through the imaging cell. The tubing connected to the influent end of the flow cell was equipped with a socket that allowed for the injection of small volumes of air. Injecting air into the imaging chamber is a key experimental step because microbubbles create a reflective air/water interface at the surface of the biofilm that enables WLI imaging.
FIG. 2.
3D model of a flow cell shows the sealed enclosure that enables the flow of nutrient media through an imaging chamber. Viewing windows are sandwiched between the two parts of the enclosure. A gasket seals liquid media between the windows. The needle at the inlet supplies liquid media during flow and air bubbles during imaging. The cell supports the growth of the biofilm for extended periods and is tailored for use with white-light interferometry through careful selection of viewing windows with appropriate thickness and group index of refraction.
B. Biofilm culturing
Pseudomonas fluorescens (P. fluorescens, ATCC 13525) was grown at room temperature in Difco Nutrient Broth (BD Biosciences). P. fluorescens is a common rod-shaped nonpathogenic gram-negative bacterium found in soil and water. It was chosen here as a representative example of other pathogenic pseudomonads such as P. aeruginosa, which is frequently a cause of urinary-tract infections, hospital-acquired pneumonia, and death in cystic fibrosis patients.19,20 Additionally, when infecting a host, P. aeruginosa is thought to survive by forming a biofilm.21,22 One milliliter of Pseudomonas fluorescens in the stationary phase (∼108 CFU/ml) was inoculated into 1 liter of nutrient broth. The culture and media were pumped in one direction through the flow cell using a peristaltic pump at a rate of 0.25 (ml/min) into a waste bottle. Additional sterile broth was added to the influent reservoir as needed for the duration of the experiment (either one week or 24 h). Approximately 2.5 l of broth flowed through the flow cell over the course of the one-week trial.
C. WLI imaging parameters
The surface profiles of the biofilm inside the 3D printed flow cell were measured by a Bruker Counter Elite GT-I white-light interferometer. All measurements were made using a 2.5× interferometric objective which provided a 2.55 × 1.8 mm imaging area. A green light-emitting diode was used for illumination in order to maximize the horizontal resolution. The noise threshold was set to the minimum value, 0.001. Generally, compensation in the reference arm of the interferometer is needed in order to image through transmissive media. For this work, an uncompensated Michelson-type interferometric objective lens was used. As discussed in detail in our previous work, it was found that the low magnification lens could tolerate a small mismatch in the optical path length between the arms of the interferometer.17
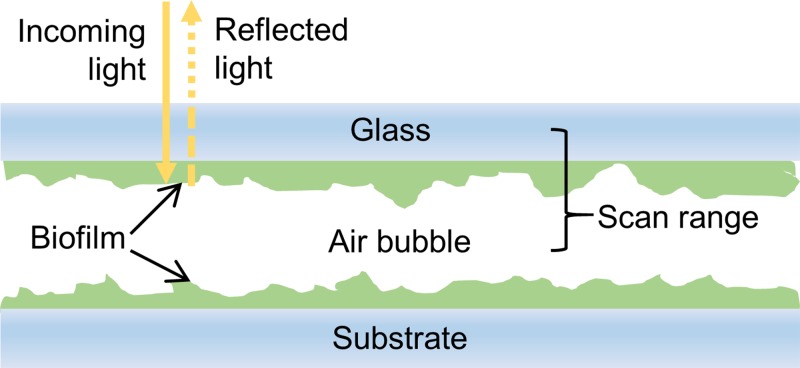
Periodically, the peristaltic pump was paused and an air-filled syringe was attached to the socket near the influent entrance to the flow cell. A small air bubble, roughly 300 μl, was allowed to flow into the imaging chamber. The bubble created an air/water interface at the surface of the biofilm that was the reflective surface used to image the biofilm's surface (Fig. 3). Flow of a liquid through the imaging cell was interrupted for the duration of the imaging process in order to avoid any additional vibrations that would negatively impact the accuracy of the surface profile data. As shown in Fig. 3, the vertical scanning range was selected such that interference fringes were observed from only the bottom of the cover glass and the surface of the biofilm. At the conclusion of imaging, the flow of liquid media was resumed, forcing the air bubble out of the effluent port of the flow cell. In total, the flow of media to the imaging cell was interrupted for around 15 min for each image measurement.
FIG. 3.
Diagram of the cross-section of the flow cell when air is inserted into the viewing chamber for imaging. Light from the microscope passes through the top cover glass and through the biofilm. Light reflected from the biofilm/air bubble interface returns to the microscope and creates an interference pattern on the camera when it combines with light reflected from a reference arm in the objective lens. A vertical scanning range is selected to avoid light reflected from the top surface of the coverglass and any lower interfaces. This configuration allows for non-destructive imaging of a biofilm attached to the top cover glass. Biofilm on the opposing surface can be imaged by inverting the flow cell.
D. Time series imaging of the biofilm structure
Two time series experiments were conducted to observe the growth dynamics of biofilms in the early stages of development (first 24 h) and after maturity (first 7 days). For week-long experiments P. fluorescens was inoculated into the growth media and at least three surface profile images were taken from various locations throughout the flow cell on each day (including prior to the start of the experiment). For early stage growth, the biofilm was imaged 14 times (every ∼1.5 h) over the course of 24 h. The roughness and the biofilm thickness (maxima) were measured from each image. These experiments were replicated in triplicate for the analysis of average trends.
A final experiment was undertaken to observe the response of a biofilm to an external perturbation. A common antibacterial solution—sodium hypochlorite (Clorox bleach), 0.5% in water—was introduced into the flow cell. It was pumped through the imaging chamber at a rate of 0.25 ml/min, identical to experimental growth media flow conditions. WLI images were taken 30, 60, and 90 min after first introducing sodium hypochlorite into the system in order to observe the changes in biofilm structure and topology.
E. Data processing
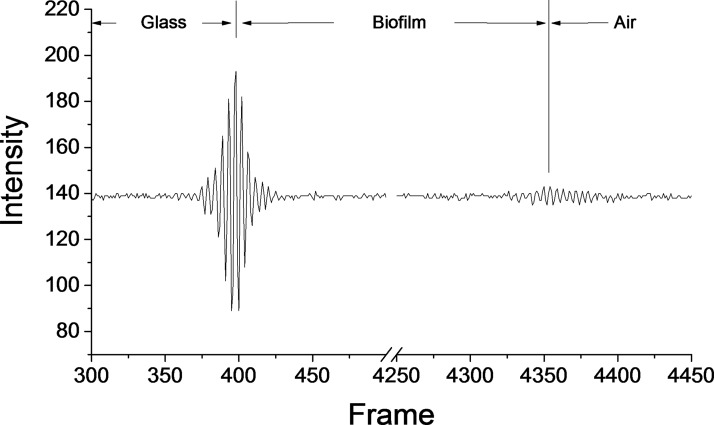
Surface profile data were compiled from interference fringe data using instrument software (Bruker Vision64). The data were also analyzed using an open source data visualization and analysis software (available at Gwyddion.net). A scaling factor equal to the group index of refraction of the medium (i.e., the biofilm) was used to correct height values for the optical path length difference seen when imaging through a liquid and a biofilm. Figure 4 is an example of WLI data showing both the glass/biofilm interface and the biofilm/air interface. Only valid data points (excluding pixels where an axial position could not be determined) were included in further analysis of height and roughness. Systematic tilt was corrected using a three point level tool. Arithmetic average area surface roughness (Sa), average thickness, median thickness and maximum value in each sample were calculated for each image. WLI scans resulting in an image with a significant fraction of missing data points were repeated. When multiple scans of the same location were taken, the one with the least amount of missing data was used. Quantitative metrology metrics were measured in triplicate, and standard error was calculated for each set of samples.
FIG. 4.
An example of an interferogram or correlogram from a single pixel. In this example, there are two interference fringe packets. The first is the strong reflection that occurs at the interface between the bottom of the cover glass and the biofilm. The second fringe packet is from the air/water interface at the surface of the biofilm. The thickness of the biofilm can be calculated by comparing the relative positions of the cover glass and biofilm interfaces. The amplitude of interference at the biofilm/air interface is smaller than that of the glass/biofilm interface—likely a result of loss of light through absorption and scattering within the biofilm. Weak signals can be used to accurately determine the Z-position of a surface, though insufficient signal-to-noise in the correlogram results in data dropout (pixels without a determined axial position).
III. EXPERIMENTAL RESULTS
A. Characteristics of a flow cell for WLI imaging
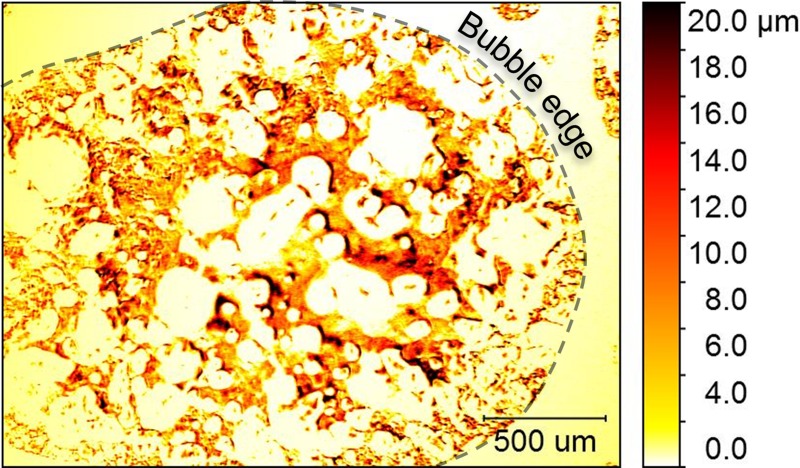
As described above, the thickness of the viewing window is important because it must be thin enough that it does not shift the optical path length by more than focal depth of the objective lens. Biofilms are largely composed of water (up to 97% in some measured cases23), so that there is not a distinguishable difference in optical density from the surrounding bulk liquid. This makes interferometric imaging challenging as light is not strongly reflected from the biofilm/liquid interface. The flow cell used in this study was designed to facilitate insertion of an air bubble in the space between the viewing window and the substrate (as seen in Fig. 3). The air presses against the surface of the biofilm and forms an air/water interface that strongly reflects incident light to the interferometer and allows the biofilm to remain mostly hydrated during imaging. It is this interface that reveals the biofilm structure. Biofilm forms on all interior surfaces, but is only visible with interferometry where air bubbles are present. Figure 5 shows the edge of an air bubble, and a region at the right edge of the image that appears smooth. In the region outside of the bubble, the only reflective surface is that of the viewing window.
FIG. 5.
Insertion of a bubble creates an air/water interface that made it possible to use WLI to image the biofilm structure. This structure was only revealed under the air bubble and not beyond the edges of the bubble (indicated by a dashed line). False coloring in the image corresponds to biofilm thickness, with darker regions indicating a thicker growth of the biofilm.
B. Features of WLI biofilm images
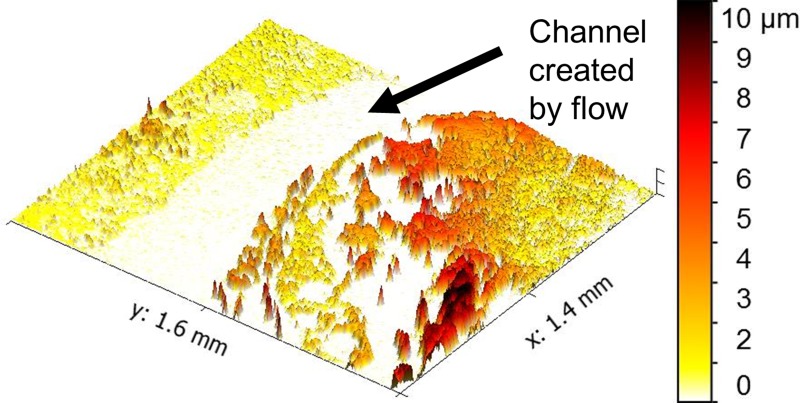
Figures 5 and 6 exemplify the images of biofilm structure that are captured with WLI imaging in 2D and 3D, respectively. The field of view of each image is large enough (1–2 mm) to show heterogeneity across the biofilm. Figure 5 shows how the biofilm's structure was influenced by the flow conditions present in the imaging cell. The biofilm is heterogeneous with some regions covered with robust growth, while others have little or no growth. The flow of liquid media (from the bottom left to the top right in the image) resulted in a channel through the top left of the image where biofilm growth was lower than elsewhere on the viewing window. The width of the channel is approximately 500 μm. This type of channeling may improve the biofilm's ability to access nutrient resources by maintaining liquid flow.
FIG. 6.
Biofilms are shaped by the flow conditions in which they grow. The flow of liquid through the viewing chamber created a flow channel as indicated in this 3D image. False coloring corresponds to biofilm thickness according to the color bar at right.
C. Monitoring biofilm growth development over time
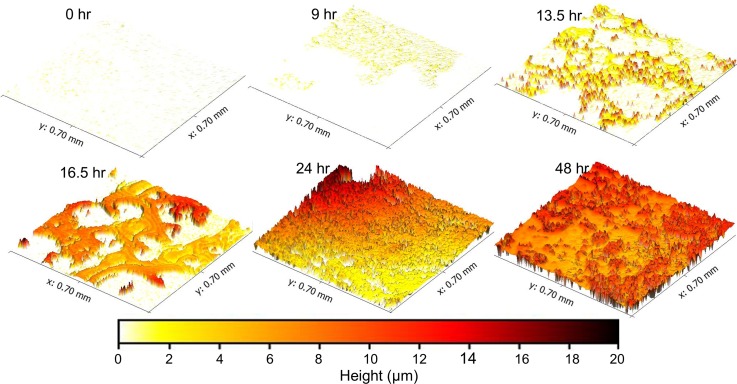
Figure 7 shows the development the development of a biofilm over the course of 48 h. The images show a clear trend: bacteria first attached to the clean surface and grew into colonies; then, small separated colonies joined together and covered the viewing window before increasing in thickness. Biofilm formation was detected as early as 3 h after inoculation of the flow cell. This trend was also observed at two other locations within the flow cell (as seen in the compiled metrology data in Fig. 8).
FIG. 7.
A series of images demonstrate the growth of P. fluorescens biofilm over 48 h. Bacteria attached to the surface in the first 9 h. Isolated colonies then grew in height and spread over the surface (13.5 h). Small colonies merged into larger formations (16.5 h) and eventually covered the whole viewing area (24 h). The biofilm then grew thicker and more textured from 24 and 48 h. False coloring corresponds to biofilm thickness according to the color bar at the bottom.
FIG. 8.
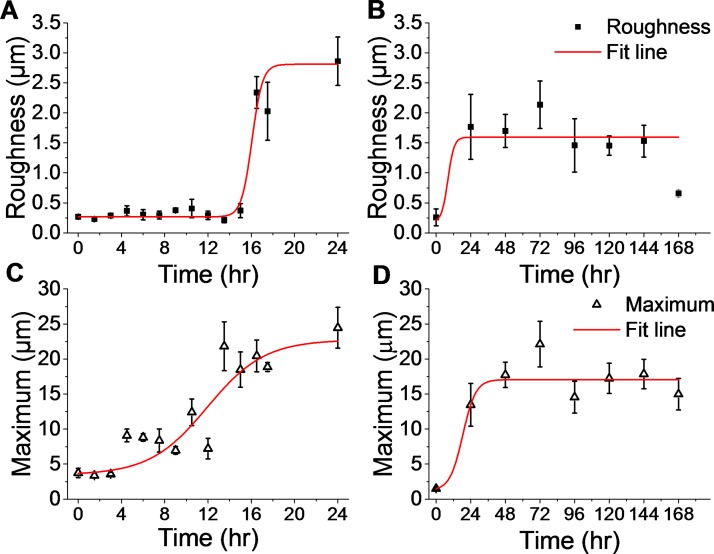
High resolution 3D imaging over a large field of view enables an accurate measurement of traditional surface metrology metrics such as film roughness and maxima. Data from two experiments show results during the initial attachment and colonization phase in the first 24 h of growth (a) and (c) and measurement from a mature biofilm over a longer period of time—172 h (b) and (d). As the biofilm attached and covered the flow cell surface, the surface roughness (a) increased after 16 h. During this time, the maximum thickness (c) of the biofilm increased steadily before stabilizing at a maximum by 24 h. In the longer experiment, roughness (b) and maximum (d) reached stable values after 24 h, though both varied over the remainder of the experiment. The roughness and the maximum were calculated using averaged data from three locations in a single flow cell. Values are a mean of the three locations with standard error bars.
At the beginning of the experiment, prior to inoculating the flow cell with media and P fluorescens, the coverslip was blank with an average surface roughness (Sa) of 0.27 μm and virtually no residue adhered (average height above the baseline was 0.05 μm). As early as 3 h, isolated patches of P fluorescens attached to the viewing window of the flow cell. Small and thin patches of biofilm formed over the first 9 h of experiment before forming larger interconnected features at 16.5 h (see Fig. 7). The biofilm contained sections of different heights, and some spacing was evident between biofilm-covered sections. By 24 h, the biofilm spread to cover the entire viewing area and appeared to have reached a mature state, since it had reached its maximum thickness (this result was also seen in subsequent experiments as illustrated in Fig. 8). At 48 h, the average roughness increased to 1.70 μm and the maximum thickness of the biofilm was 17.74 μm.
Figure 8 shows trends for the roughness and the maximum thickness for two separate experiments—one that lasted 24 h and one that lasted 7 days. Much of the biofilm's growth occurred in the first 24 h of flow cell monitoring. During this time, the roughness [Fig. 8(a)] remained low (<0.5 μm) until increasing tenfold by 16.5 h to 2.34 μm. The maximum thickness of the biofilm [Fig. 8(c)] increased exponentially in the first 12–16 h of the experiment and appeared to approach a plateau at 24 h. The difference in the evolution of biofilm thickness and roughness supports the conclusion that isolated cells attached to the surface and grew in height prior to combining together and covering the viewing area. Variation in the roughness and thickness values is indicative of heterogeneity in the biofilm structure. The increased thickness suggests a proliferation of viable cells.
Figures 8(b) and 8(d) show that the biofilms did reach maturity around 24 h—both the maximum value and the surface roughness stabilized and reached equilibrium for the remainder of the 7 day imaging period. The data show a slight decline in roughness from the peak at 72 h which may be a result of continued maturation of the biofilm's extracellular matrix. It is possible that the shear force of liquid flow and the constraints of the growth chamber of the flow cell limited the biofilm growth.24 Surface roughness variation may also result from the perpetual loss and regrowth of the biofilm, a process common to the lifecycle of biofilms that would have been accentuated by the presence of air bubbles for imaging.25 Interrupting the flow of nutrients for imaging may also have played a role. In future studies, we aim to examine these impacts.
D. Imaging structural transitions in response to perturbations
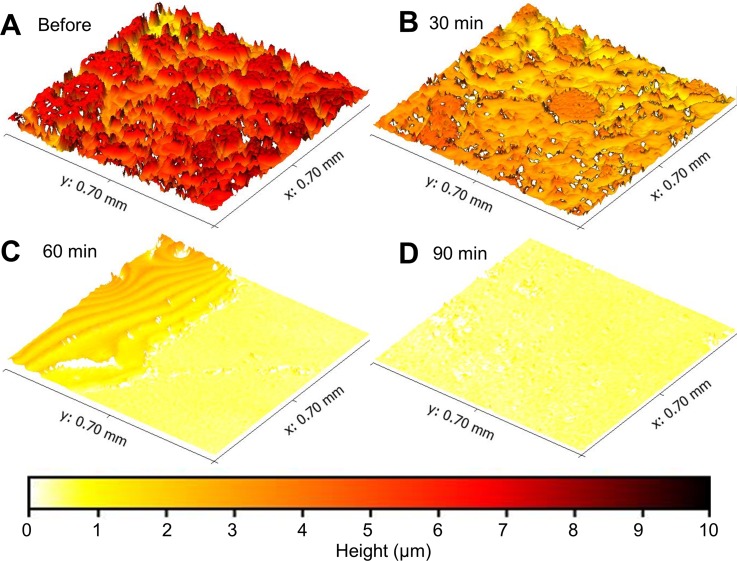
A final experiment was conducted to observe the dynamics of biofilm structure in response to an external perturbation. The growth environment was disrupted with a dilute sodium hypochlorite solution that was expected to kill microbes in the biofilm. Figure 9 shows a biofilm grown in the flow cell for 7 days and the effects of sodium hypochlorite over a 90 min period. The biofilm's initial structure was typical—heterogeneous interconnected colonies covered the viewing area. After exposure to diluted sodium hypochlorite solution for 30 min, the biofilm's surface texture was similar, but the biofilm decreased in thickness by 18%. After 1 h, however, it was clear that the structure of the biofilm was disrupted by the environmental perturbation and had mostly been detached from the viewing window. The upper left edge of Fig. 9(c) appears to show a liquid residue. This liquid residue could have resulted from leftover media forming a thin film on the glass surface due to hydrogen bonding to the surface. Imaging artefacts cause the ripples that are visible in this region and also result in an exaggeration of the roughness of the surface. With WLI imaging, it is difficult to distinguish multiple interference fringes from films that are thinner than the wavelength of incident light.26 After 90 min of sodium hypochlorite exposure, some debris remained, but the original structure of the biofilm was no longer evident. This experiment demonstrates an ability to use interferometric imaging to observe antibacterial and anti-biofilm effects of a common chemical treatment. In the future, this method could be used to quantify the efficacy of biofilm targeted drugs and therapies.
FIG. 9.
The structure of a mature biofilm was disrupted by the environmental perturbation of sodium hypochlorite (bleach). Images were taken before (a) and 30 min (b), 60 min (c), and 90 min after (d) introduction of 0.525% sodium hypochlorite into the flow cell. Color corresponds to biofilm thickness as shown in the color bar.
IV. DISCUSSION
The aim of this work is to describe and demonstrate the use a flow cell for dynamic live biofilm imaging using WLI. Direct in situ measurements of surface topology of the development stages of a bacterial biofilm was enabled through repeated minimally-destructive imaging. The flow cell and the method described here were used to observe transitions in a bacterial biofilm as perturbation was introduced into the imaging cell. This work is an important first step towards future studies using WLI to monitor biofilm processes in order to study antibiotic resistance or to evaluate new therapies for diseases such as cystic fibrosis, periodontitis, and infections on indwelling medical devices.
A. Advantages and limitations
WLI imaging has strong potential to advance the study of biofilm structure because it can record high resolution 3D surface profiles in a fast non-destructive measurement. It is worth reiterating that the axial resolution of WLI is on the order of 3–5 nm, which is far below the diffraction limit that restrains other optical imaging techniques. In fact, the resolution is on par with that of electron microscopy. Imaging biofilms with WLI is a significant step because imaging can be done on living samples under wet conditions and without the use of fluorescent labels or reflective particles.
This powerful technique has not been used extensively for bioimaging because WLI requires a strongly reflective interface. Traditionally, it has been used to image hard reflective surfaces and has not been optimized for the soft hydrated interface of a biofilm. The only previous example of WLI imaging of soft films used magnetic microreflectors.15 This has the advantage of offering the opportunity to measure mechanical properties, though with a biofilm, the particles may have unknown effects on bacterial growth. Creating a label-free microfluidic imaging chip for WLI required careful consideration of the growth requirements, optical requirements, and the need to use air to create a reflective interface over the biofilm.
While WLI is traditionally a non-contact imaging technique, the imaging process described here requires contact of air with the biofilm's surface. This certainly has an impact on the biofilm and the type of image that can be collected. It is likely that the air bubble compresses or removes some pieces of biofilm. More frequent imaging would have an even larger effect, though automation of the air and fluid transport could help minimize negative impacts. When collecting biofilm images, it was important to ensure complete coverage by the air bubble over the viewing area in order to avoid misinterpretation of data (e.g., presuming biofilm is not present when it is merely not visible).
WLI also requires measurable fringe contrast to determine the vertical position of each pixel, so regions with steep slopes (≳75°) or non-reflective surfaces do not generate height data. In these cases, the resulting profile image will have points or regions of missing data (data dropout), although usually a great deal can still be inferred from incomplete renderings.27 Generally, the amount of missing data for each profile image was approximately less than 15%, and surface metrology metrics can be accurately measured by excluding any missing data points. Also, WLI cannot resolve overhangs that occur when biofilms bloom into mushroom shapes. Further research is needed to understand, overcome, or mitigate these limitations.
V. CONCLUSIONS
A microfluidic flow cell was used to demonstrate dynamic imaging of live biofilms using white light interferometry. Pseudomonas biofilms were detected as early as 3 h after initial inoculation, and measurements were made repeatedly on the same sample using non-destructive imaging. By 24 h, the biofilm thickness and roughness plateaued, but morphological changes continued over time. Overall, this first demonstration of dynamic, in situ biofilm imaging with WLI gives encouragement that this method could be used in further studies of biofilm structural dynamics. This method may be used to study the structural changes in mature biofilms and response of biofilm to external perturbations. In future work, this platform may be used to monitor the effects of drugs and therapies that are designed to treat common diseases related to biofilms such as cystic fibrosis and periodontitis.
ACKNOWLEDGMENTS
This work was performed at Pacific Northwest National Laboratories (PNNL), a multi-program national laboratory operated for the United States Department of Energy by Battelle under Contract DE AC06-76RLO 1830. The work was supported by PNNL's Microbiomes in Transition Initiative and the Technology Investment Program.
References
- 1. Stewart P. S., Int. J. Med. Microbiol. 292(2), 107–113 (2002). 10.1078/1438-4221-00196 [DOI] [PubMed] [Google Scholar]
- 2. Di Bonaventura G., Pompilio A., Picciani C., Iezzi M., D'Antonio D., and Piccolomini R., Antimicrob. Agents Chemother. 50(10), 3269–3276 (2006). 10.1128/AAC.00556-06 [DOI] [PMC free article] [PubMed] [Google Scholar]
- 3. Socransky S. S. and Haffajee A. D., Periodontol 2000 28(1), 12–55 (2002). 10.1034/j.1600-0757.2002.280102.x [DOI] [PubMed] [Google Scholar]
- 4. Marsh P. D., BMC Oral Health 6(1), S14 (2006). 10.1186/1472-6831-6-S1-S14 [DOI] [PMC free article] [PubMed] [Google Scholar]
- 5. Høiby N., Bjarnsholt T., Givskov M., Molin S., and Ciofu O., Int. J. Antimicrob. Agents 35(4), 322–332 (2010). 10.1016/j.ijantimicag.2009.12.011 [DOI] [PubMed] [Google Scholar]
- 6. Biteen J. S., Blainey P. C., Cardon Z. G., Chun M., Church G. M., Dorrestein P. C., Fraser S. E., Gilbert J. A., Jansson J. K., Knight R., Miller J. F., Ozcan A., Prather K. A., Quake S. R., Ruby E. G., Silver P. A., Taha S., van den Engh G., Weiss P. S., Wong G. C. L., Wright A. T., and Young T. D., ACS Nano 10(1), 6–37 (2016). 10.1021/acsnano.5b07826 [DOI] [PubMed] [Google Scholar]
- 7. Teodósio J. S., Simões M., Melo L. F., and Mergulhão F. J., Biofouling 27(1), 1–11 (2011). 10.1080/08927014.2010.535206 [DOI] [PubMed] [Google Scholar]
- 8. Azeredo J., Azevedo N. F., Briandet R., Cerca N., Coenye T., Costa A. R., Desvaux M., Di Bonaventura G., Hébraud M., Jaglic Z., Kačániová M., Knøchel S., Lourenço A., Mergulhão F., Meyer R. L., Nychas G., Simões M., Tresse O., and Sternberg C., Crit. Rev. Microbiol. 43(3), 313–351 (2017). 10.1080/1040841X.2016.1208146 [DOI] [PubMed] [Google Scholar]
- 9. Karimi A., Karig D., Kumar A., and Ardekani A. M., Lab Chip 15(1), 23–42 (2015). 10.1039/C4LC01095G [DOI] [PMC free article] [PubMed] [Google Scholar]
- 10. Salta M., Capretto L., Carugo D., Wharton J. A., and Stokes K. R., Biomicrofluidics 7(6), 064118 (2013). 10.1063/1.4850796 [DOI] [PMC free article] [PubMed] [Google Scholar]
- 11. Greener J., Gashti M. P., Eslami A., Zarabadi M. P., and Taghavi S. M., Biomicrofluidics 10(6), 064107 (2016). 10.1063/1.4968522 [DOI] [PMC free article] [PubMed] [Google Scholar]
- 12. Devillez A., Lesko S., and Mozer W., Wear 256(1–2), 56–65 (2004). 10.1016/S0043-1648(03)00384-3 [DOI] [Google Scholar]
- 13. Holme B. and Lunder O., Corros. Sci. 49(2), 391–401 (2007). 10.1016/j.corsci.2006.04.022 [DOI] [Google Scholar]
- 14. Conor O. M., Martin H., Magali B., Russell D., and Alan M., Meas. Sci. Technol. 14(10), 1807 (2003). 10.1088/0957-0233/14/10/310 [DOI] [Google Scholar]
- 15. Reed J., Walczak W. J., Petzold O. N., and Gimzewski J. K., Langmuir 25(1), 36–39 (2009). 10.1021/la8033098 [DOI] [PMC free article] [PubMed] [Google Scholar]
- 16. Larimer C., Suter J. D., Bonheyo G., and Addleman R. S., J. Biophotonics 9(6), 656–666 (2016). 10.1002/jbio.201500212 [DOI] [PubMed] [Google Scholar]
- 17. Larimer C., Brann M., Suter J. D., and Addleman R. S., Opt. Eng. 56(11), 111708–111708 (2017). 10.1117/1.OE.56.11.111708 [DOI] [Google Scholar]
- 18. Larimer C., Brann M., Suter J. D., Bonheyo G., and Addleman R. S., Proc. SPIE 9960, 996004–996010 (2016) 10.1117/12.2239375. [DOI] [Google Scholar]
- 19. Stover C. K., Pham X. Q., Erwin A., Mizoguchi S., Warrener P., Hickey M., Brinkman F., Hufnagle W., Kowalik D., and Lagrou M., Nature 406(6799), 959–964 (2000) 10.1038/35023079. [DOI] [PubMed] [Google Scholar]
- 20. Bodey G. P., Bolivar R., Fainstein V., and Jadeja L., Rev. Infect. Dis. 5(2), 279–313 (1983). 10.1093/clinids/5.2.279 [DOI] [PubMed] [Google Scholar]
- 21. Costerton J. W., Stewart P. S., and Greenberg E. P., Science 284(5418), 1318–1322 (1999). 10.1126/science.284.5418.1318 [DOI] [PubMed] [Google Scholar]
- 22. Rumbaugh K. P., Griswold J. A., and Hamood A. N., Microbes Infect. 2(14), 1721–1731 (2000). 10.1016/S1286-4579(00)01327-7 [DOI] [PubMed] [Google Scholar]
- 23. Zhang X., Bishop P. L., and Kupferle M. J., Water Sci. Technol. 37(4–5), 345–348 (1998) 10.1016/S0273-1223(98)00127-9. [DOI] [Google Scholar]
- 24. Picioreanu C., Van Loosdrecht M. C., and Heijnen J. J., Biotechnol. Bioeng. 72(2), 205–218 (2001). [DOI] [PubMed] [Google Scholar]
- 25. Donlan R. M., Emerging Infect. Dis. 8(9), 881–890 (2002). 10.3201/eid0809.020063 [DOI] [PMC free article] [PubMed] [Google Scholar]
- 26. Fay M. F. and Dresel T., Proc. SPIE 9960, 996005–996009 (2016) 10.1117/12.2238997. [DOI] [Google Scholar]
- 27. Schmit J., Reed J., Novak E., and Gimzewski J. K., J. Opt. A: Pure Appl. Opt. 10(6), 064001 (2008). 10.1088/1464-4258/10/6/064001 [DOI] [Google Scholar]


