Abstract
Therapeutic ultrasound can in cases drive bubble activity that damages soft tissues. To study potential mechanisms of such injury, transparent agar tissue-mimicking phantoms were subjected to multiple pressure wave bursts of the kind being considered specifically for burst wave lithotripsy (BWL). A highspeed camera recorded bubble activity during each pulse. Different agar concentrations were used to alter the phantom’s mechanical properties, especially its stiffness, which was varied by a factor of 3.5. However, the maximum observed bubble radius was insensitive to stiffness. Bubbles appeared continuously during the 1000 wave bursts of a candidate BWL treatment over a region that expands slowly, primarily toward the transducer. Denser bubble clouds are formed at higher pulse repetition frequency. The specific observations are used to inform the incorporation of damage mechanisms into cavitation models for soft materials.
Keywords: cavitation, bubble dynamics, bubble cluster, viscoelastic medium, agar phantom, burst wave lithotripsy, tissue injury
Introduction
Acoustic cavitation is common in biomedical applications of ultrasound. It can be used for mechanical fractionation in histotripsy, which produces and maintains a dense bubble cloud for controlled tissue liquefaction. In typical cases, it is driven by short (< 50 μs) ultrasound pulses at low duty cycles (< 1%), with peak positive pressure of up to ~ 100 MPa and peak negative pressure of up to ~ 20 MPa (Wang et al., 2012; Roberts et al., 2006; Vlaisavljevich et al., 2014). Tissue ablation is achieved by fractionation into a liquified acellular homogenate (Xu et al., 2004; Hall et al., 2007; Hempel et al., 2011). High-intensity pressure waves are also delivered in shock-wave lithotripsy (SWL), currently the most common treatment for kidney stone comminution. It too is a multiple-pulse process; typical treatments entail more than 1000 compressive ≳ 20 MPa shocks followed by weaker (up to ~ 10 MPa) rarefactions (Evan et al., 1998, 2002; Bailey et al., 2005). The particular therapy that motivates the present effort is a novel technology presented as a potential alternative to SWL called burst wave lithotripsy (BWL). Instead of shocks, it uses high-intensity bursts of focused ultrasound to fragment kidney stones. The control available in BWL, particularly wave frequency and pressure amplitude, is hoped to provide flexibility in tailoring the incident pulse for safer and faster treatments. In some cases, BWL has been shown capable of breaking natural and artificial stones at pressure levels that do not cause injury (Maxwell et al., 2015). However, treatment with high-intensity focused ultrasound (HIFU) naturally risks collateral damage to tissue. A goal is to design general BWL techniques and procedures that avoid such injury, which may occur similarly to what has been reported for SWL (Evan et al., 1998, 2002; Bailey et al., 2005). Understanding mechanisms and thresholds will guide this and maintain safety. For BWL, we seek to document and understand the mechanisms of bubble activity in tissue-like materials.
To pursue this objective, we designed the experiment shown in figure 1 for a series of investigations of bubble dynamics induced by BWL bursts in gel phantoms. To facilitate observations, transparent agar hydrogels are used (Daniels et al., 1987). Gel stiffness depends on the agar concentration, which is adjusted. We note, in doing this, that the BWL pulse used in this work has a higher intensity than what expected to be necessary for kidney stone comminution to facilitate the formation and observations of bubble clusters in agar phantoms. These particular measurements are designed to inform the development of cavitation-induced damage models in soft materials, specifically a Rayleigh–Plesset-like bubble dynamics and damage model (Movahed et al., 2016).
Figure 1.
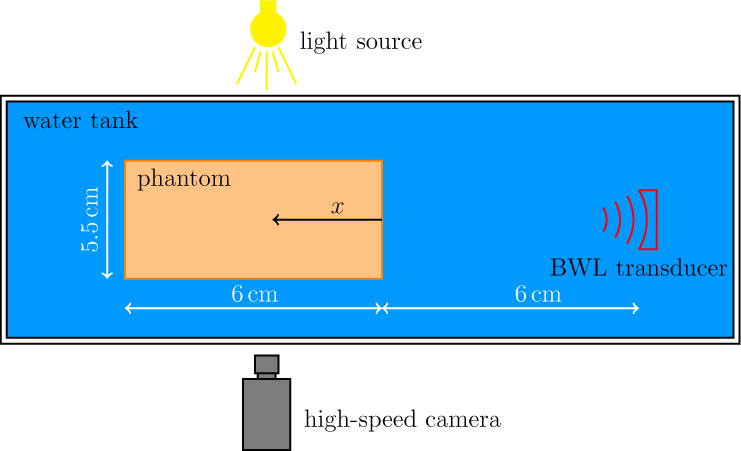
Schematic of the experimental set-up (not to scale).
While our focus is on cavitation in tissue-mimicking soft materials for their transparency, ultrasound-induced cavitation has also been reported in both ex vivo and in vivo tissues. Vlaisavljevich et al. (2015) studied the role of ultrasound frequency and tissue stiffness on the intrinsic threshold for histrotripsy driven cavitation. Passive cavitation detection was used for a histotrpsy pulse with 1–2 cycles and frequencies in the range between 345 kHz and 3 MHz, and it was concluded that the possibility of bubble cloud formation is not significantly impacted by tissue stiffness or ultrasound frequency. In another study, a HIFU-guided therapy was developed for noninvasive tissue ablation in a pig model (Khokhlova et al., 2014). It was shown that HIFU-induced bubbles are capable of destroying the target tissue by mechanical disruption (rather than thermal heating).
The experimental set-up, measured BWL waveforms, and agar phantom preparation and mechanical properties are described in the following section. This is followed by the main experimental observations of bubble clusters in agar phantoms with different stiffnesses, such as shown in figure 2, are presented and examined. Different statistics of the geometry of identified bubbles such as radius, orientation, and aspect ratio are quantified. Most bubbles appear to remain nearly circular in the imaged plane and a Rayleigh–Plesset-type bubble dynamics model with damage (Movahed et al., 2016) is applied to explain on the experimental observations. The bubble cluster tends to move toward the transducer as it develops after consecutive bursts. This behavior is also observed in thermal high-intensity focused ultrasound (HIFU) (Watkin et al., 1996; Meaney et al., 2000; Khokhlova et al., 2006) and is quantified here by tracking the centroid of all bubbles. The main conclusions are summarized in the final section.
Figure 2.
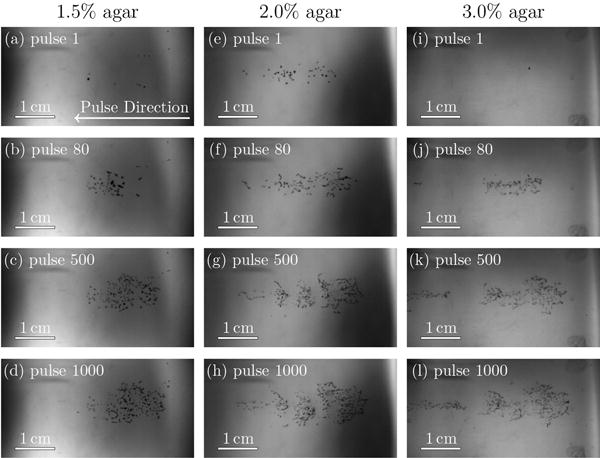
Bubbles in agar gels with properties as labeled. The region shown is 4.42 cm × 2.27 cm. The BWL pulse has 20 nominal cycles with base frequency 335 kHz, peak negative amplitude of 7.51 MPa and repeats at 200 Hz. Images are shown at 10 cycles into the pulse number as labeled.
Materials and Methods
BWL system
A schematic of the experiment is shown in figure 1. A piezoelectric ultrasound transducer driven by a by a DE1 field-programmable gate array logic board (Altera, San Jose, CA, USA) with frequency of 335 kHz generates the focused BWL pulses. The transducer has an array of six focused elements, each with diameter 38 mm and radius of curvature 120 mm. The overall aperture of the transducer array was 110 mm × 104 mm. The effective beam axial and lateral width are 58 mm and 6 mm, respectively. This nominal focus region was the center of the agar target, which was suspended in a degassed water bath. Pulse repetition frequencies (PRF) were 40, 100, and 200 Hz.
A 20000 frames per second camera (APX-RS, Photron USA, Inc., San Diego, CA) with a Nikkor-P lens (Nikon, Japan) and a continuous backlight source was used to record shadowgraphic images of bubble activity. The camera was triggered to record 1 image for each BWL pulse applied at 10 cycles into that particular pulse. The exposure time was 4 μs for all images. As set up, the camera pixel resolution is 58 μm.
Focal pressure
A FOPH2000 fiber-optic hydrophone (RP Acoustics, Leutenbach, Germany) in a degassed water bath was used to measure the focal pressures shown in figure 3. The pulse is well-fitted by
| (1) |
where
| (2) |
accounts for the asymmetric peak amplitude. In these measurements, the ambient pressure is pamb = 0.1 MPa, is the peak negative amplitude, is the peak positive amplitude, f = 335 kHz is the frequency, n = 10 is the nominal number of cycles, and τ1 = 5 μs and τ2 = 12 μs are the rise and fall times for the pulse envelop.
Figure 3.
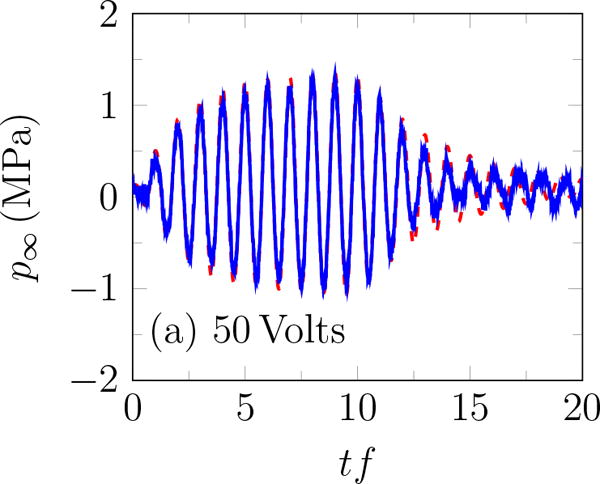
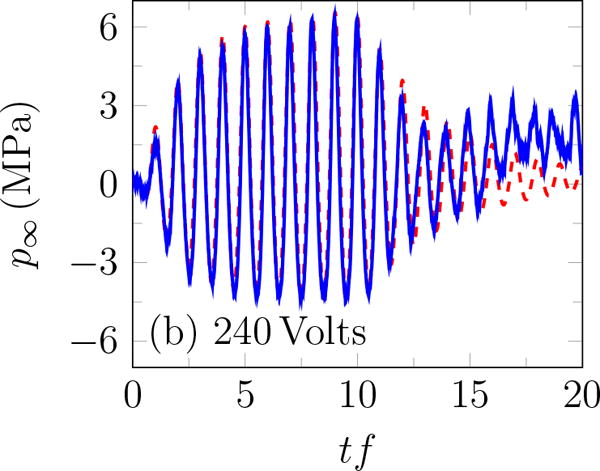
Incident BWL pulse with n =10 cycles, and f = 335 kHz; modeled based on (1) – – and measured experimentally —.
The rough appearance of the trace at the end of the pulse for 240 Volts (figure 3 b) is an artifact of cavitation on the hydrophone (Maxwell et al., 2013), which unfortunately precludes accurate measurement of higher-amplitude waveforms. Thus, measurements were for up to transducer voltage of 240 Volts. The peak positive and negative pressures increase approximately linearly with the transducer voltage (figure 4 a), with the peak positive pressure about 35% higher than the corresponding negative pressure for ≥ 200 Volts, as shown in figure 4 b. A linear fit to the data suggests
| (3) |
where V is the applied voltage on the transducer. Based on (3), and are estimated to be 7.51 and 10.09 MPa for 383.3 Volts. The pressure amplitude is approximately constant for more than 10 cycles. Except where noted, pulses had 20 cycles with base frequency 335 kHz, peak negative amplitude of 7.51 MPa and repeated at 200 Hz. The hydrophone was more prone to cavitation for more cycles, which is why only 10 cycles were used here. As is clear in the figure, this was sufficient for measuring the ring-up and ring-down periods as well as the quasi-steady signal in between.
Figure 4.
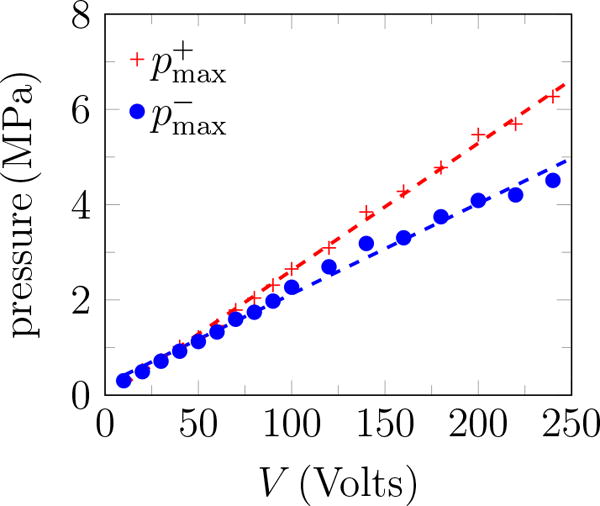
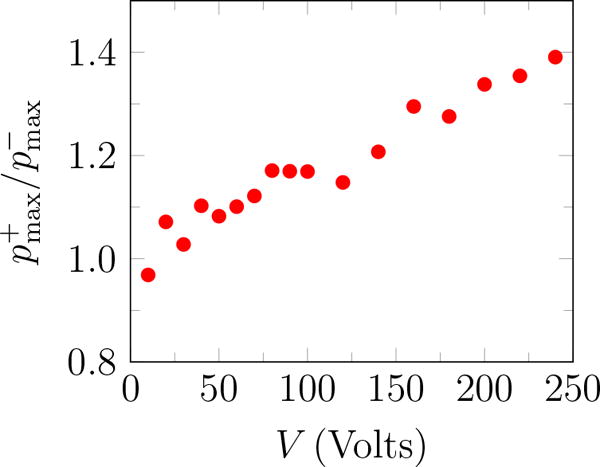
Pressure measurements at the focal point: (a) peak positive and negative pressure; and (b) and the ratio of the peak positive to the negative pressure.
Agar phantoms
Agar hydrogels are commonly used as phantoms to mimic tissue (Daniels et al., 1987; Dunmire et al., 2013; Vlaisavljevich et al., 2014). Ours were prepared with agar concentrations from 1.5% to 3.0% w/v and with a water:dimethyl sulfoxide (DMSO; 99% purity, FWI, Tulsa, OK) ratio of 30:20, to improve optical clarity following established protocols (Hall et al., 1997; Hyon et al., 1989; Dunmire et al., 2013). To minimize gas content, the agar, DMSO, and water were mixed and heated to boiling on a magnetic stir plate. The solution was then let cool to 70°C, whereupon it was poured into a plastic 5.5 cm × 5.5 cm × 6 cm mold. The solution was covered and allowed to cool to room temperature and solidify. After solidification, the phantom was rinsed with water for a day such that the DMSO is replaced with water to minimize optical diffraction by DMSO gradient within the gel phantom.
The elastic resistance of agar phantoms increases with increasing agar concentration (Normand et al., 2000). We measured the small-strain Young’s modulus Y for different agar concentrations with microindentometry (Choi and Shield, 1981) to be 105, 175, and 347kPa for 1.5%, 2.0%, and 3.0% agar phantoms, respectively.
Results
Each agar phantom was exposed to 1000 bursts of the kind shown in figure 3, though with 20 cycles. This was repeated 10 times for each agar concentration at the same site. During the initial pulses, only isolated bubbles are observed, as seen in figure 2. It is thought that these first bubbles arise from bubble nuclei with initial radius of ≲ 1 μm, which are distributed within each gel but not resolved with these measurements. The tensile portions of the delivered bursts cause these to expand sufficiently to become visible. The bubble dynamics are fast, so we must be cognizant of the framing rate and exposure time in making our assessments of bubble dynamics based upon the images. The camera frame rate was set to match the PRF so there is one image per pulse. The exposure time was 4 μs, and images were recorded at the pulse midpoint, 10 cycles into the pulse. This is the smallest exposure time that provides sufficient backlight. Based on a Rayleigh–Plesset model, the bubble period is expected to match the 2.98 μs period of the BWL pulse (Movahed et al., 2016), so the exposure time of 4μs is expected to be long enough to capture the bubble throughout a full cycle of oscillation. Hence, even though the backlit images are expected to exhibit some motion-induced blur, the extent of the observed shadow provides an estimate of the maximum bubble radius. It was noted that the bubble clouds, such as in figure 2, might appear to have a structure, but no specific and repeatable patterns were quantified.
Bubble identification and statistics
To quantify bubbles, a background image is first subtracted from the raw grayscale images, such as in figure 2, to remove the backlight non-uniformity. Then, linear interpolation is used to obtain the intensity on a four-times finer grid. This makes subsequent identification of angles less sensitive to the pixel-size of the images. Finally, images were converted to binary black and white based on an intensity threshold following Otsu’s well-established method (Otsu, 1975) as implemented in the graythresh function in image-processing software (MATLAB; The MathWorks, Natick, MA, USA).
The total viewed area of all identified bubbles is designated ϕ and plotted in figure 5, which quantifies the bubble coverage as more pulses are delivered to the same site (figure 2). A fatigue based model for this was developed and reported elsewhere (Movahed et al., 2016). That work suggests that material fatigue and eventual irreversible fracture-like failure is responsible for the observed behavior. Herein we focus on new observations regarding the evolution of the bubbles undergoing inertial cavitation. Since bubble activity is wide spread and persistent, it is expected to be generally important for tissue injury.
Figure 5.
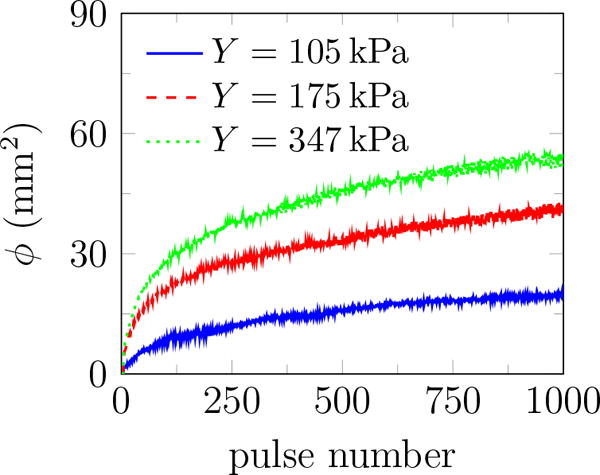
The total area of all identified bubbles ϕ versus pulse number. Each curve is an average over 10 trials for each gel stiffness.
To quantify the geometry and orientation of bubbles, an ellipse is fitted to each identified bubble in the black and white images as implemented in the regionprops routine of MATLAB (figure 6) (Hamaguchi and Ando, 2015). The fitted ellipse has the same normalized second central moments as the white region in black and white images (Haralock and Shapiro, 1992). Then, a radius-like bubble length scale is defined
| (4) |
Ratio of major to minor axes β of the fitted ellipse shown in figure 6 measures the bubble circularity. Consequently, we report data for β less than 1.05 and 1.1 to restrict the statistics only to nearly circular features based on their two-dimensional projection images. Examples of the identified bubbles for different thresholds are shown in figure 7. The maximum bubble radius Rmax is calculated for each of the N = 104 images, and the average maximum bubble radius and its standard deviation are defined as
| (5) |
These are reported in figure 8 for different agar concentrations, which shows stiffness insensitivity. It also confirms that these results are insensitive to the threshold for values of β, though increasing this threshold also increases , since less circular features are also included in the average in this case. However, the conclusion is insensitive to this: is insensitive to elastic resistance for the considered range (105 kPa ≤ Y ≤ 347 kPa). Insensitivity of to stiffness and observations of more bubbles for stiffer gels (figure 5) imply that the bubble number density increases with agar concentration. This suggests that higher agar concentration leads to more nucleation sites.
Figure 6.
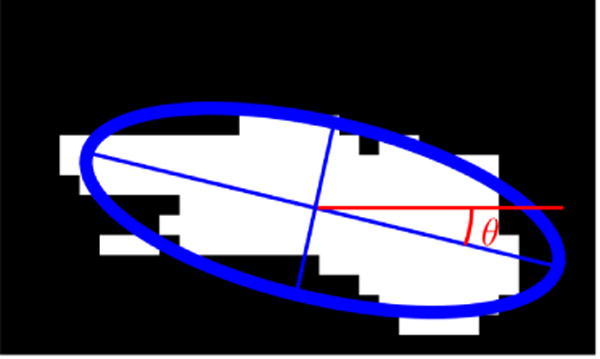
An example of fitted ellipse to an area with bubble activity in the image processing software. θ represents the angle between the major axis of the fitted ellipse and a horizontal line parallel to the transducer axis.
Figure 7.
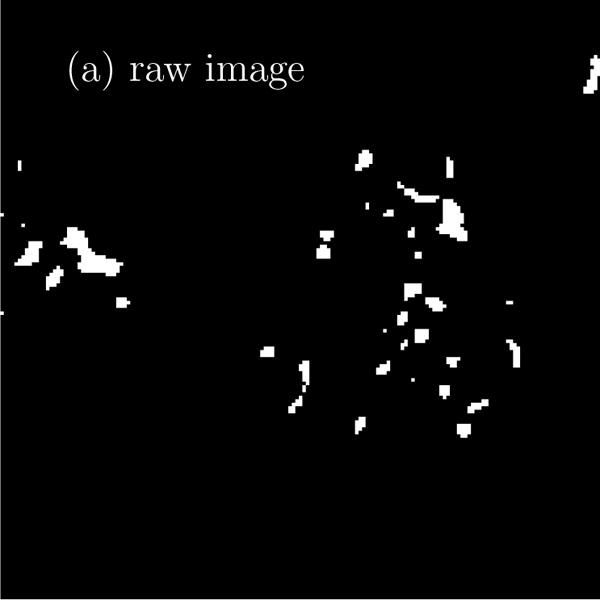
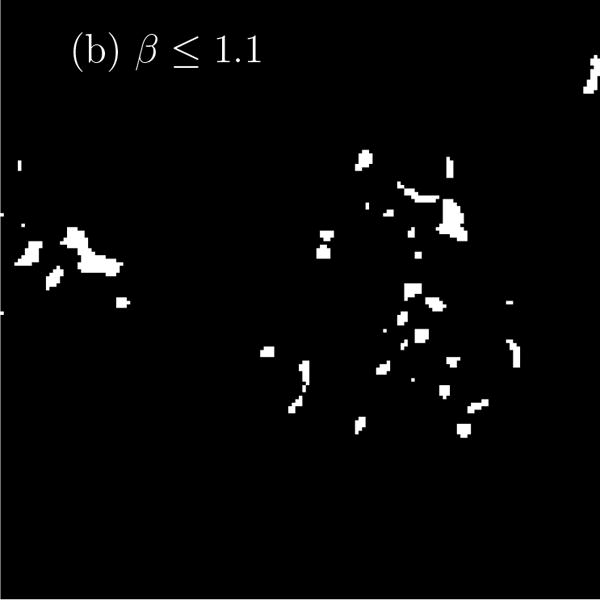
Examples of bubble identification for β ≤ 1.1 in the image processing software. Identified circular bubbles are marked with a red circle.
Figure 8.
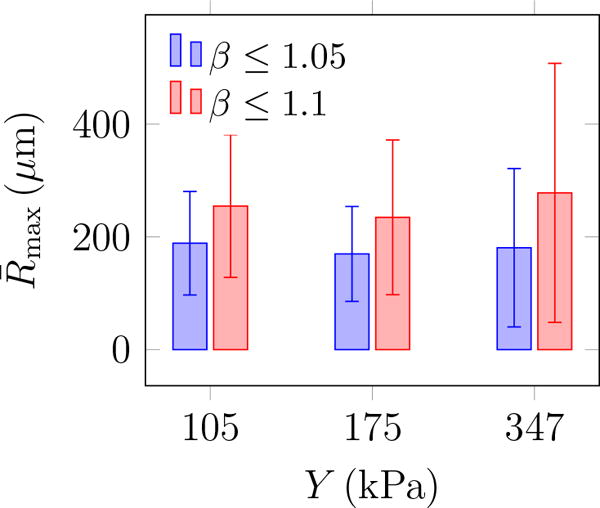
The average maximum bubble radius and its standard deviation (error bars) from (5) for different values of Young’s modulus.
Additional geometric information can be quantified based on the fitted ellipses: the inclination angle θ relative to the burst propagation (see figure 6), the asymmetry via the ratio of the major to minor axis β, and of course the perimeter L and area A. The probability density function (PDF) of all features is shown in figure 9. The PDF determines the possibility of a random variable V falling within a specific range. The PDF is always positive and satisfies
| (6) |
PDF(θ) shows that these features are distributed at different angles. The most observed orientation is parallel to the transducer axis. Since β = 1 for a circle, the β distribution shows that indeed most features are nearly circular, with probabilities of larger β decreasing rapidly. Features with β longer than 4 are essentially not observed. For nearly circular features, Rayleigh–Plesset-type bubble dynamics models are expected to be a good representative of the overall dynamics of observed bubbles and will be discussed in the subsequent section. Though the maximum observed bubbles sizes are insensitive to the gel stiffness, the most probable show a clear trend. The most expected value for bubble radius 〈R〉 based on the probability distributions for either area or perimeter as illustrated in figure 10 show that it decreases with Y. Physical interpretation of Rmax and 〈R〉 and their dependence on Y is discussed in the subsequent section.
Figure 9.
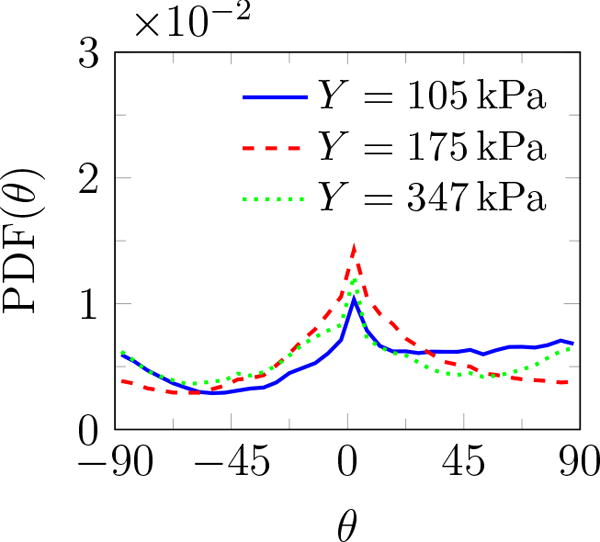
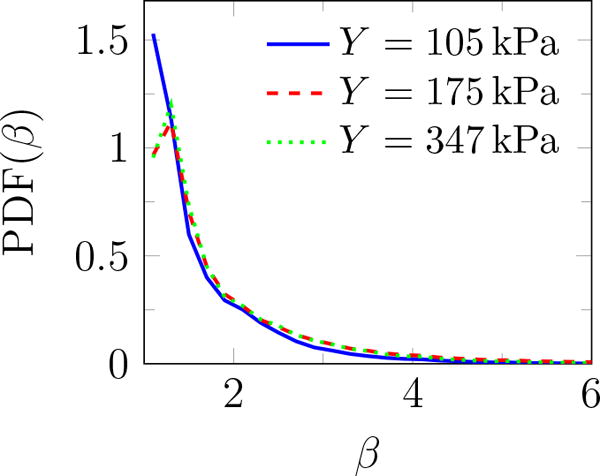
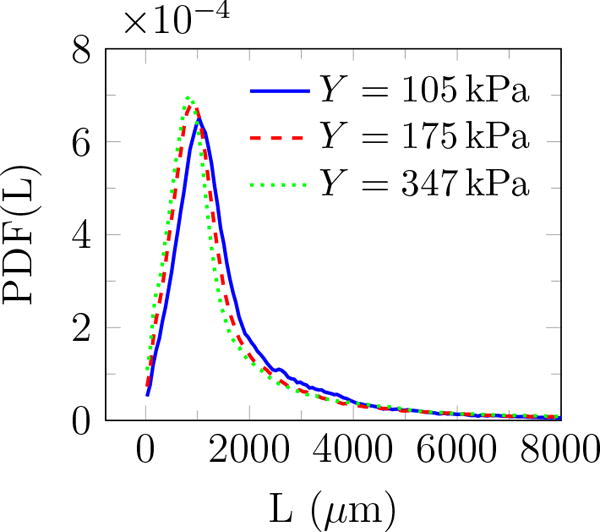
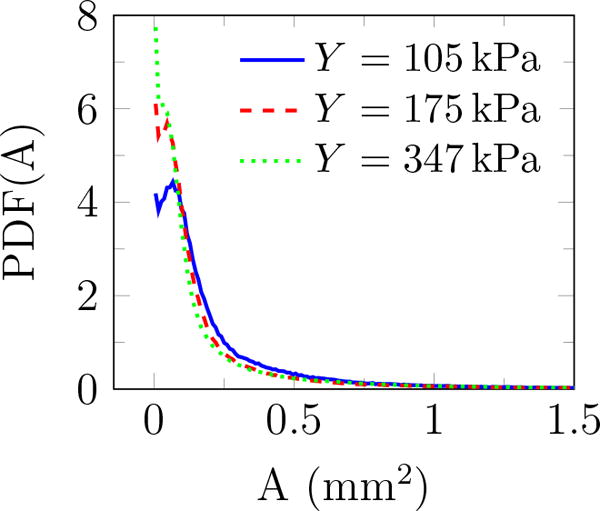
Probability density function of (a) angle θ (figure 6), (b) major to minor axis ratio β, (c) perimeter L, and (d) area A of features observed for different gel stiffnesses.
Figure 10.
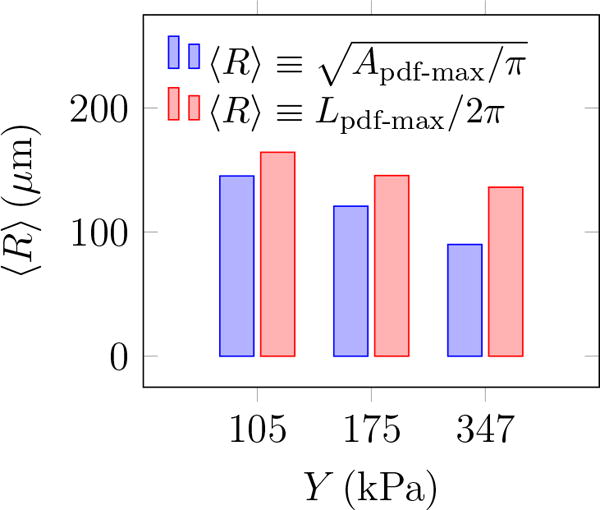
The most expected bubble radius for different agar gel stiffness.
Isolated single-bubble dynamics simulations
The Rayleigh–Plesset equation (Rayleigh, 1917; Plesset and Prosperetti, 1977) describes the dynamics of a bubble with finite surface tension in a viscous incompressible Newtonian fluid subjected to far-field pressure variation. Here, the basic formulation has been augmented to include the effect of finite-deformation elasticity on bubble dynamics in viscoelastic soft materials. The elastic response of the infinite surrounding medium has already been extended to linear elastic, neo-Hookean, and Fung models (Yang and Church, 2005; Movahed et al., 2016). These models quantify confinement mechanisms of bubbles within soft materials. On top of this, the material close to the bubble surface can be highly strained, with the consequence of potential irreversible damage that degrades elastic and viscous characteristics. The onset of damage is determined from the fracture theory.
We further augment a Rayleigh-Plesset-like bubble dynamics model with fracture-like damage mechanisms (Movahed et al., 2016) to describe the simultaneous elastic insensitivity of and sensitivity of 〈R〉. In this description, the bubble dynamics is governed by (Movahed et al., 2016)
| (7) |
where R is the bubble radius, and are velocity and acceleration at the bubble surface, c = 1480 ms−1 and ρ = 1012.8 kgm−3 are the sound speed and the density of the surrounding medium, respectively, and
| (8) |
where pB is the internal bubble pressure modeled as a polytropic gas, p∞ (t) is the pressure of the passing BWL pressure pulse, S = 0.073 N/m is the surface tension, μ is the viscosity, and E represents the confinement effects of elasticity (Movahed et al., 2016). The viscoelastic behavior of the gel is represented by a nonlinear Kelvin–Voigt model, and its strain hardening is represented by the Fung model. Under cyclic large deformation, stress softening is expected (Martins dos Santos et al., 1997) and is represented by the factor α. Full details of the model are presented elsewhere (Movahed et al., 2016).
Viscosity measurements are not available yet at our specific conditions, which involve both high strain and high strain rate. However, there is sufficient data to support that agar gels are highly viscous. Here we report results for μ = 1.0 Pa s, and different values of the fatigue factor α, though our conclusions do not hinge on these specific values. The simulated maximum bubble radius with initial radius of 0.1 μm exposed to a BWL pulse with 10 cycles is shown in figure 11 for α between 0 and 1, which corresponds to intact and fully damaged conditions, respectively. The BWL pulse is approximated using (1), and a pulse with 10 cycles are considered since camera images were recorded after 10 cycles. With this interpretation, for our experiments the maximum observed bubble radius occurs at highly damaged sites in which the maximum bubble radius becomes insensitive to gel’s stiffness, in agreement with our experiments. On the other hand, the expectation radius (R) is based on the distribution and includes also cavitation sites with lower extent of damage in which the maximum bubble radius remains sensitive to gel’s stiffness. Thus, as observed, 〈R〉 should depend on the gel’s stiffness.
Figure 11.
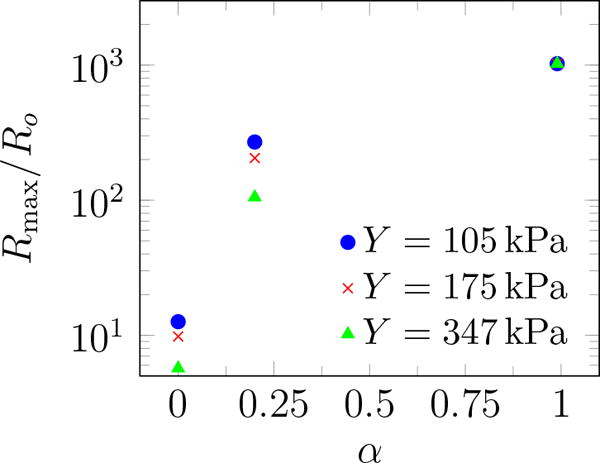
Simulated maximum bubble radius vs. fatigue factor α for different agar gel stiffness.
Cloud evolution
Images such as in figure 2 suggest that regions with bubble activity migrate toward the transducer. To quantify this, we define a nominal centroid of all bubbles
| (9) |
where N is the number of observed bubbles, and xi and Ai are the centroid and area of each (figure 12 a). Though there are fluctuations in Cx due to an apparently stochastic character of the bubbles, figure 12 b shows that Cx consistently decreases similar to that reported in thermal HIFU (Watkin et al., 1996; Meaney et al., 2000; Khokhlova et al., 2006).
Figure 12.
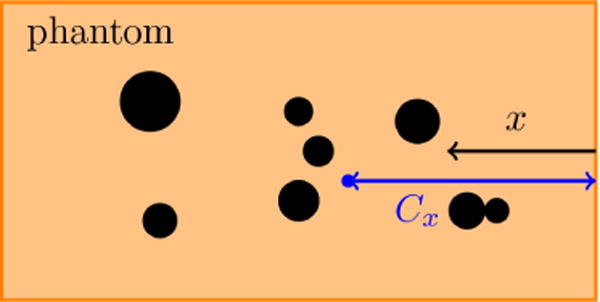
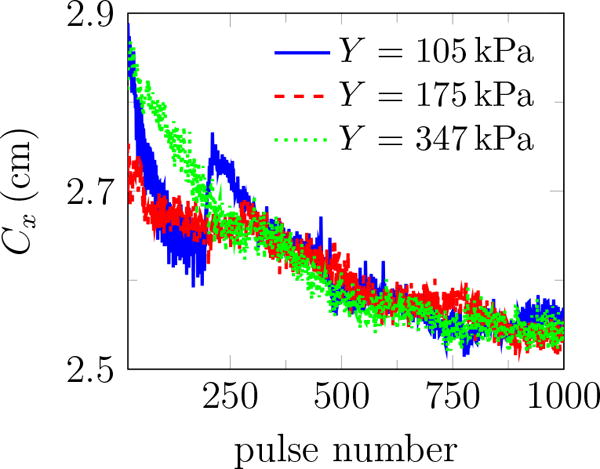
(a) schematic of the centroid of all bubbles Cx within the gel, (b) the centroid of all bubbles Cx vs. pulse number for different agar concentrations. Bubbles tend to move toward the transducer. The reported data are the average of 10 trials in each gel.
Since thermal heating is thought to dominate material degradation in HIFU, lesion evolution of this kind was described by a so-called bioheat (Pennes, 1948) equation, which includes thermal conduction, attenuation-based models for ultrasound energy deposition (Kolios et al., 1996; Robinson and Lele, 1972), both convective and perfusion-driven cooling, and thermal capacity of the tissue (Coussios and Roy, 2008). Numerical solutions (Meaney et al., 2000) suggest that the lesion should evolve toward the transducer and that nonlinear wave propagation contributes to this phenomenon. However, the present observation introduces a curious question. With duty cycle of 1.2%, the estimated mean energy deposition rate excluding bubble-enhanced heating (Coussios and Roy, 2008) is
| (10) |
where γ = 0.9m−1 is the attenuation coefficient for agar gel (Zell et al., 2007) and prms = 6.28 MPa is the root mean square of the BWL pressure pulse. This would elevate the temperature in the focus by only 0.36°C for 1000 pulses. This is small, and the actual rise is anticipated to be smaller since it neglects any cooling. This, in turn, suggests a mechanism for the observed migration that does not involve substantive mean heating. This could be purely mechanical or might involve relatively transient thermal phenomena (Bailey et al., 2001).
Simulation of HIFU suggests that scattering from bubbles in the focal region affects the spreading phenomenology (Chavrier et al., 2000). In these treatments, cavitation may lead to pre-focal heating, movement of lesions toward the transducer and inhomogeneous HIFU-induced lesions in the target area, which is undesirable (Chavrier et al., 2000; Sanghvi et al., 1996). We expect that, similar to thermal HIFU (Chavrier et al., 2000), wave scattering from the bubbles initially excited in agar phantoms increases the pressure pre-focally allowing those bubbles to expand sufficiently to become visible on images, which results in the movement of the centroid of all bubbles toward the transducer as shown in figure 12.
Role of pulse repetition frequency
Previous studies of SWL suggest that reducing the PRF results in better stone fragmentation and consequently, improves the stone passage rate (Paterson et al., 2002; Pishchalnikov et al., 2003; Rassweiler et al., 2011; Pishchalnikov et al., 2006). However, reducing the PRF prolongs treatment time, cost, and patient inconvenience. In general, more cavitation is expected at higher PRF, and rectified diffusion is proposed as a possible mechanism (Crum, 1982; Sapozhnikov et al., 2002). To study the role of PRF on bubble cloud evolution in the context of BWL, we repeated our experiments at PRF=40, 100, and 200 Hz. The rate of bubble-cloud formation is tracked by plotting the total area of all bubbles in figure 13 a. Results for different number of cycles at PRF=200 are also reported in figure 13 b. More bubbles appear continuously for all cases, and ϕ at the last pulse increases monotonically with PRF and number of cycles. This is in agreement with common expectation that extent of cavitation and the subsequent induced damage can be suppressed at lower PRF and fewer cycles per burst for BWL. A better understanding of the role of ultrasound parameters on stone comminution is still needed to optimize this technology. Based on our current investigations, we expect that safe and fast treatment is plausible for PRF between 40 and 200 Hz.
Figure 13.
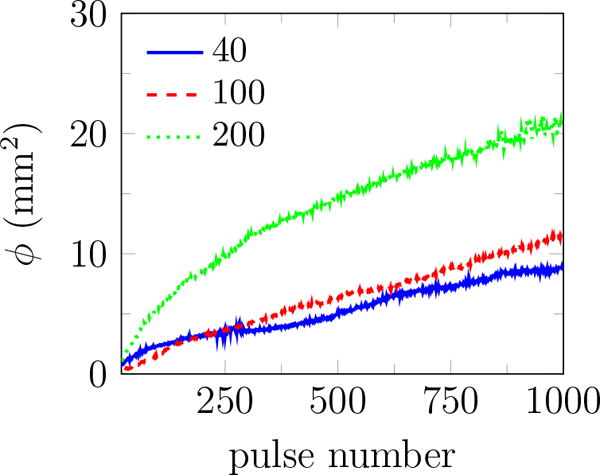
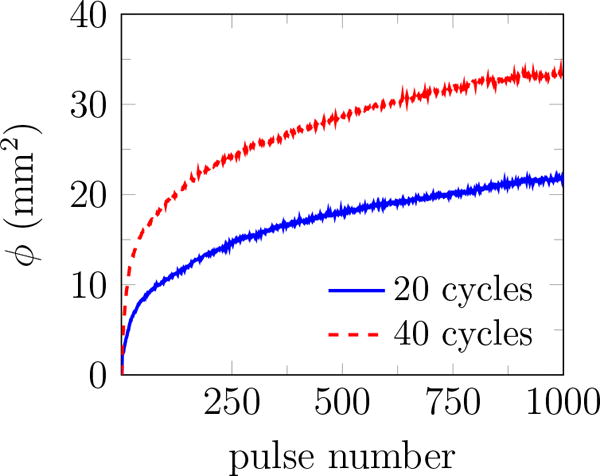
The total area of all identified bubbles ϕ versus pulse number for 2% agar at (a) 20 cycles and different pulse repletion frequencies, and (b) PRF=200 and different number of cycles. Images were recorded at 10 and 30 cycles into the pulse number for 20 and 40 cycle bursts, respectively. The reported results are the average of 10 trials in each gel.
Conclusions
An experimental set-up is developed to investigate cavitation in agar tissue-mimicking phantoms. Gel stiffness is adjusted by varying agar concentration. Bubble observations are reported to inform a class of damage models (Movahed et al., 2016), and motivate the development of cavitation-induced damage models. Images of bubbles in transparent tissue-mimicking agar phantoms from a high-speed camera subjected to BWL pulses showed inertial cavitation at multiple sites during the initial pulses, with further continuous appearance of large bubbles at new locations through the course of the observations. The lag in the onset of cavitation is explained by a Rayleigh-Plesset-type bubble dynamics model with a damage mechanism based on fracture and fatigue (Movahed et al., 2016).
Statistics of the bubble geometry show that most bubbles remain nearly circular. The overall bubble cloud expands and tends to move toward the transducer during consecutive pulses. This is similar to observations for thermal HIFU, but here with energy densities that are not expected to provide any significant heating. The maximum bubble radius Rmax does not depend on the gel’s stiffness, while the most expected bubble radius 〈R〉 has a weak dependence. These statistical observations in agar phantoms are consistent with a fatigue based model of bubble dynamics in a viscoelastic medium (Movahed et al., 2016). The bubble clouds evolve to denser clouds at higher PRF and number of cycles and higher agar concentrations. These observations confirm that BWL, similar to SWL, causes cavitation inside tissue-mimicking phantoms and, consequently, cavitation-induced damage. The current experimental observations show a route for cavitation-induced damage spread inside soft materials. Current observations in soft tissue-mimicking phantoms with concurrent efforts on studying stone comminution by BWL pulses (Maxwell et al., 2015) will guide the development of effective and safe BWL technology.
Acknowledgments
The authors are grateful for fruitful discussions with T. Colonius, K. Maeda, M. R. Bailey and B. Cunitz. This work was supported by NIH NIDDK grant number P01-DK043881 and K01-DK104854.
References
- Bailey MR, Couret LN, Sapozhnikov OA, Khokhlova VA, Ter Haar G, Vaezy S, Shi X, Martin R, Crum LA. Use of overpressure to assess the role of bubbles in focused ultrasound lesion shape in vitro. Ultrasound Med Biol. 2001;27:695–708. doi: 10.1016/s0301-5629(01)00342-8. [DOI] [PubMed] [Google Scholar]
- Bailey MR, Pishchalnikov YA, Sapozhnikov OA, Cleveland RO, McAteer JA, Miller NA, Pishchalnikova IV, Connors BA, Crum LA, Evan AP. Cavitation detection during shock-wave lithotripsy. Ultrasound Med Biol. 2005;31:1245–1256. doi: 10.1016/j.ultrasmedbio.2005.02.017. [DOI] [PubMed] [Google Scholar]
- Chavrier F, Chapelon JY, Gelet A, Cathignol D. Modeling of high-intensity focused ultrasound-induced lesions in the presence of cavitation bubbles. J Acoust Soc Am. 2000;108:432–440. doi: 10.1121/1.429476. [DOI] [PubMed] [Google Scholar]
- Choi I, Shield RT. Second-order effects in problems for a class of elastic materials. Z Angew Math Phys. 1981;32:361–381. [Google Scholar]
- Coussios CC, Roy RA. Applications of acoustics and cavitation to noninvasive therapy and drug delivery. Annu Rev Fluid Mech. 2008;40:395–420. [Google Scholar]
- Crum LA. Nucleation and stabilization of microbubbles in liquids. Appl Sci Res. 1982;38:101–115. [Google Scholar]
- Daniels S, Blondel D, Crum LA, Ter Haar GR, Dyson M. Ultrasonically induced gas bubble production in agar based gels: Part I, experimental investigation. Ultrasound Med Biol. 1987;13:527–539. doi: 10.1016/0301-5629(87)90179-7. [DOI] [PubMed] [Google Scholar]
- Dunmire B, Kucewicz JC, Mitchell SB, Crum LA, Sekins KM. Characterizing an agar/gelatin phantom for image guided dosing and feedback control of high-intensity focused ultrasound. Ultrasound Med Biol. 2013;39:300–311. doi: 10.1016/j.ultrasmedbio.2012.09.016. [DOI] [PubMed] [Google Scholar]
- Evan AP, Willis LR, Lingeman JE, McAteer JA. Renal trauma and the risk of long-term complications in shock wave lithotripsy. Nephron. 1998;78:1–8. doi: 10.1159/000044874. [DOI] [PubMed] [Google Scholar]
- Evan AP, Willis LR, McAteer JA, Bailey MR, Connors BA, Shao Y, Lingeman JE, Williams JC, Fineberg NS, Crum LA. Kidney damage and renal functional changes are minimized by waveform control that suppresses cavitation in shock wave lithotripsy. J Urol. 2002;168:1556–1562. doi: 10.1016/S0022-5347(05)64520-X. [DOI] [PubMed] [Google Scholar]
- Hall TJ, Bilgen M, Insana MF, Krouskop TA. Phantom materials for elastography. IEEE Trans Ultrason Ferroelectr Freq Control. 1997;44:1355–1365. [Google Scholar]
- Hall TL, Kieran K, Ives K, Fowlkes JB, Cain CA, Roberts WW. Histotripsy of rabbit renal tissue in vivo: temporal histologic trends. J Endourol. 2007;21:1159–1166. doi: 10.1089/end.2007.9915. [DOI] [PubMed] [Google Scholar]
- Hamaguchi F, Ando K. Linear oscillation of gas bubbles in a viscoelastic material under ultrasound irradiation. Phys Fluids. 2015;27:113103. [Google Scholar]
- Haralock RM, Shapiro LG. Computer and robot vision. Vol. 1. Addison-Wesley Longman Publishing Co., Inc.; 1992. [Google Scholar]
- Hempel CR, Hall TL, Cain CA, Fowlkes JB, Xu Z, Roberts WW. Histotripsy fractionation of prostate tissue: local effects and systemic response in a canine model. J Urol. 2011;185:1484–1489. doi: 10.1016/j.juro.2010.11.044. [DOI] [PMC free article] [PubMed] [Google Scholar]
- Hyon SH, Cha WI, Ikada Y. Preparation of transparent poly (vinyl alcohol) hydrogel. Polym Bull. 1989;22:119–122. [Google Scholar]
- Khokhlova TD, Wang Y, Simon JC, Cunitz BW, Starr F, Paun M, Crum LA, Bailey MR, Khokhlova VA. Ultrasound-guided tissue fractionation by high intensity focused ultrasound in an in vivo porcine liver model. Proc Natl Acad Sci US A. 2014;111:8161–8166. doi: 10.1073/pnas.1318355111. [DOI] [PMC free article] [PubMed] [Google Scholar]
- Khokhlova VA, Bailey MR, Reed JA, Cunitz BW, Kaczkowski PJ, Crum LA. Effects of nonlinear propagation, cavitation, and boiling in lesion formation by high intensity focused ultrasound in a gel phantom. J Acoust Soc Am. 2006;119:1834–1848. doi: 10.1121/1.2161440. [DOI] [PubMed] [Google Scholar]
- Kolios MC, Sherar MD, Hunt JW. Blood flow cooling and ultrasonic lesion formation. Med Phys. 1996;23:1287–1298. doi: 10.1118/1.597694. [DOI] [PubMed] [Google Scholar]
- Martins dos Santos VAP, Leenen EJTM, Rippoll MM, van der Sluis C, van Vliet T, Tramper J, Wijffels RH. Relevance of rheological properties of gel beads for their mechanical stability in bioreactors. Biotechnol Bioeng. 1997;56:517–529. doi: 10.1002/(SICI)1097-0290(19971205)56:5<517::AID-BIT5>3.0.CO;2-L. [DOI] [PubMed] [Google Scholar]
- Maxwell AD, Cain CA, Hall TL, Fowlkes JB, Xu Z. Probability of cavitation for single ultrasound pulses applied to tissues and tissue-mimicking materials. Ultrasound Med Biol. 2013;39:449–465. doi: 10.1016/j.ultrasmedbio.2012.09.004. [DOI] [PMC free article] [PubMed] [Google Scholar]
- Maxwell AD, Cunitz BW, Kreider W, Sapozhnikov OA, Hsi RS, Harper JD, Bailey MR, Sorensen MD. Fragmentation of urinary calculi in vitro by burst wave lithotripsy. J Urol. 2015;193:338–344. doi: 10.1016/j.juro.2014.08.009. [DOI] [PMC free article] [PubMed] [Google Scholar]
- Meaney PM, Cahill MD, Ter Haar GR. The intensity dependence of lesion position shift during focused ultrasound surgery. Ultrasound Med Biol. 2000;26:441–450. doi: 10.1016/s0301-5629(99)00161-1. [DOI] [PubMed] [Google Scholar]
- Movahed P, Kreider W, Maxwell AD, Hutchens SB, Freund JB. Cavitation-induced damage of soft materials by focused ultrasound bursts: a fracture-based bubble dynamics model. J Acoust Soc Am. 2016;140:1347–1386. doi: 10.1121/1.4961364. [DOI] [PMC free article] [PubMed] [Google Scholar]
- Normand V, Lootens DL, Amici E, Plucknett KP, Aymard P. New insight into agarose gel mechanical properties. Biomacromolecules. 2000;1:730–738. doi: 10.1021/bm005583j. [DOI] [PubMed] [Google Scholar]
- Otsu N. A threshold selection method from gray-level histograms. Automatica. 1975;11:285–296. [Google Scholar]
- Paterson RF, Lifshitz DA, Lingeman JE, Evan AP, Connors BA, Fineberg NS, Williams JC, McATEER JA. Stone fragmentation during shock wave lithotripsy is improved by slowing the shock wave rate: studies with a new animal model. J Urol. 2002;168:2211–2215. doi: 10.1016/S0022-5347(05)64357-1. [DOI] [PubMed] [Google Scholar]
- Pennes HH. Analysis of tissue and arterial blood temperatures in the resting human forearm. J Appl Physiol. 1948;1:93–122. doi: 10.1152/jappl.1948.1.2.93. [DOI] [PubMed] [Google Scholar]
- Pishchalnikov YA, McAteer JA, Williams JC, Jr, Pishchalnikova IV, Vonder-haar RJ. Why stones break better at slow shockwave rates than at fast rates: in vitro study with a research electrohydraulic lithotripter. J Endourol. 2006;20:537–541. doi: 10.1089/end.2006.20.537. [DOI] [PMC free article] [PubMed] [Google Scholar]
- Pishchalnikov YA, Sapozhnikov OA, Bailey MR, Williams JC, Jr, Cleveland RO, Colonius T, Crum LA, Evan AP, McAteer JA. Cavitation bubble cluster activity in the breakage of kidney stones by lithotripter shockwaves. J Endourol. 2003;17:435–446. doi: 10.1089/089277903769013568. [DOI] [PMC free article] [PubMed] [Google Scholar]
- Plesset MS, Prosperetti A. Bubble dynamics and cavitation. Ann Rev Fluid Mech. 1977;9:145–185. [Google Scholar]
- Rassweiler JJ, Knoll T, Kohrmann K, McAteer JA, Lingeman JE, Cleveland RO, Bailey MR, Chaussy C. Shock wave technology and application: an update. Eur Urol. 2011;59:784–796. doi: 10.1016/j.eururo.2011.02.033. [DOI] [PMC free article] [PubMed] [Google Scholar]
- Rayleigh JWS. On the pressure developed in a liquid during the collapse of a spherical cavity. Phil Mag. 1917;34:94–98. [Google Scholar]
- Roberts WW, Hall TL, Ives K, Wolf JS, Fowlkes JB, Cain CA. Pulsed cavitational ultrasound: a noninvasive technology for controlled tissue ablation (histotripsy) in the rabbit kidney. J Urol. 2006;175:734–738. doi: 10.1016/S0022-5347(05)00141-2. [DOI] [PubMed] [Google Scholar]
- Robinson TC, Lele PP. An analysis of lesion development in the brain and in plastics by high-intensity focused ultrasound at low-megahertz frequencies. J Acoust Soc Am. 1972;51:1333–1351. doi: 10.1121/1.1912979. [DOI] [PubMed] [Google Scholar]
- Sanghvi NT, Fry FJ, Bihrle R, Foster RS, Phillips MH, Syrus J, Zaitsev AV, Hennige CW. Noninvasive surgery of prostate tissue by high-intensity focused ultrasound. IEEE Trans Ultrason Ferroelectr Freq Control. 1996;43:1099–1110. [Google Scholar]
- Sapozhnikov OA, Khokhlova VA, Bailey MR, Williams JC, Jr, McAteer JA, Cleveland RO, Crum LA. Effect of overpressure and pulse repetition frequency on cavitation in shock wave lithotripsy. J Acoust Soc Am. 2002;112:1183–1195. doi: 10.1121/1.1500754. [DOI] [PubMed] [Google Scholar]
- Vlaisavljevich E, Lin K, Maxwell A, Warnez MT, Mancia L, Singh R, Putnam AJ, Fowlkes B, Johnsen E, Cain C, Xu Z. Effects of ultrasound frequency and tissue stiffness on the histotripsy intrinsic threshold for cavitation. Ultrasound Med Biol. 2015;41:1651–1667. doi: 10.1016/j.ultrasmedbio.2015.01.028. [DOI] [PMC free article] [PubMed] [Google Scholar]
- Vlaisavljevich E, Maxwell A, Warnez M, Johnsen E, Cain C, Xu Z. Histotripsy-induced cavitation cloud initiation thresholds in tissues of different mechanical properties. IEEE Trans Ultrason Ferroelectr Freq Control. 2014;61:341–352. doi: 10.1109/TUFFC.2014.6722618. [DOI] [PMC free article] [PubMed] [Google Scholar]
- Wang TY, Xu Z, Hall TL, Fowlkes JB, Cain CA. An efficient treatment strategy for histotripsy by removing cavitation memory. Ultrasound Med Biol. 2012;38:753–766. doi: 10.1016/j.ultrasmedbio.2012.01.013. [DOI] [PMC free article] [PubMed] [Google Scholar]
- Watkin NA, Ter Haar GR, Rivens I. The intensity dependence of the site of maximal energy deposition in focused ultrasound surgery. Ultrasound Med Biol. 1996;22:483–491. doi: 10.1016/0301-5629(95)02062-4. [DOI] [PubMed] [Google Scholar]
- Xu Z, Ludomirsky A, Eun LY, Hall TL, Tran BC, Fowlkes JB, Cain CA. Controlled ultrasound tissue erosion. IEEE Trans Ultrason Ferroelectr Freq Control. 2004;51:726–736. doi: 10.1109/tuffc.2004.1308731. [DOI] [PMC free article] [PubMed] [Google Scholar]
- Yang X, Church CC. A model for the dynamics of gas bubbles in soft tissue. J Acoust Soc Am. 2005;118:3595–3606. doi: 10.1121/1.2118307. [DOI] [PubMed] [Google Scholar]
- Zell K, Sperl JI, Vogel MW, Niessner R, Haisch C. Acoustical properties of selected tissue phantom materials for ultrasound imaging. Phys Med Biol. 2007;52:N475–N484. doi: 10.1088/0031-9155/52/20/N02. [DOI] [PubMed] [Google Scholar]


