

Summary
Oncogenic mutations in two isocitrate dehydrogenase (IDH)-encoding genes (IDH1 and IDH2) have been identified in acute myelogenous leukemia, low-grade glioma, and secondary glioblastoma (GBM). Our in silico and wet-bench analyses indicate that non-mutated IDH1 mRNA and protein are commonly overexpressed in primary GBM. We show that genetic and pharmacologic inactivation of IDH1 decreases GBM cell growth, promotes a more differentiated tumor cell state, increases apoptosis in response to targeted therapies, and prolongs survival of animal subjects bearing patient-derived xenografts (PDXs). On a molecular level, diminished IDH1 activity results in reduced α-ketoglutarate (αKG) and NADPH production, paralleled by deficient carbon flux from glucose or acetate into lipids, exhaustion of reduced glutathione, increased levels of reactive oxygen species (ROS), and enhanced histone methylation and differentiation marker expression. These findings suggest that IDH1 upregulation represents a common metabolic adaptation by GBM to support macromolecular synthesis, aggressive growth, and therapy resistance.
Keywords: wild-type IDH1, GBM, metabolism, differentiation, NADPH, lipids, reactive oxygen species (ROS), EGFR, targeted therapy
eTOC Blurb
Calvert et al. demonstrate that wild-type IDH1 is overexpressed in Glioblastoma and that genetic or pharmacological suppression of IDH1 activity reduces tumor cell growth through effect on lipid production, redox homeostasis, and the regulation of cellular differentiation.
Introduction
Glioblastoma (GBM; World Health Organization grade IV glioma) is the most prevalent and fatal form of primary brain tumor. ‘De novo’ or ‘primary’ GBMs account for more than 90% of malignant gliomas, while ‘secondary’ GBMs, which arise from lower-grade gliomas (LGGs) in younger adults represent <10% of clinical cases (Ohgaki and Kleihues, 2005). Survival for GBM patients, collectively, is just 14–16 months after initial diagnosis (Cloughesy et al., 2014). Although detailed molecular profiling of GBM has identified therapeutically actionable mutations (Cloughesy et al., 2014), success from molecularly targeted therapies has yet to be realized. Clinical studies with receptor tyrosine kinase (RTK) inhibitors (RTKis)--foremost, epidermal-growth-factor (EGF)-receptor (EGFR)-targeting small-molecule inhibitors--identified a small percentage of initial responders; recurrence of GBM tumor growth, however, was nearly universal. Extensive genetic heterogeneity, together with compensatory activation of oncogenic or inactivation of tumor suppressive pathways, contributes to the intractability of GBM.
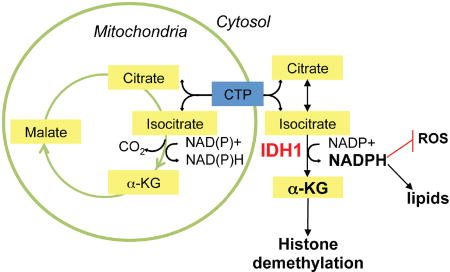
Recent studies have revealed metabolic characteristics that are common to nearly all GBMs and that distinguish tumor from normal brain. Among the shared metabolic characteristics of GBM is the excess production of lactate, in association with glucose and acetate oxidation to produce energy and macromolecular precursors (Marin-Valencia et al., 2012; Mashimo et al., 2014). Our understanding of the manner in which specific gene alterations affect such metabolic adaptation can reasonably be described as rudimentary. Oxidative decarboxylation of isocitrate (ICT) by ICT dehydrogenases (IDHs) produces α-ketoglutarate (αKG). Eukaryotic cells express three IDH isoforms (Dalziel, 1980). IDH1 and IDH2 are homodimeric NADP+-dependent enzymes, while IDH3 is a structurally distinct heterotetrameric enzyme that utilizes NAD+ as a co-factor. The different IDH isoforms have overlapping, but non-redundant roles in cellular metabolism (Mailloux et al., 2007; Reitman and Yan, 2010). Cytoplasmic and peroxisomal IDH1 produce non-mitochondrial αKG and NADPH, to activate various αKG-dependent dioxygenases (Hausinger, 2004), and to provide reducing equivalents to support lipid biosynthesis and redox homeostasis, respectively (Jo et al., 2002; Lee et al., 2002; Kim et al., 2007).
While oncogenic mutations in IDH1 have been reported for LGG and secondary GBM, these IDH1 mutations are rare in primary GBM (Parsons et al., 2008; Horbinski, 2013). Here, we investigated whether IDH1 activity is regulated in primary GBM, and whether such regulation, by impacting macromolecular synthesis activities, redox homeostasis and gene expression, affects the tumor biologic properties of GBM. In GBM and other solid and systemic cancers, we demonstrate that robust expression of IDH1 mRNA and protein promotes growth, reduces susceptibility to RTK targeting therapies, drives a less differentiated tumor cell state, and accelerates GBM tumor progression. Using a small molecule inhibitor with activity against wild-type IDH1, we show that pharmacological inhibition of IDH1 reduces GBM tumor burden and increases the survival of PDX mice, similar to RNAi-based IDH1 suppression. These data suggest that cancer-associated IDH1 upregulation represents an actionable (‘druggable’) cancer-promoting mechanism, and provide the conceptual framework and rationale for the preclinical evaluation of wild-type IDH1 inhibitors as anti-neoplastic agents.
Results
Wild-type IDH1 is overexpressed in GBM
An in silico analysis of GBM specimens profiled by The Cancer Genome Atlas Network (TCGA) (Brennan et al., 2013; TCGA, 2008) revealed that wild-type IDH1 had elevated expression in 65% of primary GBMs, whereas the IDH1 R132H point mutation occurred in only 2% of these tumors (Figure 1A). Increased mRNA in GBM was specific for IDH1, as IDH2 transcript levels were unchanged, and IDH3 variants and all other enzymes of the tricarboxylic acid (TCA) cycle were significantly downregulated in GBM relative to normal brain (Figure S1A). Aconitase 1 (ACO1) was the only other enzyme that showed upregulation in GBM, but not to the same extent as IDH1 (Figure S1A). We confirmed the TCGA data in flash-frozen GBM tumors obtained from Northwestern Memorial Hospital, which also showed elevated IDH1 mRNA (Figure 1B). Levels of IDH1 mRNA varied with tumor type, grade and subclass, as IDH1 was expressed at lower levels in TCGA grade II and III gliomas (Brat et al., 2015) (Figure 1C), compared to GBM, regardless of tumor subclassification as astrocytoma, oligoastrocytoma and oligodendroglioma (Figure 1D). Expression of IDH1 transcripts was enriched in IDH1 WT (wild-type), compared to IDH1 R132H mutant GBM (Figure S1B), and was highest in GBM tumors of the classical subtype, with other subtypes exhibiting similar average and range of expression (Figure 1E). Elevated IDH1 expression was also evident through immunohistochemical analysis of protein using two independent tissue microarrays followed by quantitative analysis of staining intensity using laser scanning cytometry (LSC; Figure 1F) or by semi-quantitative evaluation using light microscopy (Figure 1G, 1H). These studies demonstrated diffuse cytoplasmic and speckled staining distribution, which is consistent with well-described functions of IDH1 within the cytosol and peroxisomes (Losman and Kaelin, 2013). The IDH1-encoding 2q34 locus was not amplified nor were there changes in IDH1 promoter methylation (Figure S1C). Together, these observations suggest that in the absence of copy number gains or epigenetic activation through changes in CpG methylation, primary GBM tumors are characterized by elevated IDH1 mRNA and protein expression.
Figure 1. Wild-type IDH1 is overexpressed in primary GBM.

(A) IDH1 mRNA expression in TCGA GBM tumors (n=419).
(B) IDH1 transcript levels in an independent set of primary GBM (n=33).
(C–E) IDH1 mRNA levels in GBM compared to lower grade gliomas (GBM, n=159; Grade 2, n=190; Grade 3, n=203), other central nervous system tumors (astro, n=140; oligoastro, n=104; oligodendro, n=149), and GBM genetic subtypes.
(F and G) Quantification of IDH1 staining intensities in TMA of GBM tumors (n=33) relative to normal brain (n=5) by LSC, and by IHC score on an independent TMA of normal brain (n=7) and GBM tumors (n=35).
(H) Representative TMA cores stained for IDH1. Bar, 50 µm.
* p<0.0001; ** p<0.00005; *** p<0.05; **** p<0.001. OE, overexpression; astro, astrocytoma; oligoastro, oligoastrocytoma; oligodendro, oligodendroglioma; CL, classical; M, mesenchymal; N, neural; PN, proneural; LSC, laser scanning cytometry. See also Figure S1.
IDH1 expression modulates GBM progression in vivo
To determine whether altering IDH1 expression affects GBM cell growth in vitro and tumor growth in vivo, we suppressed IDH1 expression in two independent luciferase-labeled, patient-derived glioma initiating cells (GICs) via lentiviral infection with IDH1-specific short hairpin RNA (shRNA) or overexpressed an IDH1 cDNA in neural stem cells (NSCs) derived from mice with a CNS-specific deletion of p53 and PTEN tumor suppressors (Zheng et al., 2008). The shIDH1 on-target effect was verified by analyzing IDH1 knockdown (KD) in glioma cells expressing RNAi-sensitive or RNAi-resistant IDH1 proteins (data not shown). KD of IDH1 reduced GIC proliferation (Figure 2A, 2B), while ectopic expression of IDH1 accelerated NSC growth (Figure 2C). Severe combined immunodeficiency (SCID) mice receiving orthotopic implantation of GICs modified for reduced IDH1 expression showed diminished tumor growth in comparison to mice implanted with cells infected with control lentivirus, as indicated by bioluminescence monitoring and survival analysis (Figure 2D–2G). Correspondingly, animal subjects engrafted with IDH1-overexpressing NSCs showed accelerated intracranial tumor progression (Figure 2H) and reduced survival when compared to vector controls (Figure 2I). Immunohistochemical analysis of sections from resected mouse brains revealed increased apoptosis and decreased proliferation of tumor cells modified for reduced IDH1 expression in comparison to controls, and decreased apoptosis and increased proliferation of NSC-derived tumors with overexpression of IDH1 compared to vector controls (Figure S2). These data support tumor-promoting activities of IDH1 in physiologically relevant gain- and loss-of-function GBM mouse models in vivo.
Figure 2. IDH1 promotes GBM progression in vivo.

(A–C) Cell proliferation in GIC-20 expressing shScramble or shIDH1, GIC-387 with pLKO or shIDH1, and in NSCs with stable overexpression of IDH1 (n=3; Mean ± SD).
(D–I) Quantification of bioluminescence of intracranial engraftment models, using GIC-20 expressing pLKO and shIDH1, GIC-387 with shScramble and shIDH1, and NSCs expressing CSII and CSII-IDH1 (n=7–10; Mean ± SEM); and the corresponding Kaplan-Meier survival curves (n=9–10).
* p<0.005; ** p<0.05; *** p<0.01; **** p<0.0005; # p<0.001; ## p<0.0001. See also Figure S2.
Suppression of IDH1 reduces αKG and NADPH levels and diminishes lipid biosynthesis
Recent metabolomic flux studies in GBM cells, derivative orthotopic explant models and GBM patients revealed that simultaneously with aerobic glycolysis, glucose or acetate-derived carbons are oxidized in the TCA cycle to produce both energy and macromolecular precursors (Marin-Valencia et al., 2012; Mashimo et al., 2014). Studies in liver and adipose cells and tissue revealed that wild-type IDH1 controls lipid metabolism due to its ability to produce cytoplasmic NADPH, which is a rate-limiting factor for lipogenesis (Koh et al., 2004; Shechter et al., 2003). Thus, we explored the effect of IDH1 on anaplerotic flux--in particular, lipid biosynthesis--by performing targeted metabolic studies. Glioma cells and GICs modified for stable IDH1 KD (Figure 3A) had reduced aKG levels (Figure 3B) and NADPH levels (Figure 3C). Using uniformly 13C-labeled glucose and acetate tracers, we found the reduction in the NADPH/NADP+ ratio to be associated with diminished saturated and unsaturated fatty acid synthesis (Figure 3D, 3E).
Fig. 3. Knockdown of IDH1 decreases αKG and NADPH levels, and reduces carbon flux from glucose or acetate into fatty acids.

(A) Western blot of IDH1 in LN382 expressing pLKO or shIDH1.
(B–C) Levels of αKG and NADPH/NADP+ ratio in cells infected with pLKO/shScramble, or shIDH1 (n=2 in triplicates; Mean ± SD).
(D–E) Levels of total and 13C-labeled fatty acids labeled with 13C-glucose or -acetate in GIC-20 expressing pLKO or shIDH1 (n=5; Mean ± SD).
(F) Levels of acetyl-CoA in GIC-20 (pLKO vs. shIDH1) labeled with 13C acetate tracer (n=3; Mean ± SD).
* p<0.005; ** p<0.01; *** p<0.00005; **** p<0.0005; # p<0.05; ## p<0.001.
Under conditions of hypoxia (Wise et al., 2011; Metallo et al., 2011) and anchorage-independent tumor spheroid growth (Jiang et al., 2016), IDH1 can promote the reductive formation of citrate from glutamine by catalyzing the conversion of αKG to ICT (the ‘reverse’ reaction). Citrate can subsequently be converted to acetyl-CoA (coenzyme A) and then malonyl-CoA, the carbon precursors for de novo lipogenesis. To determine whether IDH1, under normoxic conditions examined here, can promote anaplerotic replacement of acetyl-CoA by stimulating αKG production (via ‘forward reaction’), we analyzed 13C label incorporation into acetyl-CoA. We found that GICs expressing shIDH1 exhibited elevated levels of 13C labeled acetyl-CoA (Figure 3F), suggesting that acetyl-CoA accumulates in IDH1 compromised cells, as it cannot be used for de novo fatty acid synthesis due to limited cytoplasmic NADPH availability. Collectively, these targeted metabolic studies together with published literature suggest a critical role of cytoplasmic NADPH for mediating IDH1 metabolic effects.
IDH1 regulates histone methylation, GIC differentiation and gene expression
As αKG impacts cellular differentiation processes by regulating multiple dioxygenases, including Jumonji C (JmjC)-domain-containing histone lysine residue demethylases, we examined histone lysine methylation in GICs modified for decreased IDH1 expression. shIDH1-expressing GICs showed increases in trimethylation on H3K4, H3K9, H3K27, and H3K36 similar to hypoxic conditions (Figure 4A). Using Extreme Limiting Dilution Assays (ELDAs), we show that reduced IDH1 expression diminished (Figure 4B), while increased IDH1 expression in NSCs enhanced stem cell frequency (Figure 4C). Under differentiation conditions, GICs with stable IDH1 KD more readily differentiated when compared to vector control cultures, as indicated by augmented MAP2 (microtubule-associated protein 2) and GFAP (glial fibrillary acidic protein) expression, markers for neuronal and glial differentiation, respectively (Figure 4D, 4E) and increased GFAP and decreased Nestin (neural stem cell marker) transcript levels (Figure 4F). Further supporting a role for IDH1 in regulating glioma cell multi potency, our qRT-PCR analysis of endogenous IDH1 mRNA in cell populations separated on the basis of CD133 expression, showed increased IDH1 transcript levels in the glioma stem cell marker enriched versus non-selected populations (Figure 4G).
Figure 4. IDH1 knockdown induces a more differentiated GIC state.

(A) Western blot of methylated histone species in GICs with pLKO or shIDH1 (representative of 3 independent experiments). Histograms represent densitometry of each methylated histone species.
(B–C) ELDA of GIC-20s expressing shScramble or shIDH1, and NSCs harboring empty vector control or CSII-IDH1 (n=15 per group). Stem Cell Frequency is stated on each graph.
(D–E) Immunocytochemistry (n=3) and quantification for MAP2 and GFAP in GIC-20 expressing shScramble or shIDH1. Bar, 50 µm. (n=25,000; Mean ± SD)
(F) qRT-PCR for GFAP and Nestin in GIC-20 cells expressing shScramble or shIDH1 (n=6–7 per group; Mean ±SEM).
(G) qRT-PCR to quantify IDH1 mRNA levels in CD133+ versus CD133- populations.
(H) H3K4me3 occupancy of GNG4, NDUFS1, and TNFAIP1 promoters as determined by ChIP-Seq in GICs expressing shScramble or shIDH1.
(I) qRT-PCR of GNG4, NDUFS1, and TNFAIP1 in GIC-387 expressing shScramble or shIDH1.
(J) GNG4, NDUFS1, and TNFAIP1 mRNA expression in the TCGA dataset (n=419).
* p<0.05; ** p<0.001; *** p<0.00001; **** p<0.0001; # p<0.0005, ## p<0.005, ### p<5×10⁻⁹, #### p<1×10⁻⁶. See also Figure S3.
To begin to understand how IDH1 impacts gene expression through modification of histone methylation, we performed chromatin immunoprecipitation sequencing (ChIP-Seq) experiments in control and shIDH1 GIC-20 or GIC-387 infectants, using antibodies recognizing tri-methylated H3K27, K36 and K4 proteins. The most significant changes were seen with H3K4me3. We analyzed the ChIP-Seq dataset using Spatial Clustering for Identification of ChIP-Enriched Regions (SICER) and performed Ingenuity Pathway Analysis (IPA), to prioritize genes based upon enrichment in signaling pathways associated with cancer and development. Through this integrated analysis, we identified a tumor suppresser gene signature induced by IDH1 KD that contained NADH: ubiquinone oxidoreductase core subunit S1 (NDUFS1), Guanine Nucleotide Binding Protein Gamma 4 (GNG4), and TNF Alpha Induced Protein 1 (TNFAIP1), and that have been reported to suppress cancer progression through effects on reactive oxygen species (ROS), chemokine receptor biology, and nuclear factor κB (NFκB) signaling, respectively (see Discussion). These genes showed increased binding of activating H3K4me3 (Figure 4H, Figure S3, Table S1), increased transcript levels in IDH1 KD versus control GICs (Figure 4I), and correspondingly, reduced mRNA expression in TCGA GBM tumors compared to normal brain (Figure 4J). Two additional tumor suppressor genes, ETS variant 6 (ETV6) and tumor suppressor candidate 2 (TUSC2) with highly differential binding between shIDH1 and shCo cells, failed to consistently exhibit transcriptional upregulation upon IDH1 KD (data not shown). This data suggests that increased binding of H3K4me3 may not be indicative of active gene transcription only, demonstrating that IDH1 inhibition and associated decrease in αKG production can lead to an increase of histone methylation independently of transcription at different gene loci. Collectively, these data show that IDH1 inactivation reduces stem cell frequency, enhances susceptibility to differentiation cues, and regulates (tumor suppressor) gene expression by modulating histone trimethylation.
IDH1 ablation increases RTKi-induced apoptosis through decreased lipid biosynthesis and increased ROS
Unabated tumor growth requires elevated lipogenesis for membrane biogenesis (Menendez and Lupu, 2007). A plethora of studies indicate that GBM tumors activate lipid biosynthesis through oncogenic EGFR/PI3K (phosphatidylinositol 3-kinase)/Akt pathway activation as a survival mechanism. Consequently, blockage of de novo fatty acid biosynthesis (e.g., via treatment of cells with fatty acid synthase (FAS) inhibitors or small interfering RNA (siRNA) targeted to the master transcription factor SREBP1) sensitizes glioma cells to EGFR inhibition (Guo et al., 2009a; Guo et al., 2009b; Guo et al., 2011). Inhibition of RTKs is also known to cooperate with ROS scavengers to reduce GIC survival (Monticone et al., 2014). To address whether IDH1 modulates cell responses toward RTKi through its impact on lipid biosynthesis and redox balance, we examined the apoptotic response of GICs with and without amplified EGFR (Figure 5A, 5B), to KD of IDH1. Erlotinib treatment increased Annexin V positivity in shIDH1 GICs with amplified EGFR (GIC-387; EGFR amplification, PTEN+/+), but not in GICs lacking EGFR amplification (GIC-20; EGFR non-amplified, PTEN−/−; Figure 5C). Correspondingly, NSCs ectopically expressing IDH1 exhibited reduced apoptosis in response to erlotinib compared to vector controls (Figure 5D). Treatment of erlotinib-primed cells with cell-permeable αKG (Figure 5E), or the fatty acid palmitate plus the cholesterol precursor mevalonate (Figure 5F) protected cells from the pro-apoptotic effects of IDH1 KD, suggesting that reduced fatty acid and cholesterol biosynthesis contributes to the pro-apoptotic effect of IDH1 KD. In addition, IDH1 KD in GICs augmented cellular ROS levels (Figure 5G) as a consequence of decreased reduced glutathione (GSH; Figure 5H) and NADPH (Figure 5I). Treatment of IDH1 KD cells with the ROS scavenger EUK-134 (Figure 5J) or N-acetyl cysteine (NAC) (Figure 5K) reduced effector caspase activation in response to erlotinib treatment, suggesting that elevated ROS in shIDH1 GICs contributes to the pro-apoptotic effects of EGFR inhibition. To further confirm a role of diminished NADPH production for the pro-apoptotic effect of IDH1 KD, we tested whether αKG add-back impacts the NADPH/NADP+ ratio, and whether overexpression of cytoplasmic NADPH-generating malic enzyme 1 (ME1) can rescue pro-apoptotic effect of IDH1 KD. As shown in Figure 5L, αKG add-back increases the NADPH/NADP+ ratio, and overexpression of ME1 antagonizes the pro-apoptotic effect of IDH1 KD, similar to αKG add-back (Figure 5M, 5N).
Figure 5. Knockdown of IDH1 sensitizes cells toward erlotinib-induced apoptosis by decreasing lipid and increasing ROS production.

(A) EGFR copy number in GIC-20 and GIC-387.
(B) Western blot of pEGFR and IDH1 in GICs expressing shScramble or shIDH1 (representative of 3 independent experiments).
(C) Annexin V positivity of GICs expressing pLKO or shIDH1 +/− E (n=3; Mean ± SD).
(D) Western blot of cleaved effector caspases in NSCs overexpressing IDH1 +/− E (representative of 3 independent experiments).
(E–F) Western blot of cleaved effector caspases in GIC-387 expressing pLKO or shIDH1 +/− E and co-treated with diMe-αKG, or Mev and Palm (each representative of 2 independent experiments).
(G–I) Levels of ROS (n=3; Mean ± SD), reduced glutathione (GSH) (n=2; Mean ± SD), and NADPH (n=2; Mean ± SD) in pLKO or shIDH1-expressing GIC-387 +/− E.
(J, K) Western blot of effector caspase activation in GIC-387 treated with EUK-134 or NAC, +/− E (representative of 2 independent experiments).
(L) NADPH/NADP+ quantification in shScramble and shIDH1-expressing GIC-387 cells +/− diMe-αKG (n=5; Mean ± SD).
(M) Western Blot of ME1 in GIC-387 overexpressing ME1.
(N) Western blot of cleaved effector caspases in GIC-387 expressing shScramble and shIDH1 +/− E (representative of 3 independent experiments).
Histograms throughout represent densitometry done for effector cleaved caspase-3 and −7. * p<0.05; ** p<0.001; *** p<0.005; **** p<0.0005; # p<0.01. Veh, vehicle; E, erlotinib; diMe-αKG, diMe-α-ketoglutarate; Mev, mevalonate; Palm, palmitate; NAC, N-Acetyl-Cysteine; ME1, malic enzyme 1: LS, large subunit; LS+N, large subunit plus N-peptide. See also Figure S4, S5.
Importantly, IDH1 KD in transformed glioma cells harboring co-activation of multiple RTKs--including EGFR, the HGFR family member MSPR and PDGFRs (Figure S4A)--has similar effects as those observed in patient-derived cultures with activation of EGFR only: IDH1 ablation diminished NADPH levels in the transformed cells (Figure S4B), and when combined with an RTK inhibitor cocktail caused a reduction in GSH (Figure S4C) as well as increases in ROS (Figure S4D) and apoptosis (Figure S4E, S4F, S4G). Apoptosis sensitization by IDH1 KD occurs upstream of mitochondrial outer membrane permeabilization, as overexpression of Bcl-2 blocked effector caspase activation in response to IDH1 inhibition in erlotinib-primed cells (Figure S4H, S4I).
IDH1 mRNA is also upregulated in other solid and systemic malignancies, including lung adenocarcinoma and squamous cell carcinoma (Figure S5A), as well as various types of lymphoma, including angioimmunoblastic, anaplastic large cell, peripheral T cell, and diffuse large B cell (DLBCL) subtypes (Figure S5B). Stable KD of IDH1 in DLBCLs (Figure S5C) enhanced apoptotic susceptibility toward the Bruton’s tyrosine kinase (BTK) inhibitor ibrutinib (Figure S5D), which was paralleled by attenuated αKG production (Figure S5E), reduced GSH (Figure S5F), increased ROS (Figure S5G), and decreased tumor size in a subcutaneous xenograft model (Figure S5H, S5I). In total, these results demonstrate that IDH1 KD, through inhibition of NADPH and associated effects on lipid synthesis and ROS production, promotes apoptosis of tyrosine kinase inhibitor treated cancer cells.
FoxO6 transcriptionally induces IDH1 expression in response to RTK inhibition
Results in recent studies have implicated Forkhead box O (FoxO) transcription factors as positive regulators of IDH1 expression (Charitou et al., 2015). As Akt-mediated phosphorylation inhibits FoxO transcriptional functions (Lam et al., 2013), we examined whether RTK inhibition, and its downstream effect on suppressing Akt activity, increased IDH1 transcript and protein levels through FoxO activation. Erlotinib induced IDH1 transcript and protein levels in EGFR amplified, but not in non-amplified GICs (Figure 6A, 6B). Similarly, a combination of RTKis, but not temozolomide (TMZ) promoted IDH1 expression in transformed glioma cells (Figure 6C), confirming that IDH1 induction is dependent on RTK-PI3K–Akt activation. IDH1 induction was preceded by the binding of FoxO6 to an IDH1 intronic consensus-binding site (Figure 6D), as determined by ChIP (Figure 6E). KD of FoxO6 attenuated the effect of RTKi on IDH1 expression (Figure 6F). These results are consistent with IDH1 upregulation, through FoxO6 activation, as a glioma cell adaptive response to growth factor receptor inhibition.
Figure 6. RTKi induce IDH1 expression through FoxO6.

(A) qRT-PCR of IDH1 in GIC-387 +/− E.
(B–C) Western blot of IDH1 in GIC-387, GIC-20, and LN382 cells +/− TMZ or RTKi (representative of 2 independent experiments).
(D) Gene organization of the 3 IDH1 isoforms with the position of an intronic FoxO6 binding site.
(E) ChIP using FoxO6 antibody, followed by qRT-PCR of IDH1 (representative of 3 independent experiments).
(F) Western blot for IDH1, effector caspases, FoxO6, and total and phosphorylated Akt in LN382 cells treated with siFoxO6, +/− RTKi (representative of 3 independent experiments).
Veh, vehicle; E, erlotinib; LS, large subunit; LS+N, large subunit plus N-peptide; S+I, SU11274 + Imatinib; TMZ, temozolomide. See also Figure S6.
This interpretation is further supported by results from whole genome mRNA expression profiling of vehicle- and RTKi-treated glioma cells (Figure S6A; Table S2) that, together with IPA, identified IDH1 and lipid metabolism as the top priority signaling pathway induced upon RTKi treatment (Figure S6B, S6C). Besides IDH1, RTKi-induced genes included lanosterol synthase (LSS), and isopentyl-diphosphate delta isomerase 1 (IDI1) (Figure S6B, S6C, S6D). The importance of lipid metabolism gene induction as a modifier of RTKi responses was further supported by glioma cells sensitized by IDI1 or LSS KD (Figure S6E) to RTKi-mediated apoptosis (Figure S6F, S6G). Thus, glioma cells adapt to growth factor inhibition by inducing IDH1 and lipogenesis via an RTK-PI3K–Akt-FoxO6 signaling axis. Such adaptation suggests that RTKi-primed glioma cell rely on IDH1-drived lipid biosynthesis for proliferation and survival and points to co-extinction strategies that targets both aberrant RTK signaling and IDH1 activation to halt glioma growth.
Pharmacological inhibition of IDH1 reduces growth, augments RTKi susceptibility, reduces stem cell frequency, and decreases GBM progression
To address whether wild-type IDH1 is an actionable therapeutic target, we treated cells with GSK864. Similar to the first generation compound GSK321, compound 864 was initially identified as a potent inhibitor against R132H point-mutated IDH1 (half maximal inhibitory concentration [IC50], 15.2nM; Okoye-Okafor et al., 2015). In IDH1 mutant AML cells and derivative xenografts, GSK864 was shown to decrease 2-hydroxyglutarate (2HG) levels and the percentage of blast cells, and increase myeloid differentiation (Okoye-Okafor et al., 2015). Importantly, at higher doses, GSK864 also inhibited wild-type IDH1 (IC50; 466.5nM; Okoye-Okafor et al., 2015), and thus, represents a valuable tool to assess whether pharmacological inhibition of non-mutated IDH1 recapitulates cellular and tumor biological effects observed with genetic inactivation, and whether overexpression of IDH1 is an actionable genetic aberration for the treatment of intracranial GBM. GICs infected with shScramble-expressing cells, but not shIDH1-expressing cells, showed a dose-dependent reduction of the NADPH/NADP+ ratio when treated with GSK864 (Figure 7A). Similarly, non-transformed cortical astrocytes, expressing low levels of IDH1 protein compared to transformed glioma cells and GICs (Figure 7B) failed to respond to GSK864 treatment (Figure 7C). When used in combination with RTKi in transformed glioma cells (Figure 7D), or in GIC-387 cultures (Figure 7E), GSK864 reduced cell viability, and induced tumor cell apoptosis (Figure 7D–7I). Mirroring the effect of IDH1 KD on GIC differentiation (Figure 4), GSK864 reduced stem cell frequency in GIC-387 cells (Figure 7J). The pro-apoptotic effect of GSK864, similar to the pro-death activity of RNAi-mediated KD of IDH1 (Figure 5E), can be abrogated by reconstituting cells with cell-permeable αKG (Figure 7K), further validating compound specificity. To determine the effects of GSK864 in vivo, treatment of GIC-20 intracranial xenograft mice with GSK864 significantly impaired GBM progression in comparison to vehicle-treated subjects, as evidenced by reduced bioluminescence (Figure 7L, 7M), and increased survival (Figure 7N). These results provide initial proof-of-concept that IDH1 is a targetable oncogenic activity.
Figure 7. GSK864, an inhibitor of mutant IDH1 with activity against wild-type IDH1, inhibits GBM cell growth, increases RTKi-induced apoptosis, inhibits tumor burden, and prolongs animal subject survival in vivo.

(A) NADPH/NADP+ levels in GIC-387 expressing shScramble or shIDH1 +/− GSK864 (representative of one experiment, done in triplicate; Mean ± SD).
(B) IDH1 western blot of transformed glioma cell lines, GICs, and primary human astrocytes (representative of 2 independent experiments). Histograms show relative levels of IDH1 protein as determined by densitometry.
(C) NADPH/NADP+ levels in primary astrocytes +/− GSK864 (n=2–3, Mean ± SD).
(D–E) MTT assay of LN382 and GIC-387 treated with GSK864 +/− RTKi (n=6; Mean ± SD).
(F–I) Quantification of apoptosis in LN382 and GIC-387 treated with GSK864 +/− RTKi, by Annexin V positivity (n=3; Mean ± SD), and western blotting of effector caspase activation (representative of 3 independent experiments).
(J) ELDA of GIC-387 cells treated with GSK864. p-values between Vehicle and the following: 1µM, p=1.06×10⁻⁴; 5µM, p=1.06×10⁻⁴; 10µM, 9.43×10⁻¹¹(n=15).
(K) Western blot of effector caspases in GIC-387 +/− GSK864, diMe-αKG, and/or E. (representative of 2 independent experiments).
(L, M) Bioluminescence imaging of luciferase-expressing explants derived from GIC-20 cultures, treated with vehicle or GSK864 (n=9–10; Mean ± SEM).
(N) Kaplan-Meier survival curves of GIC-20 engrafted mice +/− GSK864 (n=9–10).
* p<0.05; ** p<0.01; *** p<0.00005; **** p<0.001; # p<0.00001; ## p<0.005; ### p<0.0001. Veh, vehicle; E, erltoinib; S+I, SU11274 + imatinib; GSK, GSK864; diMe-αKG, dimethyl-α-ketoglutarate.
Discussion
We have demonstrated that several cancer--in particular, primary GBM--show significant upregulation of wild-type IDH1 to support tumor progression. Using pharmacologic and RNAi-based loss-of-function studies together with cDNA complementation gain-of-function studies, we further show that up regulation of IDH1 is a mechanism of metabolic reprogramming, which enhances cellular anaplerosis--in particular, lipid biosynthesis--alters the cellular redox state, promotes a more dedifferentiated cell state, and causes resistance toward RTK-targeted therapies.
Additionally, we have shown that except for moderate upregulation of ACO1, IDH1 is the only TCA-associated enzyme that is robustly overexpressed in GBM tumors. Thus, our oncogenomic analysis revealed that GBM tumors are not characterized by global induction of TCA and TCA-associated anabolic enzymes. This finding supports our central hypothesis that IDH1 induction represents a selective oncogenic mechanism contributing to tumor progression, rather than a passive non-specific adaptation to increased proliferative rates.
Recent studies suggest that dampened TCA cycle/oxidative phosphorylation (OXPHOS) activity and the associated increase in ROS and oxidative DNA damage promote genomic instability of gliomas--in particular, the deletion or mutation of TP53--and reduces cell proliferation as a result of reduced ATP production. This loss of p53 function can trigger transformation of neural progenitor cells and initiate gliomagenesis (Bartesaghi et al., 2015) as well as jump-start glycolysis, providing ATP and cellular building blocks in the absence of normal mitochondrial OXPHOS (Berkers et al., 2013). While p53 inactivation and the reliance on glycolysis for ATP production may be sufficient to promote growth of less proliferative, lower grade tumors, highly aggressive cancers, such as GBM, depend on more efficient ways to produce ATP and macromolecules--in particular, lipids--to support unabated growth (Marin-Valencia et al., 2012; Mashimo et al., 2014). Recent studies have challenged the notion that GBM tumor metabolism is confined to aerobic glycolysis, i.e., the Warburg effect. The difference between metabolism of GBM tumors grown as PDX in vivo and glioma cell lines grown on plastic in vitro likely reflect adaptation to long-term culture, and/or loss of microenvironmental factors that influence metabolism (DeBerardinis et al., 2008). As demonstrated in a recent study (Marin-Valencia et al., 2012), simultaneously with aerobic glycolysis, GBM tumors grown as PDX oxidize glucose via pyruvate dehydrogenase and the TCA cycle to supply anaplerosis and other biosynthetic activities. While effective for driving the proliferation of cancer cells grown on plastic, these studies demonstrate that aerobic glycolysis appears to be insufficient to contribute to cellular anaplerosis and support tumor cell growth in vivo. Therefore, we propose that GBM selectively induces IDH1 mRNA, protein and enzymatic activity, in order to support high-grade glioma cells with macromolecules for rapid expansion. This in turn creates a unique IDH1-dependent metabolic vulnerability of GBM that we have described and therapeutically exploited.
IDH1 upregulation and its associated increase in cytoplasmic NADPH promotes lipid biosynthesis, ROS scavenging and unabated tumor growth and survival. Several studies have implicated IDH1 in the control of lipid metabolism in non-cancerous tissues. Transgenic IDH1 expression in liver and adipose tissues promoted hyperlipidemia and obesity, paralleled by increased triglyceride and cholesterol content (Koh et al., 2004). Conversely, in vivo IDH1 ablation resulted in weight loss associated with reduced fat mass and circulating triglyceride levels (Nam et al., 2012; Chu et al., 2015).
NADPH is a critical and possibly rate-limiting factor required for cell proliferation, and a reducing agent necessary for lipid biosynthesis (Lunt and Vander Heiden, 2011). Several studies point to IDH1 as a critical source of cytoplasmic NADPH. When grown on plastic, glioma cells generate NADPH from glutamine which is oxidatively metabolized by malic enzyme to malate, and then converted to pyruvate, with more than half of the glutamine being excreted as lactate (DeBerardinis et al., 2007). Recent studies by the Bachoo group, however, reveal that in PDX models using patient-derived cells propagated solely through intracranial implantation, tumor-associated glutamine pools were high but were inefficiently metabolized, and glucose represented the primary carbon source for oxidative metabolism in GBM PDX tumors (Marin-Valencia et al., 2012; Mashimo et al., 2014). Thus, conversion of glutamine to malate to pyruvate via the pyruvate/malate cycle, or the conversion of glutamine to glutamate to αKG, is unlikely to provide patient-derived glioma cells and derivative tumors with NADPH or acetyl-CoA. Furthermore, carbon flux studies in a variety of cancer cell lines using 13C labeled glucose suggest that the pentose phosphate pathway (PPP) cannot meet NADPH requirements for tumor cell growth (Boros et al., 1998; Boros et al., 2002). In addition, a recent study suggested that mutant KRAS-driven pancreatic adenocarcinomas, utilize the non-oxidative instead of the oxidative, NADPH-producing PPP, and thus decouple anaplerosis from NADPH production and NADPH-mediated redox control (Ying et al., 2012). Lastly, IDH1 has a higher maximal enzymatic activity compared to other NADPH-producing enzymes in patient-derived GBM tissue (Bleeker et al., 2010), and is the most differentially expressed NADPH producing enzyme in GBM compared to normal brain tissue (Wahl et al., 2017). These studies, together with our observation that acetyl-CoA is increased in GICs after IDH1 KD, suggest that IDH1-generated cytoplasmic NADPH is critical and likely rate-limiting for maintaining lipid and ROS homeostasis to promote tumor cell growth and survival.
IDH1-driven metabolic reprogramming might be particularly important for maintaining the glioma stem cell compartment. GIC cultures modified for reduced IDH1 expression showed diminished stem cell frequency and increased differentiation capacity. Chip-Seq and mRNA expression analysis identified a tumor suppressor gene signature, including NDUFS1, GNG4, and TNFAIP1, modulated by IDH1 through its impact on histone methylation. NDUFS1 is the largest subunit of mitochondria complex I and is responsible for oxidizing NADH, reducing ubiquinone, and moving protons across the mitochondrial inner membrane (Hirst, 2013). It is also a major contributor to mitochondrial ROS, and NDUFS1 mutations lead to a 70% reduction of complex I activity (Hoefs et al., 2010). Low expression of NDUFS1 is an independent predictor of shorter overall survival in clear-cell renal cell carcinoma (RCC) and non-small cell lung cancer (NSCLC) (Su et al., 2016; Ellinger et al., 2016). GNG4 is a member of the gamma subunit of the G protein family, regulates the interaction between the muscarinic receptor and voltage-sensitive calcium channels (Kalyanaraman et al., 1998), and is a putative tumor suppressor. In RCC, GNG4 is a target gene of the tumor suppressor von Hippel-Lindau gene (Maina et al., 2005), and in GBM, GNG4 is one of the most hypermethylated and down regulated genes and has tumor suppressive functions through regulation of the CXCR4/SDF1a signaling axis (Pal et al., 2016). TNFAIP1 is induced by tumor necrosis factor alpha (TNFα) and interleukin-6 (IL6) and has roles in DNA synthesis, DNA repair, and apoptosis (Wolf et al., 1992). TNFAIP1 has tumor suppressive functions in several cancer types, including gastric cancer, NSCLC, pancreatic cancer, and uterine cancer, by supporting tumor growth through NFκB signaling (Cui et al., 2015; Tan et al., 2016; Zhang et al., 2015; Zhou et al., 2013). We propose that reduced NADPH levels upon genetic and pharmacological inhibition of IDH1 cooperates with increased NDUFS1, GNG4 and TNFAIP1 levels to inhibit proliferation and promote ROS-induced apoptosis.
Oncogenic mutations in IDH1 and IDH2 have been identified in acute myelogenous leukemia, LGG, and secondary GBM, but are rare in primary GBM specimens (Losman and Kaelin, 2013; Horbinski, 2013). Remarkably, patients with wild-type GBM tumors have a mean survival of 15 months compared to 31 months for patients with mutant IDH1 GBM tumors and ectopic expression studies point to tumor suppressive effects of mutant IDH1. Expression of R132H IDH1 in established IDH1 wild-type glioma cell lines reduced proliferation in vitro and extended the survival of mice bearing derived orthotopic xenografts (Bralten et al., 2011). Similarly, RCAS (replication-competent avian sarcoma-leukosis virus long terminal repeat with splice acceptor)-driven expression of mutant IDH1 in NSCs derived from p53-deficient Nestin-tv-a mice reduces progenitor cell growth in vitro and glioma formation in vivo despite elevated 2HG production in IDH1 mutant compared to wild-type cells. This growth-inhibitory effect of mutant IDH1 is associated with diversion of αKG from wild-type IDH1 and reduced carbon flux from glucose or glutamine into lipids; replenishment of αKG through glutaminolysis compensated for these growth and flux deficiencies (Chen et al., 2014). These observations suggest that IDH1 mutant tumors require a specialized metabolic niche characterized by elevated glutamate flux for growth and expansion. Recent studies suggest that IDH1 mutant gliomas arise from a neural precursor population that is spatially and temporally restricted in the brain, possibly coinciding with remodeling of the prefrontal cortex (Lai et al., 2011). Primary GBM, on the other hand, inefficiently metabolize glutamine and most likely are unable to sustain high glutamine flux to support αKG and lipid biogenesis. To support anaplerosis--in particular, lipid biogenesis flux via enhanced αKG and NADPH--we propose that the upregulation of non-mutated IDH1 is important for primary GBM progression.
Clinical trials testing erlotinib as a monotherapy against EGFR-amplified GBMs elicited only transient responses, with rapid tumor adaptation (Furnari et al., 2015). Our targeted expression and global transcriptomic studies point to RTKi-mediated and FoxO6-dependent induction of IDH1 as a common adaptive response to RTKi treatment. Such metabolic adaptation allows glioma cells to sustain lipid biosynthesis and to limit ROS toxicity in the absence of growth factor signaling. Furthermore, the connection between RTK signaling and lipid metabolism has been extensively studied, linking RTKs, including ERBB4, EGFR, and FGFR3, to enhanced fatty acid and cholesterol biosynthesis (Haskins et al., 2015; Bian et al., 2015; Du et al., 2012). In particular, the EGFR/PI3K/Akt axis promotes GBM tumor growth in part through SREBP1-driven upregulation of acetyl-CoA carboxylase (ACC), FAS, and low-density lipoprotein receptor (LDLR) (Guo et al., 2009b; Guo et al., 2009a; Guo et al., 2011). As fatty acid synthesis is downstream of RTK-PI3K signaling, IDH1 inactivation and concurrent reduction in NADPH, αKG and lipid biosynthesis sensitizes glioma cells, regardless of their RTK activation profile and PTEN status, suggesting that IDH1 targeted therapies may represent a universal modality against GBM and other solid and systemic malignancies.
Cancer up-regulates a variety of metabolic genes that conspire to reprogram tumor cell metabolism and support unabated growth and therapy resistance. Consequently, drug development efforts focus on inhibiting a plethora of metabolic enzymes with overexpression in various cancers, many of which are being tested in combination with targeted and conventional chemo- and radiation therapies (Vander Heiden et al., 2011). In light of the low expression of IDH1 in normal brain, robust upregulation of IDH1 in GBM tumors, and the absence of developmental and fertility-related abnormalities in global IDH1 knockout mice (Itsumi et al., 2015), our data suggest that small molecule inhibitors of IDH1, such as GSK864, warrant further preclinical testing, especially when used in combination with inhibitors of RTK-PI3K signaling.
Experimental Procedures
In vivo Xenograft Studies
All animals were used under an approved protocol of the Institutional Animal Care and Use Committee of Northwestern University. Luciferase-expressing GIC-20, GIC-387, and NSC-2201 cells were injected intracranially into CB17 SCID mice (Taconic Farms). Mice were sacrificed upon observation of neurological impairment. For GSK864 inhibitor treatment, 20 animals were intracranially injected with GIC-20.luc cells. Two weeks after implantation, mice were randomized into two groups; 10 animals received 150 mg/kg GSK864 (Sigma) in propylene glycol, DMSO, PEG-400, and water (16.7:3.3:40:40) or vehicle for 10 days, M-F for 2 weeks. For lymphoma flank model, SUDHL4 cells were combined with ice-cold Matrigel (Fischer Scientific). Mice were anesthetized and 200 µL of cells in Matrigel were injected into either the left flank (pLKO) or right flank (shIDH1–98) of 5 mice.
In vivo Bioluminescence Imaging
shIDH1-expressing GIC-20, GIC-387, and SUDHL4 and IDH1-overexpressing NSC-2201 cells were lentivirally transduced with a cDNA encoding firefly luciferase. Upon cell implantation, mice were injected with luciferin potassium salt, anesthetized, and tumor growth was monitored by bioluminescence imaging (IVIS Spectrum, PerkinElmer). Bioluminescence was analyzed using Living Image (Caliper Life Sciences) software, and bioluminescence was quantified relative to non-tumor bearing mice.
αKG, NADPH/NADP+, GSH, and ROS Quantification
GBM cells and GICs were grown in 6 well plates and treated with drug for 24 hrs. To quantify αKG, NADPH/NADP+, and GSH, the α-KG Assay Kit (BioVision), NADP+/NADPH Quantification Kit (BioVision), or Glutathione Assay Kit (BioVision) were used, respectively, according to manufacturer’s protocols. To quantify ROS levels, cells were incubated with 5 µM CellROX Deep Red (Life Technologies) at 37°C for 4 hrs and analyzed by flow cytometry (Fortessa; BD Biosciences).
Quantification of Apoptosis
To quantify apoptosis of GBM cells and GICs, Annexin V positivity was determined by fluorescence-activated cell sorting (FACS) using the Annexin V-Cy5 Apoptosis Kit (BioVision) according to manufacturer’s protocol 24 hrs post treatment.
Western Blot Analysis
For all Western Blot analyses, proteins were separated by 4–12% SDS/PAGE (Life Technologies), transferred to Hybond PVDF membranes (Amersham), blocked with 5% milk in PBS with 0.1% Tween 20 (PBS/Tween) for 1 hr, and incubated with the following antibodies: anti-cleaved caspase-3 (Cell Signaling, 9664), anti-cleaved caspase-7 (Cell Signaling, 9491), anti-Hsp70 (BD Pharmingen, 610607), anti-IDH1 (Cell Signaling, 8137), anti-H3K4me3 (Millipore, CS200580), anti-H3K9me3 (Active Motif, 39161), anti-H3K27me3 (Millipore, CS200603), anti-H3K36me3 (Abcam, ab9050), anti-Histone H3 (Cell Signaling, 4499), anti-ME1 (Abcam, ab97445), anti-FoxO6 (Thermo Scientific PA5–35117), anti-phospho-FoxO6 (Abcam, ab154832), anti-phospho-EGFR (Cell Signaling, 2236S), anti-EGFR (Santa Cruz, sc-373746), anti-phospho-Akt (Cell Signaling, 4060S), and anti-Akt (Cell Signaling, 9272S). The blots were subsequently incubated with goat anti-rabbit IgG or goat anti-mouse IgG antibodies (Santa Cruz) in 5% milk in PBS/Tween and developed with Supersignal West Dura ECL (enhanced chemiluminescence) substrate (Pierce) following manufacturer’s protocol. Quantification of blots was determined by densitometry using ImageJ software.
Cell Proliferation
GICs or NSC-2201 cells were plated at 50,000 cells per well. Cells were counted every 3 days by trypan blue exclusion on Countess Cell Counter (Invitrogen) for 12 days.
Extreme Limiting Dilution Assay
GIC-20, NSC-2201, or GIC-387 cells were plated at 1, 5, 10, or 20 cells per well in 96 well plates. Spheres were determined by observation using an inverted microscope after 6 or 7 days. Data was analyzed by ELDA software (http://bioinf.wehi.edu.au/software/elda/index.html) to determine stem cell frequency (Hu and Smyth, 2009).
Cell Differentiation
GIC-20 cells were plated at 50,000 cells per mL on poly-D-lysine/laminin-coated coverslips in GIC media with 1 ng/mL EGF and basic fibroblast growth factor (bFGF) and no leukemia inhibitory factor (LIF). RNA was collected for qRT-PCR analysis or immunocytochemistry was performed as previously described (Kouri et al., 2015) using the following antibodies: rabbit anti-GFAP (1:1000; DakoCytomation Z0334) and mouse anti-MAP2 (1:500; BD Pharmingen 556320). Cells were imaged using a Nikon A1R Spectral confocal microscope, and quantification was performed using TissueGnostics LSC System, and data were analyzed with HistoQuest Software.
MTT Assay
LN382 or GIC-387 cells were plated at 10,000 cells per well in 96 well plates. Cells were treated with Vehicle or 5 µM RTKi and/or 0, 5, 50, or 100 µM GSK864. After 48 hrs, MTT assay was performed according to manufacturer’s protocol (ATCC).
Quantification and Statistical Analysis
All experimental data are presented as mean ± Standard Deviation, unless otherwise specified. Control and experimental groups were compared by two-tailed Student’s t-test. A p value of ≤0.05 was considered statistically significant. Sample size estimates were not used. Kaplan-Meier survival curves were analyzed by Mantel-Cox and Gehan-Breslow-Wilcoxon tests.
For further details, see the Supplemental Experimental Procedures.
Supplementary Material
Table S1. Related to Figure 4. List of top genes with differential H3K4me3 binding between control and shIDH1-expressing GIC-387.
Table S2. Related to Figure 6. List of differentially expressed genes by micro-array in RTKi- versus vehicle-treated LN382 cells.
Highlights.
-
-
Wild-type IDH1 is overexpressed in GBM and other solid and systemic malignancies
-
-
IDH1 promotes tumor cell growth in vitro and in vivo, and decreases GBM PDX survival
-
-
IDH1 regulates lipid biosynthesis, redox homeostasis and differentiation
-
-
Pharmacological inhibition of IDH1 reduces GBM growth in vitro and in vivo
Acknowledgments
This research was supported by the Center for Cancer Nanotechnology Excellence (CCNE) initiative of the National Institutes of Health (NIH) under Award U54 CA199091, by the Alliance for Cancer Gene Therapy (ACGT), the Dixon Translational Research Grants Initiative of the Northwestern Memorial Foundation, and the Coffman Charitable Trust (to A.H.S.). This research was also supported by National Cancer Institute (NCI)/National Institutes of Health (NIH) Training Grant T32CA09560 (A.E.C). We would like to thank the Cell Imaging Facility, the Flow Cytometry Core Facility, the Mouse Histology and Phenotyping Laboratory, and the Medicinal and Synthetic Chemistry Core at Northwestern University, all of which are supported by NCI Support Grant P30 CA060553 awarded to the Robert H. Lurie Comprehensive Cancer Center. The Northwestern Nervous System Tumor Bank provided immunohistochemical analysis of patient-derived gliomas. The Northwestern University Biochemistry and Molecular Genetics Sequencing Core Facility provided Next Generation Sequencing. The Skin Disease Research Center DNA/RNA Delivery Core helped with virus production. The Metabolomics Core at the University of Michigan, which was supported by grant U24 DK097153 of NIH Common Funds Project, performed the carbon metabolic labeling studies. BioTek Instruments Cytation3 Automated Imager and Plate reader were used in the Analytical BioNanoTechnology Equipment Core of the Simpson Querrey Institute at Northwestern University, which was supported by the U.S. Army Research Office, the U.S. Army Medical Research and Material Command, and Northwestern University.
Footnotes
Publisher's Disclaimer: This is a PDF file of an unedited manuscript that has been accepted for publication. As a service to our customers we are providing this early version of the manuscript. The manuscript will undergo copyediting, typesetting, and review of the resulting proof before it is published in its final citable form. Please note that during the production process errors may be discovered which could affect the content, and all legal disclaimers that apply to the journal pertain.
Author Contributions:
A.E.C., A.C., Y.W., F.M.K., H.Z., M.E.P., C.D.J., N.S.C., and A.H.S. designed experiments. A.E.C., A.C., Y.W., L.A.H., F.M.K., and J.L.M. performed experiments, and collected and analyzed data. Y.B., Y.H., M.E.P. and R.V.D. performed bioinformatics analysis. H.Z. isolated and provided p53-deficient and PTEN-deficient NSCs. R.M., G.S., O.D. and A.M. advised on studies aimed at evaluating effects of pharmacological IDH1 inhibition. M.K. and C.F.B. spearheaded the 13carbon labeling experiments, including data analysis and study design. E.B. gave expertise on ChIP-Sequencing, and analyzed the data sets. C.H. provided pathological analysis. A.E.C. and A.H.S. prepared and wrote the manuscript. All authors reviewed and edited the manuscript.
References
- Bartesaghi S, Graziano V, Galavotti S, Henriquez NV, Betts J, Saxena J, Minieri VAD, Karlsson A, Martins LM, Capasso M, et al. Inhibition of oxidative metabolism leads to p53 genetic inactivation and transformation in neural stem cells. Proc. Natl. Acad. Sci. U. S. A. 2015;112:1059–1064. doi: 10.1073/pnas.1413165112. [DOI] [PMC free article] [PubMed] [Google Scholar]
- Berkers CR, Maddocks OD, Cheung EC, Mor I, Vousden KH. Metabolic regulation by p53 family members. Cell Metab. 2013;18:617–633. doi: 10.1016/j.cmet.2013.06.019. [DOI] [PMC free article] [PubMed] [Google Scholar]
- Bian Y, Yu Y, Wang S, Li L. Up-regulation of fatty acid synthase induced by EGFR/ERK activation promotes tumor growth in pancreatic cancer. Biochem. Biophys. Res. Commun. 2015;463:612–617. doi: 10.1016/j.bbrc.2015.05.108. [DOI] [PubMed] [Google Scholar]
- Bleeker FE, Atai NA, Lamba S, Jonker A, Rijikeboer D, Bosch KS, Tigchelaar W, Troost D, Vandertop WP, Bardelli A, et al. The prognostic IDH1(R132H) mutation is associated with reduced NADP+-dependent IDH activity in glioblastoma. Acta Neuropathol. 2010;119:487–494. doi: 10.1007/s00401-010-0645-6. [DOI] [PMC free article] [PubMed] [Google Scholar]
- Boros LG, Lee PW, Brandes JL, Cascante M, Muscarella P, Schirmer WJ, Melvin WS, Ellison EC. Nonoxidative pentose phosphate pathways and their direct role in ribose synthesis in tumors: is cancer a disease of cellular glucose metabolism? Med. Hypotheses. 1998;50:55–59. doi: 10.1016/s0306-9877(98)90178-5. [DOI] [PubMed] [Google Scholar]
- Boros LG, Torday JS, Paul Lee WN, Rehan VK. Oxygen-induced metabolic changes and transdifferentiation in immature fetal rat lung lipofibroblasts. Mol. Genet. Metab. 2002;77:230–236. doi: 10.1016/s1096-7192(02)00140-3. [DOI] [PubMed] [Google Scholar]
- Bralten LB, Kloosterhof NK, Balvers R, Sacchetti A, Lapre L, Lamfers M, Leenstra S, de Jonge H, Kros JM, Jansen EE, et al. IDH1 R132H decreases proliferation of glioma cell lines in vitro and in vivo. Ann. Neurol. 2011;69:455–463. doi: 10.1002/ana.22390. [DOI] [PubMed] [Google Scholar]
- Brennan CW, Verhaak RG, McKenna A, Campos B, Noushmehr H, Salama SR, Zheng S, Chakravarty D, Sanborn JZ, Berman SH, et al. The somatic genomic landscape of glioblastoma. Cell. 2013;155:462–477. doi: 10.1016/j.cell.2013.09.034. [DOI] [PMC free article] [PubMed] [Google Scholar]
- Cancer Genome Atlas Research Network. Comprehensive genomic characterization defines human glioblastoma genes and core pathways. Nature. 2008;455:1061–1068. doi: 10.1038/nature07385. [DOI] [PMC free article] [PubMed] [Google Scholar]
- Cancer Genome Atlas Research Network. Brat DJ, Verhaak RG, Aldape KD, Yung WK, Salama SR, Cooper LA, Rheinbay E, Miller CR, Vitucci M, et al. Comprehensive, integrative genomic analysis of diffuse lower-grade gliomas. N. Engl. J. Med. 2015;372:2481–2498. doi: 10.1056/NEJMoa1402121. [DOI] [PMC free article] [PubMed] [Google Scholar]
- Charitou P, Rodriguez-Colman M, Gerrits J, van Triest M, Groot Koerkamp M, Hornsveld M, Holstege F, Verhoeven-Duif NM, Burgering BM. FOXOs support the metabolic requirements of normal and tumor cells by promoting IDH1 expression. EMBO Rep. 2015;16:456–466. doi: 10.15252/embr.201439096. [DOI] [PMC free article] [PubMed] [Google Scholar]
- Chen R, Nishimura MC, Kharbanda S, Peale F, Deng Y, Daemen A, Forrest WF, Kwong M, Hedehus M, Hatzivassiliou G, et al. Hominoid-specific enzyme GLUD2 promotes growth of IDH1R132H glioma. Proc. Natl. Acad. Sci. U. S. A. 2014;111:14217–14222. doi: 10.1073/pnas.1409653111. [DOI] [PMC free article] [PubMed] [Google Scholar]
- Chu B, Wu T, Miao L, Mei Y, Wu M. MiR-181a regulates lipid metabolism via IDH1. Sci. Rep. 2015;5:8801. doi: 10.1038/srep08801. [DOI] [PMC free article] [PubMed] [Google Scholar]
- Cloughesy TF, Cavenee WK, Mischel PS. Glioblastoma: from molecular pathology to targeted treatment. Annu. Rev. Pathol. 2014;9:1–25. doi: 10.1146/annurev-pathol-011110-130324. [DOI] [PubMed] [Google Scholar]
- Cui R, Meng W, Sun HL, Kim T, Ye Z, Fassan M, Jeon YJ, Li B, Vicentini C, Peng Y, et al. MicroRNA-224 promotes tumor progression in nonsmall cell lung cancer. Proc. Natl. Acad. Sci. U. S. A. 2015;112:E4288–4297. doi: 10.1073/pnas.1502068112. [DOI] [PMC free article] [PubMed] [Google Scholar]
- Dalziel K. Isocitrate dehydrogenase and related oxidative decarboxylases. FEBS Lett. 1980;117:11–19. doi: 10.1016/0014-5793(80)80569-2. [DOI] [PubMed] [Google Scholar]
- DeBerardinis RJ, Mancuso A, Daikhin E, Nissim I, Yudkoff M, Wehrli S, Thompson CB. Beyond aerobic glycolysis: transformed cells can engage in glutamine metabolism that exceeds the requirement for protein and nucleotide synthesis. Proc. Natl. Acad. Sci. U. S. A. 2007;104:19345–19350. doi: 10.1073/pnas.0709747104. [DOI] [PMC free article] [PubMed] [Google Scholar]
- DeBerardinis RJ, Sayed N, Ditsworth D, Thompson CB. Brick by brick: metabolism and tumor cell growth. Curr. Opin. Genet. Dev. 2008;18:54–61. doi: 10.1016/j.gde.2008.02.003. [DOI] [PMC free article] [PubMed] [Google Scholar]
- Du X, Wang QR, Chan E, Merchant M, Liu J, French D, Ashkenazi A, Qing J. FGFR3 stimulates stearoyl CoA desaturase 1 activity to promote bladder tumor growth. Cancer Res. 2012;72:5843–5855. doi: 10.1158/0008-5472.CAN-12-1329. [DOI] [PubMed] [Google Scholar]
- Ellinger I, Poss M, Bruggemann M, Gromes A, Schmidt D, Ellinger N, Tolkach Y, Dietrich D, Kristiansen G, Muller SC. Systematic expression analysis of mitochondria complex I identifies NDUFS1 as a biomarker in clear-cell renal-cell carcinoma. Clin. Genitourin Cancer. 2016 doi: 10.1016/j.clgc.2016.11.010. Epub ahead of print. [DOI] [PubMed] [Google Scholar]
- Furnari FB, Cloughesy FF, Cavenee WK, Mischel PS. Heterogeneity of epidermal growth factor receptor signaling networks in glioblastoma. Nature Rev. Cancer. 2015;15:302–310. doi: 10.1038/nrc3918. [DOI] [PMC free article] [PubMed] [Google Scholar]
- Guo D, Hildebrandt IJ, Prins RM, Soto H, Mazzotta MM, Dang J, Shyy JY, Watson AD, Phelps M, Radu CG, et al. The AMPK agonist AICAR inhibits the growth of EGFRvIII-expressing glioblastomas by inhibiting lipogenesis. Proc. Natl. Acad. Sci. U.S.A. 2009a;106:12932–12937. doi: 10.1073/pnas.0906606106. [DOI] [PMC free article] [PubMed] [Google Scholar]
- Guo D, Prins RM, Dang J, Kuga D, Iwanami A, Soto H, Lin KY, Huang TT, Akhavan D, Hock MB, et al. EGFR signaling through an Akt-SREBP-1-dependent, rapamycin-resistant pathway sensitizes glioblastomas to antilipogenic therapy. Sci. Signal. 2009b;2:ra82. doi: 10.1126/scisignal.2000446. [DOI] [PMC free article] [PubMed] [Google Scholar]
- Guo D, Reinitz F, Youssef M, Hong C, Nathanson D, Akhavan D, Kuya D, Amzajerdi AN, Soto H, Zhu S, et al. An LXR agonist promotes glioblastoma cell death through inhibition of an EGFR/AKT/SREBP-1/LDLR-dependent pathway. Cancer Discov. 2011;1:442–456. doi: 10.1158/2159-8290.CD-11-0102. [DOI] [PMC free article] [PubMed] [Google Scholar]
- Hausinger RP. FeII/alpha-ketoglutarate-dependent hydroxylases and related enzymes. Crit. Rev. Biochem. Mol. Biol. 2004;39:21–68. doi: 10.1080/10409230490440541. [DOI] [PubMed] [Google Scholar]
- Haskins JW, Zhang S, Means RE, Kelleher JK, Cline GW, Canfran-Duque A, Suarez Y, Stern DF. Neuregulin-activated ERBB4 induces SREBP-2 cholesterol biosynthetic pathway and increases low-density lipoprotein uptake. Sci. Signal. 2015;8:ra111. doi: 10.1126/scisignal.aac5124. [DOI] [PMC free article] [PubMed] [Google Scholar]
- Hirst J. Mitochondrial complex I. Annu. Rev. Biochem. 2013;82:551–575. doi: 10.1146/annurev-biochem-070511-103700. [DOI] [PubMed] [Google Scholar]
- Hoefs SJ, Skjeldal OH, Rodenburg RJ, Nedregaard B, van Kaauwen EP, Spiekerkotter U, von Kleist-Retzow JC, Smeitink JA, Nijtmans LG, van den Heuvel LP. Novel mutations in the NDUFS1 gene cause low residual activities in human complex I deficiencies. Mol. Genet. Metab. 2010;100:251–256. doi: 10.1016/j.ymgme.2010.03.015. [DOI] [PubMed] [Google Scholar]
- Horbinski C. What do we know about IDH1/2 mutations so far, and how do we use it? Acta. Neuropathol. 2013;125:621–636. doi: 10.1007/s00401-013-1106-9. [DOI] [PMC free article] [PubMed] [Google Scholar]
- Hu Y, Smyth GK. ELDA: extreme limiting dilution analysis for comparing depleted and enriched populations in stem cell and other assays. J. Immunol. Methods. 2009;347:70–78. doi: 10.1016/j.jim.2009.06.008. [DOI] [PubMed] [Google Scholar]
- Itsumi M, Inoue S, Elia AJ, Murakami K, Sasaki M, Lind EF, Brenner D, Harris IS, Chio II, Afzal S, et al. Idh1 protects murine hepatocytes from endotoxin-induced oxidative stress by regulating the intracellular NADP(+)/NADPH ratio. Cell Death Differ. 2015;22:1837–1845. doi: 10.1038/cdd.2015.38. [DOI] [PMC free article] [PubMed] [Google Scholar]
- Jiang L, Shestov AA, Swain P, Yang C, Parker SJ, Wang QA, Terada LS, Adams ND, McCabe MT, Pietrak B, et al. Reductive carboxylation supports redox homeostasis during anchorage-independent growth. Nature. 2016;532:255–258. doi: 10.1038/nature17393. [DOI] [PMC free article] [PubMed] [Google Scholar]
- Jo SH, Lee SH, Chun HS, Lee SM, Koh HJ, Lee SE, Chun JS, Park JW, Huh TL. Cellular defense against UVB-induced phototoxicity by cytosolic NADP(+)-dependent isocitrate dehydrogenase. Biochem. Biophys. Res. Commun. 2002;292:542–549. doi: 10.1006/bbrc.2002.6667. [DOI] [PubMed] [Google Scholar]
- Kalyanaraman S, Copeland NG, Gilbert DG, Jenkins NA, Gautam N. Structure and chromosomal localization of mouse G protein subunit gamma 4 gene. Genomics. 1998;49:147–151. doi: 10.1006/geno.1998.5223. [DOI] [PubMed] [Google Scholar]
- Kim SY, Lee SM, Tak JK, Choi KS, Kwon TK, Park JW. Regulation of singlet oxygen-induced apoptosis by cytosolic NADP+-dependent isocitrate dehydrogenase. Mol. Cell Biochem. 2007;302:27–34. doi: 10.1007/s11010-007-9421-x. [DOI] [PubMed] [Google Scholar]
- Koh HJ, Lee SM, Son BG, Lee SH, Ryoo ZY, Chang KT, Park JW, Park DC, Song BJ, Veech RL, et al. Cytosolic NADP+-dependent isocitrate dehydrogenase plays a key role in lipid metabolism. J. Biol. Chem. 2004;279:39968–39974. doi: 10.1074/jbc.M402260200. [DOI] [PubMed] [Google Scholar]
- Kouri FM, Hurley LA, Daniel WL, Day ES, Hua Y, Hao L, Peng CY, Merkel TJ, Queisser MA, Ritner C, et al. miR-182 integrates apoptosis, growth, and differentiation programs in glioblastoma. Genes Dev. 2015;29:732–745. doi: 10.1101/gad.257394.114. [DOI] [PMC free article] [PubMed] [Google Scholar]
- Lai A, Kharbanda S, Pope WB, Tran A, Solis OE, Peale F, Forrest WF, Pujara K, Carrillo JA, Pandita A, et al. Evidence for sequenced molecular evolution of IDH1 mutant glioblastoma from a distinct cell of origin. J. Clin. Oncol. 2011;29:4482–4490. doi: 10.1200/JCO.2010.33.8715. [DOI] [PMC free article] [PubMed] [Google Scholar]
- Lam EW, Brosens JJ, Gomes AR, Koo CY. Forkhead box proteins: tuning forks for transcriptional harmony. Nature Rev. Cancer. 2013;13:482–495. doi: 10.1038/nrc3539. [DOI] [PubMed] [Google Scholar]
- Lee SM, Koh HJ, Park DC, Song BJ, Huh TL, Park JW. Cytosolic NADP(+)-dependent isocitrate dehydrogenase status modulates oxidative damage to cells. Free Radic. Biol. Med. 2002;32:1185–1196. doi: 10.1016/s0891-5849(02)00815-8. [DOI] [PubMed] [Google Scholar]
- Losman JA, Kaelin WG., Jr What a difference a hydroxyl makes: mutant IDH1, (R)-2-hydroxyglutarate, and cancer. Genes Dev. 2013;27:836–852. doi: 10.1101/gad.217406.113. [DOI] [PMC free article] [PubMed] [Google Scholar]
- Lunt SY, Vander Heiden MG. Aerobic glycolysis: meeting the metabolic requirements of cell proliferation. Annu. Rev. Cell Dev. Biol. 2011;27:441–464. doi: 10.1146/annurev-cellbio-092910-154237. [DOI] [PubMed] [Google Scholar]
- Mailloux RJ, Beriault R, Lemire J, Singh R, Chenier DR, Hamel RD, Appanna VD. The tricarboxylic acid cycle, an ancient metabolic network with a novel twist. PLoS One. 2007;2:e690. doi: 10.1371/journal.pone.0000690. [DOI] [PMC free article] [PubMed] [Google Scholar]
- Maina EN, Morris MR, Zatyka M, Raval RR, Banks RE, Richards FM, Johnson CM, Maher ER. Identification of novel VHL target genes and relationship to hypoxic response pathways. Oncogene. 2005;24:4549–4558. doi: 10.1038/sj.onc.1208649. [DOI] [PubMed] [Google Scholar]
- Marin-Valencia I, Yang C, Mashimo T, Cho S, Baek H, Yang XL, Rajagopalan KN, Maddie M, Vemireddy V, Zhao Z, et al. Analysis of tumor metabolism reveals mitochondrial glucose oxidation in genetically diverse human glioblastomas in the mouse brain in vivo. Cell Metab. 2012;15:827–837. doi: 10.1016/j.cmet.2012.05.001. [DOI] [PMC free article] [PubMed] [Google Scholar]
- Mashimo T, Pichumani K, Vemireddy V, Hatanpaa KJ, Singh DK, Sirasanagandla S, Nannepaga S, Piccirillo SG, Kovacs Z, Foong C, et al. Acetate is a bioenergetics substrate for human glioblastoma and brain metastases. Cell. 2014;159:1603–1614. doi: 10.1016/j.cell.2014.11.025. [DOI] [PMC free article] [PubMed] [Google Scholar]
- Menendez JA, Lupu R. Fatty acid synthase and the lipogenic phenotype in cancer pathogenesis. Nature Rev. Cancer. 2007;7:763–777. doi: 10.1038/nrc2222. [DOI] [PubMed] [Google Scholar]
- Metallo CM, Gameiro PA, Bell EL, Mattaini KR, Yang J, Hiller K, Jewell CM, Johnson ZR, Irvine DJ, Guarente L, et al. Reductive glutamine metabolism by IDH1 mediates lipogenesis under hypoxia. Nature. 2011;481:380–384. doi: 10.1038/nature10602. [DOI] [PMC free article] [PubMed] [Google Scholar]
- Monticone M, Taherian R, Stigliani S, Carra E, Monteghirfo S, Longo L, Daga A, Dono M, Zupo S, Giaretti W, et al. NAC, tiron and trolox impair survival of cell cultures containing glioblastoma tumorigenic initiating cells by inhibition of cell cycle progression. PLoS One. 2014;9:e90085. doi: 10.1371/journal.pone.0090085. [DOI] [PMC free article] [PubMed] [Google Scholar]
- Nam WS, Park KM, Park JW. RNA interference targeting cytosolic NADP(+)-dependent isocitrate dehydrogenase exerts anti-obesity effect in vitro and in vivo. Biochim. Biophys. Acta. 2012;1822:1181–1188. doi: 10.1016/j.bbadis.2012.04.003. [DOI] [PubMed] [Google Scholar]
- Ohgaki H, Kleihues P. Population-based studies on incidence, survival rates, and genetic alterations in astrocytic and oligodendroglial gliomas. J. Neuropathol. Exp. Neurol. 2005;64:479–489. doi: 10.1093/jnen/64.6.479. [DOI] [PubMed] [Google Scholar]
- Okoye-Okafor UC, Bartholdy B, Cartier J, Gao EN, Pietrak B, Rendina AR, Rominger C, Quinn C, Smallwood A, Wiggall KJ, et al. New IDH1 mutant inhibitors for treatment of acute myeloid leukemia. Nat. Chem. Biol. 2015;11:878–886. doi: 10.1038/nchembio.1930. [DOI] [PMC free article] [PubMed] [Google Scholar]
- Pal I, Patil V, Mondal B, Shukla S, Hegde AS, Arivazhagan A, Santosh V, Somasundaram K. Epigenetically silenced GNG4 inhibits SDF1a/CXCR4 signaling in mesenchymal glioblastoma. Genes Cancer. 2016;7:136–147. doi: 10.18632/genesandcancer.105. [DOI] [PMC free article] [PubMed] [Google Scholar]
- Parsons DW, Jones S, Zhang X, Lin JC, Leary RJ, Angenendt P, Mankoo P, Carter H, Siu IM, Gallia GL, et al. An integrated genomic analysis of human glioblastoma multiforme. Science. 2008;321:1807–1812. doi: 10.1126/science.1164382. [DOI] [PMC free article] [PubMed] [Google Scholar]
- Reitman ZJ, Yan H. Isocitrate dehydrogenase 1 and 2 mutations in cancer: alterations at a crossroads of cellular metabolism. J. Natl. Cancer Inst. 2010;102:932–941. doi: 10.1093/jnci/djq187. [DOI] [PMC free article] [PubMed] [Google Scholar]
- Shechter I, Dai P, Huo L, Guan G. IDH1 gene transcription is sterol regulated and activated by SREBP-1a and SREBP-2 in human hepatoma HepG2 cells: evidence that IDH1 may regulate lipogenesis in hepatic cells. J. Lipid Res. 2003;44:2169–2180. doi: 10.1194/jlr.M300285-JLR200. [DOI] [PubMed] [Google Scholar]
- Su CY, Chang YC, Yang CJ, Huang MS, Hsiao M. The opposite prognostic effect of NDUFS1 and NDUFS8 in lung cancer reflects the oncojanus role of mitochondrial complex I. Sci. Rep. 2016;12:31357. doi: 10.1038/srep31357. [DOI] [PMC free article] [PubMed] [Google Scholar]
- Tan ZW, Xie S, Hu SY, Liao T, Liu P, Peng KH, Yang XZ, He ZL, Tang HY, Cui Y, et al. Caudatin targets TNFAIP1/NFκB and cytochrome c/caspase signaling to suppress tumor progression in human uterine cancer. Int. J. Oncol. 2016;49:1638–1650. doi: 10.3892/ijo.2016.3662. [DOI] [PubMed] [Google Scholar]
- Vander Heiden MG, Lunt SY, Dayton TL, Fiske BP, Israelsen WJ, Mattaini KR, Vokes NI, Stephanopoulos G, Cantley LC, Metallo CM, et al. Metabolic pathway alterations that support proliferation. Cold Spring Harb. Symp. Quant. Biol. 2011;76:325–334. doi: 10.1101/sqb.2012.76.010900. [DOI] [PubMed] [Google Scholar]
- Wahl DR, Dresser J, Wilder-Romans K, Parsels JD, Zhao SG, Davis M, Zhao L, Kachman M, Wernisch S, Burant CF, et al. Glioblastoma therapy can be augmented by targeting IDH1-mediated NADPH biosynthesis. Cancer Res. 2017;77:960–970. doi: 10.1158/0008-5472.CAN-16-2008. [DOI] [PMC free article] [PubMed] [Google Scholar]
- Wise DR, Ward PS, Shay JE, Cross JR, Gruber JJ, Sachdeva UM, Platt JM, DeMatteo RG, Simon MC, Thompson CB. Hypoxia promotes isocitrate dehydrogenase-dependent carboxylation of a-ketoglutarate to citrate to support cell growth and viability. Proc. Natl. Acad. Sci. U. S. A. 2011;108:19611–19616. doi: 10.1073/pnas.1117773108. [DOI] [PMC free article] [PubMed] [Google Scholar]
- Wolf FW, Marks RM, Sarma V, Byers MG, Katz RW, Shows TB, Dixit VM. Characterization of a novel tumor necrosis factor-alpha-induced endothelial primary response gene. J. Biol. Chem. 1992;267:1317–1326. [PubMed] [Google Scholar]
- Ying H, Kimmelman AC, Lyssiotis CA, Hua S, Chu GC, Fletcher-Sananikone E, Locasale JW, Son J, Zhang H, Coloff JL, et al. Oncogenic Kras maintains pancreatic tumors through regulation of anabolic glucose metabolism. Cell. 2012;149:656–670. doi: 10.1016/j.cell.2012.01.058. [DOI] [PMC free article] [PubMed] [Google Scholar]
- Zhang P, Guo Z, Hu R, He X, Jiao X, Zhu X. Interaction between microRNA-181a and TNFAIP1 regulates pancreatic cancer proliferation and migration. Tumour Biol. 2015;36:9693–9701. doi: 10.1007/s13277-015-3704-8. [DOI] [PubMed] [Google Scholar]
- Zheng H, Ying H, Yan H, Kimmelman AC, Hiller DJ, Chen AJ, Perry SR, Tonon G, Chu GC, Ding Z, et al. p53 and Pten control neural and glioma stem/progenitor cell renewal and differentiation. Nature. 2008;455:1129–1133. doi: 10.1038/nature07443. [DOI] [PMC free article] [PubMed] [Google Scholar]
- Zhou C, Li X, Zhang X, Liu X, Tan Z, Yang C, Zhang J. microRNA-372 maintains oncogene characteristics by targeting TNFAIP1 and affects NFκB signaling in human gastric carcinoma cells. Int. J. Oncol. 2013;42:635–642. doi: 10.3892/ijo.2012.1737. [DOI] [PubMed] [Google Scholar]
Associated Data
This section collects any data citations, data availability statements, or supplementary materials included in this article.
Supplementary Materials
Table S1. Related to Figure 4. List of top genes with differential H3K4me3 binding between control and shIDH1-expressing GIC-387.
Table S2. Related to Figure 6. List of differentially expressed genes by micro-array in RTKi- versus vehicle-treated LN382 cells.