

SUMMARY
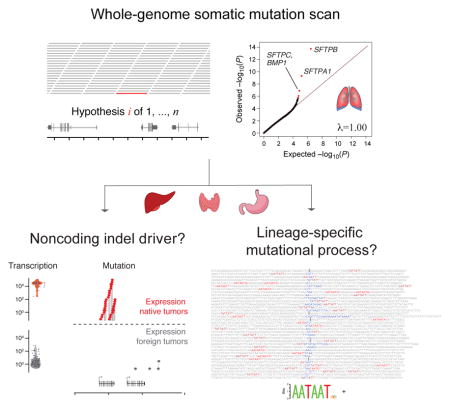
Whole genome sequencing analysis of lung adenocarcinomas revealed noncoding somatic mutational hotspots near VMP1/MIR21 and indel hotspots in surfactant protein genes (SFTPA1, SFTPB, and SFTPC). Extrapolation to other solid cancers demonstrated highly recurrent and tumor-type-specific indel hotspots targeting the noncoding regions of highly expressed genes defining certain secretory cellular lineages: albumin (ALB) in liver carcinoma, gastric lipase (LIPF) in stomach carcinoma, and thyroglobulin (TG) in thyroid carcinoma. The sequence contexts of indels targeting lineage-defining genes were significantly enriched in the AATAATD DNA motif and specific chromatin contexts, including H3K27ac and H3K36me3. Our findings illuminate a prevalent and hitherto unrecognized mutational process linking cellular lineage and cancer.
Graphical Abstract
INTRODUCTION
Large-scale sequencing of human tumor samples has implicated unexpected pathways and mutational processes in carcinogenesis (Garraway and Lander, 2013; Vogelstein et al., 2013). The growing power of whole genome sequencing now enables the discovery of significantly altered loci in noncoding sequences. Examples include the common mutation of the TERT promoter in many cancer lineages (Horn et al., 2013; Huang et al., 2013), alterations of the TAL1 super-enhancer in acute T-lymphoblastic leukemia (Mansour et al., 2014), and the identification of MYC and KLF5 enhancer duplication in multiple epithelial cancer lineages (Zhang et al., 2016).
The vast majority of analytic efforts to nominate mutation hotspots in cancer genomes using statistical approaches have focused on protein-coding regions in whole exome capture data. The 98% of the genome that does not code for proteins includes transcribed but untranslated exons of genes, introns, and noncoding regulatory genetic elements, some of which may harbor clinically important and targetable DNA alterations (Khurana et al., 2013; Melton et al., 2015; Weinhold et al., 2014). For whole exome analysis, statistically calibrated approaches such as InVEx (Hodis et al., 2012) and MutSigCV (Lawrence et al., 2014) have been developed to correct for the mutational heterogeneity that otherwise results in the nomination of spurious hotspots in late replicating and poorly expressed genes. Such calibration is important in the analysis of tumor types harboring high burdens of neutral mutations, such as lung cancer and melanoma (Hodis et al., 2012; Imielinski et al., 2012). This challenge becomes particularly daunting with whole genome sequencing analysis, where the number of hypotheses (i.e. candidate regions) is large while the number of samples is small, relative to whole exome capture data.
Lung adenocarcinoma is the most common type of lung cancer and a prototype for precision oncology (Pao and Hutchinson, 2012). Though several large-scale sequencing studies have resolved the landscape of recurrent coding alterations in lung adenocarcinoma in significant detail (Ding et al., 2008; Govindan et al., 2012; Imielinski et al., 2012; Kan et al., 2010; TCGA Network, 2014a), the analysis of whole genome sequences has thus far revealed only rare noncoding mutations (Weinhold et al., 2014). In the present study, we analyzed whole genome sequences of lung adenocarcinoma using a somatic burden test based on Gamma-Poisson regression (Hilbe, 2014) for analysis of both insertion/deletion (indel) and single nucleotide variant (SNV) somatic mutations.
To our surprise, in addition to alterations of known cancer genes and a noncoding mutation hotspot near MIR21 and VMP1, we found recurrent somatic indel mutations in noncoding regions of surfactant protein genes, the major transcriptional product of type II pneumocytes in the lung. Through statistical analysis of whole genome sequences across a diverse collection of cancers, we found that other tumor types harbor similarly prevalent hotspots of noncoding somatic indel mutations, targeting a class of lineage-defining genes. These highly expressed genes define cell types that play essential biosynthetic roles in the physiology of their respective organs, and (in the majority of cases) represent the precise cell-of-origin for the respective cancers. The frequent indel mutation of this gene class is a previously undescribed feature of cancer genomes and is likely to inform our understanding of the mutational processes and molecular pathogenesis of human cancers.
RESULTS
Recurrent mutation hotspots in lung cancer genomes
To identify regions of the genome under positive somatic mutational selection in lung cancer, we analyzed whole genome sequencing reads from 79 lung adenocarcinoma tumor-normal pairs (Imielinski et al., 2012; TCGA Network, 2014a). These cases comprise predominantly early stage and treatment-naïve surgical resection specimens. We tallied mutation calls across a genome-wide hypothesis set of 2.823 million overlapping 10 Kbp intervals across 2.429 Gbp of eligible genomic territory to identify candidate noncoding hotspots in the genome (Figure 1A).
Figure 1.

(A) Schematic of the Gamma-Poisson regression model used to model genomic variation in mutation density and identify noncoding somatic mutation hotspots in lung adenocarcinoma. The model is applied to n overlapping intervals representing a genome-wide hypothesis set by identifying a combination of k genomic covariate weights αj,j ∈ {1,…,k} and shape parameter θ that is most likely to fit the observed mutation count data yi, i ∈ {1,…,n} and the k covariate values cj, j ∈ {1,…,k}. P-values are computed by identifying the probability of observing a mutation count greater than or equal to the observed mutation count yi under the Gamma-Poisson distribution given the expected value μi and shape parameter θ. The model was fit using k = 8 covariates (STAR*Methods, see Figure S1 for more detailed schematic). (B) Quantile-quantile plots showing P-values for SNV and (C) indel densities across 79 lung adenocarcinoma WGS cases. In these plots, λ refers to the slope of the y = λx line fitting observed −log10 quantiles of observed P values and the uniform distribution.
We applied Gamma-Poisson regression (Hilbe, 2014) to statistically account for the regional genomic heterogeneity in neutral somatic variant densities (Lawrence et al., 2013; Polak et al., 2015; Schuster-Böckler and Lehner, 2012) by modeling counts of patients harboring indel or SNV in each interval as a function of eligible territory width and 8 genomic covariates (Figure 1A, STAR*Methods). Given this model, we computed P-values for mutation enrichment in each interval i with mutation count yi as the probability P(Y ≥ y↓i,θ)), using the expected mutation count μi and shape parameter θ from the Gamma-Poisson regression fit (Figure 1A, Figure S1A).
Quantile-quantile (Q-Q) plots can be used to demonstrate how well a set of genome-wide P-values approximate a uniform distribution through the slope λ of a line y = λx that fits a set of −log10 transformed observed and expected quantiles (Pearson and Manolio, 2008). Algorithms like InVEx (Hodis et al., 2012) and MutSigCV (Lawrence et al., 2014) demonstrate statistically calibrated Q-Q plots (λ near 1) when applied to whole exome sequencing data, but are not readily adaptable to whole genome analysis. Application of our Gamma-Poisson regression model yielded P-values closely aligned to the uniform distribution, as demonstrated by Q-Q plots with λ (genomic inflation) values at 1.01 for SNV and 1.00 for indel analyses (Figure 1B, 1C). The resulting most significant loci are shown in Table S1A (SNV) and Table S1B (indel). Loci significant for SNVs (FDR<0.1, Figure 1B) corresponded to known coding mutation driver alterations in TP53 (P = 3.6 × 10⁻¹⁴), STK11 (P = 3.6 × 10⁻⁸), and KRAS (P = 3.6 × 10⁻⁷), supporting the relevance of this analysis (Table S1A, Figure 1B).
Among the significant SNV loci was a previously uncharacterized noncoding mutation hotspot overlapping VMP1 and MIR21 (Figure 1B, 2A, Table S1A-B). MIR21 encodes a microRNA whose over-expression has been linked to tumorigenesis in lung cancer and other tumor types (Seike et al., 2009). This locus was recently shown to be recurrently amplified in lung adenocarcinoma (Campbell et al., 2016). VMP1 encodes a vacuolar membrane protein that is functionally linked to autophagy and has been found to be recurrently rearranged in several cancer types, including breast and esophageal cancer (Blum et al., 2016; Inaki et al., 2011). Interestingly, the VMP1/MIR21 locus was also the ninth most highly ranked hotspot in the indel analysis (Figure 1C), though it did not pass the FDR threshold of 0.1 (P= 6.4 × 10⁻⁶). The SNV and indels contributing to these hotspots did not affect any coding positions of VMP1 or MIR21, but clustered in a nearly 40 Kbp region of open chromatin and H3K27ac (Figure 2A), as profiled in a lung adenocarcinoma cell line A549. Samples harboring indels or SNVs in this locus demonstrated significantly higher levels of MIR21 expression, while there was no significant association of mutation status with expression of nearby protein-coding genes (TUBD1, VMP1) (Figure 2B).
Figure 2.

(A) Genomic track plot of SNV and mutation hotspots identified in a whole genome scan of lung adenocarcinoma in the vicinity of MIR21. Tracks represent RNA-seq and chromatin data from ENCODE for lung adenocarcinoma cell line A549 (B) Violin plots show mutant vs. wild type expression data for three genes in the vicinity of the nominated mutation hotspot (MIR21, TUBD1, VMP1).
Lung cancer indels target surfactant protein genes
The three most significantly altered loci in the indel analysis of lung adenocarcinomas (Figure 1C, Table S1B) overlapped the genes SFTPB (P = 1.8 × 10⁻¹⁴), SFTPA1 (P = 4.8 × 10⁻¹⁰), and SFTPC/BMP1 (P = 1.3 × 10⁻⁷). SFTPB, SFTPA1, and SFTPC encode surfactant proteins that are specific markers of type II pneumocytes in the normal lung, where they help generate the surface tension required to maintain open air spaces (Haagsman and Diemel, 2001). Though germline mutations in SFTPA1 have been recently linked to adult lung cancer (Nathan et al., 2016), none of these genes have previously been implicated as somatic mutational targets in lung cancer or other tumor types. Surfactant proteins harbor divergent domain structures (SFTPB – 4 Saposin domains, SFTPC – BRICHOS domain, SFTPA1 – Collagen-like and C-type lectin domains) and are not paralogues, though they contribute to the same pathway (Haagsman and Diemel, 2001). The corresponding genomic loci (which we will refer to as SFTP loci) lie on different chromosomes (2, 10, and 8, respectively) and consist of early replicating regions with average GC-content (Figure S1B). Upon visual inspection, the somatic mutations in these loci were supported by multiple tumor DNA-specific alignments of high mapping quality, without strand bias or an excess of mismatches. Furthermore, loci harboring these mutations were not enriched in alignments with low allele frequency mismatches or low mapping quality reads (Table S1B). Though SFTP loci were highly enriched in the indel analysis, they showed no significant deviation from background with respect to SNV density (Figure S1B). Other loci in the indel analysis passing a false discovery threshold of 0.1 were TP53 (P = 8.8 × 10⁻⁷) and MYO5C (P = 1.8 × 10⁻⁶) (Table S1B). Indel density in EGFR was also nominally enriched (P = 2.7 × 10⁻⁶), though it did not pass the genome-wide false discovery threshold (FDR = .12). Unlike with SFTP loci, indels within TP53 and EGFR hotspots comprised exclusively protein-coding variants.
Overall, somatic indel mutations in SFTP loci were found within or near the 3′ UTRs of SFTPB, SFTPA1, and SFTPC (Figure 3A–C). In total, 18/79 (23%) of lung adenocarcinomas harbored one of 21 indels occurring at SFTPB (10 cases), SFTPA1 (5 cases), or SFTPC/BMP1 (4 cases). Among SFTPB-associated indels, only one mutation was predicted to alter transcript structure through the perturbation of a splice site, while the majority were located within (8/11 events) or downstream (2/11 events) of the annotated SFTPB 3′ UTR. Events associated with SFTPC (5 events) and SFTPA1 (5 events) loci occurred exclusively at or downstream of the annotated 3′ UTR of the respective gene. In summary, the vast majority of SFTP indel mutations (19/21) occurring at bases at or downstream of the 3′ UTR were not covered by standard exome capture, as demonstrated by the analysis of aggregate base-resolution coverage profiles across more than 1000 lung cancer exome sequences (Campbell et al., 2016). SFTP indels were not significantly associated with known DNA alterations in lung adenocarcinoma or smoking status (Figure S2A–D), nor with cis gene expression, splicing, or methylation at the respective SFTP gene or other neighboring genes (Figure S2E–F). However, we observed significant gene expression differences at the pathway level when comparing RNA-seq profiles of SFTP mutant and wild type lung adenocarcinomas (Table S2, Figure S3A), including significant upregulation of peptide chain elongation (P = 9.8 × 10⁻⁷), 3′ UTR-mediated translational regulation (P = 9.8 × 10⁻⁵), mitochondrial fatty acid beta oxidation (P = 1.6 × 10⁻⁴), and respiratory electron transport (P = 1.8 × 10⁻⁴) pathways. These pathway changes were comparable in magnitude to those observed for an analysis comparing TP53 mutant vs. wild type transcriptomes in the same dataset, which yielded pathways with established roles in TP53 biology, such as DNA replication, DNA recombination, and cell cycle control (Figure S3B).
Figure 3.

Lollipop plots demonstrating the genomic distribution of mutations in (A) SFTPB, (B) SFTPA1, and (C) SFTPC at two scales of resolution. Gray rectangles shown above the lollipops indicate top peak regions in the significance analysis. Model fits and significance plots are shown in Figure S1B and Table S1C. (D) Expression values from 2917 normal human tissue samples from the GTEx database for SFTPA1, SFTPB, and SFTPC. Tissue types on x-axis are abbreviated as follows: Adipose Tissue (AD), Adrenal Gland (AG), Bladder (BD), Blood (BL), Brain (BR), Breast (BS), Blood Vessel (BV), Cervix Uteri (CE), Colon (CO), Esophagus (ES), Fallopian Tube (FT), Heart (HA), Kidney (KI), Liver (LI), Lung (LU), Muscle (MU), Nerve (NE), Ovary (OV), Pancreas (PA), Pituitary (PI), Prostate (PR), Salivary Gland (SA), Skin (SK), Small Intestine (SM), Spleen (SP), Stomach (ST), Testis (TE), Thyroid (TH), Uterus (UT), and Vagina (VA). (E) Histograms of mutation frequencies of SFTPA1, SFTPB, and SFTPC somatic indels in lung adenocarcinoma and 12 other tumor types comprising 487 WGS sequenced tumor-normal pairs.
SFTPB, SFTPA1, and SFTPC demonstrate striking lung-specific expression in Genotype-Tissue Expression (GTEx) data (Figure 3D) (Melé et al., 2015), obtained from healthy human tissues. To examine whether the corresponding somatic indel patterns were tissue-specific, we analyzed whole genome sequences from 487 tumors representing 12 additional tumor types. Scanning these genomes for somatic variants in the three SFTP loci, we only found two additional samples harboring SFTP indels across these 487 tumors: one in a poorly differentiated, late-stage lung squamous cell cancer and one in a gastric adenocarcinoma. This represents a 25-fold enrichment (95% CI: [13.2, 47.4]) in lung adenocarcinoma vs. other tumor types, even after correcting for sample-specific variations in indel density (P=5.6 × 10⁻²³, Wald test, logistic regression) (Figure 3E).
Multi-cancer analysis of mutation and lineage
Given the specificity of SFTP gene expression to lung tissue and SFTP somatic indels to lung adenocarcinoma, we hypothesized that other tumor types might harbor similar noncoding indel enrichment at highly expressed and lineage-specific genes. Through semi-supervised analysis (see STAR*Methods, Figure S4A–B) of 2917 GTEx samples spanning 30 normal tissues (Melé et al., 2015) we identified three clusters of genes with greater than 1000 RPKM median expression in at least one tissue, comprising 60 housekeeping genes (e.g. RPL13, HLA-B), 47 multi-lineage genes (e.g. APOD, IGFBP7), and 126 lineage-specific genes (INS, CYP2E1, PGA5). We examined somatic mutation densities (normalized to average per-sample mutation density) in these genomic territories (gene +/− 10 Kbp flanking sequence) across 487 whole genome sequenced samples spanning 12 cancer types other than lung adenocarcinoma. For each cancer type, we identified lineage-specific, multi-lineage, and housekeeping gene territories that were either native or foreign to that cancer’s lineage-context based on their expression in healthy GTEx tissues (Table S3A).
We compared variant densities in each tumor context (expression native vs. foreign) and territory class (lineage-specific vs. multi-lineage vs. housekeeping) and evaluated group differences using Gamma-Poisson regression (Figure 4A, Table S3B). We found that lineage-specific gene territories were 14.3 fold (95% CI: [10.7, 19.2], P = 9.5 × 10−70, Wald test, Figure 4B) enriched in indels in the expression native vs. foreign tumor context (Figure 4B). Lineage-specific territories were also significantly enriched in indels relative to both multi-lineage (P = 4.7 × 10⁻²⁴) and housekeeping (P = 1.8 × 10⁻³⁵) territories when examining only expression native tumor contexts (Figure 4B). In contrast, following Bonferroni correction for 6 comparisons (P < 0.0083, adjusted P<0.05), there was no significant expression native vs. foreign enrichment for indel densities at multi-lineage (P = 0.044) or housekeeping territories (P = 0.188), or between multi-lineage and housekeeping territories in expression native tumors (P = 0.29) (Figure 4B). There was no significant difference in the density of SNVs between expression native and foreign tumors at lineage-specific genes (P = 0.146, Figure 4C). There was a significant, albeit modest (<2 fold), SNV enrichment in lineage-specific vs. multi-lineage genes (P = 1.7 × 10⁻⁷, RR: 1.47, 95% CI: [1.27, 1.70]) and lineage-specific vs. housekeeping genes (P = 1.5 × 10⁻⁴, RR: 1.30, 95% CI: [1.13, 1.48]) (Figure 4C, Table S3C) in native tumors. These results suggest a mutational process selectively generating indels at lineage-specific genes within an expression native tumor context.
Figure 4.

Schematic of analysis of mutation density and lineage-context across highly expressed genes and tumors from multiple tissue types. 233 highly expressed genes were identified from analysis of GTEx (Melé et al., 2015) and clustered into housekeeping (HK), multi-lineage (ML), and lineage-specific (LS) categories (see STAR*Methods and Figure S4A–B, Table S3A for details). Mutation densities were then compared in tumors where a given gene territory was expression native (EN) or foreign (EF), on the basis of that tumor’s tissue-of-origin (Table S3A). (B) Violin plots comparing indel and (C) SNV densities in LS/ML/HK gene territories in tumor types in EN and EF tumor contexts across 487 WGS-sequenced cases across 12 (non-lung adenocarcinoma) cancer types. P-values (Wald test, see STAR*Methods) above the plot represent pairwise EN comparisons, while P-values in the middle represent EN vs. EF comparisons within a single LS, ML, or HK territory class.
Four of 11 non-lung adenocarcinoma tumor types demonstrated significant expression native vs. foreign enrichment (adjusted P<0.05) of indel density in lineage-specific gene territories: hepatocellular carcinoma (LIHC, P = 2.8 × 10⁻¹⁵), gastric adenocarcinoma (STAD, P = 6.8 × 10⁻¹⁰), papillary thyroid carcinoma (THCA, P = 5.8 ×10⁻⁸), and cutaneous melanoma (SKCM, P = 0.0043), following Bonferroni correction (adjusted P < 0.05) for 11 hypotheses (Figure S4C, Table S3B). (Bladder tissue was not assigned any lineage-specific genes; hence, bladder cancer could not be evaluated in these analyses). We probed the 233 highly expressed genes to identify those preferentially mutated between native and foreign tumor contexts. We identified five genes with significant indel enrichment (Bonferroni adjusted P<0.05, 52 hypotheses, Wald test, logistic regression, Figure S4D, Table S3D): ALB in hepatocellular carcinoma (P = 2.1 × 10⁻²⁴), ALDOB in hepatocellular and kidney clear cell carcinoma (P = 3.6 × 10⁻⁷), and FGG in hepatocellular carcinoma (P = 4.0 × 10⁻⁶), TG in thyroid carcinoma (P = 1.3 × 10⁻¹³), and LIPF in gastric adenocarcinoma (P = 6.7 × 10⁻¹³) (Figure 5A–C). As with SFTP genes, all of these genes were strongly and preferentially expressed in the presumed tissue-of-origin of the cancer type in which they were found to be mutated (Figure 5D).
Figure 5.

Lollipop plots demonstrating the genomic distribution of (A) ALB (B) TG and (C) LIPF hotspot somatic indels within and outside of their expression native context (hepatocellular carcinoma, thyroid cancer, and gastric cancer, respectively). (D) Expression values from 2917 normal human tissue samples and 30 tissues for ALB (albumin), TG (thyroglobulin), and LIPF (gastric lipase) obtained from GTEx. See Figure 3 legend for tissue type abbreviations.
ALB encodes albumin, which is the most abundant protein in human plasma and synthesized primarily by hepatocytes (Farrugia, 2010). ALB was targeted by indels in 41% (22/54) of hepatocellular carcinoma cases and showed 17.6-fold enrichment of indels (95% CI: [10.2, 30.6]) in hepatocellular carcinoma vs. other tumor types, mirroring its tissue-specific expression pattern (Figure 5A, Figure S4D). A recent WGS study in an independent Japanese hepatocellular carcinoma cohort found ALB mutations in 14% of 268 patients (Fujimoto et al., 2016). TG encodes thyroglobulin, a protein produced by follicular cells of the thyroid that alone comprises more than half of that organ’s mass (Boron and Boulpaep, 2008). TG is specifically expressed in thyroid tissue and was targeted by indels in 43% (20/47) of thyroid carcinoma samples, representing a 9.03-fold enrichment in thyroid carcinomas relative to other tumor types (95% CI: [5.04, 16.2]) (Figure 5B, Figure S4D). LIPF, encoding gastric lipase, is a secretory product of chief cells that reside in the antral and fundic gastric mucosa (Roussel et al., 1999). This gene was targeted by indels in 18% (9/39) of gastric adenocarcinoma samples and showed 15.5-fold enrichment of indels (95% CI: [7.34, 32.7]) in gastric cancer vs. other tumor types (Figure 5C, Figure S4D, Table S3D). ALB and TG showed significant, but more modest (3–5 fold) enrichment in SNV density between native and foreign tumors (Figure S4D, Table S3D). As with SFTP locus mutations, ALB, TG, and LIPF indels predominantly target noncoding sequences (Figure 5A–C, Table S4A). Tables of indel mutation calls at LIPF and TG loci with image links to genome viewer variant snapshots are provided as Table S4A.
Noncoding mutations occurring in introns and untranslated regions of genes may exert biological effects by perturbing splicing, gene expression, and methylation, among other mechanisms. We tested cis associations between tumor gene expression or splicing and somatic indel status in loci nominated in these analyses (ALB, FGG, ALDOB, LIPF, TG) and did not find any significant associations (Figure S5A–J). Testing methylation differences between mutant and wild type samples, we observed a significant reduction of ALB methylation in liver cancers harboring noncoding ALB indels (P = 9.0 × 10⁻⁵), and not at other genes in the genomic vicinity of the ALB locus (Figure S5K). There were no associations between cis methylation and indel status across the other indel hotspots. As with SFTP mutations in lung adenocarcinomas, we observed significant pathway differences when comparing transcriptomes of samples that were mutant vs. wild type for lineage indel hotspot mutations (Table S2). In liver cancer (LIHC), we found significant upregulation of fatty acid metabolism (P = 3.1 × 10⁻⁵), glycine, serine and threonine metabolism (P = 8.5 × 10⁻⁵), and numerous amino acid and redox metabolism pathway differences between tumors that harbored noncoding indels in ALB, FGG, and ALDOB vs. tumors that were wild type for all of these loci (Figure S6A). In thyroid cancer, we found significant downregulation of immune pathways in tumors harboring TG noncoding indels vs. wild type tumors, marked by downregulation of HLA expression (Allograft rejection, Graft vs. Host Disease pathways), CTLA4 pathway, and PD1 signaling pathway (Figure S6B). The common theme among these observed gene set changes is not immediately clear.
Lineage-specific indels are enriched in specific chromatin contexts
To examine the topographic context of lineage indel hotspots, we analyzed somatic variant data with respect to tumor-tissue matched (Table S5A-B) chromatin features identified by ENCODE (ENCODE Project Consortium, 2012), the Epigenomics Roadmap (Roadmap Epigenomics Consortium et al., 2015), and other annotations (see STAR*Methods for details). For a given feature, such as H3K4me3, we used Gamma-Poisson regression to examine the enrichment of indels in peak vs. non-peak associated subsets of the hotspot-associated territory, comparing this enrichment to that associated with other highly expressed genes and background (1000 randomly chosen genes), in 100 bp, 1 Kbp, and 10 Kbp windows defined around the peak region. Applying 440 analyses across 110 chromatin marks yielded 64 significant depletion/enrichment associations across 25 epigenetic features following Bonferroni correction (Figure 6A, Table S5C).
Figure 6.

Topographic feature enrichment analysis. (A) Volcano plot demonstrating top enriched and depleted topographic features, including chromatin marks, transcription factor binding sites, and loop domain annotations. Indel densities in peak-associated regions (within 0, 100 bp, 1 Kbp, 10 Kbp of a peak) were evaluated using Gamma-Poisson regression at hotspot genes vs. other highly expressed genes and a panel of 1000 randomly chosen genes. (B) Matrix demonstrating mutational support for significantly enriched features stratified by tumor type and window distance. (C) Violin plots demonstrating supporting data for two of the most significantly enriched features in the Epigenomics Roadmap dataset. The interaction P-value (Wald test) is shown at the top, and additional P-values associated with individual pairwise comparisons are indicated using rectangular connectors. (D) Genomic track plots demonstrating peaks (red ranges) and high-resolution (−log10 P value of ChIP-Seq enrichment) signals for H3K27Ac and H3K36me3 near select mutational hotspots in lung, liver, thyroid, and gastric cancer. See STAR*Methods for analytic details.
We detected several chromatin marks with indel density enrichment in hotspot regions relative to highly expressed genes or background, most significantly H3K79me2, H420me1, H3K36me3, H3K4me3, and H3K27Ac. H3K27ac and H3K36me3 were associated with indel mutations across all four tumor types at a window width of 1 Kbp or greater (Figure 6B) and were enriched in their indel densities relative to both highly expressed genes and background (Figure 6C). The strongest ChIP-Seq signal for these chromatin marks was found in the lung (A549 cell) and liver cancer (HepG2 cell) models, though thyroid (“Fetal adrenal”) and gastric (“Gastric digestive”) cancer models also contributed to this association (Figure 6D). Other enrichment signals were driven either by a single tumor type, in particular several transcription factor binding site associations (NRSF, TCF4) and Pol2 that were driven by liver cancer and HepG2 cells. Conversely, several chromatin marks were associated with significant indel density depletion in lineage-indel hotspot regions, including H2BK5ac and H2BK15ac, compared to both other highly expressed genes and background (Figure S7).
In addition to ENCODE features, we examined hotspot-specific indel depletion or enrichment in the vicinity of nuclear compartment transitions including TAD boundaries (Jin et al., 2013), loop domains (Rao et al., 2014), and alternate polyadenylation sites (APA) (You et al., 2015). We found significant enrichment of indels within 10 Kbp of loop domains, previously defined (Rao et al., 2014) through high-resolution Hi-C analyses as sites demarcating nuclear compartments. This association was driven by a highly significant depletion of somatic indels in loop domain neighborhoods in background genes (P = 4.2 × 10⁻¹⁹), which was absent in both highly expressed genes (P = 0.30) and hotspot genes (P = 0.22) (Figure S7C). We also found significant enrichment of indels in hotspot regions within 1 Kbp of APA sites, but this was not significant relative to other highly expressed genes, instead driven by both groups having an elevated APA-associated indel density relative to background (Figure S7D). Though these associations may not be relevant to the biology of hotspot loci, the relationship of indel densities with expression, loop domains, and APA regions appears significant and may warrant further investigation.
The enrichment of recurrent somatic indels in loci encoding highly transcribed and lineage-specific genes in lung, gastric, and thyroid cancer suggests the signature of a somatic mutational process shaping the cancer genome. One candidate for such a process is transcription-associated mutagenesis (TAM), which creates indels that expand or contract polynucleotide repeats following the collision of replication and transcription machinery at highly transcribed genes (Jinks-Robertson and Bhagwat, 2014). TAM has been previously invoked as a hypothetical mechanism for somatic mutation enrichment in COL2A1, a highly expressed and cartilage-specific gene, in chondrosarcoma (Tarpey et al., 2013).
To investigate this hypothesis, we probed the immediate sequence context of somatic indels targeting highly expressed genes across the 13 tumor datasets (including lung adenocarcinoma). We found that the inserted or deleted sequences associated with lineage-specific hotspot indels were not significantly more likely to expand or contract a repeat than non-hotspot events (P=0.12, Fisher’s exact test, Table S4B-C). Though lineage-associated indels were not associated with an enrichment of this particular TAM signature, a large-fraction (>=90%) of noncoding somatic indels involved a repeat contraction or expansion whether or not they were contained inside a lineage-specific hotspot. We did not identify any significant G vs. C or A vs. T transcriptional strand bias either within or around inserted or deleted sequences. We however found significant enrichment of AT (vs GC) bases associated with hotspot indels, both within deleted sequences (P = 7.7 × 10⁻⁵, Wilcoxon rank-sum test, Table S4C) and their 5-base genomic neighborhoods (P = 2.55 × 10⁻⁴), though the biological significance of this enrichment is unclear.
A recent bacterial study has proposed that replication-transcription collision is a mechanism of indel mutagenesis (Sankar et al., 2016). This mechanism is thought to be distinct from TAM though it may be used to explain transcription-associated indel events. To probe signatures of replication-transcription collisions, we examined indel patterns as a function of replication and transcription strands. A recently published study by Haradhvala and colleagues (Haradhvala et al., 2016) examined strand asymmetry of SNVs across many cancer types and ascertained replication direction through the analysis of replication-timing datasets. We applied Haradhvala et al.’s annotation to examine indel patterns in highly expressed genes. Specifically, we classified genic regions as being either “co-directional” (if the associated strand of transcription matched the strand of replication) or “head-on” (if the transcription strand was opposite to the replication strand), where “+” (vs. “−”) transcripts were considered co-directional (vs. head-on) to right (vs. left) replicating genomic regions. Examining mutation patterns across highly expressed genes in 13 cancers, we found significant indel enrichment in “head-on” gene territories in the native expression context (P = 0.0035) (Figure S7E). This asymmetry suggests that expression-associated indels may be the result of head-on replication-transcription collisions. However the degree of this enrichment is mild, and likely does not account fully for the lineage-specific indel phenomenon driving observed indel hotspots.
Lineage-specific indels arise near a motif, AATAATD
To examine previously undescribed sequence contexts that might be associated with lineage-specific indel hotspots, we examined sequence features in the 50-base neighborhood of highly expressed indels. Applying the DREME algorithm (http://meme-suite.org/), we discovered significant enrichment of an AATAATD/HATTATT (E = 5.9 × 10⁻¹⁰) motif in the vicinity of hotspot- vs. non-hotspot-associated indels (Figure 7A). (In this motif notation, D and H are IUPAC ambiguity codes describing and “A, G, T, not C” and “A, C, T, not G”, respectively). The motif was present in 38/107 (35%) of hotspot-associated indels but only 19/355 (5.3%) of non-hotspot-associated indels (OR = 10.3, 95% CI: [4.89, 22.1], P=5.7 × 10⁻¹¹), with particularly strong enrichment for LIPF/STAD events (10/11 events, OR= 170, 95% CI: [22, 7300], P = 2 × 10⁻¹¹). The correlation was not driven purely by indels associated with the LIPF hotspot: there was also a significant enrichment of this motif among non-LIPF events (OR= 7.2, 95% CI: [3.7, 15], P = 1.2 × 10⁻⁹) (Figure 7B). The AATAATD motif occurred on either side, or occasionally both sides, of the indel lesion (oriented with respect to the transcribed strand of the respective genes), did not exhibit transcriptional strand bias, and occasionally was disrupted by a deletion event (Figure 7C). A subset of this motif (AATAAT or AAUAAU) comprises the sequence target of a microRNA MIR126 which has been previously linked to cancer and metastasis (Png et al., 2012). AATAATD does not match any known eukaryotic motif in TOMTOM (http://meme-suite.org/tools/tomtom); however, it resembles the AATAAA polyadenylation site conserved across eukaryotes (Proudfoot, 2011).
Figure 7.

(A) Logo of AATAATD motif (and its reverse complement HATTATT) significantly enriched in the sequence neighborhood of 107 lineage-specific hotspot indels (associated with LIPF, TG, or SFTP loci) relative to 355 somatic indels associated with other highly expressed genes. E-value calculated using DREME (http://meme-suite.org/tools/dreme). “D” and “H” are IUPAC ambiguity codes describing “A, G, T, not C” and “A, C, T, not G”, respectively. (B) Fraction of indel events harboring the AATAATD motif in their sequence neighborhood stratified by tumor type. (C) 50-base sequence context around 36 of 107 lineage-specific hotspot indels that harbor the AATAATD motif in their sequence neighborhood, with sequences oriented to the (+) transcript strand of the associated gene. The motifs are color coded with respect to strand. The site of the indel lesion is located in the middle of each sequence.
Discussion
We have applied a whole genome sequence analysis approach to nominate recurrently somatically mutated regions across 79 lung adenocarcinoma cases, among these a hotspot of noncoding SNVs and indels in the vicinity of MIR21, a microRNA previously shown to be amplified and overexpressed in lung adenocarcinoma. Through this analysis, we discovered a phenomenon of recurrent somatic indel mutations in multiple cancer types located in lineage-specific genes that exhibit high expression in the cognate tissues of the respective cancers. Larger-scale whole genome and targeted sequencing analyses will further delineate the distribution and prevalence of these lineage-specific indel mutations across a broader range of cancer types.
One possible interpretation of the high prevalence (20–40%) and statistically significant enrichment of these lineage-specific mutations is that these genes (i.e. SFTPB, ALB, TG, LIPF) may be targets of positive selection in their respective cancer types. Mutations in SFTP loci were the most highly significant somatic indel alterations discovered in lung adenocarcinoma, using a statistically calibrated genome-wide test that corrected for known covariates of neutral mutation density. The remaining loci emerged through a focused analysis between normal tissue gene expression and somatic mutation patterns in tumors, yielding a similarly strong statistical signal of expression native indel enrichment at several lineage-specific genes.
Alternatively, these lineage-specific indel mutation patterns may be the result of a focal and previously undescribed mutational process. The correlation of these mutations to several genomic features (e.g. chromatin marks and AATAATD sequence motif) may reflect features of the mutational process that generated them rather than indicate a particular direction of selection pressure during tumor evolution. It is thus appropriate to entertain both hypotheses (driver hotspot vs. mutational process) as possible explanations for the described lineage-specific mutational phenomenon.
If these loci are indeed cancer-relevant genes, they may represent dominant oncogenes or recessive tumor suppressors. Since malignant transformation is frequently associated with dedifferentiation, a trivial explanation for these observations may be that these mutations halt the production of a metabolically expensive protein product as a tumor cell sheds the specialized characteristics of its cell-of-origin. According to this hypothesis, we might expect to see these genes also frequently targeted by deletions or truncating mutations. This however has not been observed in large-scale exomic mutation studies of these tumor types (Imielinski et al., 2012; TCGA Network, 2014b; 2014c; 2014a) or GISTIC analysis of focal copy number alterations (http://www.broadinstitute.org/tcga/gistic/) (Zack et al., 2013), with the exception of ALB mutations in hepatocellular carcinoma (Fujimoto et al., 2016; Schulze et al., 2015). Furthermore, our analysis does not demonstrate significant reduction of cis gene expression of the corresponding transcript in mutant tumors compared to wild type. Though alterations in cancer cell gene expression could be masked in these samples through sample contamination with non-neoplastic epithelium expressing high transcript quantities, the above observations argue against a simple loss-of-function role for these indel mutations.
If these mutations drive cancer through a dominant oncogenic effect, they would likely affect the epigenetic or transcriptional state of cancer cells, including splicing, methylation, noncoding RNA expression, or distribution of chromatin marks. Though our analyses do not demonstrate any mutation-associated cis changes in transcription, exon splicing, or methylation, across the various tumor types that harbor such hotspots (LUAD, LIHC, THCA, STAD) (with the exception of a cis reduction of ALB methylation levels in the setting of ALB indels) (Figure S2, Figure S5), we observe statistically significant changes of gene expression in trans at the pathway level. In lung adenocarcinoma, the signal strength of pathway level gene expression changes with SFTP gene mutations is comparable to those obtained from an identical gene set analysis comparing TP53 mutant and wild type samples. While the TP53 gene set analysis reveals pathways involved in TP53 biology (cell cycle progression, DNA replication), trans expression changes associated with SFTP noncoding mutants point to pathways involved in 3′ UTR RNA processing and protein synthesis. It is unclear how 3′ UTR mutations that appear to be transcriptionally inert in cis might globally upregulate RNA processing and protein synthesis in trans, though detailed transcriptomic and proteomic comparisons of mutant and wild type isogenic cell lines may shed light into possible mechanisms. One possibility is that these pathway changes are not causally tied to the associated genetic lesions, but rather tag a particular evolutionary trajectory in tumorigenesis which is reflected in the transcriptional signature. However, we do not observe a significant association of SFTP mutations with any known lung adenocarcinoma driver, which one would expect to be linked to a reproducible evolutionary path. Functional characterization of the phenotypic impact of these noncoding mutations through transgene over-expression or genome editing in controlled cellular or animal models of cancer will be necessary to evaluate their potential as bona fide cancer drivers. Additional proteomic profiling of genotyped tumor samples and cell lines will determine whether these mutations exert their effects by altering translation in cis (e.g. whether SFTPB 3′ UTR mutations alter SFTPB translation without perturbing gene expression or splicing).
If the observed indel patterns are not the result of selection, they may constitute a previously uncharacterized transcription-associated somatic mutation phenomenon. The relationship between transcription and mutation has been studied extensively in yeast (Jinks-Robertson and Bhagwat, 2014), and recently explored in human cancer genome studies (Chapman et al., 2011; Haradhvala et al., 2016; Lawrence et al., 2013; Pleasance et al., 2009a; 2009b). The indel patterns reported in this study do not readily fall under previously described phenomena such as transcription coupled repair (which results in reduced mutation density in highly expressed genes) or transcriptionally coupled damage (which is associated with A→G SNV in hepatocellular cancer) (Haradhvala et al., 2016). They also cannot be readily explained by mismatch repair deficiency or microsatellite instability (Kim et al., 2013; Supek and Lehner, 2015; Zhao et al., 2014), as they do not cluster in hyper-mutator patients, are not enriched in microsatellite contexts, and arise in focal genomic regions rather than affecting genome-wide mutation distributions. Furthermore, they do not exhibit signatures of transcription-associated mutagenesis (TAM) or transcription-associated recombination (TAR), which have been characterized in yeast and E. coli and proposed as a source of genome instability in human cancer (Kim and Jinks-Robertson, 2012). While somatic indels in lineage genes are enriched in genes that are transcribed in a head-on orientation relative to the direction of replication (Figure S7E), this correlation appears to account for a minority of the expression native enrichment that is associated with the key indel hotspots that we have nominated in liver, lung, gastric, and thyroid cancer.
The indel hotspots described in this study target a special class of loci, encoding protein products that are manufactured in large quantities by a single cell type within a specific organ. Moreover, the secretion of these lineage-defining proteins is a primary function of that cell type and vital to healthy organ and systems physiology. For example, SFTPB, SFTPA1, and SFTPC proteins are secreted from type II alveolar cells to coat 300 million microscopic air-spaces in the human lung, allowing alveoli to efficiently inflate and preventing pulmonary collapse (Andreeva et al., 2007). Albumin, the product of the ALB gene, comprises more than half of the blood plasma protein mass and is responsible for the oncotic pressure that maintains intravascular volume (Farrugia, 2010). Thyroglobulin, the product of the TG gene, comprises over half of the mass of the thyroid gland, where it is used to synthesize thyroid hormone (Boron and Boulpaep, 2008). Gastric lipase, the product of the LIPF gene, catalyzes the majority of lipid hydrolysis in the stomach (Roussel et al., 1999).
Further sequencing and analysis will reveal what additional tumor types are affected by the mutational phenomenon described in this study, and whether it is a hallmark of carcinomas arising from secretory epithelial cell types or a more general phenomenon. Our results build upon recently discovered links between epigenetic features of normal tissues and tumor-specific mutation patterns (Polak et al., 2015). However, in contrast to the broad megabase-level correlations that Polak and colleagues observed between tissue-specific epigenetic patterns and local somatic SNV densities in cancer, our data demonstrate a much more focal pattern of tissue specificity for indel mutations. Though the mutation patterns observed in our whole genome sequencing analyses (results not shown) do not suggest that these lesions are subclonal or present in normal-adjacent tissues, deep sequencing of normal, pre-malignant, and malignant epithelium will be needed to examine the precise timing of these mutations in tumor evolution.
The clinical implications of recurrent indel mutations in lineage-specific genes across multiple cancer types remain to be fully elucidated. Reproducible links between the transcriptional or epigenetic state of a healthy cell and the mutational state of a tumor may be diagnostically useful in cases where a poorly differentiated cancer has drifted phenotypically from its cell or tissue-of-origin, including but not limited to the diagnostic dilemma of carcinoma of unknown primary origin. Analysis of lineage-specific indel patterns may also illuminate the study of field cancerization through deep sequencing of tumor-adjacent tissues. Finally, the tissue and cancer selectivity of lineage-specific indel mutations could be exploited in the future for early cancer detection or for circulating tumor DNA monitoring.
STAR*METHODS
KEY RESOURCES TABLE
| REAGENT or RESOURCE | SOURCE | IDENTIFIER |
|---|---|---|
| Deposited Data | ||
| Human reference genome hg19 | Genome Reference Consortium | http://hgdownload.cse.ucsc.edu/goldenpath/hg19/chromosomes/ |
| GENCODE v19 | (Harrow et al., 2012) | https://www.gencodegenes.org/releases/19.html# |
| Whole genome and RNA-sequencing .bam or .fastq files for STAD, LUAD, LUSC, SKCM, THCA, BLCA, BRCA, GBM, HNSC, LIHC, KIRC, and LGG projects, whole exome sequencing .bam files for LUAD project | The Cancer Genome Atlas (TCGA) | phs000178.v1.p1 |
| TCGA Level 3 gene expression, splicing, methylation, clinical, and miRNA profiles for STAD, LUSC, SKCM, THCA, BLCA, BRCA, GBM, HNSC, LIHC, KIRC, and LGG samples | Firehose Broad Institute TCGA GDAC | http://gdac.broadinstitute.org |
| Lung adenocarcinoma whole genome sequencing .bam files | (Imielinski et al., 2012) | phs000488.v1.p1 |
| Prostate adenocarcinoma whole genome sequencing .bam files | (Baca et al., 2013) | phs000447.v1.p1 |
| Metastatic melanoma whole genome sequencing .bam files | (Berger et al., 2012) | phs000452.v1.p1 |
| ENCODE ChIP-Seq, DNaseI seq, and TFBS profiles | (ENCODE Project Consortium, 2012) | http://www.genome.gov/ENCODE/ |
| Epigenomics Roadmap ChIP-Seq, ChromHMM, DNaseI hypersensitivity, and TFBS profiles | (Roadmap Epigenomics Consortium et al., 2015) | http://egg2.wustl.edu/roadmap/web_portal/ |
| Genome-Tissue Expression project | (Melé et al., 2015) | http://www.gtexportal.org |
| Molecular signatures database: Canonical Pathways gene sets | Broad Institute | http://software.broadinstitute.org/gsea/msigdb/genesets.jsp?collection=CP |
| TAD boundary annotations | (Jin et al., 2013) | GSE43070 |
| Loop domain annotations | (Rao et al., 2014) | GSE63525 |
| Alternate polyadenylation sites | (You et al., 2015) | http://genome.bucm.edu.cn/utr/ |
| Replication direction annotation | (Haradhvala et al., 2016) | http://www.broadinstitute.org/cancer/cga/AsymTools |
| Replication timing annotation | (Koren et al., 2012) | http://mccarrolllab.com/wp-content/uploads/2015/03/Koren-et-al-Table-S2.zip |
| Software and Algorithms | ||
| BWA v0.5.9 | (Li and Durbin, 2009) | http://bio-bwa.sourceforge.net |
| Picard v1.8 | Broad Institute | https://broadinstitute.github.io/picard/ |
| GATK v3.1 | Broad Institute | https://software.broadinstitute.org/gatk/ |
| Strelka v2.0 | (Saunders et al., 2012) | https://sites.google.com/site/strelkasomaticvariantcaller/home |
| R 3.3 (data.table, stats, MASS) | The R Project | https://www.r-project.org/ |
| Bioconductor 3.4 (GenomicRanges, Rsamtools, Biostrings, limma) | Bioconductor | https://www.bioconductor.org/ |
| TITAN | (Ha et al., 2014) | http://compbio.bccrc.ca/software/titan/ |
| fish.hook | Imielinski lab | https://github.com/mskilab/fish.hook |
| skitools | Imielinski lab | https://github.com/mskilab/skitools |
| gUtils | Imielinski lab | https://github.com/mskilab/gUtils |
| gTrack | Imielinski lab | https://github.com/mskilab/gTrack |
| MuTrix | Imielinski lab | https://github.com/mskilab/MuTrix |
| MEME suite v4.7 | (Bailey et al., 2009) | http://meme-suite.org/tools/dreme |
| Other | ||
| Universal mask for whole genome sequencing variant calling | Heng Li, personal communication | https://github.com/lh3/sgdp-fermi/releases/download/v1/sgdp-263-hs37d5.tgz |
CONTACT FOR REAGENT AND RESOURCE SHARING
Further information and requests for resources and reagents should be directed to and will be fulfilled by the Lead Contact: Matthew Meyerson (matthew_meyerson@dfci.harvard.edu).
EXPERIMENTAL MODEL AND SUBJECT DETAILS
Human Subjects
Cancer genome sequence data were generated through informed consent as part of previously published sequencing studies and analyzed in accordance with each original studies’ data use guidelines and restrictions. Data are available via dbGAP controlled access (http://view.ncbi.nlm.nih.gov/dbgap-controlled, accession numbers: phs000488.v1.p1, phs000447.v1.p1, phs000452.v1.p1, phs000178.v1.p1).
Gender and age characteristics of study participants were as follows: Prostate adenocarcinoma from (Baca et al., 2013) (31 cases, 100% male, median age 62 years [range 46–73]); Cutaneous melanomas from (Berger et al., 2012) (25 cases, 68% male, median age 49.5 years [range 25–77]); Lung adenocarcinoma from (Imielinski et al., 2012) (29 cases, 72.4% male, median age 64 years [range 43–83]); Bladder cancers from (TCGA Network, 2014d) (23 cases, 65.2% male, median age 65 years [range 34–84]); Breast carcinoma from (TCGA Network, 2012a) (95 cases, 1.1% male, median age 58 years [range 30–89]); Glioblastoma from (Verhaak et al., 2013) (27 cases, 63% male, median age 60 years [range 21–76]); Head and neck squamous from (TCGA Network, 2015a) (16 cases, 81.2% male, median age 53 years [range 29–75]); Kidney chromophobe from (TCGA Network, 2013) (5 cases, 60% male, median age 62 years [range 51–77]); Low grade glioma from (Ceccarelli et al., 2016) (19 cases, 42.1% male, median age 39 years [range 17–62]); Hepatocellular carcinoma from TCGA (54 cases, 55.6% male, median age 65.5 years [range 23–84]); Lung adenocarcinoma from (TCGA Network, 2014a) (50 cases, 48% male, median age 66 years [range 41–82]); Lung squamous cell from (TCGA Network, 2012b) (50 cases, 76% male, median age 68 years [range 47–83]); Prostate adenocarcinoma from (TCGA Network, 2015b) (20 cases, 100% male, median age 60 years [range 46–73]); Cutaneous melanoma from (TCGA Network, 2015c) (33 cases, 78.8% male, median age 52 years [range 25–81]); Gastric adenocarcinoma from (TCGA Network, 2014b) (40 cases, 65% male, median age 70 years [range 39–90]); Thyroid carcinoma from (TCGA Network, 2014c) (49 cases, 22.4% male, median age 49 years [range 17–85]).
METHOD DETAILS
Sequence data and processing
We obtained WGS reads for 50 TCGA lung adenocarcinoma (LUAD), 50 lung squamous cancer (LUSC), 33 cutaneous melanoma (SKCM), 49 papillary thyroid carcinoma (THCA), 23 bladder cancers (BLCA), 95 breast cancer (BRCA), 27 glioblastoma (GBM), 16 head and neck squamous (HNSC), 54 hepatocellular carcinomas (LIHC), 5 kidney cancer chromophobe (KIRC), 19 low-grade glioma (LGG), 40 gastric cancers (STAD), and 20 prostate cancer (PRAD) tumor-normal pairs via dbGAP access phs000178.v1.p1 (TCGA Network, 2012a; 2012b; 2013; 2014a; 2014b; 2014c; 2014d; 2015b; 2015c). We also obtained WGS reads for 29 lung adenocarcinoma cases from Imielinski et al. (dbGAP phs000488.v1.p1) (Imielinski et al., 2012), 31 prostatic adenocarcinoma cases from Baca et al. (dbGAP phs000447.v1.p1) (Baca et al., 2013), and 25 metastatic melanoma cases from Berger et al. (dbGAP phs000452.v1.p1) (Berger et al., 2012). Paired-end read data were aligned to hg19 using BWA aln and sampe v0.5.9 (http://bio-bwa.sourceforge.net/) (Li and Durbin, 2009) We used Picard v1.8 (https://broadinstitute.github.io/picard/) and Genome Analysis Toolkit v3.1 (https://software.broadinstitute.org/gatk/) for downstream duplicate marking, base quality score recalibration, and local realignment around indels in tumor and normal. We called somatic SNVs and indels using Strelka v2.0.13 (Saunders et al., 2012).
Whole genome somatic variants were filtered against a “universal mask” (Heng Li, personal communication) implementing the principles outlined in (Li, 2014). This mask specifies genomic regions that are likely to harbor recurrent artefactual variant calls. The mask is available as a gzipped bed file at https://github.com/lh3/sgdp-fermi/releases/download/v1/sgdp-263-hs37d5.tgz, was created using a script detailed in https://gist.github.com/lh3/9d6dcfc3436a735ef197. Briefly, this script filters regions that have either (1) low mappability, (2) low complexity, or (3) are enriched in aberrant SNP calls in the 1000 genomes project (http://www.1000genomes.org/). Low mappability hg19 regions were defined from genomic positions for which 37 or fewer of all possible 75-mers intersecting that position cannot be mapped elsewhere in the genome with at most one mismatch or gap. Low complexity hg19 regions were defined by running the mdust program (https://github.com/lh3/mdust), UCSC RepeatMasker (http/.genome.ucsc.edu), and homopolymers that span 7 or more bases. SNP-enriched regions corresponding to regions of likely hg19 misassembly were chosen as clusters of pre-filtered 1000 Genomes Project SNP calls that harbored excess heterozygosity. All instances of “eligible territory width” in the manuscript are made with reference to the intersection of this interval mask with a particular genomic region (e.g. gene, 10 Kbp tile)
Genome-wide noncoding mutational scan
To identify regions of the genome under positive somatic mutational selection in lung cancer, we analyzed whole genome sequencing reads from 79 lung adenocarcinoma tumor-normal pairs (Imielinski et al., 2012; TCGA Network, 2014a) aligned to hg19 by BWA (Li and Durbin, 2009), with mean tumor coverage of 54.9 fold (range 41–86) and mean normal coverage of 39.8 fold (range 23–49). These samples were drawn from predominantly early stage and treatment naïve surgical resection cases. We generated variant calls using the Strelka (Saunders et al., 2012) algorithm filtered by a genomic interval mask (Heng Li, personal communication, see above), yielding 4.65 million somatic single nucleotide variants (SNV) and 36,333 somatic insertion/deletion (indel) variants, corresponding to a mean SNV density of 14.3 per Mbp (range 0.13–99) and mean indel density of 0.09 per Mbp (range 0.0008–0.41) across 2.429 Gbp of eligible territory. Masked regions (666 Mbp) corresponded to regions of low-complexity, low-mappability, and misassembled sequence on hg19, implementing the principles described in (Li, 2014). We tallied mutation calls across the intersection of 6.191 million regularly spaced 10 Kbp intervals (each overlapping by 9.5 Kbp) and the 2.429 Gbp of eligible territory. We used this spacing and interval size as a genome-wide hypothesis set for identifying candidate noncoding hotspots in the genome (Figure 1A), with a focus on regulatory elements (e.g. enhancers or promoters) which are usually less than 10 Kbp in size and would presumably appear as local peaks of mutational density in the analysis. Among the 6.191 million tiles, we excluded regions with fewer than 75% eligible bases or greater than 95% quiescent chromatin as assessed by ChromHMM (Ernst and Kellis, 2012) analysis of the A549 lung adenocarcinoma cell line ENCODE profiles (http://www.genome.gov/ENCODE/), yielding a final set of 2.823 million intervals for hypothesis testing (see “Genome-wide modeling of neutral mutation density” section below). Among eligible subset of these intervals, we computed the values of 8 genomic covariates: GC content, CpG and TpC percentage, replication timing, DNaseI hypersensitivity, quiescent and active chromatin in the A549 cell line, and the 1 Mbp regional mutational density. The values of covariates were aggregated across the covered subsets of the 2.823 million candidate intervals, and fit to observed counts by maximum likelihood. Parameter fits for SNV and indel models are shown in Table S1C.
GTEx expression analysis
RPKM values were downloaded from the GTEx Portal (www.gtexportal.org) for 2917 samples and 30 tissue types (Melé et al., 2015). To identify highly expressed genes, we examined the histogram of tissue medians of expression across 20,345 genes and 2917 GTEx samples spanning 30 normal tissues (Melé et al., 2015) and identified an upper mode containing 233 genes with expression above 1000 RPKM (Figure S4A). We used complete-linkage clustering with a Euclidean distance metric to cluster median tissue gene expression across highly expressed genes across 30 tissue types and labeled the three top-most clusters (lineage-specific, multi-lineage, housekeeping) based on visual inspection of the dendrogram and heatmap results (Figure S4B). We mapped tumor types in our WGS tumor analysis to tissues-of-origin (Table S3A). We mapped gene and tumor pairs into expression native and foreign categories if a gene was found to have a 100 or greater RPKM in the tissue from which that tumor is presumed to arise (e.g. gastric cancer and stomach). Examples of highly expressed genes classified as housekeeping included those coding for ribosomal proteins (e.g. RPL13), human leukocyte antigen genes (e.g. HLA-B), and metabolic enzymes (e.g. GADPH). Examples of highly expressed multi-lineage genes include those encoding growth factors (e.g. IGFBP7), apolipoproteins (e.g. APOD), and proteoglycans (e.g. BGN). Highly expressed, lineage-specific genes included those encoding insulin in the pancreatic islets (e.g. INS), cytochrome P450 in the liver (e.g. CYP2E1), and pepsinogen in the stomach (e.g. PGA5).
Epigenomic data provenance
We compiled transcription factor binding sites and chromatin marks from reference epigenomes profiled in ENCODE and Epigenetics Roadmap data portals (ENCODE Project Consortium, 2012; Roadmap Epigenomics Consortium et al., 2015). We also obtained genomic annotations of topologically-associated domain (TAD) boundaries (Jin et al., 2013), 3-D loop domains (Rao et al., 2014), and alternate polyadenylation sites (You et al., 2015) via web links obtained from the respective publications. For ENCODE and Roadmap data, there were multiple profiles per assay (e.g. chromatin or transcription factor ChIP-seq) requiring choice of an optimal tissue matched reference epigenome. To achieve this, we manually annotated ENCODE and Roadmap reference epigenomes and TCGA tumor samples analyzed in our study with respect to a matrix of binary histopathological and anatomic features (Table S5A-B). Using this annotation, we mapped TCGA tumors to their closest reference epigenomes in ENCODE (http://www.mskilab.com/publications/cell2017/ENCODEvsTCGA/index.html) and ROADMAP (http://www.mskilab.com/publications/cell2017/ROADMAPvsTCGA/index.html) on the basis of their Euclidean distance in feature space (Table S5A-B), allowing the choice of the closest reference epigenome to be made for each sample in a systematic fashion. For other feature types (TAD boundaries, Loop domains, APA), we used a single annotation for all analyses. In the case of TAD boundaries, we used IMR90 profiles as the reference cell type. For loop domain analyses, we chose features that were found in the deeply profiled GM12878 cell type and at least one other lower depth in situ Hi-C profile generated by (Rao et al., 2014). For APA data, there was a single track that represented the union of all discovered alternate polyadenylation sites.
Cis and trans analyses of expression and methylation
We compared mutant vs. wild type gene, exon, microRNA expression using the functions voom, eBayes, lmFit within the limma (v3.29) R package in R Bioconductor (https://bioconductor.org/). We compared mutant vs. wild type methylation using Wilcoxon test on methylation (Beta) values obtained from the Broad GDAC TCGA portal (https://gdac.broadinstitute.org/). We assessed gene set enrichments using the CAMERA (Wu and Smyth, 2012) algorithm via “camera” function in limma. For gene sets we used the Canonical Pathways components of the MsigDB v5.1 (http://software.broadinstitute.org/gsea/msigdb/genesets.jsp?collection=CP) comprising 1330 gene sets. We applied “camera” with inter.gene.cor parameter set to 0.08. Though 0.05 is the default setting, we found that 0.05 resulted in inflated Q-Q plots when permuting sample labels. We chose 0.08 after sweeping parameter values from 0.01 to 0.1 and finding 0.08 as the setting that, on average, yielded uniform P-value distributions with sample label permutations.
Sequence motif analysis
We queried hg19 for sequence context in the vicinity of hotspot- and non-hotspot-associated indels. We used the rtracklayer and Biostrings packages in R BioConductor (https://bioconductor.org/) to determine strand-bias, AT-bias, and other simple sequence context characteristics. We used the MEME suite (http://meme-suite.org/tools) to search for de novo motifs that were enriched in the neighborhood of hotspot-associated indels. Specifically, we used the DREME algorithm (http://meme-suite.org/tools/dreme) with an E value threshold of 0.05 to search for motifs between 3 and 8 sequences in length. We then used Fisher’s Exact Test to determine enrichments of the AATAATD motif in subsets of indels (i.e. associated with specific tumor type-specific hotspots).
QUANTIFICATION AND STATISTICAL ANALYSIS
Genome-wide modeling of neutral mutation density
We applied Gamma-Poisson regression to predict local heterogeneity in the neutral somatic mutation density using sequence, interval, and numeric track covariates in a generalized linear model framework (Figure 1A, Figure S1A, Table 1). We chose the Gamma-Poisson distribution as a model of over-dispersed count data (Hilbe, 2014). The model was applied to overlapping 10 Kbp tiles staggered at 500 bp intervals along the genome, each corresponding to a hypothesis about a particular region being a target of somatic selection (or non-background mutation processes).
We used 8 genomic covariates to predict the local genomic mutation density. For sequence covariates, we used GC, TpC, and CpG fraction as sequence contexts previously associated with mutation signatures in lung cancer (Alexandrov et al., 2013; Imielinski et al., 2012; Lawrence et al., 2013; Pleasance et al., 2009b). For interval track covariates, we used DNaseI hypersensitive sites, quiescent chromatin, and active chromatin in A549 lung cancer cell lines. To obtain these tracks, we downloaded A549 DNaseI hypersensitivity data and other A549 chromatin marks (H3K27me3, H3K4me1, H3K27ac, H3K4me3, H3K36me3) from ENCODE (http://www.genome.gov/ENCODE/). Active and quiescent chromatin regions were defined after applying a 15-state ChromHMM model to input chromatin data (Ernst and Kellis, 2012). We delineated states with H3K27ac marks as “active” and states showing no marks or only H3K27me3 marks as “quiescent”. Numeric covariates comprising replication timing data were obtained from Koren et al. (Koren et al., 2014) and 1 Mbp local somatic variant density was computed from the data.
The values of all covariates and mutation counts were computed in the “eligible territory” of each interval i ∈ {1,…,n} where eligibility was defined via intersection with a publicly available whole genome interval mask (see “Sequence Data and Processing” section above). Sequence and interval covariate values were computed for each hypothesis i as the fraction of the eligible positions in interval i that matched the given sequence feature or intersected the interval track. Numeric covariates for each hypothesis i were computed as the mean value of the numeric track within the eligible subset of interval i. The mutation count yi was computed as the number of samples in the dataset harboring a mutation in the eligible subset of interval i. We removed intervals with fewer than 75% eligible bases or greater than 95% quiescent chromatin to yield a total of 2.823 million genome-wide hypotheses.
We modeled mutation counts yi in each interval i, given eligible territory width wi and k covariate values , j ∈ {1,…,k}, as
where is the mean parameter and θ is the shape parameter. The k + 1 parameters of the model (θ, αj, j ∈ {1,…,k}) were estimated by maximum likelihood using the MASS R package (https://cran.r-project.org/package=MASS) on a random 100,000 subsample of the 2.823 million data matrix rows. Given the ML fit, θ̂, α̂j ∈ {1,…,k} we then computed randomized P-values pi ~Uniporm(ai,bi) for each hypothesis i using the right tail masses
and
P-value randomization is a standard approach used to generate uniformly distributed P-values from discrete null distributions (Dickhaus, 2014). Analyses were performed separately for SNVs. and indels. P-values were mapped to FDR values using the Benjamini-Hochberg procedure in the R stats package. Since significant (FDR<0.1) candidate intervals overlapped each other at peak regions, we chose a subset of non-overlapping and maximally significant intervals that covered each peak region to comprise the final set of significant loci. Q-Q plots and associated λ “genomic inflation” values were computed by −log10 transforming observed quantiles of P values and expected quantiles of the uniform distribution, then fitting a line y = λx through the transformed points. The modeling framework (including covariate calculations, model fitting, and Q-Q plot computation) is provided as an R package (fish.hook, https://github.com/mskilab/fish.hook).
Lineage-context analyses of indel and SNV density
We compared indel and SNV densities across variants in classes (lineage-specific, multi-lineage, and housekeeping) of 233 highly expressed genes in expression native and foreign tumor sample contexts using Gamma-Poisson regression to model mutation counts. We used regression to correct for sample-specific differences in mutation density, which may occur when comparing across tumor types.
For expression native vs. expression foreign comparisons (Figure 4), we chose a gene class (e.g. multi-lineage genes) to analyze and modeled mutation counts in expression native (yi,1) and expression foreign (yi,0) genomic territories associated with that gene class across all tumor samples i ∈ {1,…n}
where c ∈ {0,1} is a binary indicator variable denoting expression native (1) or expression foreign (0) status, wi,c is the eligible width for expression native vs. foreign class c in sample i, and γi is the mean (per Mbp) variant density in sample i. We inferred model parameters (α,β,θ) and 95% confidence intervals for expression native vs. foreign enrichment (lnβ) through maximum likelihood estimation and obtained two-tailed P-values using the Wald test. We applied this test for all three territory classes (lineage-specific, multi-lineage, and housekeeping). We also applied this analysis to individual tumor types to compare indel densities between expression native and foreign lineage-specific territories and obtain tumor type-specific P-values and effect sizes. The latter analyses could only be performed in tumor types that were assigned at least one expression native, lineage-specific territory in the upstream GTEx analysis (Table S3A). This comprised 11 of the 12 non-LUAD tumor types analyzed in this study (all with the exception of bladder cancer).
We employed a related analysis (Figure 4) to compare mutation densities in pairs of gene classes within the expression native tumor context. Namely, for a given pair of gene classes (e.g. housekeeping vs. multi-lineage), we modeled mutation counts in the first class (yi,0) and second class (yi,1) across all tumor samples i ∈ {1,…,n} as above except c ∈ {0,1} indicates geneclass status in the given pair, wi,c is the eligible width for the expression native subset of gene class c in sample i, and eβ represents class 1 vs. class 0 enrichment as a relative risk.
To identify genes that were differentially mutated in expression native vs. foreign context (Figure 5) we applied logistic regression on (dichotomous) mutation status in each sample i as a function of average per-sample mutation density ri. Specifically, we modeled mutation status yi,g in sample i and gene g with expression native/foreign status ci,g as
computing adjusted odds-ratios eβ and associated 95% confidence intervals by maximum likelihood and computing P-values using the Wald test using the “stats” package in R for each gene g separately. Only genes that were mutated in three or more cases were included in this analysis.
Epigenomic feature enrichment analysis
We used Gamma-Poisson regression to assess significant enrichment or depletion of indel density in epigenomic peak regions associated with three groups (hotspot genes, other highly expressed genes, 1000 randomly selected genes) in liver, lung, thyroid, and gastric cancer (Figure 6). For a given assay with peak regions (e.g. ChIP-Seq peaks, APA sites) and a given window (0, 100, 1000, 10,000 bp) around them we computed the intersection of genes in a given class with (padded) peak regions. We modeled indel counts in groups of peak vs. non-peak regions across samples as a function of eligible territory, using peak × group interaction terms (γ1, γ2) to capture significant enrichment/depletion of peak-associated indels in hotspot regions vs. other territory classes. The model is represented by the following equation:
for all i ∈ {1,…,n} samples, p ∈ {0,1} peak vs. non-peak regions, and g ∈ {0,1,2} groups (where the values of g indicate hotspot (2) vs. other highly expressed (1) vs. background genes (0)). wi,p,g is eligible territory width for sample i in territory group g with peak status p, ri is the mean (per Mbp) variant density in sample i. The term Ix(g) is an indicator function which is 1 when g = x and 0 otherwise. We inferred model parameters (α,β0,β1,β2,γ1,γ2,θ) through maximum likelihood estimation and obtained two-tailed P-values using the Wald test. We applied the above model to 440 assay × window combinations, and compiled effect sizes and P-values for the γ2 term representing the interaction between group 2 and peak status. We applied Bonferroni multiple hypothesis correction for 440 hypotheses and applied a corrected P-value threshold of Pcorrected <0.05 to assess significance.
Replication direction analysis
We obtained annotations of replication direction from (Haradhvala et al., 2016) and crossed with the GENCODE v19 gene annotation of highly expressed genes to label genes as either “head-on” or “co-directional” with respect to their transcriptional strand and replication orientation. We excluded ~2 Gbp of genomic territory that were given an indeterminate replication direction. In each sample, we then subdivided expression native and foreign territories with respect to their head-on vs. co-directional status. We then applied Gamma-Poisson regression to model expression native mutation counts yi,c,d as a function of expression native status c ∈ {0,1} and head-on replication-transcription orientation d ∈ {0,1} across samples i ∈ {1,…,n}
where wi,c,d is the eligible territory width in sample i for territory with expression native status c with and replication-transcription orientation d, ri is the mean (per Mbp) variant density in sample i. We inferred model parameters (α,β,γδ,θ) and 95% confidence intervals for the relative risk (ln δ) corresponding to the interaction term between expression native status and replication-transcription orientation using maximum likelihood estimation and a two-tailed P-value via the Wald test.
DATA AND SOFTWARE AVAILABILITY
Custom software tools developed for this study are available as open source R packages. These include fish.hook (https://github.com/mskilab/fish.hook), an R package for applying Gamma-Poisson regression to nominate genome-wide hotspots of mutation density and examine differential enrichment in mutation density across classes of genomic intervals, while taking into account covariates and eligibility. Additional tools comprise custom packages for manipulating genomic intervals (gUtils, https://github.com/mskilab/gUtils) and visualizing complex genomic tracks (gTrack, https://github.com/mskilab/gTrack). Additional violin plots, gene set visualizations of CAMERA results, and mutation matrices were generated using custom functions in skitools (https://github.com/mskilab/skitools) and muTrix (https://github.com/mskilab/muTrix).
ADDITIONAL RESOURCES
Links to multi-track visualizations of statistical signals near top mutation hotspots and alignment data supporting key mutational events are provided at www.mskilab.com/publications/cell2017. Links to these images can also be found among the corresponding supplementary tables in the paper.
Supplementary Material
Acknowledgments
The authors would like to thank Aruna Ramachandran for helpful comments and careful editing during manuscript preparation, Leslie Gaffney for help with graphical design of figures, and Jeanie Joe for meticulous proofreading. The authors would also like to thank Korbinian Strimmer for correspondence regarding P-value randomization and Heng Li for providing details of his universal mask. The authors thank Yoichiro Mitsuishi and Joshua Francis for helpful discussions. M.I. is supported by a Burroughs-Wellcome Career Award for Medical Scientists. This work was supported by grants from the National Cancer Institute as part of The Cancer Genome Atlas project: U24CA126546, U24CA143867, U24CA143845, U24CA126544, and U24CA143883. This work was also funded by the Department of Defense W81XWH-12-1-0269 (M.M.), the American Cancer Society Research Professor Award (M.M.), and the National Cancer Institute R35CA197568 (M.M.).
Footnotes
Author Contributions
M.I. developed custom software and performed all data analyses. G.G. performed independent data analyses supporting Figure 1. M.I. and G.G. performed computational genomic data processing. M.I. and M.M. designed data analyses and wrote the manuscript.
References
- Alexandrov LB, Nik-Zainal S, Wedge DC, Aparicio SAJR, Behjati S, Biankin AV, Bignell GR, Bolli N, Borg Å, Børresen-Dale AL, et al. Signatures of mutational processes in human cancer. Nature. 2013;500:415–421. doi: 10.1038/nature12477. [DOI] [PMC free article] [PubMed] [Google Scholar]
- Andreeva AV, Kutuzov MA, Voyno-Yasenetskaya TA. Regulation of surfactant secretion in alveolar type II cells. AJP: Lung Cellular and Molecular Physiology. 2007;293:L259–L271. doi: 10.1152/ajplung.00112.2007. [DOI] [PubMed] [Google Scholar]
- Baca SC, Prandi D, Lawrence MS, Mosquera JM, Romanel A, Drier Y, Park K, Kitabayashi N, MacDonald TY, Ghandi M, et al. Punctuated evolution of prostate cancer genomes. Cell. 2013;153:666–677. doi: 10.1016/j.cell.2013.03.021. [DOI] [PMC free article] [PubMed] [Google Scholar]
- Bailey TL, Boden M, Buske FA, Frith M, Grant CE, Clementi L, Ren J, Li WW, Noble WS. MEME SUITE: tools for motif discovery and searching. Nucleic Acids Res. 2009;37:W202–W208. doi: 10.1093/nar/gkp335. [DOI] [PMC free article] [PubMed] [Google Scholar]
- Berger MF, Hodis E, Heffernan TP, Deribe YL, Lawrence MS, Protopopov A, Ivanova E, Watson IR, Nickerson E, Ghosh P, et al. Melanoma genome sequencing reveals frequent PREX2 mutations. Nature. 2012 doi: 10.1038/nature11071. [DOI] [PMC free article] [PubMed] [Google Scholar]
- Blum AE, Venkitachalam S, Guo Y, Kieber-Emmons AM, Ravi L, Chandar AK, Iyer PG, Canto MI, Wang JS, Shaheen NJ, et al. RNA Sequencing Identifies Transcriptionally Viable Gene Fusions in Esophageal Adenocarcinomas. Cancer Research. 2016;76:5628–5633. doi: 10.1158/0008-5472.CAN-16-0979. [DOI] [PMC free article] [PubMed] [Google Scholar]
- Ceccarelli M, Barthel FP, Malta TM, Sabedot TS, Salama SR, Murray BA, Morozova O, Newton Y, Radenbaugh A, Pagnotta SM, et al. Molecular Profiling Reveals Biologically Discrete Subsets and Pathways of Progression in Diffuse Glioma. Cell. 2016;164:550–563. doi: 10.1016/j.cell.2015.12.028. [DOI] [PMC free article] [PubMed] [Google Scholar]
- Chapman MA, Lawrence MS, Keats JJ, Cibulskis K, Sougnez C, Schinzel AC, Harview CL, Brunet JP, Ahmann GJ, Adli M, et al. Initial genome sequencing and analysis of multiple myeloma. Nature. 2011;471:467–472. doi: 10.1038/nature09837. [DOI] [PMC free article] [PubMed] [Google Scholar]
- Dickhaus T. Simultaneous Statistical Inference. Berlin, Heidelberg: Springer Science & Business Media; 2014. [Google Scholar]
- Ding L, Getz G, Wheeler DA, Mardis ER, McLellan MD, Cibulskis K, Sougnez C, Greulich H, Muzny DM, Morgan MB, et al. Somatic mutations affect key pathways in lung adenocarcinoma. Nature. 2008;455:1069–1075. doi: 10.1038/nature07423. [DOI] [PMC free article] [PubMed] [Google Scholar]
- ENCODE Project Consortium. An integrated encyclopedia of DNA elements in the human genome. Nature. 2012;489:57–74. doi: 10.1038/nature11247. [DOI] [PMC free article] [PubMed] [Google Scholar]
- Ernst J, Kellis M. ChromHMM: automating chromatin-state discovery and characterization. Nat Meth. 2012;9:215–216. doi: 10.1038/nmeth.1906. [DOI] [PMC free article] [PubMed] [Google Scholar]
- Fujimoto A, Furuta M, Totoki Y, Tsunoda T, Kato M, Shiraishi Y, Tanaka H, Taniguchi H, Kawakami Y, Ueno M, et al. Whole-genome mutational landscape and characterization of noncoding and structural mutations in liver cancer. Nat Genet. 2016;48:500–509. doi: 10.1038/ng.3547. [DOI] [PubMed] [Google Scholar]
- Garraway LA, Lander ES. Lessons from the Cancer Genome. Cell. 2013;153:17–37. doi: 10.1016/j.cell.2013.03.002. [DOI] [PubMed] [Google Scholar]
- Govindan R, Ding L, Griffith M, Subramanian J, Dees ND, Kanchi KL, Maher CA, Fulton R, Fulton L, Wallis J, et al. Genomic Landscape of Non-Small Cell Lung Cancer in Smokers and Never-Smokers. Cell. 2012;150:1121–1134. doi: 10.1016/j.cell.2012.08.024. [DOI] [PMC free article] [PubMed] [Google Scholar]
- Ha G, Roth A, Khattra J, Ho J, Yap D, Prentice LM, Melnyk N, McPherson A, Bashashati A, Laks E, et al. TITAN: inference of copy number architectures in clonal cell populations from tumor whole-genome sequence data. Genome Research. 2014;24:1881–1893. doi: 10.1101/gr.180281.114. [DOI] [PMC free article] [PubMed] [Google Scholar]
- Haradhvala NJ, Polak P, Stojanov P, Covington KR, Shinbrot E, Hess JM, Rheinbay E, Kim J, Maruvka YE, Braunstein LZ, et al. Mutational Strand Asymmetries in Cancer Genomes Reveal Mechanisms of DNA Damage and Repair. Cell. 2016;164:538–549. doi: 10.1016/j.cell.2015.12.050. [DOI] [PMC free article] [PubMed] [Google Scholar]
- Harrow J, Frankish A, Gonzalez JM, Tapanari E, Diekhans M, Kokocinski F, Aken BL, Barrell D, Zadissa A, Searle S, et al. GENCODE: the reference human genome annotation for The ENCODE Project. Genome Research. 2012;22:1760–1774. doi: 10.1101/gr.135350.111. [DOI] [PMC free article] [PubMed] [Google Scholar]
- Hilbe JM. Modeling Count Data. Cambridge University Press; 2014. [Google Scholar]
- Hodis E, Watson IR, Kryukov GV, Arold ST, Imielinski M, Theurillat JP, Nickerson E, Auclair D, Li L, Place C, et al. A landscape of driver mutations in melanoma. Cell. 2012;150:251–263. doi: 10.1016/j.cell.2012.06.024. [DOI] [PMC free article] [PubMed] [Google Scholar]
- Horn S, Figl A, Rachakonda PS, Fischer C, Sucker A, Gast A, Kadel S, Moll I, Nagore E, Hemminki K, et al. TERT Promoter Mutations in Familial and Sporadic Melanoma. Science. 2013;339:959–961. doi: 10.1126/science.1230062. [DOI] [PubMed] [Google Scholar]
- Huang FW, Hodis E, Xu MJ, Kryukov GV, Chin L, Garraway LA. Highly Recurrent TERT Promoter Mutations in Human Melanoma. Science. 2013;339:957–959. doi: 10.1126/science.1229259. [DOI] [PMC free article] [PubMed] [Google Scholar]
- Imielinski M, Berger AH, Hammerman PS, Hernandez B, Pugh TJ, Hodis E, Cho J, Suh J, Capelletti M, Sivachenko A, et al. Mapping the hallmarks of lung adenocarcinoma with massively parallel sequencing. Cell. 2012;150:1107–1120. doi: 10.1016/j.cell.2012.08.029. [DOI] [PMC free article] [PubMed] [Google Scholar]
- Inaki K, Hillmer AM, Ukil L, Yao F, Woo XY, Vardy LA, Zawack KFB, Lee CWH, Ariyaratne PN, Chan YS, et al. Transcriptional consequences of genomic structural aberrations in breast cancer. Genome Research. 2011;21:676–687. doi: 10.1101/gr.113225.110. [DOI] [PMC free article] [PubMed] [Google Scholar]
- Jin F, Li Y, Dixon JR, Selvaraj S, Ye Z, Lee AY, Yen C-A, Schmitt AD, Espinoza CA, Ren B. A high-resolution map of the three-dimensional chromatin interactome in human cells. Nature. 2013 doi: 10.1038/nature12644. [DOI] [PMC free article] [PubMed] [Google Scholar]
- Jinks-Robertson S, Bhagwat AS. Transcription-Associated Mutagenesis. Annu Rev Genet. 2014;48:341–359. doi: 10.1146/annurev-genet-120213-092015. [DOI] [PMC free article] [PubMed] [Google Scholar]
- Kan Z, Jaiswal BS, Stinson J, Janakiraman V, Bhatt D, Stern HM, Yue P, Haverty PM, Bourgon R, Zheng J, et al. Diverse somatic mutation patterns and pathway alterations in human cancers. Nature. 2010;466:869–873. doi: 10.1038/nature09208. [DOI] [PubMed] [Google Scholar]
- Kim N, Jinks-Robertson S. Transcription as a source of genome instability. Nature Publishing Group. 2012;13:204–214. doi: 10.1038/nrg3152. [DOI] [PMC free article] [PubMed] [Google Scholar]
- Kim TM, Laird PW, Park PJ. The Landscape of Microsatellite Instability in Colorectal and Endometrial Cancer Genomes. Cell. 2013;155:858–868. doi: 10.1016/j.cell.2013.10.015. [DOI] [PMC free article] [PubMed] [Google Scholar]
- Koren A, Handsaker RE, Kamitaki N, Karlic R, Ghosh S, Polak P, Eggan K, McCarroll SA. Genetic variation in human DNA replication timing. Cell. 2014;159:1015–1026. doi: 10.1016/j.cell.2014.10.025. [DOI] [PMC free article] [PubMed] [Google Scholar]
- Koren A, Polak P, Nemesh J, Michaelson JJ, Sebat J, Sunyaev SR, McCarroll SA. Differential relationship of DNA replication timing to different forms of human mutation and variation. Am J Hum Genet. 2012;91:1033–1040. doi: 10.1016/j.ajhg.2012.10.018. [DOI] [PMC free article] [PubMed] [Google Scholar]
- Lawrence MS, Stojanov P, Mermel CH, Robinson JT, Garraway LA, Golub TR, Meyerson M, Gabriel SB, Lander ES, Getz G. Discovery and saturation analysis of cancer genes across 21 tumour types. Nature. 2014;505:1–9. doi: 10.1038/nature12912. [DOI] [PMC free article] [PubMed] [Google Scholar]
- Lawrence MS, Stojanov P, Polak P, Kryukov GV, Cibulskis K, Sivachenko A, Carter SL, Stewart C, Mermel CH, Roberts SA, et al. Mutational heterogeneity in cancer and the search for new cancer-associated genes. Nature. 2013;499:214–218. doi: 10.1038/nature12213. [DOI] [PMC free article] [PubMed] [Google Scholar]
- Li H. Toward better understanding of artifacts in variant calling from high-coverage samples. Bioinformatics. 2014;30:2843–2851. doi: 10.1093/bioinformatics/btu356. [DOI] [PMC free article] [PubMed] [Google Scholar]
- Li H, Durbin R. Fast and accurate short read alignment with Burrows-Wheeler transform. Bioinformatics. 2009;25:1754–1760. doi: 10.1093/bioinformatics/btp324. [DOI] [PMC free article] [PubMed] [Google Scholar]
- Melé M, Ferreira PG, Reverter F, DeLuca DS, Monlong J, Sammeth M, Young TR, Goldmann JM, Pervouchine DD, Sullivan TJ, et al. Human genomics. The human transcriptome across tissues and individuals. Science. 2015;348:660–665. doi: 10.1126/science.aaa0355. [DOI] [PMC free article] [PubMed] [Google Scholar]
- Pleasance ED, Cheetham RK, Stephens PJ, McBride DJ, Humphray SJ, Greenman CD, Varela I, Lin ML, Ordoñez GR, Bignell GR, et al. A comprehensive catalogue of somatic mutations from a human cancer genome. Nature. 2009a;463:191–196. doi: 10.1038/nature08658. [DOI] [PMC free article] [PubMed] [Google Scholar]
- Pleasance ED, Stephens PJ, O’Meara S, McBride DJ, Meynert A, Jones D, Lin ML, Beare D, Lau KW, Greenman C, et al. A small-cell lung cancer genome with complex signatures of tobacco exposure. Nature. 2009b;463:184–190. doi: 10.1038/nature08629. [DOI] [PMC free article] [PubMed] [Google Scholar]
- Png KJ, Halberg N, Yoshida M, Tavazoie SF. A microRNA regulon that mediates endothelial recruitment and metastasis by cancer cells. Nature. 2012;481:190–194. doi: 10.1038/nature10661. [DOI] [PubMed] [Google Scholar]
- Polak P, Karlic R, Koren A, Thurman R, Sandstrom R, Lawrence MS, Reynolds A, Rynes E, Vlahoviček K, Stamatoyannopoulos JA, et al. Cell-of-origin chromatin organization shapes the mutational landscape of cancer. Nature. 2015;518:360–364. doi: 10.1038/nature14221. [DOI] [PMC free article] [PubMed] [Google Scholar]
- Proudfoot NJ. Ending the message: poly(A) signals then and now. Genes & Development. 2011;25:1770–1782. doi: 10.1101/gad.17268411. [DOI] [PMC free article] [PubMed] [Google Scholar]
- Rao SSP, Huntley MH, Durand NC, Stamenova EK, Bochkov ID, Robinson JT, Sanborn AL, Machol I, Omer AD, Lander ES, et al. A 3D map of the human genome at kilobase resolution reveals principles of chromatin looping. Cell. 2014;159:1665–1680. doi: 10.1016/j.cell.2014.11.021. [DOI] [PMC free article] [PubMed] [Google Scholar]
- Roadmap Epigenomics Consortium. Kundaje A, Meuleman W, Ernst J, Bilenky M, Yen A, Heravi-Moussavi A, Kheradpour P, Zhang Z, Wang J, et al. Integrative analysis of 111 reference human epigenomes. Nature. 2015;518:317–330. doi: 10.1038/nature14248. [DOI] [PMC free article] [PubMed] [Google Scholar]
- Roussel A, Canaan S, Egloff MP, Riviere M, Dupuis L, Verger R, Cambillau C. Crystal Structure of Human Gastric Lipase and Model of Lysosomal Acid Lipase, Two Lipolytic Enzymes of Medical Interest. Journal of Biological Chemistry. 1999;274:16995–17002. doi: 10.1074/jbc.274.24.16995. [DOI] [PubMed] [Google Scholar]
- Sankar TS, Wastuwidyaningtyas BD, Dong Y, Lewis SA, Wang JD. The nature of mutations induced by replication–transcription collisions. Nature. 2016;535:178–181. doi: 10.1038/nature18316. [DOI] [PMC free article] [PubMed] [Google Scholar]
- Saunders CT, Wong WSW, Swamy S, Becq J, Murray LJ, Cheetham RK. Strelka: accurate somatic small-variant calling from sequenced tumor-normal sample pairs. Bioinformatics. 2012;28:1811–1817. doi: 10.1093/bioinformatics/bts271. [DOI] [PubMed] [Google Scholar]
- Schulze K, Imbeaud S, EL, Alexandrov LB, Calderaro J, Rebouissou S, Couchy G, Meiller CEM, Shinde J, Soysouvanh F, et al. Exome sequencing of hepatocellular carcinomas identifies new mutational signatures and potential therapeutic targets. Nat Genet. 2015;47:1–10. doi: 10.1038/ng.3252. [DOI] [PMC free article] [PubMed] [Google Scholar]
- Schuster-Böckler B, Lehner B. Chromatin organization is a major influence on regional mutation rates in human cancer cells. Nature. 2012;488:504–507. doi: 10.1038/nature11273. [DOI] [PubMed] [Google Scholar]
- Supek F, Lehner B. Differential DNA mismatch repair underlies mutation rate variation across the human genome. Nature. 2015;521:81–84. doi: 10.1038/nature14173. [DOI] [PMC free article] [PubMed] [Google Scholar]
- Tarpey PS, Behjati S, Cooke SL, Van Loo P, Wedge DC, Pillay N, Marshall J, O’Meara S, Davies H, Nik-Zainal S, et al. Frequent mutation of the major cartilage collagen gene COL2A1 in chondrosarcoma. Nature Publishing Group. 2013;45:923–926. doi: 10.1038/ng.2668. [DOI] [PMC free article] [PubMed] [Google Scholar]
- TCGA Network. Comprehensive molecular portraits of human breast tumours. Nature. 2012a;490:61–70. doi: 10.1038/nature11412. [DOI] [PMC free article] [PubMed] [Google Scholar]
- TCGA Network. Comprehensive genomic characterization of squamous cell lung cancers. Nature. 2012b;489:519–525. doi: 10.1038/nature11404. [DOI] [PMC free article] [PubMed] [Google Scholar]
- TCGA Network. Comprehensive molecular characterization of clear cell renal cell carcinoma. Nature. 2013;499:43–49. doi: 10.1038/nature12222. [DOI] [PMC free article] [PubMed] [Google Scholar]
- TCGA Network. Comprehensive molecular profiling of lung adenocarcinoma. Nature. 2014a;511:543–550. doi: 10.1038/nature13385. [DOI] [PMC free article] [PubMed] [Google Scholar]
- TCGA Network. Comprehensive molecular characterization of gastric adenocarcinoma. Nature. 2014b;513:202–209. doi: 10.1038/nature13480. [DOI] [PMC free article] [PubMed] [Google Scholar]
- TCGA Network. Integrated genomic characterization of papillary thyroid carcinoma. Cell. 2014c;159:676–690. doi: 10.1016/j.cell.2014.09.050. [DOI] [PMC free article] [PubMed] [Google Scholar]
- TCGA Network. Comprehensive molecular characterization of urothelial bladder carcinoma. Nature. 2014d;507:315–322. doi: 10.1038/nature12965. [DOI] [PMC free article] [PubMed] [Google Scholar]
- TCGA Network. Comprehensive genomic characterization of head and neck squamous cell carcinomas. Nature. 2015a;517:576–582. doi: 10.1038/nature14129. [DOI] [PMC free article] [PubMed] [Google Scholar]
- TCGA Network. The Molecular Taxonomy of Primary Prostate Cancer. Cell. 2015b;163:1011–1025. doi: 10.1016/j.cell.2015.10.025. [DOI] [PMC free article] [PubMed] [Google Scholar]
- TCGA Network. Genomic Classification of Cutaneous Melanoma. Cell. 2015c;161:1681–1696. doi: 10.1016/j.cell.2015.05.044. [DOI] [PMC free article] [PubMed] [Google Scholar]
- Verhaak RGW, McKenna A, Campos B, Noushmehr H, Salama SR, Zheng S, Chakravarty D, Sanborn JZ, Berman SH, Beroukhim R, et al. The somatic genomic landscape of glioblastoma. Cell. 2013;155:462–477. doi: 10.1016/j.cell.2013.09.034. [DOI] [PMC free article] [PubMed] [Google Scholar]
- Vogelstein B, Papadopoulos N, Velculescu VE, Zhou S, Diaz LA, Kinzler KW. Cancer Genome Landscapes. Science. 2013;339:1546–1558. doi: 10.1126/science.1235122. [DOI] [PMC free article] [PubMed] [Google Scholar]
- Wu D, Smyth GK. Camera: a competitive gene set test accounting for inter-gene correlation. Nucleic Acids Res. 2012;40:e133–e133. doi: 10.1093/nar/gks461. [DOI] [PMC free article] [PubMed] [Google Scholar]
- You L, Wu J, Feng Y, Fu Y, Guo Y, Long L, Zhang H, Luan Y, Tian P, Chen L, et al. APASdb: a database describing alternative poly(A) sites and selection of heterogeneous cleavage sites downstream of poly(A) signals. Nucleic Acids Res. 2015;43:D59–D67. doi: 10.1093/nar/gku1076. [DOI] [PMC free article] [PubMed] [Google Scholar]
- Zhang X, Choi PS, Francis JM, Imielinski M, Watanabe H, Cherniack AD, Meyerson M. Identification of focally amplified lineage-specific super-enhancers in human epithelial cancers. Nat Genet. 2016;48:176–182. doi: 10.1038/ng.3470. [DOI] [PMC free article] [PubMed] [Google Scholar]
- Zhao H, Thienpont B, Yesilyurt BT, Moisse M, Reumers J, Coenegrachts L, Sagaert X, Schrauwen S, Smeets D, Matthijs G, et al. Mismatch repair deficiency endows tumors with a unique mutation signature and sensitivity to DNA double-strand breaks. eLife. 2014;3:e02725–e02726. doi: 10.7554/eLife.02725. [DOI] [PMC free article] [PubMed] [Google Scholar]
Associated Data
This section collects any data citations, data availability statements, or supplementary materials included in this article.