

Abstract
There is a great need to develop novel approaches to target oncogenic transcription factors with small molecules. Ewing sarcoma is emblematic of this need, as it depends on the continued activity of the EWS-FLI1 transcription factor to maintain the malignant phenotype. We have previously shown that the small molecule trabectedin interferes with EWS-FLI1. Here we report important mechanistic advances and a second-generation inhibitor to provide insight into the therapeutic targeting of EWS-FLI1. We discovered that trabectedin functionally inactivated EWS-FLI1 by redistributing the protein within the nucleus to the nucleolus. This effect was rooted in the wild-type functions of the EWSR1, compromising the N-terminal half of the chimeric oncoprotein, which is known to be similarly redistributed within the nucleus in the presence of UV light damage. A second-generation trabectedin analog lurbinectedin (PM01183) caused the same nuclear redistribution of EWS-FLI1, leading to a loss of activity at the promoter, mRNA, and protein levels of expression. Tumor xenograft studies confirmed this effect and it was increased in combination with irinotecan, leading to tumor regression and replacement of Ewing sarcoma cells with benign fat cells. The net result of combined lurbinectedin and irinotecan treatment was a complete reversal of EWS-FLI1 activity and elimination of established tumors in 30-70% of mice after only 11 days of therapy. Our results illustrate the preclinical safety and efficacy of a disease-specific therapy targeting the central oncogenic driver in Ewing sarcoma.
INTRODUCTION
Ewing sarcoma is a bone and soft-tissue sarcoma that depends on the continued activity of the EWS-FLI1 transcription factor, which is formed by the t(11;22)(q24;q12) chromosomal translocation (1,2). This translocation leads to the fusion of the binding domain of the ETS family member FLI1 to the transactivation domain of EWSR1 and the loss of negative regulatory domains. The result is a constitutively active transcription factor that both drives and suppresses the expression of more than 500 genes (3-5). Silencing of EWS-FLI1 activity is incompatible with continued proliferation and places the cell in a dedifferentiated state, which resembles that of mesenchymal stem cells (2,6,7). Therefore, a therapy directed against EWS-FLI1 would be expected to block proliferation and potentially allow the tumor to differentiate into a benign tissue such as fat. Unfortunately, because transcription factors are challenging drug targets, the successful suppression of EWS-FLI1 in the clinic has not been achieved.
In this report, we describe a novel method of targeting oncogenic fusion transcription factors with small molecules, a method likely applicable to a variety of tumors. For any fusion protein, there exists a competition between the wild-type functions of each fusion partner and the oncogenic properties that result when these proteins are joined. At baseline, the activity of the fusion protein dominates and the protein subsequently functions as an oncogene. However, it is possible that the wild-type functions preserved in the fusion can be activated to overcome the oncogenic properties.
We apply this method in this study to target and functionally inactivate EWS-FLI1.In order to accomplish this, we leverage the wild-type properties of EWSR1 retained within the fusion protein to redistribute EWS-FLI1 in the nucleus. Wild-type EWSR1 is known to play an important role in RNA processing, but has recently emerged as a key protein in the DNA damage response to UV light by redistributing within the nucleus to the nucleolus (8). We have previously shown that treatment of Ewing sarcoma cells with trabectedin, a DNA-binding agent, generates a gene signature resembling that found after UV light treatment of keratinocytes (9). Therefore, we hypothesized that if this sequestration of EWSR1 were preserved in the EWS-FLI1 fusion protein, trabectedin treatment would remove the protein from its target sequences by moving it into the nucleolus.
We show here that activation of the UV light–induced DNA damage response by trabectedin indeed led to the sequestration of EWS-FLI1 to the nucleolus. We show that a second-generation trabectedin analog, lurbinectedin which is known to accumulate at much higher serum levels in patients, accomplishes the same redistribution of EWS-FLI1 and can be further potentiated in combination with irinotecan. The net result was complete inhibition of EWS-FLI1 activity in vivo, sustained suppression of xenograft growth, and replacement of the xenografts with benign fat. Together, the results identify a novel EWS-FLI1 inhibitor and an approach to targeting fusion transcription factors based on the activation of wild-type functions of one of the fusion partners.
MATERIALS AND METHODS
Cell Culture
TC32, TC71, EW8, A673, RH30 and RD cells were all obtained from Dr. Lee Helman (National Cancer Institute, Bethesda, MD), TC252 cells were the gift of Dr. Tim Triche (The Saban Research Hospital, Children’s Hospital of Los Angeles) and MCF7 cells were the gift of Dr. P. Steeg (National Cancer Institute, Bethesda, MD) A2058 were purchased from ATCC. All cell lines were routinely screened to confirm mycoplasma negative status and to confirm the identity of the cells by STR profiling (DDC Medical). The most recent STR testing was 11/30/14 for all the cells except A2058 which was tested 2/12/16. EWS-FLI1 expression was confirmed by RT-PCR. Cells were grown at 37 °C with 5% CO2. RPMI-1640 (Gibco) was supplemented with 10% fetal bovine serum (Gemini Bio-Products), 2 mM L-glutamine, and 100 U/mL and 100 μg/mL penicillin and streptomycin, respectively (Gibco).
Confocal microscopy
TC32 cells were incubated with compound for 6 hours in a Nunc Lab-Tek II Chamber Slide (Thermo Scientific), fixed in 4% paraformaldehyde in PBS, washed, lysed in 0.1% Triton-X100, and blocked in 10% goat serum (all in PBS). The cells were incubated with primary antibody (18hrs), secondary antibody (1 hr) and tertiary antibody for 30 min with washes in between followed by mounting in ProLong Gold with DAPI (Life Technologies);(Primary antibodies: nucleolin, Abcam – 1:1000; HA-tag, Abcam – 1:500; γH2AX, Millipore – 1:1000; FLI1, Abcam – 1:100)(Secondary antibodies: biotin anti-mouse IgG: Vector – 1:1000)(Tertiary antibodies: Strep-635, Life Technologies – 1:400; FITC-Rabbit, Millipore – 1:200). All images were obtained with standardized settings on a Zeiss 510 confocal microscope. For BODIPY images, TC32 cells were treated as indicated. 1 hour prior to fixation in 4% paraformaldehyde, BODIPY 493/503 (Invitrogen) and Hoechst 33342 (Invitrogen) were added to the culture medium. The cells were washed and imaged.
Cell Proliferation Assays
Cell viability IC50s were determined by non-linear regression (Prism GraphPad) as the average of three independent experiments using standard MTS assay CellTiter 96 (Promega) following a 48 hour incubation with drug as previously described (10). Real time proliferation assays were performed on the Incucyte Zoom™ as previously described (11).
Luciferase Assays
Stable cell lines containing an EWS-FLI1-driven NR0B1 luciferase or constitutively active CMV control were incubated with drug in opaque 96 well plates (BD Falcon) for 8 h (10). Cells were lysed in 100 μL of Steady-Glo (Promega) and bioluminescence was measured on a BioTek plate reader (Winooski, VT).
Quantitative RT-PCR
300,000 TC32 or TC71 cells were incubated with drug in 6-well plates (BD Falcon, Franklin Lakes, NJ). RNA was collected using the RNeasy kit (Qiagen), and immediately reverse-transcribed using a high-capacity reverse transcriptase kit (Life Technologies) at 25 °C for 10 min, 37 °C for 120 min, and 85 °C for 10 min. We subsequently PCR amplified 100 ng of cDNA, 2X SYBR green (Bio-Rad), and the following program: 95 °C for 10 min, 95 °C for 15 s, 55 °C for 15 s, and 72 °C for 1 min, for 40 cycles. Expression was determined from three independent experiments relative to GAPDH and solvent control using standard ddCt methods. Primers sequences can be found in supplementary table S1. All PCR products were validated by gel electrophoresis followed by standard Sanger sequencing (see supplementary figure S1A and B for validation of NR0B1). Heat maps were created using R v 3.2.2 (R Foundation for Statistical Computing, Vienna, Austria) and comprise delta-delta Ct scores truncated between -3 and 3 to prevent very large scores from oversaturating the color gradient.
Western Blotting
We incubated 1.5 million TC32 and TC71 cells with drug in 10 cm2 dishes, scraped into cold PBS, washed in PBS and lysed in 4% LDS lysis buffer. Following dilution of detergent, the protein was quantitated using the bicinchoninic (BCA) colorimetric assay (Pierce, Thermo-Scientific). Thirty micrograms of total protein were resolved on a NuPage 4% to 12% Bis-Tris gradient gel (Invitrogen) in 1X NuPage MOPS SDS Running Buffer (Invitrogen), transferred to nitrocellulose using 1X Tris-Glycine-SDS Buffer (Bio-Rad) supplemented with 20% methanol at 4 °C overnight at 20 V. The membranes were subsequently blocked in 5% milk in TBS-T, and probed with Abcam (FLI1, NR0B1, and GAPDH) or Cell Signaling (EZH2 and ID2) antibodies.
Xenograft Experiments
Two million TC71 or TC32 cells were injected intramuscularly in the gastrocnemius of female 4-6-week old female homozygous nude mice (Crl; Nu-Foxn1Nu)(Harlan Laboratories, SL) and established to a minimum diameter of 0.5 cm. Four cohorts of 12 mice were treated with vehicle, lurbinectedin (0.18 mg/kg intravenously; TC32 days 0, 7; TC71 days 0, 7, 14), irinotecan (5 mg/kg intraperitoneal; TC32 days 3, 10; TC71 days; 1 to 3, 8 to 10; 15 to 17) or the combination (same dose route and schedule as the individual tumor types). Tumor volume was measured 3 times per week and determined using the equation (D × d2)/6 × 3.12 (where D is the maximum diameter and d is the minimum diameter). Tissue was collected and fixed in 10% formalin. Mice were sacrificed when the tumor diameter reached 2 cm in any dimension. All experiments were performed in accordance with the guidelines and regulation of, and approved by the animal care and use committee (PharmaMar). Investigators were not blinded to the treatment groups.
Tissue Staining
Paraffin embedded tissue was sectioned into 5-micrometer sections and mounted on colormark plus charged slides. Antigen retrieval was performed in Ventana CC1 or manually for IF using citrate buffer (Dako). Following blocking, the tissue was incubated with NR0B1 primary (Abcan, 1:50) washed and then secondary antibody (Anti-Rabbit Cy5 conjugated, Life Technologies).
Oil Red O Staining
TC32 cells were plated and treated in Nunc Lab-Tek II Chamber Slides (Thermo Scientific). Cells were washed with PBS, fixed for 30 minutes, and then washed with distilled water. Cells were incubated with isopropanol for 3 minutes and a working solution (filtered 3:2 Oil Red O (Sigma) to deionized water) of Oil Red O for 10 minutes. After aspirating the oil red o solution, the slides were briefly stained with hematoxylin solution (Sigma) and imaged using an Aperio scanning microscope (Leica, Buffalo Grove, IL).
Immunofluorescence and Immunohistochemistry
Paraffin embedded tissue was sectioned into 5-micrometer sections and mounted on colormark plus charged slides. Antigen retrieval was performed on Ventana Discovery Automated Stainer. Immunofluorescence staining was performed using NR0B1 primary (Abcam, 1:300), Ventana Ultramap Rb HRP and Ventana Discovery Cy5 amplification. Immunohistochemistry was performed using Ki67 (Spring Bioscience, 1:100) and Cleaved Caspase-3 (Cell Signaling, 1:400) primary antibodies, VentanaUmap rb HRP and VentanaChromomap DAB.
Immunofluorescence Quantitation
Fluorescent images were acquired at 20× magnification using the PE Vectra automated multispectral slide imager. Fluorescence was quantitated using Inform software. Standard settings were used for across all treatments for image acquisition and quantitation.
RNA-Sequencing
RNA was extracted from three biological replicates for each experimental time point and samples were submitted for 1X 75 bp sequencing on the Illumina NextSeq 500 at the Van Andel Research Institute. Sequencing libraries were prepared using the Illumina TruSeq HT kit. Read quality was assessed using FASTQC v. 0.11.3 and aligned to the hg19 genome using Subread v. 1.4.3. (12) with default parameters. Raw read counts to known exons were obtained using FeatureCounts v 1.4.3 using strand specific read counting. Counts per million (CPM) were calculated and log2 transformed using voom (13). Transformation and differential expression analyses were conducted using the limma package v 3.28.7 in R (14) and are available (SRA accession: SRP080099).The EWS-FLI1 gene signature consists of all genes in common from two data sets: a meta-analysis and a list of differentially expressed genes obtained by expression profiling following silencing of EWS-FLI1 in 5 cell lines (3,15). 116 and 50 genes were identified as induced or repressed by EWS-FLI1, respectively (Supplementary table S2). Significance testing for enrichment of EWS-FLI1 induced or repressed gene signatures from differentially expressed genes were performed using a hypergeometric test with the phyper function implemented in the R stats package (v 3.3.0) (https://cran.r-project.org/). Heatmaps were generated using either the aheatmap function implemented in the NMF package (v 0.20.6) or the pheatmap package (v 1.0.8) in R (v 3.3.0).
RESULTS
We have previously shown that trabectedin treatment leads to the induction of DNA damage and suppression of the EWS-FLI1 gene signature without globally suppressing transcription (9). This led to the paradoxical characterization of the drug as a DNA-damaging but molecularly targeted agent (16,17). Therefore, we reasoned that the DNA damage induced by the drug may lead to a specific cellular response that poisons EWS-FLI1 directed transcription.
Treatment of TC32 Ewing sarcoma cells with 5 nmol/L of trabectedin caused EWS-FLI1 to redistribute within the nucleus and co-localize with the nucleolus marker nucleolin (Fig. 1A). This effect was observed with either an HA-tagged EWS-FLI1 or a FLI1 antibody against the c-terminus of EWS-FLI1 (FLI1 is not expressed in these cells)(Supplementary Fig.S2). In addition, this effect required drug-induced DNA damage and binding, as a non-DNA binding trabectedin analog, ET-745, did not result in the redistribution of EWS-FLI1 (Fig. 1B) or accumulation of phosphorylated H2AX foci (Fig. 1C). Finally, this effect was not the result of generalized DNA damage, as relocalization did not occur with high concentration of the topoisomerase II inhibitor etoposide (Fig. 1B).
Figure 1. EWS-FLI1 changes localization upon trabectedin or lurbinectedin treatment.
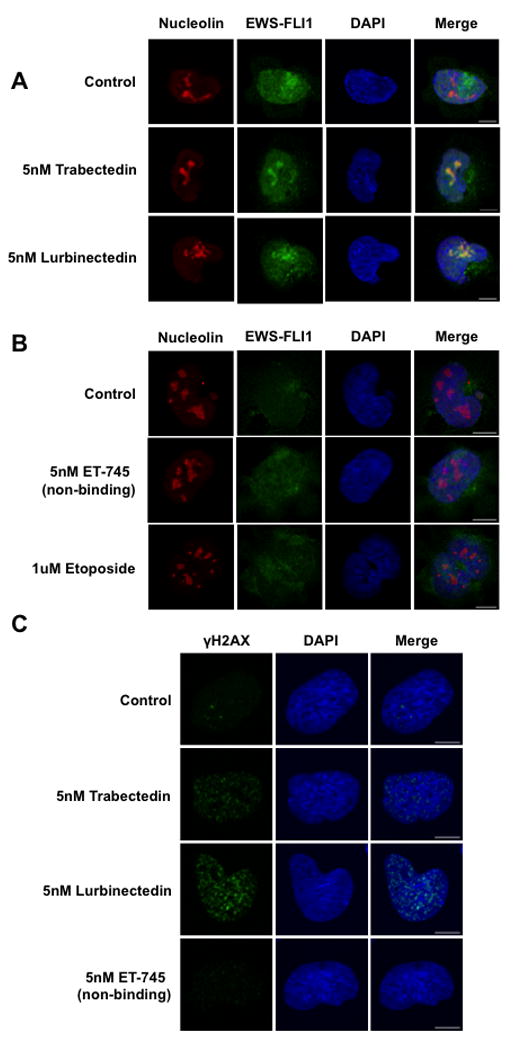
A) Single-cell imaging of HA-tagged TC32 cells treated with 5 nmol/L trabectedin or lurbinectedin for 6 hours shows EWS-FLI1 (green) localization into the nucleolus (red). DAPI (blue) was used as a nuclear stain. B) Single-cell imaging of HA-tagged TC32 cells treated with ET-745 or etoposide shows a lack of EWS-FLI1 nucleolar localization. C) Single-cell imaging of TC32 cells treated with 5 nmol/L Trabectedin, Lurbinectedin, or ET-745 for 6 hours shows the appearance of γH2AX (green) foci. DAPI (blue) used as a counterstain. Scale bars = 10 μm throughout this figure.
In order to assess the clinical applicability of the effect, we evaluated the degree of relocalization that occurred at 2.5 nmol/L, a concentration that approximates the Cmax in the Phase II study in Ewing sarcoma patients,and we found minimal relocalization (Supplementary Fig.S3A). Therefore, we evaluated a second-generation trabectedin analog, lurbinectedin, which is known to have an improved pharmacokinetic profile and to accumulate in serum to levels greater than 170 ng/mL (215 nmol/L)(18). Lurbinectedin redistributed EWS-FLI1 to the nucleolus to the same degree as trabectedin at 5 nmol/L (Fig. 1A).
In order to show that the mislocalization of EWS-FLI1 induced by lurbinectedin leads to a loss in EWS-FLI1 activity, we demonstrated that 5 nmol/L lurbinectedin suppressed an EWS-FLI1-driven (NR0B1) luciferase reporter to 42% of control (10)(Fig. 2A). This suppression paralleled the effect of 5 nmol/L trabectedin (46% of control). In contrast, only modest suppression (77% of control) of a constitutively active CMV reporter was found at the identical concentration and time (Fig. 2A). Importantly, these concentrations were exactly the values that cause redistribution of EWS-FLI1 within the nucleus.
Figure 2. Lurbinectedin treatment mimicked the response to EWS/FLI1 knockdown and trabectedin treatment.
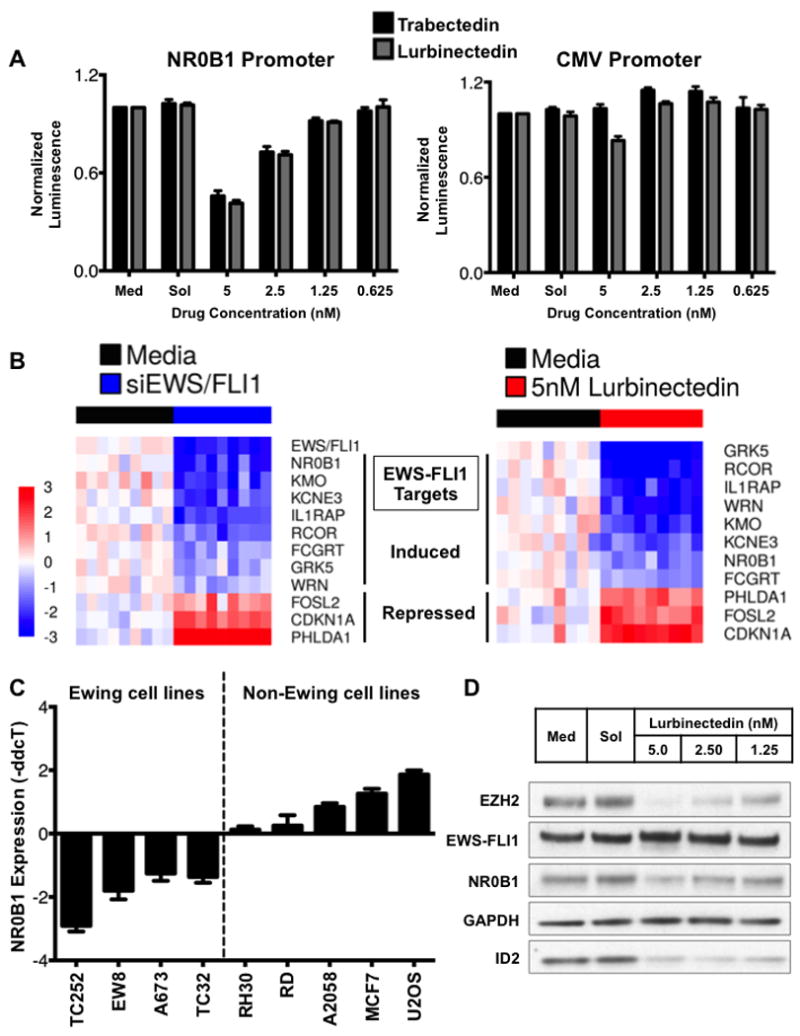
A) Dose-response chart showing the effect of trabectedin (black bars) or lurbinectedin (gray bars) on an NR0B1 promoter luciferase or CMV-driven reporter. Cells were treated for 8 h at the indicated concentrations, and MTS assays were performed in parallel to ensure that the suppressive effects were not a consequence of cell death. B) Heat map showing a similar effect of siRNA mediated silencing of EWS-FLI1(left) and 12-h, 5 nmol/L lurbinectedin treatment (right). C) Suppression of NR0B1 was restricted to Ewing sarcoma cell lines, as shown by the effect of 5 nmol/L lurbinectedin treatment for 12 h in a panel of cell lines. D) Lurbinectedin treatment for 18 h suppressed the expression of the EWS-FLI1 downstream target proteins NR0B1, EZH2, and ID2 but not EWS-FLI1 itself or GAPDH as measured by western blot analysis.
Next, we showed that suppression of EWS-FLI1 extended to other EWS-FLI1 targets. Since there is no established gene signature of EWS-FLI1, we selected EWS-FLI1 target genes from numerous published studies, used siRNAs targeting the breakpoint of EWS-FLI1 to selectively silence the fusion protein, and confirmed the suppression of these targets (see Supplementary Table S3 for evidence)(3,10,15,19-28). All of the EWS-FLI1-induced targets were repressed, and the selected repressed targets were induced with siRNA silencing of EWS-FLI1 (Fig. 2B, left). Next we showed that treatment of TC32 Ewing sarcoma cells with 5 nmol/L lurbinectedin reproduced the effect of siRNA silencing of EWS-FLI1, causing all of the EWS-FLI1-induced genes to be suppressed and all of the EWS-FLI1-repressed targets to be induced (Fig. 2B, right). In order to validate these results, we also evaluated the effect of drug treatment on four additional targets used by other investigators as markers of EWS-FLI1 activity, LOX, BCL11B, STEAP1 and PRKCB (29-32). All of the induced targets were suppressed, while LOX showed minimal change with treatment (Supplementary Fig. S4A).
In order to show that these effects are not restricted to these selected targets, we evaluated the effect of Lurbinectedin treatment on the gene signature of EWS-FLI1 using RNA sequencing (RNA-seq). We found that treatment of lurbinectedin for 6 or 12 hours lead to a marked suppression (93/116; 80%) of genes normally induced by EWS-FLI1 (Fig. 3A). Further, the EWS-FLI1 induced gene signature was significantly enriched (p=0.006) within the differentially expressed genes (adjusted p < 0.05), suggesting that drug treatment disrupts aberrant EWS-FLI1 induction of gene expression. Interestingly, the gene signature of repressed targets did not show clear induction of all of the targets, although targets that appear on multiple EWS-FLI1 repressed target gene lists were induced by lurbinectedin treatment (Supplementary Fig. S4B; targets highlighted in figure)(3,15). Finally, to exclude a general repression of transcription as the cause for reversal of the gene signature, we also examined the effect of lurbinectedin treatment on expression of well-characterized target genes that are driven by transcription factors other than EWS-FLI1, including a family member of FLI1, ELK1 (Fig. 3B)(33-39). Notably, ELK1 target genes are induced in the presence of drug, suggesting that lurbinectedin may not be acting as a general transcription factor inhibitor. We demonstrate a mixed effect of Lurbinectedin on the expression of target genes of these transcription factors (Fig. 3B).
Figure 3. Lurbinectedin suppresses EWS-FLI1 activity, but not the activity of other transcription factors.
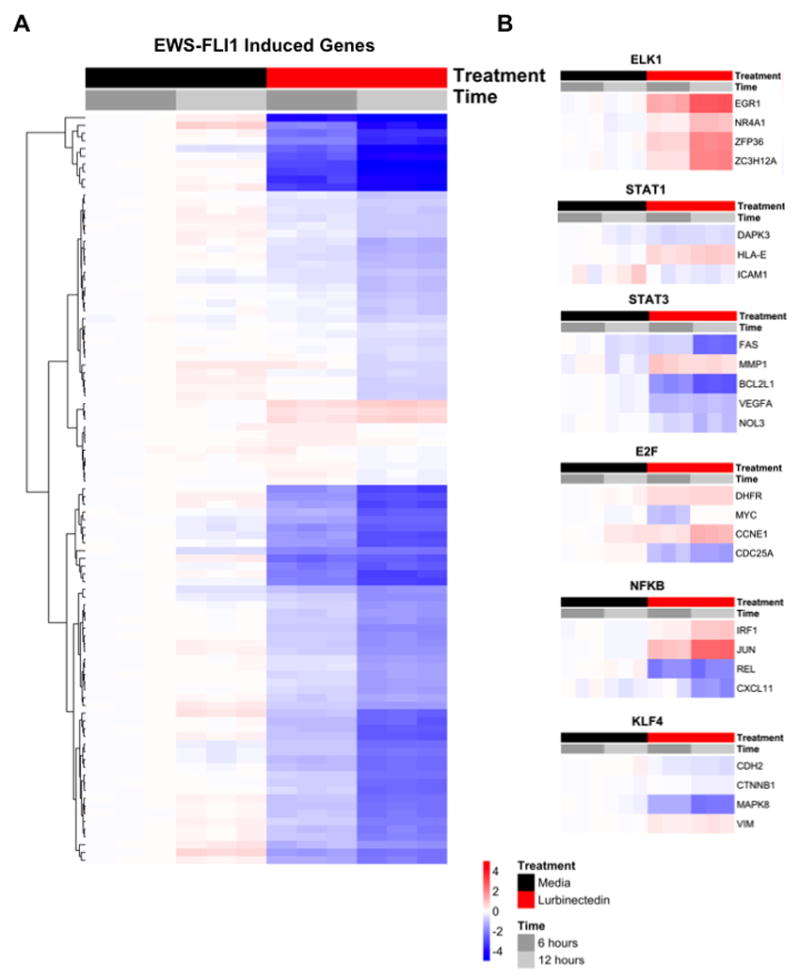
A) Heat map showing the majority of EWS-FLI1 induced genes are suppressed by Lurbinectedin treatment at 6 and 12 hours relative to the media control using RNA-seq. Genes shown are differentially expressed (adjusted p < 0.05) and the scale represents log2 fold-changes relative to the mean of the comparator (6-hour media). B) Heat maps of additional and related (ELK1) transcription factors suggesting that Lurbinectedin is not acting as a general transcription factor inhibitor.
As further evidence that this reflects an EWS-FLI1-specific effect, we evaluated the effect of lurbinectedin treatment on NR0B1 expression in a panel of cell lines. NR0B1 is a well-established EWS-FLI1 target gene whose expression is driven by binding of the fusion protein to a GGAA microsatellite contained within the gene’s promoter (21). Both wild-type FLI1 and EWS-FLI1 are capable of binding this microsatellite, but only EWS-FLI1 can activate transcription (40). Consistent with this,in four different Ewing sarcoma cell lines (TC32, EW8, TC252, A673), lurbinectedin repressed NR0B1 expression as measured by RT-qPCR. In contrast, treatment of a panel of non-EWS-FLI1-containing control cell lines led to either no change in expression of NR0B1 (RH30 and RD lines) or induction of NR0B1 mRNA expression (A2058, MCF7, and U2OS) (Fig. 2C).
Finally, we showed that the suppression of EWS-FLI1 activity extended to the protein level by demonstrating the effect of lurbinectedin treatment on the important EWS-FLI1 target genes NR0B1, ID2, and EZH2 (Fig. 2D). The treatment resulted in the marked suppression of proliferation and a sub-nanomolar IC50 that was similar to that of trabectedin (Supplementary Fig. S4C). The pharmacokinetic profile of lurbinectedin improves the likelihood of achieving this effect in patients.
We next evaluated the ability of irinotecan or its active metabolite, SN38, to synergize with lurbinectedin (23). SN38 enhances the transcriptional repression of EWS-FLI1 by trabectedin (23). This loss of EWS-FLI1 activity leads to a loss of expression of the EWS-FLI1 downstream target WRN, establishing a hypersensitivity to the DNA-damaging properties of the camptothecin (41-43). Importantly, the combination of trabectedin and irinotecan has shown evidence of activity in a treatment-refractory Ewing sarcoma patient in the clinic (44).
Similar to the case with trabectedin, treatment of TC32 Ewing sarcoma cells with a relatively low dose (2.5 nmol/L) of lurbinectedin caused minimal but evident EWS-FLI1 relocalization (Supplementary Fig.S2) and marginally suppressed expression of the EWS-FLI1 target genes NR0B1, ID2, and EZH2 by western blot analysis (Fig. 3A, lane 3). However, when lurbinectedin was combined with SN38, we observed marked suppression and a virtual elimination of expression of the EWS-FLI1 target genes (Fig. 4A, lanes 7-9). Importantly, the effect of SN38 on EWS-FLI1-driven transcription was not due to cooperative relocalization of EWS-FLI1 to the nucleolus, as there was no effect on the nuclear distribution of EWS-FLI1 with SN38 treatment (Fig. 4B). Furthermore, the suppression of EWS-FLI1 activity by lurbinectedin was accompanied by a dose-dependent suppression of WRN helicase expression (Fig. 4C), which established the hypersensitivity to the DNA-damaging properties of SN38 and the synergy of the two agents (Fig. 4D and Table 1)(41-43).
Figure 4. Lurbinectedin synergized with SN38 to poison EWS/FLI1 activity and induced DNA damage.
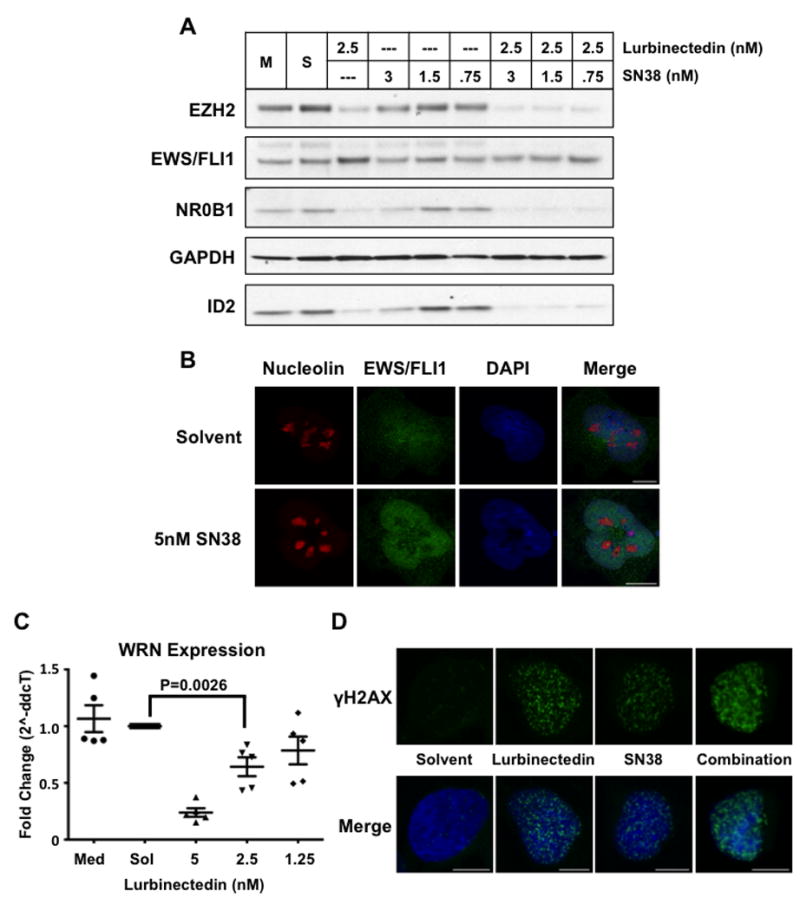
A) Western blot of TC32 cells after 18 h of treatment with either lurbinectedin alone, SN38 alone, or the combination at the indicated concentrations. B) Confocal microscopy of nucleolin (red) and EWS/FLI1 (green) in response to 5 nmol/L SN38 treatment after 6 h. DAPI (blue) staining of the nucleus. C) Quantitative PCR analysis of WRN mRNA expression in TC32 cells upon 12-h treatment with lurbinectedin at the indicated concentrations. D) Single-cell confocal microscopy showing γH2AX (green) foci upon 12-h treatment with 5 nmol/L of lurbinectedin, 5 nmol/L SN38, or the combination. DAPI (blue) staining of the nucleus. P-value was determined using a two-sided Student’s T-test. Scale bars = 10um throughout this figure.
Table 1. Combination index values.
CI values show synergy between lurbinectedin and irinotecan.
| Experimental Points | Median Effect Equation | ||||
|---|---|---|---|---|---|
| 2X IC50 | IC50 | 0.5X IC50 | ED50 | ED75 | |
| Trabectedin & SN38 | 1.03 +/- 0.07 | 0.67 +/- 0.03 | 1.04 +/- 0.24 | 0.55 +/- 0.25 | 0.82 +/- 0.23 |
| Lurbinectedin & SN38 | 0.93 +/- 0.10 | 0.63 +/- 0.03 | 1.10 +/- 0.24 | 0.67 +/- 0.09 | 0.81 +/- 0.09 |
CI < 1 = synergy; CI = 1 is additive, CI >1 = antagonism.
In order to test the combination of lurbinectedin and irinotecan in vivo, we evaluated two different xenograft models of Ewing sarcoma, TC71 and TC32. Both cohorts were treated with lurbinectedin at 0.18 mg/kg IV on days 0, 7 (TC32) or 0, 7, 14 (TC71). TC71 mice were treated with irinotecan (5 mg/kg) on days 1 to 3, 8 to 10, and 15 to 17; TC32 mice received irinotecan on days 3 and 10. Both single-agent therapies delayed tumor growth, and the combination therapy led to a sustained regression of tumors from both xenografts (Supplementary Fig. S5) that translated into an improvement in the fraction of animals surviving (Fig.5A). It is notable that 30% of the mice bearing the TC32 xenograft and 70% of mice bearing the TC71 xenograft treated with the combination therapy did not reach a 2-cm diameter until well after 100 days even though the mice were showing no evidence of toxicity and therapy was stopped on day 10 (TC32) or 17 (TC71). This effect was rooted in the suppression of EWS-FLI1, because treatment of these mice with lurbinectedin alone suppressed NR0B1 expression as measured by a novel immunofluorescent assay (Fig.5B, control staining and quantitation shown in Supplementary Figure S6A).
Figure 5. The combination of lurbinectedin and irinotecan suppressed Ewing sarcoma xenograft growth and EWS-FLI1 activity in vivo.
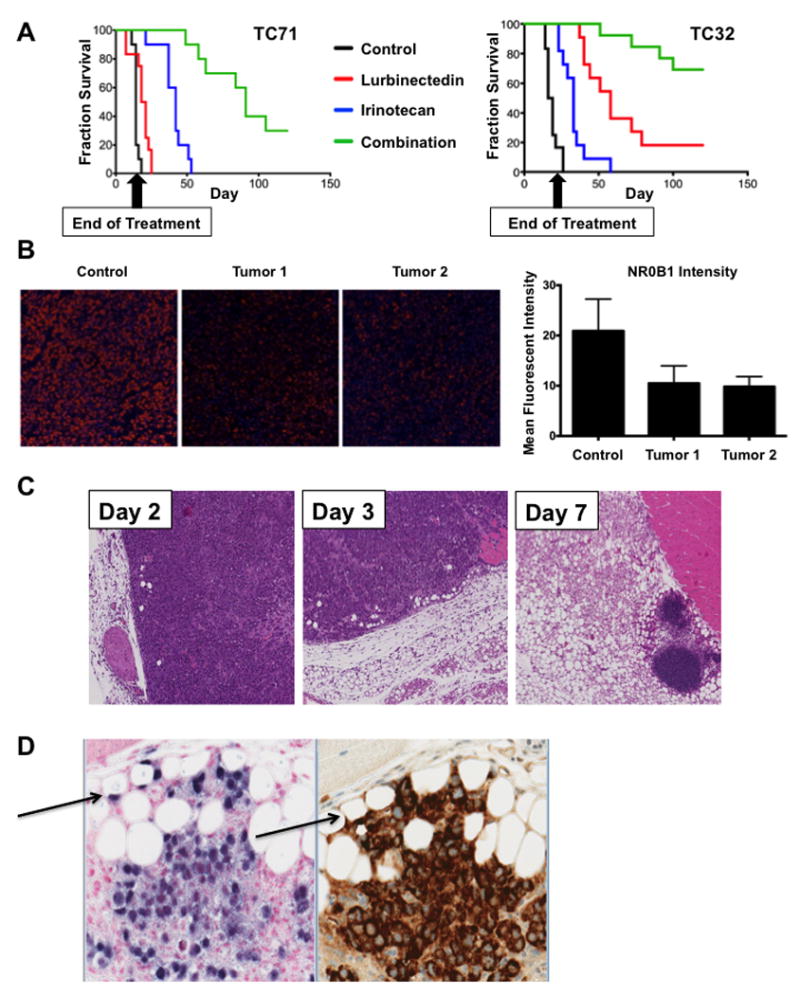
A) Survival curves for mice bearing TC71 (left) or TC32 (right) xenografts. Both cohorts were treated with lurbinectedin on days 0 and 7. TC32 mice were treated with irinotecan on days 3 and 10, while TC71 mice received an additional dose of lurbinectedin on day 14 and irinotecan on days 1-3, 8-10, and 15 -17. All groups survived significantly longer than control (all P < 0.0001). P-value was determined using a Cox proportional hazards regression. B) Left, Immunofluorescence images from xenograft tissue showing NR0B1 staining (red) in the control and lurbinectedin cohorts at day 3. Right, quantification of the immunofluorescence imaging on the left. Images were obtained at 20X magnification. C) H & E staining showing gradual differentiation of TC71 tumor into fat in mice; samples collected on days 2, 3, and 7 of treatment with both irinotecan and lurbinectedin. D) Section of xenograft containing adipocytes of human origin (arrows). Stains are left, ALUish DNA probes for human specific ALU repeat elements at 20X, and right, human-specific mitochondrial surface stain.
It is notable that the mice experienced very little toxicity and had a marginal reduction in weight gain relative to control animals (Supplementary figure S5, bottom). It is likely that this marginal toxicity is due to the fact that the therapy was extremely effective and therefore required only a short duration of treatment (Fig. 5A, Supplementary Fig. S5).
To explain the persistence of the effect after cessation of therapy, we evaluated the effect of drug treatment on the morphology of the xenograft. We found that tumors treated with the combination showed a time-dependent, nearly complete replacement of the tissue with benign fat (Fig.5C). Within the tumor sections, there were focal zones that appeared to be actively differentiating (Fig. 5D). The fat in these areas were human in origin and stained positive with ALU-ish, a marker of human DNA or a human specific mitochondrial antibody (Fig 5D). These areas were also positive for ki67 but not cleaved caspase 3 (supplementary Fig. S6B). Nevertheless, the staining for the human markers faded away from these regions consistent with known remodeling that occurs with human fat xenografts in immunocompromised mice (supplementary Fig. S6C)(45). Indeed this effect presents a challenge to breast cancer xenograft studies (45). This result is consistent with the differentiation of at least a portion of the tumor into benign fat, as well as loss of EWS-FLI1 activity that is known to repress differentiation, particularly for EWS-FLI1-repressed targets (3,6).
Finally to ensure that the differentiation phenotype was a result of drug treatment and not a result of the mouse microenvironment, we examined the ability of Ewing sarcoma cells to differentiate in vitro. While continuous exposure to lurbinectedin led to the induction of fat differentiation genes, CEBPA and PPARG, over 48 hours the net effect was cytotoxicity with very few viable cells evident at 48 hours (Fig 6A and B). However, brief exposures to drug led to sustained effects on tumor proliferation with as little as 30 minutes of exposure to lurbinectedin (Fig. 6A). Indeed, 60 minutes of exposure to lurbinectedin led to the long term suppression of proliferation that was accompanied by the robust induction of the fat differentiation genes CEBPA and PPARG as well as evidence of accumulation of neutral lipid in the Ewing sarcoma cells as measured by two different neutral lipid stains, Oil RedO and BODIPY (Fig 6 B, C, D). In essence these effects recapitulate the results seen with siRNA silencing of EWS-FLI1 that has been previously reported as well as the differentiation we observed here in animal models (7). Importantly, the in vitro exposures with washout are more reflective of the exposures seen in the mouse although higher concentration and longer exposures should be attainable in patients consistent with the overall goals of the study (18,46).
Figure 6. Transient lurbinectedin treatment induces adipogenic differentiation.
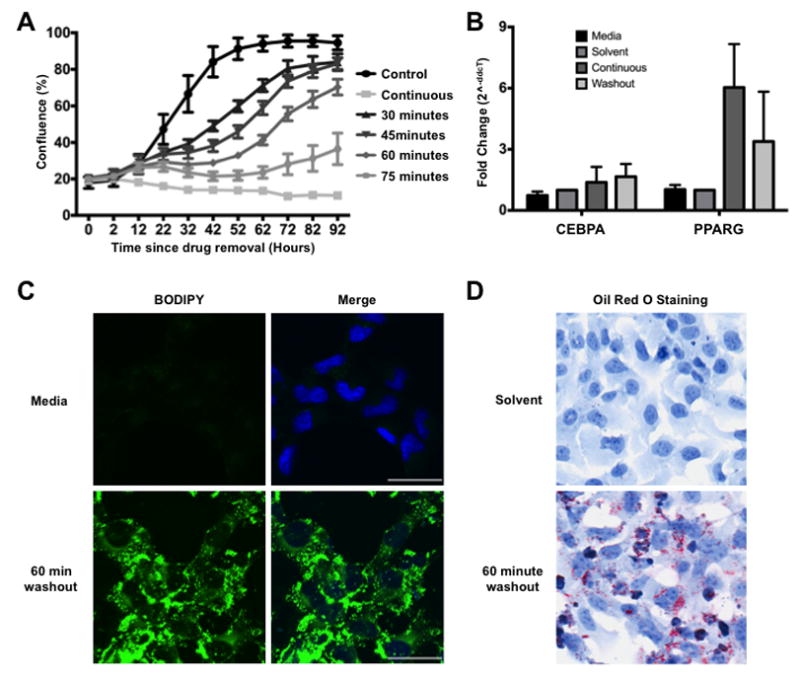
A) TC32 growth curves as measured by percent confluence. TC32 cells were treated with 10 nmol/L lurbinectedin for the indicated time period followed by 4 days in regular RPMI media. B) Treatment of TC32 cells for 60 minutes with 10 nmol/L lurbinectedin induces expression of terminal adipogenic transcription factors, CEBPA and PPARG. C) Confocal imaging of BODIPY dye comparing solvent to 10 nmol/L lurbinectedin washout. Images were taken 48 hours after the drug was removed from the media. BODIPY, neutral lipid dye; Hoechst, DNA stain. D) Oil Red O staining comparing solvent and 10 nmol/L lurbinectedin washout. Images were taken 48 hours after drug was removed from the media. Images were taken at 20X magnification. Scale bars = 50um.
Discussion
In this report, we describe a novel approach to target oncogenic fusion proteins. We exploit the inherent competition between the oncogenic properties of the fusion protein and the retained wild-type functions of one of the fusion partners. By activating the DNA damage response of EWSR1, we are able to reposition EWS-FLI1 within the nucleus to suppress its activity. In the process, we provide evidence that a DNA binding and DNA damaging agent can serve as a targeted agent. In addition, we characterize a novel mechanism of tumor differentiation and show evidence for this process both in vitro and in vivo.
The mechanism described in this study may explain the activity of trabectedin against Ewing sarcoma in the clinic.There was originally widespread interest in trabectedin for this disease because of a complete response in a treatment refractory Ewing sarcoma patient in the Phase I pediatric study (47). However, the follow-up phase II study in Ewing sarcoma was negative (48). The main difference between the studies (beyond the study design and goals) was a change in schedule in the phase II that led to a substantially lower Cmax in the patient’s serum. In our study, the levels of drug achieved in the phase II study (around 2.5 nmol/L) caused minimal redistribution of EWS-FLI1 and marginal suppression of EWS-FLI1 activity. In contrast, the phase I serum levels (>10 nmol/L) would be sufficient to cause this redistribution of EWS-FLI1 and suppression of activity, perhaps accounting for the response to the drug seen in the clinic. Therefore, it is possible that the activity of trabectedin seen in the phase I study may be reproduced in the phase II setting if the drug is given as a 3-hour infusion. This likelihood of response would be increased by combining the drug with the potentiator, low dose irinotecan, as has been recently reported in the clinic (44).
Alternatively, the suppression of EWS-FLI1 could be improved by using a second-generation compound, lurbinectedin, which has an improved PK profile, making the redistribution of EWS-FLI1 more easily attainable in patients. In this study, we show the redistribution of EWS-FLI1 occurs with lurbinectedin at 5-10 nmol/L while the Cmax of this drug is around (182.2 ng/mL or >200 nmol/L)(49). Furthermore, we show that irinotecan potentiates lurbinectedin-mediated EWS-FLI1 suppression. Finally, we show that lurbinectedin sensitizes cells to irinotecan-mediated DNA damage leading to marked synergy between the two agents.It is notable that combination therapies involving irinotecan have shown good activity in the clinic and therefore are commonly used as part of salvage regimens for the disease (50). It is possible that these irinotecan based combination therapies can be improved by centering the synergy around the therapeutic suppression of EWS-FLI1 where lurbinectedin sensitizes to irinotecan and irinotecan in turn potentiates lurbinectedin.
Together these results provide a novel approach to the targeting of oncogenic transcription factors and a new EWS-FLI1 directed therapy for Ewing sarcoma.
Supplementary Material
Acknowledgments
Research reported in this manuscript was supported by the National Cancer Institute of the National Institutes of Health under award number R01CA188314 (P.J. Grohar). The content is solely the responsibility of the authors and does not necessarily represent the official views of the National Institutes of Health. Funding to develop the immunofluorescent assay was provided by the Alex’s Lemonade Stand Reach Award (P.J. Grohar). Additional internal funds were provided by the Vanderbilt University, Department of Pediatrics and the Lily’s Garden Foundation (P.J. Grohar). Internal funding from the Van Andel Institute helped support this study (P.J. Grohar). Funding supporting M. D’Incalci’s research program is provided by the Italian Association for Cancer Research (AIRC). The authors would like to thank David Nadziejka for technical editing of the manuscript.
Footnotes
CONFLICT OF INTEREST
Maria Jose Guillen Navarro, Carlos María Galmarini and Pablo Aviles are all employees of PharmaMar. MD received honoraria from PharmaMar. Patrick J. Grohar does not receive financial support or any support for his research program from PharmaMar. No member of Patrick J. Grohar’s research team receives any financial support from PharmaMar. The compounds used in the study were provided free of charge.
References
- 1.Delattre O, Zucman J, Plougastel B, Desmaze C, Melot T, Peter M, et al. Gene fusion with an ETS DNA-binding domain caused by chromosome translocation in human tumours. Nature. 1992;359(6391):162–5. doi: 10.1038/359162a0. [DOI] [PubMed] [Google Scholar]
- 2.Maksimenko A, Malvy C. Oncogene-targeted antisense oligonucleotides for the treatment of Ewing sarcoma. Expert Opin Ther Targets. 2005;9(4):825–30. doi: 10.1517/14728222.9.4.825. [DOI] [PubMed] [Google Scholar]
- 3.Kauer M, Ban J, Kofler R, Walker B, Davis S, Meltzer P, et al. A molecular function map of Ewing’s sarcoma. PLoS One. 2009;4(4):e5415. doi: 10.1371/journal.pone.0005415. [DOI] [PMC free article] [PubMed] [Google Scholar]
- 4.Li KK, Lee KA. Transcriptional activation by the Ewing’s sarcoma (EWS) oncogene can be cis-repressed by the EWS RNA-binding domain. J Biol Chem. 2000;275(30):23053–8. doi: 10.1074/jbc.M002961200. [DOI] [PubMed] [Google Scholar]
- 5.Alex D, Lee KA. RGG-boxes of the EWS oncoprotein repress a range of transcriptional activation domains. Nucleic Acids Res. 2005;33(4):1323–31. doi: 10.1093/nar/gki270. [DOI] [PMC free article] [PubMed] [Google Scholar]
- 6.Torchia EC, Jaishankar S, Baker SJ. Ewing tumor fusion proteins block the differentiation of pluripotent marrow stromal cells. Cancer Res. 2003;63(13):3464–8. [PubMed] [Google Scholar]
- 7.Tirode F, Laud-Duval K, Prieur A, Delorme B, Charbord P, Delattre O. Mesenchymal stem cell features of Ewing tumors. Cancer Cell. 2007;11(5):421–9. doi: 10.1016/j.ccr.2007.02.027. [DOI] [PubMed] [Google Scholar]
- 8.Paronetto MP, Minana B, Valcarcel J. The Ewing sarcoma protein regulates DNA damage-induced alternative splicing. Mol Cell. 2011;43(3):353–68. doi: 10.1016/j.molcel.2011.05.035. [DOI] [PubMed] [Google Scholar]
- 9.Grohar PJ, Griffin LB, Yeung C, Chen QR, Pommier Y, Khanna C, et al. Ecteinascidin 743 interferes with the activity of EWS-FLI1 in Ewing sarcoma cells. Neoplasia. 2011;13(2):145–53. doi: 10.1593/neo.101202. [DOI] [PMC free article] [PubMed] [Google Scholar]
- 10.Grohar PJ, Woldemichael GM, Griffin LB, Mendoza A, Chen QR, Yeung C, et al. Identification of an Inhibitor of the EWS-FLI1 Oncogenic Transcription Factor by High-Throughput Screening. J Natl Cancer Inst. 2011;103(12):962–78. doi: 10.1093/jnci/djr156. [DOI] [PMC free article] [PubMed] [Google Scholar]
- 11.Osgood CL, Maloney N, Kidd CG, Kitchen-Goosen S, Segars L, Gebregiorgis M, et al. Identification of Mithramycin Analogues with Improved Targeting of the EWS-FLI1 Transcription Factor. Clin Cancer Res. 2016 doi: 10.1158/1078-0432.CCR-15-2624. [DOI] [PMC free article] [PubMed] [Google Scholar]
- 12.Liao Y, Smyth GK, Shi W. The Subread aligner: fast, accurate and scalable read mapping by seed-and-vote. Nucleic Acids Res. 2013;41(10):e108. doi: 10.1093/nar/gkt214. [DOI] [PMC free article] [PubMed] [Google Scholar]
- 13.Law CW, Chen Y, Shi W, Smyth GK. voom: Precision weights unlock linear model analysis tools for RNA-seq read counts. Genome Biol. 2014;15(2):R29. doi: 10.1186/gb-2014-15-2-r29. [DOI] [PMC free article] [PubMed] [Google Scholar]
- 14.Ritchie ME, Phipson B, Wu D, Hu Y, Law CW, Shi W, et al. limma powers differential expression analyses for RNA-sequencing and microarray studies. Nucleic Acids Res. 2015;43(7):e47. doi: 10.1093/nar/gkv007. [DOI] [PMC free article] [PubMed] [Google Scholar]
- 15.Hancock JD, Lessnick SL. A transcriptional profiling meta-analysis reveals a core EWS-FLI gene expression signature. Cell Cycle. 2008;7(2):250–6. doi: 10.4161/cc.7.2.5229. [DOI] [PubMed] [Google Scholar]
- 16.Forni C, Minuzzo M, Virdis E, Tamborini E, Simone M, Tavecchio M, et al. Trabectedin (ET-743) promotes differentiation in myxoid liposarcoma tumors. Mol Cancer Ther. 2009;8(2):449–57. doi: 10.1158/1535-7163.MCT-08-0848. [DOI] [PubMed] [Google Scholar]
- 17.D’Incalci M, Galmarini CM. A review of trabectedin (ET-743): a unique mechanism of action. Mol Cancer Ther. 2010;9(8):2157–63. doi: 10.1158/1535-7163.MCT-10-0263. [DOI] [PubMed] [Google Scholar]
- 18.Elez ME, Tabernero J, Geary D, Macarulla T, Kang SP, Kahatt C, et al. First-In-Human Phase I Study of Lurbinectedin (PM01183) in Patients with Advanced Solid Tumors. Clin Cancer Res. 2014 doi: 10.1158/1078-0432.CCR-13-1880. [DOI] [PubMed] [Google Scholar]
- 19.Dohjima T, Lee NS, Li H, Ohno T, Rossi JJ. Small interfering RNAs expressed from a Pol III promoter suppress the EWS/Fli-1 transcript in an Ewing sarcoma cell line. Mol Ther. 2003;7(6):811–6. doi: 10.1016/s1525-0016(03)00101-1. [DOI] [PubMed] [Google Scholar]
- 20.Wei GH, Badis G, Berger MF, Kivioja T, Palin K, Enge M, et al. Genome-wide analysis of ETS-family DNA-binding in vitro and in vivo. EMBO J. 2010;29(13):2147–60. doi: 10.1038/emboj.2010.106. [DOI] [PMC free article] [PubMed] [Google Scholar]
- 21.Gangwal K, Sankar S, Hollenhorst PC, Kinsey M, Haroldsen SC, Shah AA, et al. Microsatellites as EWS/FLI response elements in Ewing’s sarcoma. Proc Natl Acad Sci U S A. 2008;105(29):10149–54. doi: 10.1073/pnas.0801073105. [DOI] [PMC free article] [PubMed] [Google Scholar]
- 22.Patel M, Simon JM, Iglesia MD, Wu SB, McFadden AW, Lieb JD, et al. Tumor-specific retargeting of an oncogenic transcription factor chimera results in dysregulation of chromatin and transcription. Genome Res. 2012;22(2):259–70. doi: 10.1101/gr.125666.111. [DOI] [PMC free article] [PubMed] [Google Scholar]
- 23.Grohar PJ, Segars LE, Yeung C, Pommier Y, D’Incalci M, Mendoza A, et al. Dual targeting of EWS-FLI1 activity and the associated DNA damage response with trabectedin and SN38 synergistically inhibits Ewing sarcoma cell growth. Clin Cancer Res. 2014;20(5):1190–203. doi: 10.1158/1078-0432.CCR-13-0901. [DOI] [PMC free article] [PubMed] [Google Scholar]
- 24.Mendiola M, Carrillo J, Garcia E, Lalli E, Hernandez T, de Alava E, et al. The orphan nuclear receptor DAX1 is up-regulated by the EWS/FLI1 oncoprotein and is highly expressed in Ewing tumors. Int J Cancer. 2006;118(6):1381–9. doi: 10.1002/ijc.21578. [DOI] [PubMed] [Google Scholar]
- 25.Kinsey M, Smith R, Iyer AK, McCabe ER, Lessnick SL. EWS/FLI and its downstream target NR0B1 interact directly to modulate transcription and oncogenesis in Ewing’s sarcoma. Cancer Res. 2009;69(23):9047–55. doi: 10.1158/0008-5472.CAN-09-1540. [DOI] [PMC free article] [PubMed] [Google Scholar]
- 26.Tong DL, Boocock DJ, Dhondalay GK, Lemetre C, Ball GR. Artificial neural network inference (ANNI): a study on gene-gene interaction for biomarkers in childhood sarcomas. PLoS One. 2014;9(7):e102483. doi: 10.1371/journal.pone.0102483. [DOI] [PMC free article] [PubMed] [Google Scholar]
- 27.Nakatani F, Tanaka K, Sakimura R, Matsumoto Y, Matsunobu T, Li X, et al. Identification of p21WAF1/CIP1 as a direct target of EWS-Fli1 oncogenic fusion protein. J Biol Chem. 2003;278(17):15105–15. doi: 10.1074/jbc.M211470200. [DOI] [PubMed] [Google Scholar]
- 28.Boro A, Pretre K, Rechfeld F, Thalhammer V, Oesch S, Wachtel M, et al. Small-molecule screen identifies modulators of EWS/FLI1 target gene expression and cell survival in Ewing’s sarcoma. Int J Cancer. 2012;131(9):2153–64. doi: 10.1002/ijc.27472. [DOI] [PubMed] [Google Scholar]
- 29.Sankar S, Bell R, Stephens B, Zhuo R, Sharma S, Bearss DJ, et al. Mechanism and relevance of EWS/FLI-mediated transcriptional repression in Ewing sarcoma. Oncogene. 2013;32(42):5089–100. doi: 10.1038/onc.2012.525. [DOI] [PMC free article] [PubMed] [Google Scholar]
- 30.Wiles ET, Lui-Sargent B, Bell R, Lessnick SL. BCL11B is up-regulated by EWS/FLI and contributes to the transformed phenotype in Ewing sarcoma. PLoS One. 2013;8(3):e59369. doi: 10.1371/journal.pone.0059369. [DOI] [PMC free article] [PubMed] [Google Scholar]
- 31.Grunewald TG, Diebold I, Esposito I, Plehm S, Hauer K, Thiel U, et al. STEAP1 is associated with the invasive and oxidative stress phenotype of Ewing tumors. Mol Cancer Res. 2012;10(1):52–65. doi: 10.1158/1541-7786.MCR-11-0524. [DOI] [PubMed] [Google Scholar]
- 32.Surdez D, Benetkiewicz M, Perrin V, Han ZY, Pierron G, Ballet S, et al. Targeting the EWSR1-FLI1 oncogene-induced protein kinase PKC-beta abolishes ewing sarcoma growth. Cancer Res. 2012;72(17):4494–503. doi: 10.1158/0008-5472.CAN-12-0371. [DOI] [PubMed] [Google Scholar]
- 33.Kasza A. Signal-dependent Elk-1 target genes involved in transcript processing and cell migration. Biochim Biophys Acta. 2013;1829(10):1026–33. doi: 10.1016/j.bbagrm.2013.05.004. [DOI] [PubMed] [Google Scholar]
- 34.Bhinge AA, Kim J, Euskirchen GM, Snyder M, Iyer VR. Mapping the chromosomal targets of STAT1 by Sequence Tag Analysis of Genomic Enrichment (STAGE) Genome Res. 2007;17(6):910–6. doi: 10.1101/gr.5574907. [DOI] [PMC free article] [PubMed] [Google Scholar]
- 35.Regis G, Pensa S, Boselli D, Novelli F, Poli V. Ups and downs: the STAT1:STAT3 seesaw of Interferon and gp130 receptor signalling. Semin Cell Dev Biol. 2008;19(4):351–9. doi: 10.1016/j.semcdb.2008.06.004. [DOI] [PubMed] [Google Scholar]
- 36.Carpenter RL, Lo HW. STAT3 Target Genes Relevant to Human Cancers. Cancers (Basel) 2014;6(2):897–925. doi: 10.3390/cancers6020897. [DOI] [PMC free article] [PubMed] [Google Scholar]
- 37.Bracken AP, Ciro M, Cocito A, Helin K. E2F target genes: unraveling the biology. Trends Biochem Sci. 2004;29(8):409–17. doi: 10.1016/j.tibs.2004.06.006. [DOI] [PubMed] [Google Scholar]
- 38.Pahl HL. Activators and target genes of Rel/NF-kappaB transcription factors. Oncogene. 1999;18(49):6853–66. doi: 10.1038/sj.onc.1203239. [DOI] [PubMed] [Google Scholar]
- 39.Tiwari N, Meyer-Schaller N, Arnold P, Antoniadis H, Pachkov M, van Nimwegen E, et al. Klf4 is a transcriptional regulator of genes critical for EMT, including Jnk1 (Mapk8) PLoS One. 2013;8(2):e57329. doi: 10.1371/journal.pone.0057329. [DOI] [PMC free article] [PubMed] [Google Scholar]
- 40.Gangwal K, Close D, Enriquez CA, Hill CP, Lessnick SL. Emergent Properties of EWS/FLI Regulation via GGAA Microsatellites in Ewing’s Sarcoma. Genes Cancer. 2010;1(2):177–87. doi: 10.1177/1947601910361495. [DOI] [PMC free article] [PubMed] [Google Scholar]
- 41.Poot M, Gollahon KA, Rabinovitch PS. Werner syndrome lymphoblastoid cells are sensitive to camptothecin-induced apoptosis in S-phase. Hum Genet. 1999;104(1):10–4. doi: 10.1007/s004390050903. [DOI] [PubMed] [Google Scholar]
- 42.Lebel M, Leder P. A deletion within the murine Werner syndrome helicase induces sensitivity to inhibitors of topoisomerase and loss of cellular proliferative capacity. Proc Natl Acad Sci U S A. 1998;95(22):13097–102. doi: 10.1073/pnas.95.22.13097. [DOI] [PMC free article] [PubMed] [Google Scholar]
- 43.Pichierri P, Franchitto A, Mosesso P, Palitti F. Werner’s syndrome cell lines are hypersensitive to camptothecin-induced chromosomal damage. Mutat Res. 2000;456(1-2):45–57. doi: 10.1016/s0027-5107(00)00109-3. [DOI] [PubMed] [Google Scholar]
- 44.Tancredi R, Zambelli A, DaPrada GA, Fregoni V, Pavesi L, Riccardi A, et al. Targeting the EWS-FLI1 transcription factor in Ewing sarcoma. Cancer Chemother Pharmacol. 2015;75(6):1317–20. doi: 10.1007/s00280-015-2726-7. [DOI] [PubMed] [Google Scholar]
- 45.Proia DA, Kuperwasser C. Reconstruction of human mammary tissues in a mouse model. Nat Protoc. 2006;(11):206–14. doi: 10.1038/nprot.2006.31. [DOI] [PubMed] [Google Scholar]
- 46.Pernice T, Bishop AG, Guillen MJ, Cuevas C, Aviles P. Development of a liquid chromatography/tandem mass spectrometry assay for the quantification of PM01183 (lurbinectedin), a novel antineoplastic agent, in mouse, rat, dog, Cynomolgus monkey and mini-pig plasma. J Pharm Biomed Anal. 2016;123:37–41. doi: 10.1016/j.jpba.2016.01.043. [DOI] [PubMed] [Google Scholar]
- 47.Lau L, Supko JG, Blaney S, Hershon L, Seibel N, Krailo M, et al. A phase I and pharmacokinetic study of ecteinascidin-743 (Yondelis) in children with refractory solid tumors. A Children’s Oncology Group study. Clin Cancer Res. 2005;11(2 Pt 1):672–7. [PubMed] [Google Scholar]
- 48.Baruchel S, Pappo A, Krailo M, Baker KS, Wu B, Villaluna D, et al. A phase 2 trial of trabectedin in children with recurrent rhabdomyosarcoma, Ewing sarcoma and non-rhabdomyosarcoma soft tissue sarcomas: a report from the Children’s Oncology Group. Eur J Cancer. 2012;48(4):579–85. doi: 10.1016/j.ejca.2011.09.027. [DOI] [PubMed] [Google Scholar]
- 49.Elez ME, Tabernero J, Geary D, Macarulla T, Kang SP, Kahatt C, et al. First-in-human phase I study of Lurbinectedin (PM01183) in patients with advanced solid tumors. Clin Cancer Res. 2014;20(8):2205–14. doi: 10.1158/1078-0432.CCR-13-1880. [DOI] [PubMed] [Google Scholar]
- 50.Wagner L. Camptothecin-based regimens for treatment of ewing sarcoma: past studies and future directions. Sarcoma. 2011;2011 doi: 10.1155/2011/957957. 957957. [DOI] [PMC free article] [PubMed] [Google Scholar]
Associated Data
This section collects any data citations, data availability statements, or supplementary materials included in this article.