Summary
Overweight and obesity affect ~1.5 billion people worldwide, and are major risk factors for type-2 diabetes (T2D), cardiovascular disease and related metabolic and inflammatory disturbances.1,2 Although the mechanisms linking adiposity to its clinical sequelae are poorly understood, recent studies suggest that adiposity may influence DNA methylation,3–6 a key regulator of gene expression and molecular phenotype.7 Here we use epigenome-wide association to show that body mass index (BMI, a key measure of adiposity) is associated with widespread changes in DNA methylation (187 genetic loci at P<1x10⁻⁷, range P=9.2x10⁻⁸ to 6.0x10-46; N=10,261 samples). Genetic association analyses demonstrate that the alterations in DNA methylation are predominantly the consequence of adiposity, rather than the cause. We find the methylation loci are enriched for functional genomic features in multiple tissues (P<0.05), and show that sentinel methylation markers identify gene expression signatures at 38 loci (P<9.0x10⁻⁶, range P=5.5x10⁻⁶ to 6.1x10⁻³⁵, N=1,785 samples). The methylation loci identified highlight genes involved in lipid and lipoprotein metabolism, substrate transport, and inflammatory pathways. Finally, we show that the disturbances in DNA methylation predict future type-2 diabetes (relative risk per 1SD increase in Methylation Risk Score: 2.3 [2.07-2.56]; P=1.1x10-54). Our results provide new insights into the biologic pathways influenced by adiposity, and may enable development of new strategies for prediction and prevention of type-2 diabetes and other adverse clinical consequences of obesity.
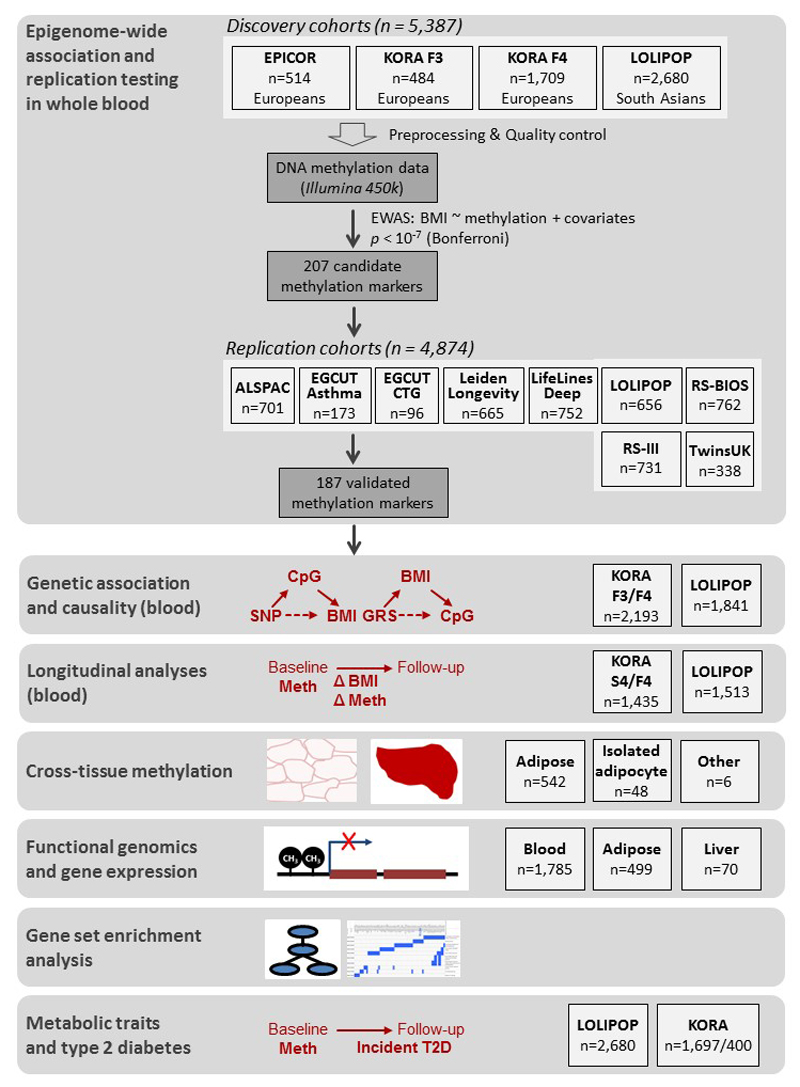
Our study design is summarised in Extended Data Figure 1. We carried out epigenome-wide association amongst 5,387 individuals from the EPICOR (N=514), KORA (N=2,193) and LOLIPOP (N=2,680) population studies (Supplementary Information Tables 1 and 2, and Supplementary Information). We studied individuals of European (EPICOR, KORA) and Indian Asian (LOLIPOP) ancestry, both populations known to be at high risk of obesity and related metabolic disturbances.2,8 DNA methylation in genomic DNA from blood was quantified by Illumina Infinium 450K Human Methylation array. Blood was chosen for the analysis as a metabolically active tissue, with a key role in the adverse inflammatory and vascular consequences of adiposity, and which is widely used for clinical diagnostic purposes.
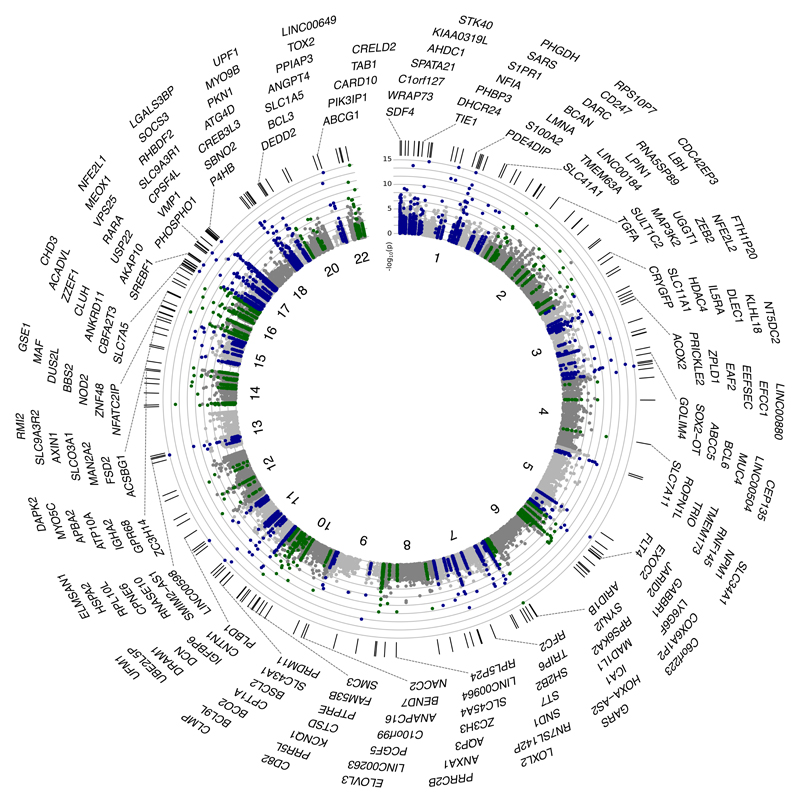
Epigenome-wide association identified 278 CpG sites associated with BMI at P<1x10⁻⁷, distributed between 207 genetic loci (Supplementary Information Tables 3 and 4). At each locus we identified the sentinel marker (CpG site with lowest P value for association with BMI), and carried out replication testing in separate samples of whole blood from European and Indian Asian men and women in population-based studies (N=4,874, Supplementary Information Table 1). The association of DNA methylation with BMI replicated at 187 of the 207 markers (associated with BMI at P<0.05 in replication samples with directional consistency, and at epigenome-wide significance in combined analysis of discovery and replication data, Figure 1, Supplementary Information Table 3). Regional plots for the 187 identified loci are shown in Supplementary Information Figures 1 and 2. Effect sizes range from 6.3±0.9 to 40.2±3.1 kg/m2 change in BMI per unit increase in DNA methylation in blood (scale for methylation 0-1, where 1 represents 100% methylation), with little evidence for heterogeneity between Europeans and Indian Asians (Supplementary Information Table 3). At 7 loci the associations between DNA methylation and BMI are stronger amongst Indian Asians or Europeans (Heterogeneity P<1.0x10⁻⁷) raising the possibility that some effects may be population specific.
Figure 1.
Circos plot of the epigenome-wide association of DNA methylation in blood with BMI. Results are presented as CpG specific association test results [-log10(P)] ordered by genomic position. Green and blue symbols: CpG sites at loci reaching epigenome wide significance (P<1x10⁻⁷); grey symbols: CpG sites at loci not reaching epigenome-wide significance. Chromosome numbers are shown on the inner ring. Tick marks on the outer ring identify the genomic loci reaching epigenome-wide significance. The genes nearest to the sentinel methylation markers at each of the 187 loci are listed around the circos plot.
Sensitivity analyses show that our findings are robust to choice of analytic strategy. The associations of DNA methylation in blood with BMI are not explained by population stratification caused by DNA sequence variation, or by genetic confounding by SNPs in the probe sequence (Supplementary Information Table 5, Supplementary Information Figures 3 and 4). In addition, to address the possibility of confounding by technical factors, we further replicated the associations of DNA methylation in blood with BMI at 4 loci, amongst 990 Europeans and 1,720 Indian Asians (LOLIPOP study), using pyrosequencing as an alternative approach to quantification of methylation (P=1.2x10⁻⁷ to 2.1x10⁻¹² for association of methylation with BMI, Supplementary Information Table 6).
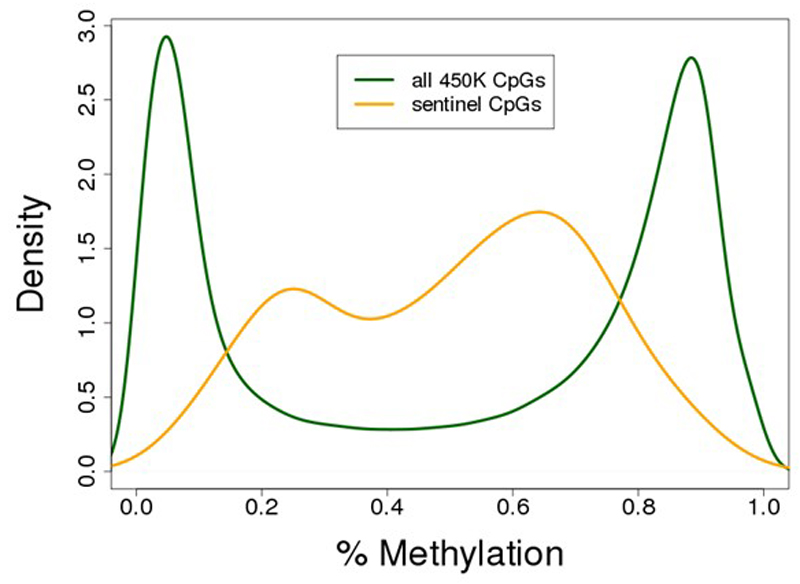
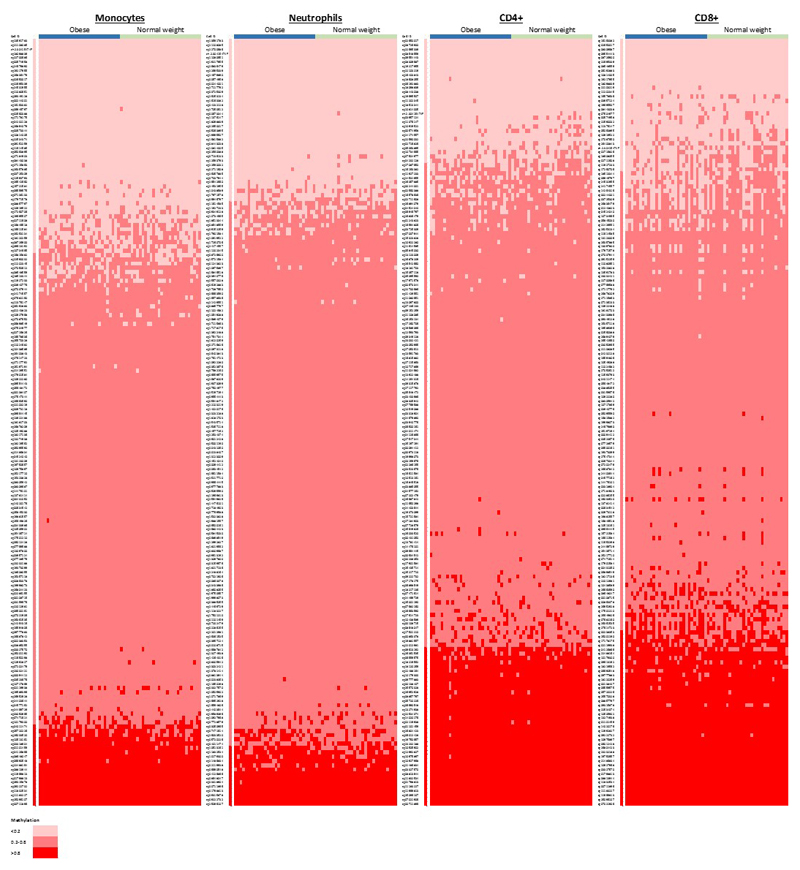
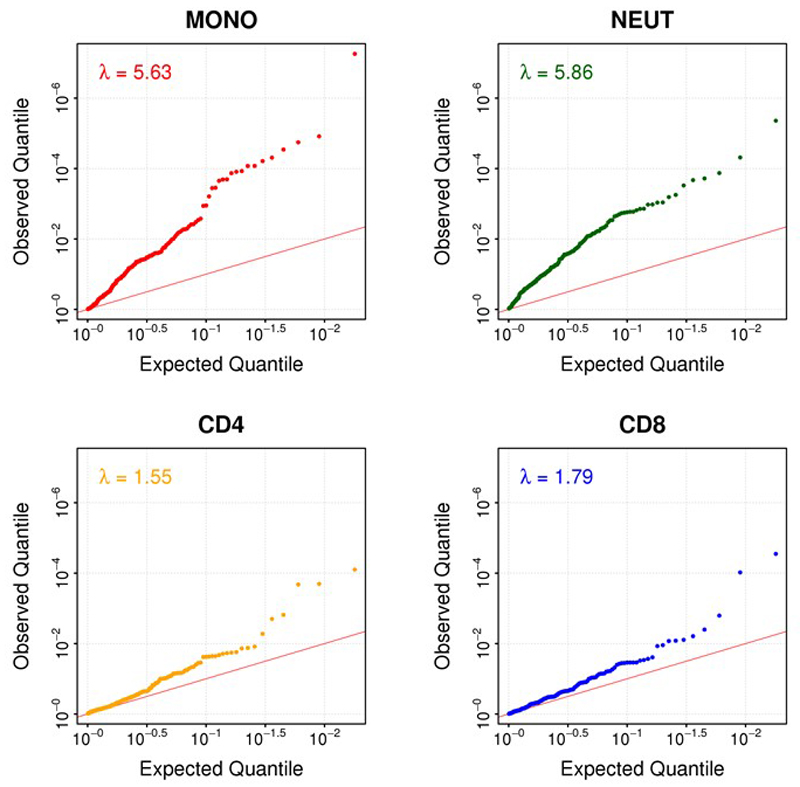
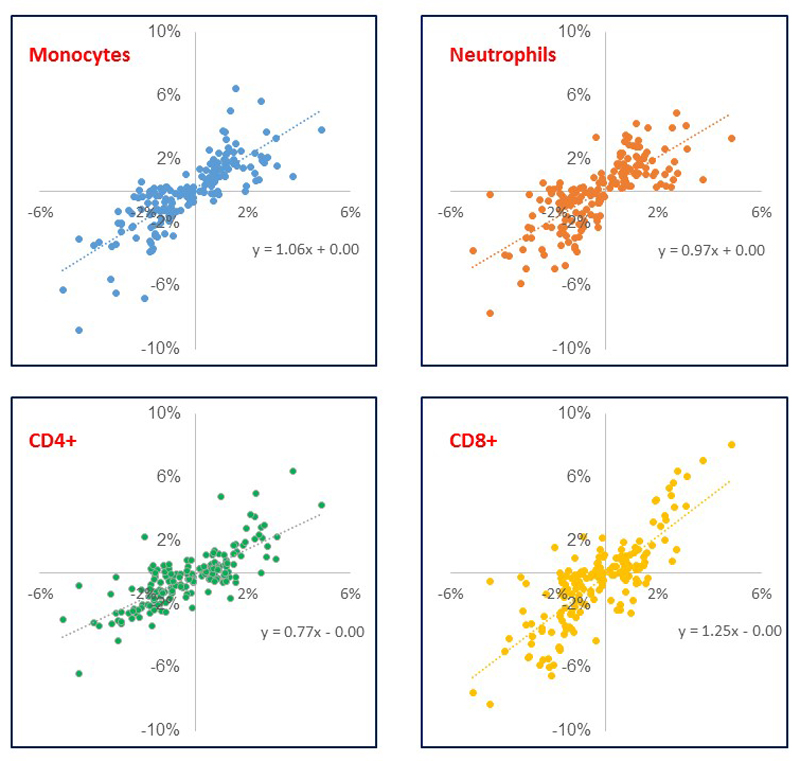
The 187 identified methylation markers are strongly enriched for CpG sites with intermediate levels of methylation, consistent with the presence of mosaicism, ie epigenetic heterogeneity, at these loci (P=1.4x10⁻²² Fisher’s test, Extended Data Figure 2). To better understand the underlying cellular events, and exclude changes in cell subset composition as the basis for our findings, we carried out replication testing of the sentinel loci in isolated white cell subsets (monocytes, neutrophils, CD4+ T cells, and CD8+ T cells, N=60, Supplementary Information Table 7). Epigenetic heterogeneity is present at the majority of loci, in each of the cell subsets studied (Extended Data Figure 3 and Supplementary Information Table 8). The sentinel markers are enriched for association with adiposity in each of the isolated cell subsets (Extended Data Figure 4 and Supplementary Information Table 8), and the relationships between methylation and obesity are directionally consistent with the discovery epigenome-wide association study at between 130 loci (CD4+, P=1.2x10⁻⁹, sign test) and 166 loci (neutrophils, P=5.6x10⁻³⁵, sign test) (Supplementary Information Table 9). Furthermore, effect sizes are directionally consistent and of similar magnitude between the isolated cell subsets (Extended Data Figure 5). The association of DNA methylation with BMI therefore reflects epigenetic heterogeneity at the identified loci, is independent of changes in cell subset distribution, and comprises an effect of adiposity on methylation that is shared across the cell subsets studied.
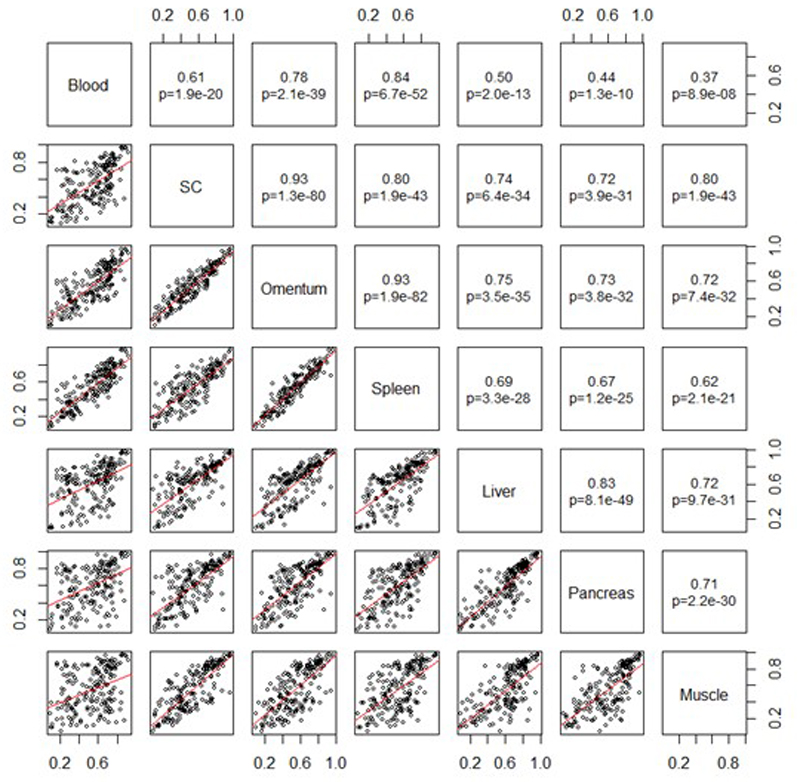
To assess the relevance of our observations in blood to other metabolically relevant tissues, we first compared methylation levels at the 187 loci in blood, subcutaneous and omental fat, liver, muscle, spleen and pancreas.9 Mean methylation levels at the 187 loci correlate moderately to strongly between the tissues (R=0.37 to 0.93, P=8.9x10⁻⁸ to 1.9x10-82 for the 21 tissue pairs, Extended Data Figure 6 and Supplementary Information Figure 5), supporting the view that methylation levels in blood are related to methylation patterns in other tissues at the CpG sites examined.
lnflammatory and hormonal disturbances in the obese adipocyte contribute to the development of insulin resistance and other metabolic consequences of adiposity.10 To better understand how our findings in blood might reflect processes in adipose tissue, we therefore quantified the relationship between DNA methylation and BMI in adipose tissue. 120 of the CpG sites show directional consistency for association with BMI in both adipose tissue and blood (P=1.3x10⁻⁴, binomial test), while 91 sites are associated with BMI in adipose tissue (P<2.7x10⁻⁴, ie P<0.05 after Bonferroni correction for 187 tests, Supplementary Information Table 10). The associations of DNA methylation with BMI in adipose tissue are also unlikely to be the result of differences in the composition of canonical cell-types. First we used Principal Components Analysis (PCA) to assess for cryptic structure arising from variation in cell subset composition in the methylation data. Including principal components as covariates in regression models did not materially influence the association of DNA methylation with BMI in adipose tissue (Supplementary Information Figure 6). In separate studies, we quantified DNA methylation in isolated adipocytes from subcutaneous adipose tissue collected from morbidly obese (BMI>40kg/m2, N=24) and normal weight (N=24) individuals, Despite small sample size, 6 of the 187 sentinel markers were associated with obesity at P<2.7x10⁻⁴ (P<0.05 after Bonferroni correction, Supplementary Information Table 11), while 108 markers show relationships with obesity that are directionally consistent with those observed in the discovery epigenome-wide association study (P=0.04). We separately tested the association of our sentinel methylation markers with BMI in samples of liver (N=55), as a further metabolically relevant tissue. We find that the 114 of the CpG sites show consistent direction of association with BMI compared to findings in blood (P=0.001, sign test, Supplementary Information Table 10), thus providing further replication of our findings in liver cells. Our findings indicate that many of the relationships between methylation and BMI in blood are shared by adipose and liver cells, but also identify effects that are tissue specific.
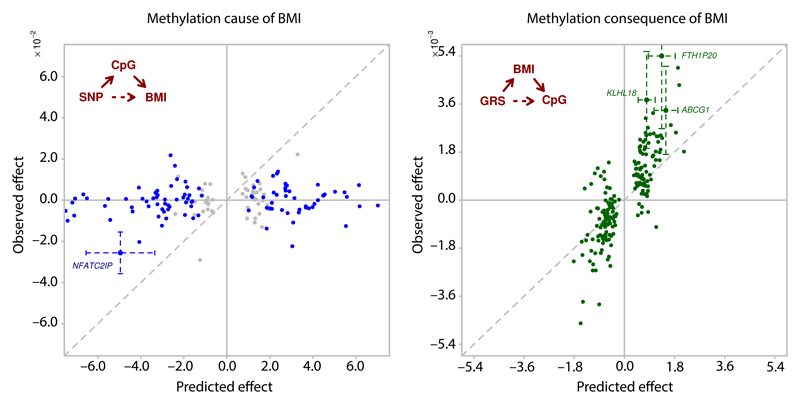
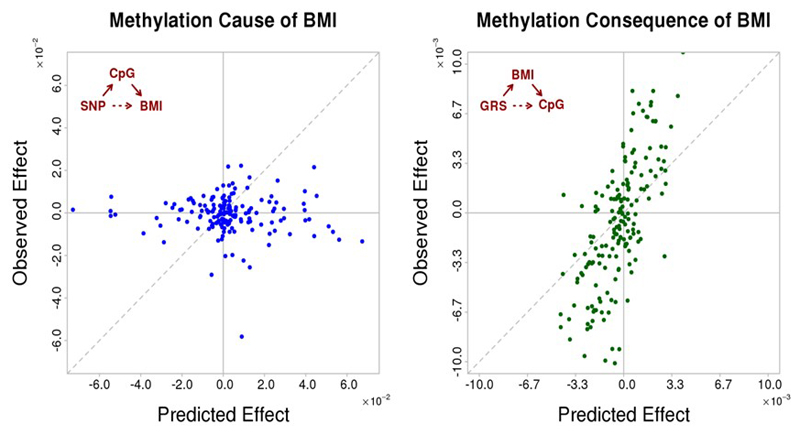
Next, we used genetic association and the concept of Mendelian randomisation to investigate the potential causal relationships between DNA methylation in blood and BMI.11 We first identified SNPs influencing DNA methylation in blood in cis (1Mb, N=4,034 people). We then tested whether SNPs that influence methylation in blood also influence BMI, and whether the predicted effects of SNPs on BMI via methylation are consistent with the directly observed association. We identify a single CpG (cg26663590: NFATC2IP) showing evidence from genetic association for a causal role of methylation on BMI (P=9.6x10⁻⁷ for association of SNP rs11150675 near NFATC2IP with BMI, Figure 2A and Supplementary Information Table 12). In keeping with a causal role for methylation at NFATC2IP underlying adiposity, baseline levels of methylation at cg26663590 predict weight gain in longitudinal population studies (P=0.03, Supplementary Information Table 13). The NFATC2IP locus contains the gene encoding SH2B1 which is known to be involved in energy and glucose homeostasis and has previously been linked with obesity, including through genome-wide association studies.12,13
Figure 2.
Genetic association studies to investigate the potential relationships between BMI and DNA methylation in blood. 2A. Causal analysis shows results for a causality analysis investigating whether DNA methylation in blood at the sentinel CpG sites influences BMI. Units are change in BMI per copy of effect allele. For each sentinel CpG site we identified the cis-SNP (1Mb) most closely associated with DNA methylation levels. For each SNP we then determined i. the effect of SNP on BMI predicted via methylation (x-axis), ii. the directly observed effect of SNP on BMI (y-axis). Grey points represent CpGs not significantly associated with a SNP; blue points represent CpGs significantly associated with a SNP. For a single CpG (NFATC2IP) the associated SNP is also associated with BMI and 95% confidence interval error bars are shown. At the other loci there was little relationship between the effects of the SNPs on BMI predicted via methylation and that directly observed (R2=0.00, P=0.86). 2B. Consequential analysis shows results for a causality analysis investigating whether DNA methylation in blood at the sentinel CpG sites is the consequence of BMI. Units are change in methylation per unit change in weighted genetic risk score (GRS). We identified the SNPs reported to influence BMI in GWAS meta-analysis,12 and calculated a weighted GRS (see Online Methods). For each sentinel CpG site we then determined i. the effect of GRS on methylation predicted via BMI (x-axis) and ii. the directly observed effect of GRS on CpG (y-axis). Three CpGs (ABCG1, KLHL18, FTH1P20) are associated with the GRS at P<2.7x10⁻⁴ (P<0.05 after Bonferroni correction for 187 tests; 95% confidence interval error-bars shown). The overall correlation between observed and predicted effects (R2=0.81; P=4.7 x 10-44) suggests that methylation in blood at the majority of CpG-sites is consequential to BMI.
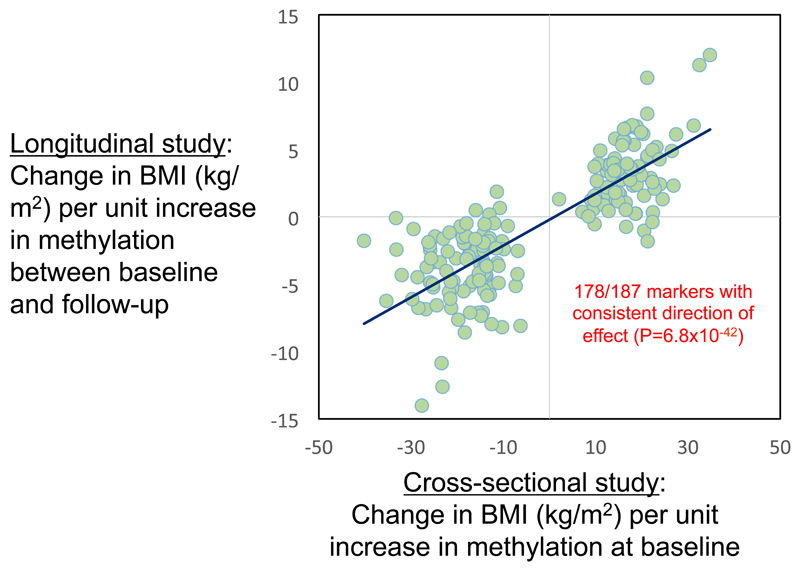
To investigate whether DNA methylation in blood is the consequence of adiposity, we used a weighted genetic risk score (GRS) that combines effects across SNPs known to influence BMI (Figure 2B and Supplementary Information Table 14). We observe a strong correlation between predicted (through BMI) and observed effects of BMI GRS on methylation (R2=0.65; P=4.7x10-44) at the CpG sites evaluated. In particular, GRS is associated with DNA methylation at the ABCG1, KLHL18, FTH1P20 loci at P<2.7x10⁻⁴ (corresponding to P<0.05 after Bonferroni correction for 187 tests). An effect of BMI on ABCG1 methylation is consistent with observations that weight loss influences both ABCG1 expression in adipose tissue and ABCG1 activity,14,15 and by the close relationship between change in BMI and change in methylation during longitudinal follow-up of participants in our population studies (Supplementary Information Table 13). Although further studies are needed to consider mechanisms, our findings suggest that adiposity determines the alterations in methylation at the majority of the identified CpG sites.
We separately used genetic association to test the causal relationships between BMI and DNA methylation in adipose tissue. Results further confirm that in adipose tissue, as in blood, the differences in methylation observed are primarily the consequence of adiposity (R=0.73, P=1.6×10⁻³²; Extended Data Figure 7).
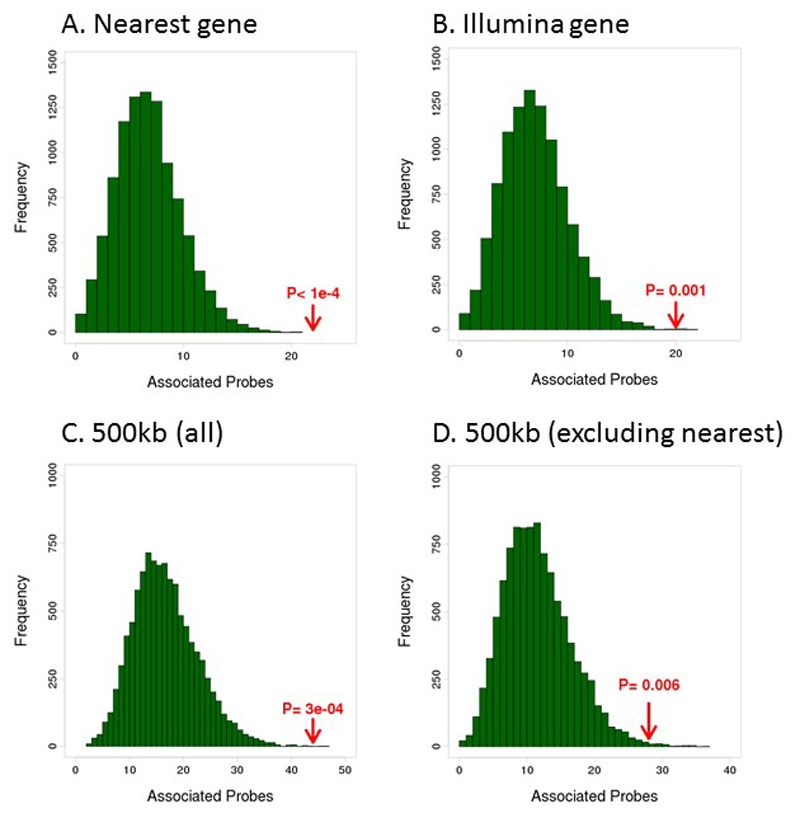
We carried out functional genomic analyses to explore the potential mechanisms linking the 187 sentinel CpGs sites with adiposity. The CpG sites are strongly enriched in active chromatin sites, including at DNase hypersensitivity sites and the activating histone marks H3K4me1 and H3K27ac in a wide range of cell lines (P<0.05, Supplementary Information Figure 7) suggesting that the adiposity-related methylation changes we identify occur at constitutive cis-regulatory regions that operate across tissues. In keeping with a regulatory role, DNA methylation at the 187 identified CpG sites is enriched for association with expression of cis-genes (500kb) in blood (Supplementary Information Tables 15 and 16, Extended Data Figure 8). We find 44 transcripts of 38 annotated genes that are associated with DNA methylation at P<9.0x10⁻⁶ (ie P<0.05 after Bonferroni correction, Supplementary Information Table 16); a ~3-fold enrichment compared to expectations under the null hypothesis (P=3.0x10⁻⁴, Extended Data Figure 8). In sensitivity analyses, limiting assessment of the relationship between methylation and gene expression to nearest gene, or to Illumina annotated gene, identifies five additional loci potentially associated with gene expression (Supplementary Information Table 17). The strongest cis-signals observed are for cg09315878 with TNFRSF4 transcription (P=7.2x10-86), cg14476101 with PHGDH transcription (P=1.0x10-64) and cg09152259 with MAP3K2 transcription (P=1.6x10-67). On average a 5% absolute change in methylation was associated with a 7% change in gene expression across the 44 transcripts identified (range 1.8% for AKAP to 19% for SPNS3, Supplementary Information Table 16). Amongst the 38 methylation-gene expression associations observed in blood, 3 replicated in adipose tissue (HOXA5, BBS2, SELM) and 3 in liver (ANXA1, LGALS3BP, PHGDH) at P<1.3x10⁻³ (ie P<0.05 after Bonferroni correction for 38 tests), all with consistent direction of effect (Supplementary Information Table 18), suggesting that the relationships between methylation and gene expression are in part shared between blood, adipose and liver tissue.
We prioritised genes as potential candidate genes involved in the association between BMI and DNA methylation at the 187 loci based on two criteria: i. Proximity: gene nearest to the sentinel methylation marker, and ii. Functional genomics: genes within 500kb of the sentinel methylation marker showing association of gene expression with methylation (Supplementary Information Table 19). These criteria identified 210 unique genes, many with established roles in adipose tissue biology and insulin resistance (eg ABGG1, LPIN1, HOXA5, LMNA, CPT1A, SOCS3, SREBF1, PHGDH, Supplementary Information Tables 19 and 20). Gene-set enrichment analyses show that the 210 candidate genes are enriched for genes involved in lipid and lipoprotein metabolism, amino acid and small molecule transport, and inflammatory pathways involving NFKB, MAPK, TAK1, IRAK2 and TRAF6 (Supplementary Information Table 21).
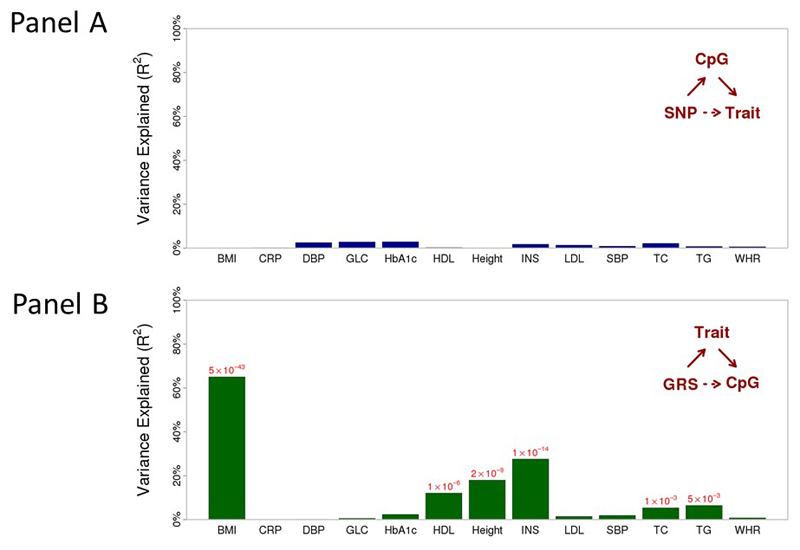
To investigate the potential clinical significance of the DNA methylation changes, we first tested the cross-sectional relationship of DNA methylation in blood with fasting glucose, insulin, HDL cholesterol, triglycerides, HbA1c and other clinical traits. We find that 879 methylation-clinical trait pairs tested are significant at P<2.1x10⁻⁵ (ie P<0.05 after Bonferroni correction for the 2,431 tests performed, Supplementary Information Figure 8, Supplementary Information Table 22), consistent with recent studies reporting close relationships of DNA methylation with blood lipids and glucose traits.16,17 We again used genetic association to investigate the potential causal relationships between DNA methylation and the identified clinical traits. SNPs influencing methylation markers in blood showed little evidence for association with the respective clinical traits (Extended Data Figure 9). In contrast, the predicted effect of GRS on DNA methylation via clinical trait is correlated with the directly observed effect of GRS on methylation for HbA1c, HDL cholesterol, triglycerides and insulin (P=1x10⁻³ to P=2x10-14, Extended Data Figure 9). Our findings suggest that the methylation changes in blood may in part be a consequence of the changes in lipid and glucose metabolism associated with BMI.
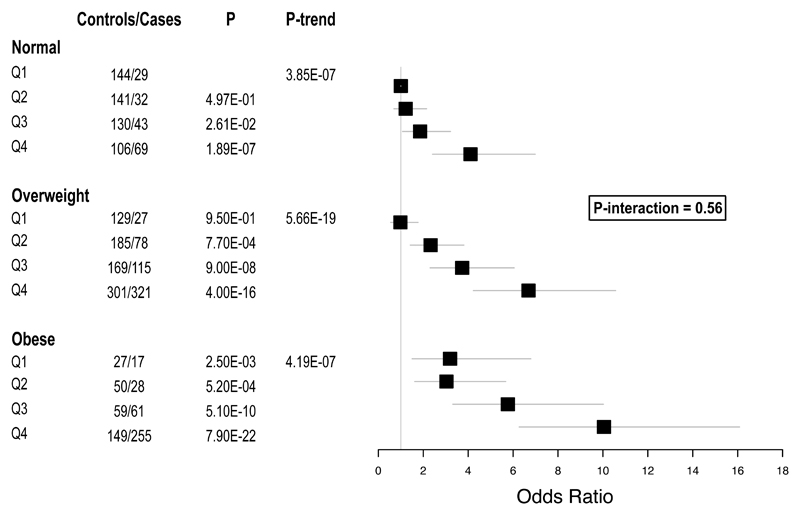
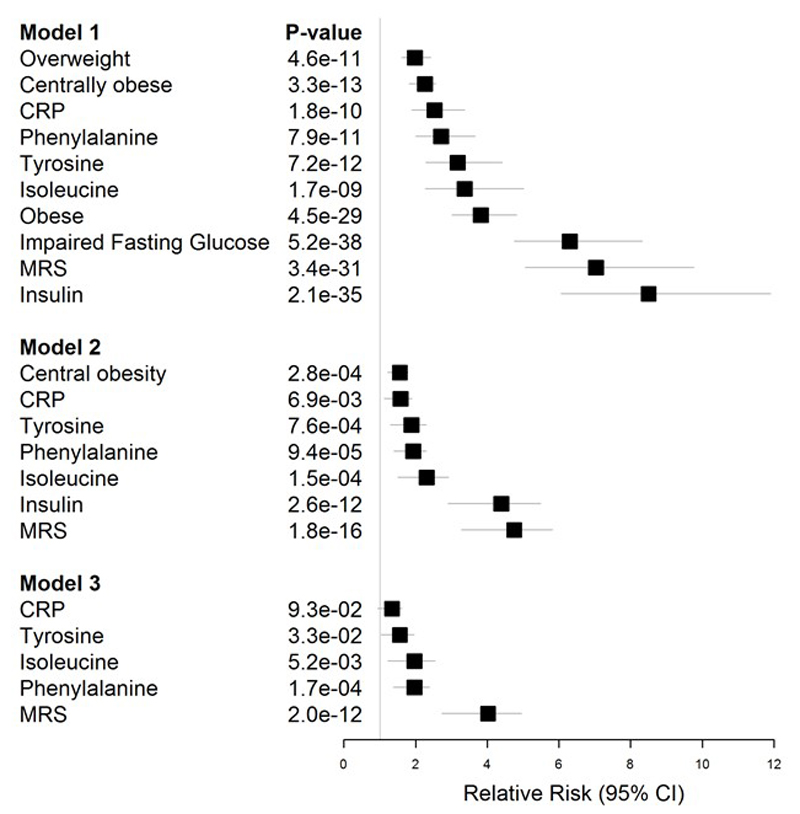
Finally we tested whether DNA methylation levels in blood at the 187 sentinel CpG sites predict new onset, incident T2D, a major clinical consequence associated with obesity, amongst participants of the LOLIPOP study (N=2,664). In single marker tests, 62 of the 187 methylation markers are associated with incident T2D at P<2.7x10⁻⁴ (ie P<0.05 after Bonferroni correction, Supplementary Information Table 23). The strongest association was observed for the ABCG1 locus, a gene known to be involved in insulin secretion and pancreatic β-cell function.14,15 To integrate information across CpG sites, we calculated a weighted Methylation Risk Score (MRS) as the sum of methylation values at each of the markers associated with T2D, weighted by marker-specific effect size. MRS is strongly predictive of incident T2D (relative risk 2.29 [95% CI 2.06-2.55] per 1SD change in MRS; P=4.2x10-52). The association of MRS with incident T2D replicates in Europeans from the KORA study (relative risk 2.51 [95% CI 1.49-4.23] per 1SD change in MRS; P=5.7x10⁻⁴), with no evidence for heterogeneity of effect (P=0.74). MRS predicts T2D beyond traditional risk factors including BMI and waist-hip ratio (Supplementary Information Table 24), and in particular identifies obese and overweight individuals at high risk of future T2D (relative risk for T2D in obese subjects: 7.3 [4.1-12.9], P=8.2x10⁻¹² in the top vs the lowest quartile, Figure 4). This risk of T2D associated with DNA methylation markers as we have estimated in our study is numerically similar to, or greater than, the estimated risk conferred by traditional risk factors including overweight, obesity, central obesity, impaired fasting glucose and hyperinsulinaemia (Extended Data Figure 10). Furthermore, DNA methylation remains strongly and independently associated with risk of future T2D even after adjustment for adiposity and glycaemic measures. In contrast, emergent risk factors such as CRP and amino acid concentrations have little evidence for an independent association with T2D. Our findings therefore raise the possibility that DNA methylation markers may help identify individuals with metabolically unfavourable adiposity who are at increased risk of future T2D.
Figure 4.
Relative risk of incident T2D by quartile of Methylation Risk Score amongst normoglycaemic Indian Asians (HbA1c<6% and fasting glucose<6mmol/l) with normal weight (BMI 18.5-24.9kg/m2), overweight (BMI 25.0-29.9kg/m2) and obese (BMI ≥30.0kg/m2). The P value is for the interaction between adiposity and DNA methylation on risk of T2D.
Our large-scale epigenome-wide association study identifies and replicates changes in DNA methylation associated with BMI in blood and adipose tissue. The associations of methylation with BMI are independent of variation in cell subset composition and replicate in both isolated white blood cells and isolated adipocytes. Genetic association in both blood and adipose tissue supports the view that the changes in DNA methylation are a consequence and not the cause of adiposity, at the majority of the identified CpG sites. The presence of epigenetic heterogeneity at the identified loci, even within isolated canonical cell subsets, together with a graded relationship between methylation and BMI, suggest epigenetic reprogramming within committed cell subsets in response to adiposity, as recently described in other tissues.18 In keeping with this the methylation loci are enriched for sites of open chromatin in multiple tissues, consistent with the presence of constitutive cis-enhancers.
The candidate genes at these loci include genes with annotated roles in lipid metabolism, amino acid and small molecule transport, inflammation, as well as metabolic, cardiovascular, respiratory and neoplastic disease. For example, TNFRSF4 and MAP3K2 encode proteins involved in activation of NF-KB,19 while IL5RA is involved in development and activation of eosinophil and other immune cells, and is causally linked to asthma, eczema and cardiovascular disease.20 ABCG1 is involved in cholesterol and phospholipid transport, and regulates insulin secretion.17,21 Our observations thus provide insight into the regulatory pathways that may link adiposity to metabolic and cardiovascular disease, asthma and a wide range of cancers, although our study is limited in the tissues examined, and further studies are needed to include additional biologically relevant tissues. Our prospective population studies show that DNA methylation identifies people at high risk of incident T2D, independent of conventional risk factors. Further studies are needed to examine whether DNA methylation markers may be useful in distinguishing metabolically unhealthy obesity. This may prove useful in risk stratification and personalized medicine, to help tackle the current global epidemic of obesity and its associated cardiovascular and metabolic disturbances.
Online Methods
Population samples
Details of the population samples for discovery and replication are provided in the Supplementary Information.
Quantification of DNA methylation
Quantification of DNA methylation
DNA methylation was quantified in bisulfite converted genomic DNA from whole blood, using the Illumina Infinium HumanMethylation450 array in all samples. Cohort specific methods are summarised in Supplementary Information Table 2. DNA methylation was quantified on a scale of 0-1, where 1 represents 100% methylation. Preprocessing and quality control criteria are summarised in Supplementary Information Table 2.
The association of DNA methylation with body mass index (BMI, a measure of adiposity) was tested in each cohort separately by linear regression using an established analytic strategy to reduce batch and other technical confounding effects in quantification of DNA methylation, and to take account of the potential confounding effects arising from cryptic alterations in the white cell composition of blood. Briefly, in the LOLIPOP and KORA studies, raw signal intensities were retrieved using the function readIDAT of the R package minfi, version 1.6.0, from the Bioconductor open source software (http://www.bioconductor.org/), followed by background correction with the function bgcorrect.illumina from the same R package. Detection P values were derived using the function detectionP as the probability of the total signal (methylation + unmethylated) being detected above the background signal level, as estimated from negative control probes. Signals with detection P values ≥ 0.01 were removed. Similarly, signals summarized from less than three functional beads on the chip were removed. Observations with less than 95% CpG sites providing a signal were subsequently excluded from the data set. To reduce non-biological variability between observations, data were quantile normalized with the function normalizeQuantiles of the R package limma, version 2.12.0, from Bioconductor, separately in six probe categories based on probe type and colour channel. If not stated otherwise, this preprocessing pipeline was used for all data used in downstream analyses.
In order to account for technical effects during the experiment, we performed principal component analysis (PCA) on the signal intensities for the 235 positive control probes on the 450k array, which assess multiple steps in the laboratory processing. The resulting principal components (PCs) are thought to capture technical variability in the experiment and the first 20 control probe PCs were included as covariates in the model to remove technical biases.
To estimate proportions of white blood cell types, we used the method by Houseman et al.22 They provide 500 CpG sites showing the most pronounced cell type specific methylation levels in an experiment based on purified cells. Of these, 473 CpGs were available on the 450k array. Following the proposed procedure and using the R code provided with the manuscript (R function projectWBC), we used these 473 CpG sites to infer white blood cell proportions (i.e., proportion of granulocytes, monocytes, B cells, CD4+ T cells, CD8+ T cells and natural killer cells) in our samples. These proportions were subsequently used as covariates in the model to avoid cell type confounding.
Epigenome-wide association
We performed single marker tests separately in each cohort using linear regression to examine the association of each autosomal CpG site with BMI; association results are presented, as the change in BMI per unit change in methylation (0-1 scale, corresponding to 0-100% change in methylation). We adjusted for age, gender, smoking status, physical activity index and alcohol consumption, as well as for the first 20 control probe PCs and for the estimated white blood cell proportions; this set of covariates is henceforth referred to as “discovery covariates”. We corrected the association results for the genomic control inflation factor (GCin), in order to account for population stratification and other forms of cryptic structure in the data, which can for instance arise from unobserved confounding. Markers on the sex chromosomes were tested similarly for association with BMI, but separately in men and women. Results were combined across cohorts by inverse variance meta-analysis using METAL version 2011-03-25 (http://www.sph.umich.edu/csg/abecasis/Metal/). The resulting P values where then corrected for in a second round of genomic control (GCout). There were 466,186 autosomal markers for analysis after quality control. We set the threshold for epigenome-wide significance as P<1x10⁻⁷, to provide a conservative Bonferroni correction for the number of markers tested.23 As additional analyses we also investigated the relationship between BMI and DNA methylation amongst the 11,233 X-chromosomal and 417 Y-chromosomal CpG sites assayed. Our sample size (N=5,387 individuals) provides 80% power to identify a change of 8.4kg/m2 in BMI per unit increase in methylation (ie 0-1, where 1 is 100% methylation) at P<1.0x10⁻⁷.
To assess the stability of discovery results towards the analytic choices made, we performed sensitivity analyses to determine the impact of control probe PCs, methylation PCs, and genetic PCs as covariates. Specifically, we compared results from the discovery meta-analysis when the first 10, 20, 30 and 40 control probe PCs were included as covariates, 10 or 20 PCs derived from a PCA on the matrix of methylation β-values, 10 or 20 PCs derived from a PCA on the matrix of methylation values adjusted for the discovery covariates and BMI, or 5 PCs derived from a PCA on SNP data were included as covariates. PCA of the methylation data was performed separately for each cohort based on quantile normalised beta-values of autosomal probes without missing data. Genetic PCs (SNP PCs) were generated separately for each cohort and genotyping platform (Supplementary Information Table 25). The correlation between SNP PCs and methylation PCs was assessed using linear regression (Supplementary Information Figure 9). Discovery results are very stable towards the considered variations in covariates, with correlations of effect sizes between the models varying between 0.99 and 1.0 (Supplementary Information Figures 3 and 10). In addition, SNPs in the probe sequences did not materially affect the observed associations (Supplementary Figure 4, Supplementary Information Table 5).
Replication testing
Markers associated with BMI at P<1x10⁻⁷ in the discovery experiment as within ±500 kb of each other were considered as a single genetic region. At each locus we identified the CpG sites with lowest P value for association with BMI (sentinel marker). Our choice of 1Mb to define a genetic locus was made to take account of long-range enhancers.
At each locus we identified the sentinel marker (CpG site with lowest P value for association with BMI), and carried out replication testing in separate samples of whole blood from European and Indian Asian men and women in population-based studies (N=4,874, Supplementary Table 1). The 207 sentinel CpG sites were assayed using the Illumina 40K methylation array; cohort-specific details of analysis pipelines are described in Supplementary Information Table 2. Results were combined across discovery and replication by weighted z meta-analysis. Epigenome-wide significance was set at P<1x10⁻⁷ providing Bonferroni correction for the 466,186 autosomal markers tested. Our choice of threshold is supported by the results of permutation testing.23. Twenty of the 207 markers did not reach P<0.05 in replication testing. However, all 20 showed consistent direction of effect between discovery and replication stages (P=1.9x10⁻⁶, binomial test, Supplementary Table 3), suggesting that the majority are unlikely to be false positive associations.
To assess whether the 187 identified sentinel CpGs were enriched for intermediately methylated CpGs (sites with 20-80% average methylation), we randomly generated 100,000 sets of 187 CpGs and determined the number of intermediately methylated CpGs for each of them in order to derive an expected distribution under the null hypothesis of no enrichment. We then compared the observed number of intermediately methylated CpGs for the 187 sentinel CpGs against the null distribution to calculate an empirical P value.
An exact binomial test (R function binom.test) was used to test whether consist direction of effect between discovery and replication was observed more often than expected by chance amongst the 20 non-replicating CpG sites.
Replication by pyrosequencing
As a technical validation we used pyrosequencing to carry out replication testing of the relationship between DNA methylation and BMI at 4 loci, using samples of whole blood from 990 Europeans and 1,720 Indian Asians participating in the LOLIPOP study. Pyrosequencing was carried out using biotinylated primers to amplify bisulfite-treated DNA (Supplementary Information Table 26). The biotinylated PCR products were then immobilized on streptavidin-coated Sepharose beads (GE Healthcare, Orsay, France). Pyrosequencing was performed with the PyroMark Q96 MGMT kit (Qiagen, Courtaboeuf, France) on a PSQTM96 MA system (Biotage, Uppsala, Sweden).
Isolated white blood cell studies
Samples
30 obese (BMI>35kg/m2) and 30 normal weight (BMI<25kg/m2) individuals were recruited at random from the outpatient departments at Ealing and University College Hospitals London. All participants gave written informed consent for inclusion in the study (Research ethics committee references: 07/H0712/150, 13/LO/0477, and ID#09/H0715/65). Obese cases and normal weight controls were matched by age (within 5 yrs), sex, and ethnicity.
Fluorescence activated cell sorting (FACS)
For each participant, we collected 12mls whole blood (EDTA). Samples were processed immediately to isolate white blood cell subsets (monocytes, neutrophils, CD4 and CD8 lymphocytes) through: i. red blood cell lysis (manufacture instructions, BioLegend); ii. staining of unlysed white blood cell subsets (>20mins in 50mcl Ca++ free PBS with 5mM EDTA and 1% Human Albumin; 1mcl anti-CD14 PE-Cy7 (Clone-M5E2, BD), anti-CD16 BV510 (Clone-3G8, BioLegend), anti-CD45 BV605 (Clone-HI30, BioLegend), anti-CD8 APC (Clone-SK1, BioLegend); 2mcl anti-CD3 PE (Clone-Leu-4, BD), anti-CD4 FITC (Clone-RPA-T4, BioLegend); iii. filtering of stained samples to remove clumped cells (30micron mesh, Miltenyi Biotec); and iv. staining of dead cells (1mcl Sytox Blue, Life Technologies).24,25
Lysed, stained samples were sorted on a FACSAria II SORP cell sorter at flow rate 6,000–9,000 events/second. Data was collected with FACSDiva 8 and analysed with FlowJo V10. Fluorescence minus one negative controls were used to determine positive/negative boundaries for each gate in the experimental set up.{Perfetto, 2004 #248} Daily Cytometer Set-up and Tracking quality control beads were run to ensure alignment and parameterisation of the FACS (Anti-Mouse Ig κ/Negative Control, BSA; Compensation Plus Particles, BD). Sytox Blue (450/50V nm) negative events were considered to be live cells. FCS-A and SSC-A were then used to separate granulocytes from monocyte and lymphocyte populations. Neutrophils (CD14-, CD16+) were separated from other granulocytes. Monocytes were then separated from lymphocytes in a two stage process as CD14+, CD45+ and CD16- cells. Finally, CD4+ and CD8+ cells were separated from other lymphocytes based on the following staining patterns: i. CD4+ cells: CD3+, CD4+, CD8-, CD14- and CD45+; ii. CD8+ cells: CD3+, CD4-, CD8+, CD14- and CD45+. Sorted cell subsets were assessed for purity, then pelleted and snap frozen for storage at -80C. Average purities were: neutrophils 98.3% (SD 1.2); monocytes 99.2% (SD 0.7); CD4+ lymphocytes 99.6% (SD 0.4); CD8+ lymphocytes 97.9% (SD 2.0).
Genomic DNA was isolated (Qiagen QIAshredder; Allprep DNA/RNA Micro) according to manufacture instructions. Isolated genomic DNA was quantified (Qubit double-stranded DNA broad range assay) then stored at -80C for genome-wide DNA methylation assays.
Quantification of DNA methylation and data processing
Genomic DNA (0.2-1.0mcg) underwent bisulphite conversion using EZ DNA Methylation-Direct Kit (Zymo Research, Irvine, CA). In brief, DNA samples underwent bisulphite conversion by incubation with the CT Conversion Reagent for 8 mins at 98°C, 3.5 h at 64°C, followed by 18 h at 4°C in a thermocycler. The treated DNA was added to a Zymo-Spin IC Column, desulfonated using M-Desulphonation Buffer, and then eluted from the column in 12µl of M-Elution Buffer.
Methylation analysis of the bisulphite-treated DNA was performed using Illumina Infinium MethylationEPIC Beadchip (Illumina, San Diego, CA) according to standard protocol. In brief, 4µl of bisulfite-treated DNA was denatured, neutralized and subjected to an overnight whole-genome amplification reaction. The amplified DNA was then enzymatically fragmented, precipitated and resuspended in hybridization buffer before being dispensed onto the MethylationEPIC beadchips for hybridization. After hybridization, the beadchips were processed through a primer-extension protocol and subsequently stained. Finally, the beadchips were coated and imaged using the HiScan System (Illumina).
All samples passed Quality Control and PCA showed clear separation of cell-types. Methylation-values for 179 (of 187) sentinel CpGs were retrieved, as described above for epigenome-wide association in blood, and the difference in DNA methylation between obese cases and normal weight controls tested using linear regression, adjusted for age, gender and ethnicity.
Genetic association studies
We used genetic association and the concept of Mendelian randomisation to investigate for potential causal relationships between DNA methylation and adiposity.{Relton, 2012 #24} Briefly, Mendelian Randomisation goes back to the more general instrumental variable concept. As an instrumental variable, it uses a genetic variant (or a combination of genetic variants) Z associated with a variable X in order to show causal relation between X and another variable Y. It relies on the fact that the alleles of a genetic variant are inherited randomly from parents to offspring, so that the relation of a genetic variant with a phenotype should not be confounded (with exceptions including population stratification). Thus, if the effect of X on Y is causal and the study has enough power, Z should also associate with Y. Specifically, the predicted association of Z with Y can be calculated as follows, assuming linear relationships and assuming that Z is unrelated to Y given X and unrelated to any unobserved confounders U:
-
(1)
X = α1 + β1Z + γ1U, where γ1U plays the role of the error term that is per assumption unrelated to Z
-
(2)
Y = α2 + β2X + γ2U = α2 + β2(α1 + β1Z + γ1U) + γ2U = α2 + β2α1 + β2β1Z + (β2γ1 + γ2)U = α3 + β3Z + γ3U
-
➔
Predicted effect of Z on Y: β3 = β2β1
Unbiased estimation and formal inference on the causal effect β1 of X on Y (where X and Y represent a CpG-phenotype-pair) heavily relies on strong genetic effects and typically requires tens of thousands of samples for adequate power.26 Since these sample sizes are currently not available for epigenomic datasets we instead explored consistency of the predicted effect of Z on Y versus the actually observed effect, thereby obtaining some indication on the plausibility of a causal effect of X on Y. This was done in two directions, studying causality of the effect of DNA methylation (X) on BMI (Y) and of BMI (X) on DNA methylation (Y).
DNA methylation as determinant of BMI (causal analysis)
To address the question of DNA methylation being a determinant of BMI (whereby X=DNA methylation, Y=BMI) we used data on genetic variants from 4,034 participants of the KORA and LOLIPOP studies (Supplementary Information Table 25) to identify cis (1Mb) SNPs (Z) influencing methylation in blood at the 187 sentinel CpG sites. The associations between SNPs and methylation were tested in each data set separately using linear models with methylation as response and SNP as independent variable, adjusting for the discovery covariates, and then combined by inverse variance meta-analysis using METAL, version 2011-03-25. Our sample size (Nmax=4,034 individuals) provides 80% power to identify a change in methylation of 0.5% (in absolute terms) per allele copy at P<5.0x10⁻⁸. (ie genome-wide significance). Results for all 173,367 pairs reaching P<5x10⁻⁸ (conventional genome-wide significance) are provided in Supplementary Information Table 27. We excluded three CpGs that shared no cis-SNPs across all data sets, and a further 9 CpGs because they had SNPs within their probe-binding sequence. For the remaining 175 CpG sites, the single SNP with the lowest P value for association with methylation was chosen as an instrumental variable (Supplementary Information Table 28). As mentioned above, to be an appropriate instrument, a SNP must not be directly associated with BMI (Y) but only through the respective CpG (X). For this purpose we removed six CpG-SNP pairs from the analysis because the corresponding SNPs remained associated with BMI after adjustment for the sentinel CpG (cg07136133, cg08548559, cg09152259, cg12484113, cg18120259, cg26403843). Statistical significance was inferred at P<2.9x10⁻⁴ (corresponding to P<0.05 after Bonferroni correction for 175 tests).
To enable comparison with the observed effect of SNPs on BMI obtained from published data, we eassessed the relationship between DNA methylation and adiposity in linear models, using an inverse-normal transformation of BMI as the outcome variable to be consistent with the GIANT GWAS.12 The associations between DNA methylation and inverse-normal transformed BMI were quantified in LOLIPOP and KORA cohorts separately, followed by inverse variance meta-analysis using METAL, version 2011-03-25. We then calculated the predicted effect sizes and standard errors (βpred and SEpred) as follows:
The predicted effect sizes were compared against the observed effects of SNPs on BMI, whereby the latter were obtained from large published GWAS to increase power.12 Statistical significance for individual SNPs was again inferred at P<2.9x10⁻⁴. We used correlation analysis to examine the global relationship between predicted and observed effect on BMI for the SNPs influencing DNA methylation across the sentinel CpG sites.
DNA methylation as consequence of BMI (consequential analysis)
To test the hypothesis of DNA methylation being a consequence of BMI (whereby X=BMI, Y=DNA methylation), we followed a similar procedure as described above for the opposite direction with minor differences.
First, instead of using a single SNP as instrumental variable, we calculated a weighted genetic risk score (GRS) comprising SNPs reported to influence BMI.12 Again, for the GRS to provide a valid instrument, the included SNPs must not show direct association with the CpG (Y) but only through BMI (X). For this purpose we removed three SNPs (rs12444979, rs10968576, rs7359397) which remained significantly associated at P<8.4x10⁻⁶ (corresponding to P<0.05 after Bonferroni correction for the 187 x 32 tests performed) with at least one of the sentinel CpGs after adjusting for BMI. The final GRS was calculated as the sum of risk allele dosage of the remaining 29 SNPs previously reported to associate with BMI, weighted by the reported effect sizes.12
Second, the observed effects of GRS on DNA methylation were quantified using linear models as described above adjusted for the discovery covariates amongst participants of the KORA and LOLIPOP studies. Regression analysis was carried out in the KORA and LOLIPOP cohorts separately and results combined by inverse variance meta-analysis using METAL, version 2011-03-25.
DNA methylation in blood and adiposity in prospective population studies
We used data from the KORA (N=1,435 Europeans) and LOLIPOP (N=1513 Indian Asians) to examine the prospective, longitudinal association between DNA methylation at baseline and subsequent change in BMI during follow-up. We carried out linear regression with change in BMI during follow-up as response variable, and technically adjusted baseline methylation as the predictor variable, with age, sex, physical activity, smoking, alcohol intake, estimated white blood cell proportions and BMI at baseline, as well as follow-up time as additional covariates. Data were analysed in KORA and LOLIPOP separately, followed by inverse variance meta-analysis using METAL, version 2011-03-25.
We studied the longitudinal relationship between change in BMI and change in DNA methylation amongst 1,435 participants of the KORA S4/F4 cohort with methylation data available both at baseline and at the 7-year follow-up timepoint. To ensure comparability of methylation measurements from the two time points measured in two batches, methylation β-values were jointly adjusted for the first 20 PCs obtained from a PCA on the positive control probes, and residuals were subsequently used as adjusted methylation values. Linear models were used with change in BMI during follow-up as response variable, and change in technically adjusted methylation as independent variable, including age, sex, physical activity, smoking, alcohol intake and estimated white blood cell proportions both at baseline and followup.
Adiposity and DNA methylation in other tissues
DNA methylation in adipose tissue
We investigated whether the observed methylation markers in blood are representative of BMI-associated methylation changes in adipose tissue. We used a data set of 542 adipose tissue samples from the TwinsUK study to test association of the 187 identified methylation markers with BMI. The association of BMI with methylation was quantified using a linear mixed-effects model adjusting for chip, for bisulfite conversion level and bisulfite conversion efficiency, smoking state (3 categories: current, former and never smokers), alcohol intake (in g/d) and age, with zygosity and family as random effects.
We carried out sensitivity analyses to assess the potential contribution of cryptic structure arising from differences in cell composition of the adipose tissue samples. In the absence of validated approaches for imputation and adjustment for adipose tissue cell subset composition, and the potential limitations of published reference-free approaches for separation of true and confounded signal,23 we used PCA to quantify latent structure in the adipose tissue methylation data, and included the top 5 components as covariates in the regression model.
We separately compared DNA methylation between paired samples of blood and subcutaneous adipose tissue (available for the same N=201 individuals, TwinsUK). Blood methylation values were first adjusted for age, chip and chip position, smoking state, alcohol intake, and estimated white blood cell subsets by taking the residuals from a linear model with these as covariates. Similarly, adipose tissue methylation values were adjusted for age, chip, bisulfite conversion level, bisulfite conversion efficiency, smoking state, alcohol intake, and the top 5 PCs from the adipose methylation data. Pearson’s correlation was then determined between the adjusted methylation values.
Finally, we used genetic association to carry out causality analyses on the association between BMI and DNA methylation in adipose tissue, as described above for blood. We studied a subset of 325 adipose tissue samples from the Twins UK cohort with genotype data available. Regression analyses in adipose tissue between BMI, SNPs/GRS and CpGs were carried out using the R package lme4, and with smoking, alcohol intake, age, zygosity (random effect), family (random-effect), beadchip, bisulphite conversion batch and bisulphite conversion efficiency as covariates.
DNA methylation in isolated adipocytes
Subcutaneous adipose tissue samples were obtained intraoperatively in 24 morbidly obese individuals (BMI >40kg/m2) undergoing laparoscopic bariatric surgery and 24 healthy controls (BMI <30kg/m2) undergoing non-bariatric laparoscopic abdominal surgery. Participants were unrelated, between 18-60 years of age, from a multi-ethnic background, and free from type-2 diabetes. Controls were matched to cases by age, sex, and ethnicity. All participants gave informed consent (Ethics committee reference 13/LO/0477).
Adipose samples were processed immediately to isolate populations of primary human adipocyte cells using established protocols.27 Polypropylene plastic ware was used to minimise adipocyte cell lysis. Adipose tissue samples were minced into 1-2mm3 pieces and washed in Hank’s buffered salt solution (HBSS), before digestion using type 1 collagenase (1mg/ml, Worthington) in a water bath at 37C shaking at 100rpm for ~45min. Digested samples were filtered through a 300 micron nylon mesh to remove debris, and the filtered solution centrifuged at low speed (500-g; 5min; 4 degrees), to leave four layers: top to bottom – (1) oil, (2) mature adipocytes, (3) supernatant, and (4) stromovascular pellet. After removal of the oil layer, the mature adipocyte layer was collected by pipette, washed in ~5x volume of HBSS and recentrifuged. After 3 washes the adipocyte cell suspension was collected for snap freezing and storage at -80C.
Genomic DNA and RNA were extracted from the isolated adipocytes using the Qiagen AllPrep DNA/RNA/miRNA Universal Kit according to manufacturer’s protocol for lipid-rich samples. Methylation of genomic DNA was quantified using the Illumina HumanMethylation450 array in a single batch according to manufacturer’s specifications. Raw methylation data were preprocessed using R, version 2.15. Bead intensity was retrieved using the R package minfi, version 1.6.0. Marker intensities were quantile normalised for analysis. PCA of control probe intensities was performed to quantify cryptic structure in the data arising from technical factors. Logistic regression was used to examine the association of each CpG site with morbid obesity compared to normal weight, adjusting for age, sex and ethnicity, and the first 5 control probe PCs.
DNA methylation in liver tissue
Liver samples were obtained percutaneously for patients undergoing liver biopsy for suspected NAFLD or intraoperatively for assessment of liver histology. Normal control samples were recruited from samples obtained for exclusion of liver malignancy during major oncological surgery. None of the normal control individuals underwent pre-operative chemotherapy and liver histology demonstrated absence of both cirrhosis and malignancy Study design, sampling method and data collection have been described in detail elsewhere.30 For methylation analysis, bisulfite conversion was performed using the Zymo EZ DNA Methylation Kit (Zymo Research, Orange, CA, USA), and hybridization of the Illumina HumanMethylation450 array (Illumina, SanDiego, CA). mRNA expression analysis was performed using the HuGene 1.1 ST gene (Affymetrix, Santa Clara, Ca, USA) according to the manufacturers protocols. Hybridization signals were analyzed using GenomeStudio software (default settings; GenomeStudio ver. 2011.1, Methylation Analysis Module ver. 1.9.0; Illumina Inc) and internal controls for normalization.
Cross-tissue methylation
For extended cross-tissue correlation analyses, publicly available data (GSE48472) were downloaded from the Gene Expression Omnibus (GEO) database.9 Briefly, the dataset consists of 41 samples from six individuals of blood, liver, muscle, pancreas, subcutaneous fat, omentum and spleen analysed on the 450K methylation array. Data from the 187 CpG sites of interest were extracted and plotted using the heatmap.2 function in the R package gplots (version 2.17.0). Mean methylation levels for each CpG site across all samples within each tissue type were used to test for pairwise correlation between tissue types.
Functional genomics
Genomic annotation analyses
To test for functional enrichment of the 187 CpG sites associated with BMI, we used annotations of genomic context provided by Illumina, and of histone modification ChIP peaks (H3K4me1, H3K4me3 and H3K27Ac, marks of open chromatin) and DNaseI Hypersensitivity Sites in 127 different cell types in the Roadmap and ENCODE (Release 9, UCSC) datasets. We mapped each probe on the Illumina 450k array background to the annotation categories and recorded overlap at each probe as a binary variable. To determine whether enrichment occurred more often than expected by chance, we generated 10,000 sets of 187 CpGs, each matched with the BMI sentinel CpGs for methylation mean (±2%) and standard deviation (±0.2%), but otherwise selected at random. For each epigenetic mark, we then calculated the number of overlapping sites amongst the 187 replicating markers (observed) and 10,000 permuted sets of 187 markers (expected). We calculated the fold enrichment as observed/mean(expected) and obtained an empirical P value from the distribution of expected.
Gene expression studies
Transcriptome-wide measurements of gene expression in blood along with measurements of DNA methylation from the same blood sample were available for participants of both the KORA F4 (N=703) and LOLIPOP (N=1,082, 907 Indian Asians, 175 Europeans) studies (Supplementary Information Table 15). KORA samples were analysed with the Illumina HumanHT-12 v3 BeadChip array. Blood sample collection and RNA isolation and preparation have been described in detail.28,29 Gene expression data were quantile normalized and log2 transformed using the R package lumi, version 2.8.0, from Bioconductor in R, version 2.14.2. In LOLIPOP, gene expression analysis was performed with the Illumina HumanHT-12 v4 BeadChip array according to manufacturer's protocol. Background correction (using negative controls), quantile normalisation and log2 transformation was performed using the R-package limma (function neqc).
To examine associations of DNA methylation with gene expression we carried out linear regression with log2 transformed gene expression as the response variable and methylation βvalues as independent variable. In KORA, the model was adjusted for the discovery covariates and technical covariates related to the expression measurement (RNA integrity number, RNA amplification plate, sample storage time). In LOLIPOP, the model was adjusted for age, sex, methylation control probe PCs and technical covariates related to the expression measurement (RNA integrity number, RNA extraction batch, RNA conversion batch, scanning batch, array and array position). Results were analysed in KORA, LOLIPOP Indian Asians and LOLIPOP Europeans separately, then combined by inverse-variance meta-analysis using METAL (version 2011-03.25). Statistical significance was inferred at P<9.0x10⁻⁶ (i.e. P<0.05 after Bonferroni correction for 5,551 CpG-expression pairs).
To assess whether the 187 sentinel CpGs were enriched for association with gene expression, we used the same testing concept as described above based on constructing a null distribution from 10,000 randomly selected matched sets of 187 CpGs. For each permuted set we determined the number of significantly associated expression probes in cis (P<9.0x10⁻⁶) as described above and compare the resulting distribution with the observed number of gene expression associations for the 187 sentinel CpG sites to calculate an empirical P value.
Finally, we examined the association between DNA methylation and gene expression in TwinsUK adipose tissue samples (N=499) for the 44 methylation-expression pairs that were significant in blood. Expression values were adjusted for age and chip using a linear model. The association of methylation and expression was then determined in linear mixed-effects models with adjusted expression as response and methylation as the independent variable, adjusting for age, chip, bisulfite conversion level and bisulfite conversion efficiency, with zygosity and family as random effects. After QC filtering of methylation and expression data, results were available for 36 methylation-expression pairs.
Candidate genes and gene-set enrichment analyses
The standard Illumina annotation does not identify a gene for all CpG sites on the 450K microarray. We therefore identified candidate genes based on the following criteria: i. Proximity: gene nearest to the CpG site (N=187 genes) and ii. Gene expression: all local genes (up to ±500 kb) with expression associated with the marker at P<0.05 after Bonferroni correction for 5,551 tests (N=38 genes). This resulted in a list of 210 unique genes (Supplementary Information Table 19).
Gene annotations were downloaded from ensembl (grch37.ensembl.org) using R package biomaRt, version 2.18.0, from Bioconductor, and overlapped with the cg positions as annotated in the Illumina annotation using the R package GenomicRanges, version 1.14.4, from Bioconductor. We downloaded curated pathway information (c2.all.v5.0.symbols.gmt) from the GSEA MSigDB platform (http://www.broadinstitute.org/gsea/msigdb), resulting in 1,135 pathways, to investigate enrichment of the set of candidate genes against curated pathway sets (BIOCARTA, KEGG, REACTOME). An enrichment P value was calculated empirically based on permutation testing, using the Benjamini-Hochberg (false-discovery-rate) procedure. As a sensitivity analysis the gene-set enrichment analysis was repeated using the genes annotated by Illumina, and using more permissive proximity criteria (Supplementary Information Table 29). Results become less statistically significant when candidate gene selection based on proximity alone was extended to include all genes over distances up to 500kb.
Clinical implications
DNA methylation and metabolic traits
We investigated the association between the 187 sentinel methylation markers and metabolic disturbances associated with adiposity amongst participants of the KORA (N=1,697) and LOLIPOP (N=2,462) studies with available measurements of the following BMI-related clinical traits: LDL cholesterol, HDL cholesterol, total cholesterol, fasting triglycerides, fasting glucose, fasting insulin, HbA1c, systolic and diastolic blood pressure, C-reactive protein, weight, height and waist-hip ratio. Linear models were used with trait as response and methylation as independent variable, adjusting for the discovery covariates. Results from KORA and LOLIPOP studies were analysed separately, then combined by inverse variance meta-analysis using METAL, version 2011-03-25. Associations were considered significant at P<2.1x10⁻⁵ (corresponding to P<0.05 after Bonferroni correction for 187 x 13 tests).
To investigate potential causal relationships between the methylation markers and BMI-related clinical traits, we performed causality analyses as described above for the primary phenotype (BMI). For each clinical trait, GWAS datasets of the most comprehensive meta-analyses published to date with access to genome-wide association results were retrieved (Supplementary Information Table 30), to provide SNPs influencing trait. SNPs associated with multiple traits were assigned to the most strongly associated trait (lowest P value). Clinical traits were transformed as described in the respective GWAS. Genetic risk scores were calculated as described above for BMI, after removal of SNPs with direct genomic effects (SNPs that remain associated with the sentinel CpG after adjustment for the trait). Regression analyses were carried out in the KORA F4 and LOLIPOP cohorts separately and results were combined by inverse variance meta-analysis using METAL, version 2011-03-25.
Association with incident T2D
We tested the association of DNA methylation at the 187 identified CpG sites with incident T2D amongst participants of the LOLIPOP study. All participants (N=2,664) were free from T2D at the time of measurement of DNA methylation; incident T2D (N=1,074) was defined as either new physician diagnosis, or HbA1c≥6.5%. Associations with T2D were evaluated by logistic regression adjusted for the discovery covariates. We initially tested the association in single marker tests, then in a fully saturated model comprising all 187 markers to identify independent effects.
To combine information across loci, we calculated a weighted methylation risk score (MRS) as the sum of the standardised methylation values at each marker that reached nominal significance (P<0.05) in the fully saturated multivariate model, weighted by marker-specific effect size. We then tested the association of the MRS with incident T2D using logistic regression, before and after adjustment for traditional T2D risk factors (BMI, WHR, glucose, HbA1c).
Replication testing of the association of MRS with T2D was carried out in a nested case-control study within the KORA S3/S4 comprising 200 subjects with newly diagnosed T2D and 200 control matched for age (±2 years), sex, cohort and observation time until diagnosis of diabetes. Data were analysed using conditional logistic regression using the function clogit of the R package survival, version 2.37.4.
Software
Unless stated otherwise, all calculations were performed using R, version 3.0.1. For all meta-analyses, METAL, version 2011-03-25, was used. Custom R code for the respective analyses is available at: http://metabolomics.helmholtz-muenchen.de/bmi_methylation/.
Availability of data
Summary statistics from the epigenome-wide association study can be accessed from the European Genome-Phenome Archive (accession number: EGAS00001001922). KORA methylation data are available upon request through the application tool KORA.PASST (http:/epi.helmholtz-muenchen.de); LOLIPOP data are available from the Gene Expression Omnibus (Ref: GSE55763); EPICOR data are deposited in the HuGeF repository (http://www.hugef-torino.org) and are available on request.
Extended Data
Extended Data Figure 1. Study design.
Epigenome-wide association and replication testing was performed in order to identify methylation sites associated with adiposity. In the discovery step, four large cohorts were included with Illumina 450k DNA methylation data available, which were preprocessed and quality controlled according to a harmonized protocol. Epigenome-wide association was performed in every single study with BMI as response variable and methylation β-value as independent variable, adjusting for covariates as described in the Online Methods. At a genome-wide significance level of P<1x10⁻⁷, 278 methylation sites from 207 regions were identified. In the replication step, 187 of these replicated in independent samples. Genetic association and causality analyses were used in order to investigate whether the identified methylation signals underlie the development of adiposity or are the consequence of adiposity. The findings were supported with the help of longitudinal analyses. The cross-tissue analyses represent a first step towards extending our observations in blood to metabolically relevant tissues. The functional genomics and gene expression analyses help to link the observed methylation associations to transcriptional outcomes, while the gene-set enrichment analysis provides a way to summarize the potentially affected metabolic pathways. Finally, we study the relationships of methylation to adiposity related metabolic traits and type 2 diabetes to address the clinical relevance of our findings.
Extended Data Figure 2.
Distribution of methylation values at the 187 sentinel CpG sites compared to the ~473K CpG sites assayed by the Illumina Infinium 450K Human Methylation array. The 187 identified methylation-BMI associations are strongly enriched for CpG sites with intermediate levels of methylation, consistent with the presence of epigenetic heterogeneity at these loci in blood (157/187 sites with 20-80% methylation, a 3.0-fold enrichment compared to microarray background, P=1.4x10⁻²² Fisher’s test).
Extended Data Figure 3.
DNA methylation at the sentinel CpG sites in whole blood and in 4 isolated cell subsets (Monocytes, Neutrophils, CD4+, CD8+) from 60 individuals (30 obese cases, and 30 normal weight controls) by Illumina MethylationEPIC array, which quantifies 179 of the 187 sentinel markers. Results are shown as a heatmap, coded by methylation value (hypomethylation <0.2; intermediate methylation 0.2-0.8, hypermethylation >0.8). Results show the presence of intermediate methylation (and hence epigenetic heterogeneity) at the majority of loci, and in the majority of cell types, in both cases and controls.
Extended Data Figure 4.
Association of DNA methylation with obesity in the 4 cell subsets studied, based on quantification of methylation at 179 of the sentinel methylation markers amongst 30 obese cases and 30 normal weight controls. Results are presented as QQ plots of the observed association test statistics in each of the isolated cell subsets.
Extended Data Figure 5.
Comparison of effect sizes between isolated white cell subsets. Results are presented as the difference in methylation between obese cases and normal weight controls (Methylation in cases – methylation in controls, in absolute terms on % scale) in the respective isolated white cell subset (y axis) compared to the average case-control difference across all 4 cell subsets studied (x axis).
Extended Data Figure 6.
Mean methylation levels at the 187 sentinel methylation markers associated with BMI, across 7 tissue types (blood: N=6; liver: N=5, muscle: N=6, omentum: N=6, pancreas: N=4, subcutaneous (SC) fat: N=6, spleen: N=3). The lower panel displays pairwise scatterplots (trendline in red), while the upper panel shows the Pearson correlation coefficient and P values.
Extended Data Figure 7.
Causality analysis in adipose tissue to investigate the potential relationships between BMI and DNA methylation. Left panel: Causality analysis in adipose tissue investigating whether DNA methylation at sentinel CpG sites influences BMI. Units are change in BMI per copy of effect allele. For each sentinel CpG site we determined i. the effect of a previously identified cis-SNP on BMI predicted via methylation (x-axis), ii. the directly observed effect of SNP on BMI (y-axis). No CpG passed multiple testing correction for all three comparisons. Overall there was little relationship between the effects of SNPs on BMI predicted via methylation and the directly observed effect (R=-0.04 P=0.58). Right panel: Causality analysis in adipose tissue investigating whether DNA methylation at sentinel CpG sites is the consequence of BMI. Units are change in methylation per unit change in weighted genetic risk score (GRS). We identified SNPs reported to influence BMI in GWAS meta-analysis, and calculated a weighted GRS. For each sentinel CpG site we then determined i. the effect of GRS on methylation predicted via BMI (x-axis) and ii. the directly observed effect of GRS on methylation (y-axis). No CpG passed multiple testing correction for all three comparisons. The overall correlation between observed and predicted effects (R=0.73; P=1.6 x 10⁻³²) replicates our findings in blood that methylation at the majority of CpG-sites is consequential to BMI.
Extended Data Figure 8.
The 187 sentinel CpGs are enriched for association with gene-expression in cis in blood. To derive an expectation under the null-hypothesis we generated 10,000 sets of matched CpGs (matched for mean methylation and for SD of methylation, see Online Methods), and tested their association with expression of A) the nearest gene, B) the gene allocated to the CpG by the Illumina annotation, C) all genes within a 500 kb distance and D) all genes within a 500 kb distance excluding the nearest gene. We observe significantly more expression-probes associated with the sentinel markers (red arrow) in blood compared to the 10,000 permuted sets (green bars).
Extended Data Figure 9. Summary statistics for the causality analyses investigating the relationship between DNA methylation in blood and metabolic disturbances.
Panel A. DNA methylation in blood as a potential determinant of the metabolic disturbances associated with adiposity (causal analysis). For each of the sentinel CpG sites we identified the cis-SNP (1Mb) most closely associated with DNA methylation levels. For each of the SNPs we then determined i. the effect of SNP on phenotype predicted via methylation, ii. the directly observed effect of SNP on phenotype. Results are presented as the R2 between phenotype specific observed and predicted effects across the 187 CpG sites, calculated using linear regression.
Panel B. DNA methylation in blood as a potential consequence of the metabolic disturbances associated with adiposity (consequential analysis). We identified the SNPs reported to influence each phenotypic trait (using the most recent GWAS meta-analysis, Supplementary Table 24), and calculated phenotype specific weighted genetic risk scores (GRS). For each of the CpG sites, and each of the phenotypes, we then determined i. the effect of GRS on methylation predicted via phenotype, with ii. the directly observed effect of GRS on methylation. Results are presented as the R2 between phenotype specific observed and predicted effects across the 187 CpG sites, calculated using linear regression. P values are shown for correlations between observed and predicted effects that reach P<0.05.
Extended Data Figure 10.
Association of established and emergent biomarkers with T2D. Results are presented as risk of T2D associated with the specified biomarkers in three models: i. Model 1 – adjusted for age and sex; ii. Model 2 – as for Model 1, but additionally for body mass index and impaired fasting glucose; iii. Model 3 – as for Model 2, but additionally for central obesity and insulin concentrations. CRP: C-reactive protein; MRS: methylation risk score. Results for quantitative traits (amino acids, CRP, insulin, MRS) are presented as risk of T2D in Q4 compared to Q1.
Supplementary Material
Figure 3.
Relationship between DNA methylation in blood and BMI amongst 1,435 participants of the KORA S4/F4 population cohort. Cross-sectional results (x-axis) are for the relationship between methylation in blood and BMI at each of the 187 sentinel CpG sites in the baseline samples; longitudinal results are for the relationship between change in methylation (in blood) and change in BMI after 7 year follow-up. Units for both axes are kg/m2 change in BMI per unit increase in methylation (scale 0-1, where 1 represents 100% methylation).
Acknowledgments
Detailed acknowledgments are provided in the Supplementary Information.
Footnotes
Author contributions
Data collection and analysis in the contributing population studies
ALSPAC study: TRG, CLR, RCR, GDS; EGCUT study: KF, S Kasela, LM, NP; EPICOR study: GF, SG, VK, GM, SP, RT, PV; KORA study: MCK, CG, HG, CH, TI, JK, S Kunze, CM, TM, AP, HP, JSR, MR, WR, K Schramm, K Strauch, BT, MW, SW; Leiden Longevity Study: MB, AJMdC, BTH, PES; LIFELINES study: MJB, LF, PvdH, EFT, CW, AZ; LOLIPOP study: BA, UA, CB, PAB, VB, JCC, A. Drong, PE, MRJ, SJ, JSK, MAK, NK, BL, CML, M Loh, SdL, MIM, VM, ZYM, HKN, FR, MAR, JS, PS, R Soong, WRS, EST, LT, ST, ARW, WZ; Rotterdam Study: A. Deghan, CvD, OF, AH, AI, JBJvM, LS, AGU; TwinsUK study: JTB, PD, JKS, TDS, PCT, TPY, WY.
Data collection and molecular analyses in isolated cell subsets
Adipocytes: MA, RLB, JCC, ME, MH, AJ, JSK, ZYM, HKN, MAR, JS, R Soong, WRS, ST; Hepatocytes: OA, M Brosch, JH, CS, R Siebert; Leucocytes: JFA, SLB, JCC, JSK, M Laffan, ZYM, HKN, NN, ZN, MAR, R Soong, WRS, ST, YY.
Data analysis and writing group
JCC, A Drong, PE, JSK, CG, HG, BL, M Loh, GM, MIM, JS, WRS, SW.
Competing interests
None
References
- 1.Wang YC, McPherson K, Marsh T, Gortmaker SL, Brown M. Health and economic burden of the projected obesity trends in the USA and the UK. Lancet. 2011;378:815–825. doi: 10.1016/S0140-6736(11)60814-3. [DOI] [PubMed] [Google Scholar]
- 2.Ng M, et al. Global, regional, and national prevalence of overweight and obesity in children and adults during 1980-2013: a systematic analysis for the Global Burden of Disease Study 2013. Lancet. 2014;384:766–781. doi: 10.1016/S0140-6736(14)60460-8. [DOI] [PMC free article] [PubMed] [Google Scholar]
- 3.Dick KJ, et al. DNA methylation and body-mass index: a genome-wide analysis. Lancet. 2014;383:1990–1998. doi: 10.1016/S0140-6736(13)62674-4. [DOI] [PubMed] [Google Scholar]
- 4.Feinberg AP, et al. Personalized epigenomic signatures that are stable over time and covary with body mass index. Science translational medicine. 2010;2:49ra67. doi: 10.1126/scitranslmed.3001262. [DOI] [PMC free article] [PubMed] [Google Scholar]
- 5.Xu X, et al. A genome-wide methylation study on obesity: differential variability and differential methylation. Epigenetics : official journal of the DNA Methylation Society. 2013;8:522–533. doi: 10.4161/epi.24506. [DOI] [PMC free article] [PubMed] [Google Scholar]
- 6.Demerath EW, et al. Epigenome-wide association study (EWAS) of BMI, BMI change and waist circumference in African American adults identifies multiple replicated loci. Human molecular genetics. 2015;24:4464–4479. doi: 10.1093/hmg/ddv161. [DOI] [PMC free article] [PubMed] [Google Scholar]
- 7.Portela A, Esteller M. Epigenetic modifications and human disease. Nature biotechnology. 2010;28:1057–1068. doi: 10.1038/nbt.1685. [DOI] [PubMed] [Google Scholar]
- 8.Danaei G, et al. National, regional, and global trends in fasting plasma glucose and diabetes prevalence since 1980: systematic analysis of health examination surveys and epidemiological studies with 370 country-years and 2.7 million participants. Lancet. 2011;378:31–40. doi: 10.1016/S0140-6736(11)60679-X. [DOI] [PubMed] [Google Scholar]
- 9.Slieker RC, et al. Identification and systematic annotation of tissue-specific differentially methylated regions using the Illumina 450k array. Epigenetics & chromatin. 2013;6:26. doi: 10.1186/1756-8935-6-26. [DOI] [PMC free article] [PubMed] [Google Scholar]
- 10.Rosen ED, Spiegelman BM. What we talk about when we talk about fat. Cell. 2014;156:20–44. doi: 10.1016/j.cell.2013.12.012. [DOI] [PMC free article] [PubMed] [Google Scholar]
- 11.Relton CL, Davey Smith G. Two-step epigenetic Mendelian randomization: a strategy for establishing the causal role of epigenetic processes in pathways to disease. International journal of epidemiology. 2012;41:161–176. doi: 10.1093/ije/dyr233. [DOI] [PMC free article] [PubMed] [Google Scholar]
- 12.Speliotes EK, et al. Association analyses of 249,796 individuals reveal 18 new loci associated with body mass index. Nature genetics. 2010;42:937–948. doi: 10.1038/ng.686. [DOI] [PMC free article] [PubMed] [Google Scholar]
- 13.Bochukova EG, et al. Large, rare chromosomal deletions associated with severe early-onset obesity. Nature. 2010;463:666–670. doi: 10.1038/nature08689. [DOI] [PMC free article] [PubMed] [Google Scholar]
- 14.Johansson LE, et al. Differential gene expression in adipose tissue from obese human subjects during weight loss and weight maintenance. The American journal of clinical nutrition. 2012;96:196–207. doi: 10.3945/ajcn.111.020578. [DOI] [PubMed] [Google Scholar]
- 15.Aron-Wisnewsky J, et al. Effect of bariatric surgery-induced weight loss on SR-BI-, ABCG1-, and ABCA1-mediated cellular cholesterol efflux in obese women. The Journal of clinical endocrinology and metabolism. 2011;96:1151–1159. doi: 10.1210/jc.2010-2378. [DOI] [PubMed] [Google Scholar]
- 16.Pfeifferm L, et al. DNA Methylation of Lipid-Related Genes Affects Blood Lipid Levels. Circulation Cardiovascular genetics. 2015 doi: 10.1161/CIRCGENETICS.114.000804. [DOI] [PMC free article] [PubMed] [Google Scholar]
- 17.Hidalgo B, et al. Epigenome-wide association study of fasting measures of glucose, insulin, and HOMA-IR in the Genetics of Lipid Lowering Drugs and Diet Network study. Diabetes. 2014;63:801–807. doi: 10.2337/db13-1100. [DOI] [PMC free article] [PubMed] [Google Scholar]
- 18.Donkin I, et al. Obesity and Bariatric Surgery Drive Epigenetic Variation of Spermatozoa in Humans. Cell metabolism. 2016;23:369–378. doi: 10.1016/j.cmet.2015.11.004. [DOI] [PubMed] [Google Scholar]
- 19.Karin M, Ben-Neriah Y. Phosphorylation meets ubiquitination: the control of NF-[kappa]B activity. Annual review of immunology. 2000;18:621–663. doi: 10.1146/annurev.immunol.18.1.621. [DOI] [PubMed] [Google Scholar]
- 20.Brightling CE, et al. Benralizumab for chronic obstructive pulmonary disease and sputum eosinophilia: a randomised, double-blind, placebo-controlled, phase 2a study. The Lancet. Respiratory medicine. 2014;2:891–901. doi: 10.1016/S2213-2600(14)70187-0. [DOI] [PMC free article] [PubMed] [Google Scholar]
- 21.Chambers JC, et al. Epigenome-wide association of DNA methylation markers in peripheral blood from Indian Asians and Europeans with incident type 2 diabetes: a nested case-control study. The lancet Diabetes & endocrinology. 2015;3:526–534. doi: 10.1016/S2213-8587(15)00127-8. [DOI] [PMC free article] [PubMed] [Google Scholar]
- 22.Houseman EA, et al. DNA methylation arrays as surrogate measures of cell mixture distribution. BMC bioinformatics. 2012;13:86. doi: 10.1186/1471-2105-13-86. [DOI] [PMC free article] [PubMed] [Google Scholar]
- 23.Lehne B, et al. A coherent approach for analysis of the Illumina HumanMethylation450 BeadChip improves data quality and performance in epigenome-wide association studies. Genome Biology. 2015;16:37. doi: 10.1186/s13059-015-0600-x. [DOI] [PMC free article] [PubMed] [Google Scholar]
- 24.Lyons AB, Parish CR. Determination of lymphocyte division by flow cytometry. Journal of immunological methods. 1994;171:131–137. doi: 10.1016/0022-1759(94)90236-4. [DOI] [PubMed] [Google Scholar]
- 25.Park D, et al. Noninvasive imaging of cell death using an Hsp90 ligand. Journal of the American Chemical Society. 2011;133:2832–2835. doi: 10.1021/ja110226y. [DOI] [PMC free article] [PubMed] [Google Scholar]
- 26.Burgess S. Sample size and power calculations in Mendelian randomization with a single instrumental variable and a binary outcome. International journal of epidemiology. 2014;43:922–929. doi: 10.1093/ije/dyu005. [DOI] [PMC free article] [PubMed] [Google Scholar]
- 27.Spalding KL, et al. Dynamics of fat cell turnover in humans. Nature. 2008;453:783–787. doi: 10.1038/nature06902. [DOI] [PubMed] [Google Scholar]
- 28.Schurmann C, et al. Analyzing illumina gene expression microarray data from different tissues: methodological aspects of data analysis in the metaxpress consortium. PloS one. 2012;7:e50938. doi: 10.1371/journal.pone.0050938. [DOI] [PMC free article] [PubMed] [Google Scholar]
- 29.Doring A, et al. SLC2A9 influences uric acid concentrations with pronounced sex-specific effects. Nature genetics. 2008;40:430–436. doi: 10.1038/ng.107. [DOI] [PubMed] [Google Scholar]
- 30.Ahrens M, et al. DNA methylation analysis in nonalcoholic fatty liver disease suggests distinct disease-specific and remodeling signatures after bariatric surgery. Cell metabolism. 2013;18:296–302. doi: 10.1016/j.cmet.2013.07.004. [DOI] [PubMed] [Google Scholar]
Associated Data
This section collects any data citations, data availability statements, or supplementary materials included in this article.


