

Abstract
Context
In observational studies, abdominal adiposity has been associated with type 2 diabetes and coronary heart disease (CHD). Whether these associations represent causal relationships remains uncertain.
Objective
To test the association of a polygenic risk score for waist-to-hip ratio adjusted for body mass index (WHRadjBMI), a measure of abdominal adiposity, with type 2 diabetes and CHD through the potential intermediates of blood lipids, blood pressure and glycemic phenotypes.
Design
A polygenic risk score for WHRadjBMI based on 48 single nucleotide polymorphisms was constructed. The association of this score, a measure of genetic predisposition to abdominal adiposity, with cardiometabolic traits, type 2 diabetes, and CHD was tested in a Mendelian randomization analysis that combined case-control and cross-sectional datasets.
Setting and Participants
Estimates for cardiometabolic traits were based on a combined dataset including summary results from 4 genome-wide association studies conducted from 2007 to 2015, consisting of up to 322 154 participants, as well as individual level, cross sectional data from the UK Biobank collected from 2007–2011, consisting of 111 986 individuals. Estimates for type 2 diabetes and CHD were derived from summary statistics of 2 separate genome-wide association studies conducted from 2007–2015, and including 149 821 individuals and 184 305 individuals, respectively, combined with individual level data from the UK Biobank.
Exposure
Genetic predisposition to increased WHRadjBMI.
Main Outcome Measures
Type 2 diabetes and CHD.
Results
In 111 986 individuals in UK Biobank, the mean age was 57 [standard deviation (SD) 8] years, 58 845 participants (52.5%) were women and the mean waist-to-hip ratio was 0.875. Analysis of summary-level genome-wide association study results and individual-level UK Biobank data demonstrated that a one SD increase in WHRadjBMI mediated by the polygenic risk score was associated with 27 mg/dl higher triglyceride levels, 4.1 mg/dl higher two-hour glucose levels, and 2.1 mm Hg higher systolic blood pressure (each P ≤ 0.001). A one SD genetic increase in WHRadjBMI was also associated with a higher risk of type 2 diabetes [OR 1.77 CI 1.57, 2.00; absolute risk increase per 1000 participant years (ARI) 6.0 CI 4.4, 7.8; number of participants with type 2 diabetes outcome, 40 530] and CHD (OR 1.46 CI 1.32, 1.62; ARI 1.8 CI 1.3, 2.4; number of participants with CHD outcome, 66 440).
Conclusions and Relevance
A genetic predisposition to higher waist-to-hip ratio adjusted for body mass index was associated with increased risk of type 2 diabetes and coronary heart disease. These results provide evidence supportive of a causal association between abdominal adiposity and these outcomes.
Introduction
Obesity, typically defined on the basis of body mass index (BMI), is a leading cause of type 2 diabetes and coronary heart disease (CHD) in the population.1,2 However, for any given BMI, body fat distribution can vary substantially; some individuals store proportionally more fat around their visceral organs (abdominal adiposity) than on their thighs and hip.3 Waist-to-hip ratio adjusted for BMI (WHRadjBMI) is a surrogate measure of abdominal adiposity and has been correlated with direct imaging assessments of abdominal fat in observational studies.4,5
In observational studies, abdominal adiposity has been associated with cardiometabolic disease6,7; however, whether this association is causal remains unclear. For example, unmeasured lifestyle factors8 might confound observational studies that link WHRadjBMI with type 2 diabetes and CHD. Furthermore, reverse causality could similarly lead to a statistically robust but non-causal relationship. For example, individuals with subclinical CHD might develop abdominal adiposity due to an inability to exercise.
Mendelian randomization is a human genetics tool that leverages the random assortment of genetic variants at time of conception to facilitate causal inference.9 Because genetic predisposition to abdominal adiposity is determined by DNA sequence variants, it is less likely to be affected by confounding or reverse causality. In this study, a Mendelian randomization approach is used to determine whether a genetic predisposition to increased WHRadjBMI is associated with cardiometabolic quantitative traits, type 2 diabetes, and CHD.
Methods
Study Design and Instruments
Observational epidemiology studies test association of an exposure (e.g., WHRadjBMI) with an outcome (e.g., CHD). However, unobserved confounders may affect both exposure and outcome, thus biasing the observed association (Figure 1, Supp. Methods A). Because genetic variants are both randomly assorted in a population and assigned at conception, genetic variants are largely unassociated with confounders and can be used as instrumental variables to estimate the causal association of an exposure (WHRadjBMI) with an outcome.9 This Mendelian randomization approach has three assumptions.10 First, genetic variants used as an instrument must be associated with the exposure of interest (e.g., WHRadjBMI, Assumption 1 in Figure 1). Second, genetic variants must not be associated with confounders (Assumption 2 in Figure 1). Third, genetic variants must not be associated with outcome independently of the exposure (Assumption 3 in Figure 1). The second and third assumptions are collectively known as independence from pleiotropy. Mendelian randomization can be extended to conduct a mediation analysis, estimating the association of an exposure (WHRadjBMI) with an outcome (CHD) that occurs through a given mediator (M in Figure 1) and that does not occur through a mediator (U in Figure 1).
Figure 1.
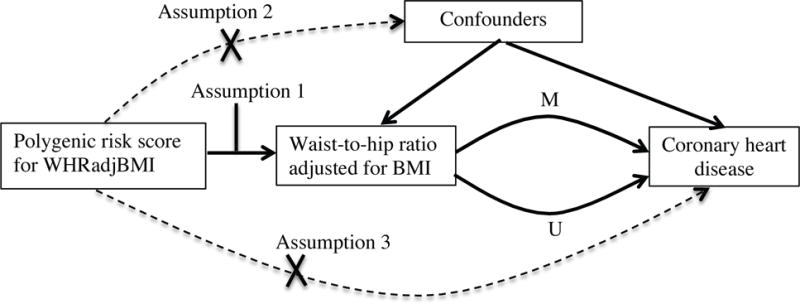
Assumptions of a Mendelian randomization analysis. Genetic variants, which are assigned at birth and largely randomly assorted in a population, can be used as instrumental variables to estimate the causal association of an exposure (e.g., WHRadjBMI) with an outcome of interested (e.g., coronary heart disease). This approach rests on three assumptions, denoted with Assumption 1 through Assumption 3 above. First, the genetic variants must be associated with the exposure (Assumption 1). Second, the genetic variants must not be associated with confounders (Assumption 2). Third, the genetic variants must influence risk of the outcome through the exposure and not through other pathways (Assumption 3). Mendelian randomization can be extended to estimate the association of exposure with outcome that is mediated (M in Figure 1) by a given a mediator (e.g., triglycerides) and that is not mediated (U in Figure 1) by that mediator.
A Mendelian randomization study using publicly-available summary-level data from large-scale genome-wide association studies (GWAS; both cross-sectional and case control datasets) as well as individual-level data from the UK Biobank (a cross-sectional dataset) was conducted (Figure 2).11–17 The primary exposure was a polygenic risk score for WHRadjBMI. A recent large-scale GWAS from the Genome-wide Investigation of Anthropometric Traits (GIANT) consortium identified 48 single nucleotide polymorphisms (SNPs; genetic variants) associated with WHRadjBMI (eTable 1).13 Combining these 48 SNPs into a weighted polygenic risk score enabled quantification of the genetic predisposition to increased WHRadjBMI for each individual.
Figure 2.
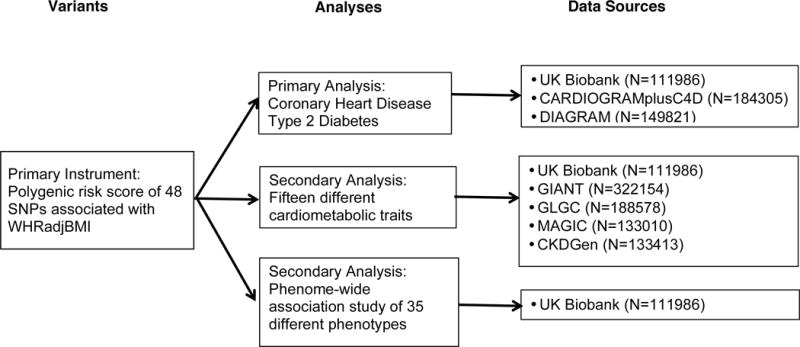
Study design. Shown are variants in the primary instrument used to estimate the association of waist-to-hip ratio adjusted for body mass index with cardiometabolic quantitative traits, type 2 diabetes, and coronary heart disease; sources of data for analysis including UK Biobank and publicly-available genome-wide association studies. Abbreviations: WHRadjBMI, waist-to-hip ratio adjusted for body mass index; BMI, body mass index; SNP; single nucleotide polymorphism; CARDIOGRAMplusC4D, Coronary ARtery DIsease Genome-wide Replication and Meta-analysis plus The Coronary Artery Disease Genetics consortium19; DIAGRAM, DIAbetes Genetics Replication And Meta-analysis17; GIANT, Genetic Investigation of ANthropometric Traits13,14; GLGC, Global Lipids Genetics Consortium11; MAGIC, Meta-Analyses of Glucose and Insulin-related traits Consortium12; CKDGen, Chronic Kidney Disease Genetics Consortium15.
Data sources and study participants
Summary-level data from six GWAS consortia were used (GWAS conducted from 2007 to 2015, eTable 3, Supp. Methods B).11–17 For waist-to-hip ratio (WHR), BMI, waist circumference, hip circumference, and WHRadjBMI, data from the GIANT consortium was used (GWAS conducted from 2007 to 2013);13,14 this study included 322 154 individuals of European descent for BMI and 210 088 individuals of European descent for WHRadjBMI, WHR, waist circumference and hip circumference. The results from five additional GWAS (conducted from 2007 to 2015) examining blood lipids, glycemic traits, renal function, type 2 diabetes, and CHD, and predominantly containing individuals of European descent, were also assessed.11,12,17–20 Summary results for type 2 diabetes and CHD were derived from studies of 149 821 individuals (DIAGRAM17) and 184 305 individuals (CARDIOGRAM19), respectively. Informed consent was obtained from all participants of contributing studies. Contributing studies received ethical approval from their respective institutional review boards.
Individual-level data from 111 986 individuals of European ancestry from the UK Biobank, collected from 2007–2011, was also used (Supp. Methods C, Table 1). UK Biobank received ethical approval from the Research Ethics Committee (reference number 11/NW/0382). Analysis of UK Biobank was approved by the Partners Health Care Institutional Review Board (protocol 2013P001840). Informed consent was obtained from all participants by UK Biobank. WHRadjBMI was derived in UK Biobank through inverse normal transformation of WHR after adjustment for age, sex and BMI (as in the GIANT collaboration13). Type 2 diabetes and CHD were both ascertained at baseline by self-report, followed by a verbal interview with a trained nurse to confirm the diagnosis (eTable 4). Type 2 diabetes was defined as report of type 2 diabetes, report of type 2 diabetes unspecified, or current use of insulin medication. CHD was defined as report of previous myocardial infarction or diagnosis of angina or hospitalization for myocardial infarction (ICD codes I21-I23).
Table 1.
Characteristics of UK Biobank participants.
| N Individuals | 111986 |
| Age ± SD, years | 56.9 ± 7.9 |
| Male, n (%) | 53141 (47.5%) |
| UK BiLEVE Array, n (%) | 38505 (34.4%) |
| SBP ± SD, mm Hg* | 143.6 ± 21.8 |
| DBP ± SD, mm Hg* | 84.5 ± 11.8 |
| BMI ± SD, kg/m2 | 27.5 ± 4.8 |
| Waist-to-Hip Ratio ± SD | 0.875 ± 0.09 |
| Diabetes Mellitus, n (%) | 5690 (5.1%) |
| Coronary Heart Disease, n (%) | 5639 (5.0%) |
7681 individuals were missing a BP measurement at baseline. Reported measurements are after adjustment for treatment (addition of 15 mm Hg to SBP and 10 mm Hg to DBP)
Abbreviations: SBP, systolic blood pressure; DBP, diastolic blood pressure; BP, blood pressure; SD, standard deviation; BMI, body mass index.
UK BiLEVE Array refers to participants who were genotyped using the UK BiLEVE array rather than the UK Biobank Axiom Array.
In addition to the primary outcomes of type 2 diabetes and CHD, a phenome-wide association study (an analysis of the association of a genetic variant or polygenic risk score with a broad range of diseases and/or outcomes) for 35 additional diseases, including endocrine, renal, urological, gastrointestinal, neurological, musculoskeletal, respiratory and cancer disorders was conducted in UK Biobank to attempt to identify whether the polygenic risk score for WHRadjBMI is associated with any additional disorders (eTable 4).
Statistical analysis
For analyses of both summary-level data and UK Biobank, a weighted polygenic risk score was derived based on the magnitude of association each SNP with WHRadjBMI in the previously published GIANT analysis.18 The association of polygenic risk score with each continuous trait and dichotomous outcome was then calculated after standardization to a one standard deviation (SD) predicted change in WHRadjBMI.
For the summary level data, this approach is equivalent to an inverse-variance weighted fixed effects meta-analysis of the association of each SNP with the trait or outcome of interest (e.g. CHD), divided by the association of each SNP with WHRadjBMI.21,28 Explicitly, if x is the association of each SNP with the outcome of interest, and w the association of each SNP with WHRadjBMI, then the estimated genetic association of WHRadjBMI with the outcome was calculated as a fixed effects meta-analysis of x/w for all SNPs.
To validate that the polygenic risk score for WHRadjBMI was a strong instrument for WHRadjBMI (Assumption 1 in Figure 1), an F-statistic for the instrument was calculated in UK Biobank. An F-statistic is a measure of the significance of an instrument (the polygenic risk score) for prediction of the exposure (WHRadjBMI), controlling for additional covariates (age, sex, ten principal components of ancestry and a dummy variable for the array type used in genotyping). An F-statistic greater than 10 is evidence of a strong instrument.22
For individual level data from UK Biobank, logistic regression was used to determine association of a polygenic risk score for WHRadjBMI and dichotomous outcomes (type 2 diabetes, CHD and 35 additional diseases, Supp. Methods C).23 Linear regression was used for continuous traits in UK Biobank (anthropometric traits and blood pressure). All UK Biobank analyses included adjustment for age, sex, ten principal components of ancestry and a dummy variable for the array type used in genotyping. The inclusion of principal components of ancestry as covariates is commonly implemented to correct for population stratification according to ancestral background.24
In order to test Assumption 2 (independence of polygenic risk score for WHRadjBMI from potential confounders, Figure 1), the relationship of the polygenic risk score to smoking, alcohol use, physical activity, vegetable consumption, red meat consumption and breastfeeding status as a child was determined among individuals in the UK Biobank. Test for trend was performed across quartiles of the polygenic risk score for WHRadjBMI using logistic regression with each potential confounder as the outcome. For comparison, individuals in UK Biobank were stratified into quartiles by observational WHRadjBMI and test for trend performed using logistic regression.
Five additional sensitivity analyses were conducted to test the robustness of our results (Supp. Methods D). Three additional polygenic risk scores were used, including one that included variants which were not significantly associated with BMI, a second that included variants which were significantly associated with gene expression in adipose tissue and a third that included variants which were significantly associated with increased WHRadjBMI in women but not in men. The association of genetic variants with BMI was adjusted for and median regression was used (Supp. Methods D).10 The rationale for these sensitivity analyses is provided in Supp. Methods D.
Absolute increases associated with WHRadjBMI for type 2 diabetes and CHD were calculated using the United States population incidence of type 2 diabetes and CHD (Supp. Methods E). Tests for non-linear associations of a genetic predisposition to increased WHRadjBMI with type 2 diabetes and CHD were performed using non-linear instrumental variable estimation (Supp. Methods F).25
The threshold of statistical significance for type 2 diabetes and CHD (main outcome measures) was p< 0.025 (0.05/2=0.025). The threshold of significance for the analysis of fifteen traits was p<0.0033 (0.05/15=0.0033). The threshold of significance in the phenome-wide association analysis was p<0.0014 (0.05/35 = 0.0014).
Mediation analysis
Amongst continuous traits, the polygenic risk score for WHRadjBMI was most strongly associated with plasma triglyceride levels. The extent to which the polygenic risk score association with CHD was mediated by plasma triglycerides was tested using mediation analysis, conducted post-hoc after triglycerides was identified as the cardiometabolic trait most strongly associated with WHRadjBMI. An estimate of the genetic association of triglycerides on CHD risk, previously derived in Do et al. (odds ratio 1.52 per 1 SD increase in triglycerides)26, was used to calculate the predicted magnitude of increased CHD risk based on the observed association of the WHRadjBMI polygenic risk score with triglycerides (estimated using linear regression). To derive the remaining proportion of CHD risk unaccounted for by an increase in triglyceride levels, the magnitude of association of the change in triglycerides with CHD was subtracted from our estimate of the genetic association of WHRadjBMI with CHD (estimated using logistic regression).
Analyses were performed using R version 3.2.3 software (The R Project for Statistical Computing, Vienna, Austria) and Stata version 12 (StataCorp, Texas, United States).
Results
The characteristics of UK Biobank participants are provided in Table 1. The mean age was 56.9 (SD 7.9), the mean systolic blood pressure 143.6 mm Hg (SD 21.8) and the mean diastolic blood pressure 84.5 mm Hg (SD 11.8). 5639 (5.0%) participants had CHD while 5690 (5.1%) individuals had type 2 diabetes.
A 48-SNP polygenic risk score for WHRadjBMI score was a strong instrumental variable (F-statistic of 1713), statistically accounting for 1.5% of variance in WHRadjBMI in UK Biobank, thus validating Assumption 1 in Figure 1.
In order to test Assumption 2 (independence of polygenic risk score for WHRadjBMI from potential confounders, Figure 1), the relationship of the polygenic risk score to smoking, alcohol use, physical activity, vegetable consumption, red meat consumption and breastfeeding status as a child was determined among individuals in the UK Biobank. In each case, no significant relationship was noted (eTable 5). For comparison, a similar analysis that categorized individuals according to observed WHRadjBMI (instead of genetic predisposition to WHRadjBMI) was conducted (eTable 6). In this observational epidemiology analysis, WHRadjBMI was strongly associated with each potential confounder.
A one SD increase in WHRadjBMI due to the polygenic risk score was associated with a 1.0 kg/m2 decrease in BMI (CI 0.9, 1.1), a 2 cm increase in waist circumference (CI 1.5, 2.4), a 4.1 cm decrease in hip circumference (CI 3.8, 4.4) and a 0.068 increase in WHR (CI 0.066, 0.07; Figure 3). A one SD increase in WHRadjBMI due to the polygenic risk score was associated with higher total cholesterol (5.6 CI 3.9, 7.3 mg/dl), higher LDL cholesterol (5.7 CI 4.1, 7.2 mg/dl), higher triglycerides (27 CI 25, 30 mg/dl) and lower HDL cholesterol (6.0 CI 5.3, 6.6 mg/dl). A one SD increase in WHRadjBMI due to the polygenic risk score was associated with higher log-transformed fasting insulin levels (0.065 CI 0.052, 0.078), higher two-hour glucose levels (4.1 CI 1.6, 6.5 mg/dl), and higher systolic blood pressure (2.1 CI 1.2, 3 mmHg).
Figure 3.
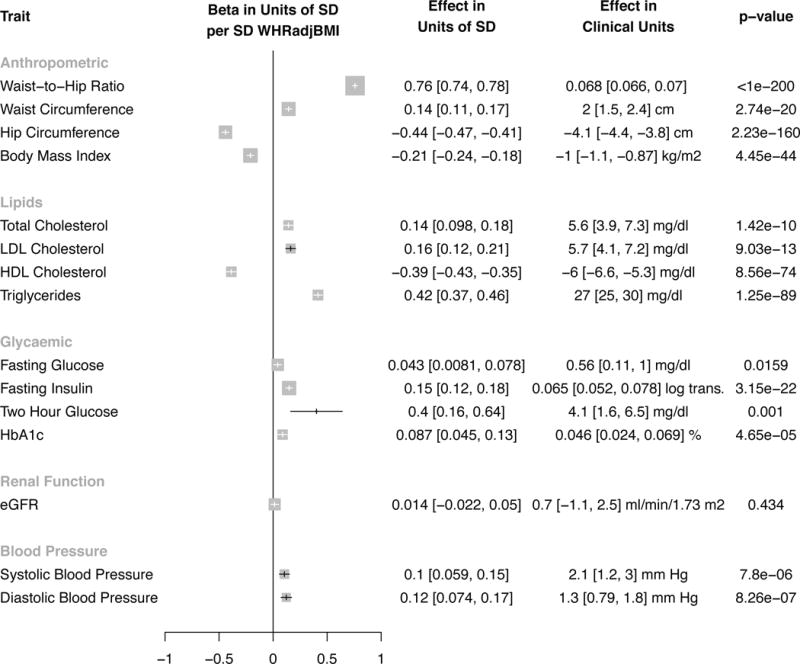
Association of 48 SNP polygenic risk score for WHRadjBMI with cardiometabolic quantitative traits. Results are standardized to a one SD increase in WHRadjBMI due to polygenic risk score. For systolic blood pressure, a one SD genetic increase WHRadjBMI is associated with a 2.1 mm Hg higher systolic blood pressure (95% CI 1.2, 3.0), or a 0.1 standard deviation increase in systolic blood pressure (CI 0.059, 0.15). For anthropometric traits, estimates from Genetic Investigation of Anthropometric Traits (GIANT – derived using inverse variance weighted fixed effects meta-analysis13,14) were pooled with UK Biobank (derived instrumental variables regression adjusting for age, sex, ten principal components of ancestry and array type) using inverse variance weighted fixed effects meta-analysis. For lipids, glycaemic and renal function traits, estimates were derived from genome-wide association studies (Global Lipids Genetics11, Meta-analyses of Glucose and Insulin-related Traits12 and Chronic Kidney Genetics Consortia15, respectively). For blood pressure, estimates were derived from UK Biobank. Two hour glucose refers to measured blood glucose levels two hour after consumption of dissolved glucose. 95% confidence intervals are reported beside associations. The threshold of significance was p<0.0033 (0.05/15=0.0033). Error bars refer to the 95% confidence interval for each estimate. Size of data marker is inversely proportional to variance of estimate. Abbreviations: OR, odds ratio; SD, standard deviation; WHRadjBMI, waist-to-hip ratio adjusted for body mass index; waist-to-hip ratio, WHR; body mass index, BMI; LDL cholesterol, low-density lipoprotein cholesterol; HDL cholesterol, high-density lipoprotein cholesterol; HbA1c, hemoglobin a1c; eGFR, estimated glomerular filtration rate; SBP, systolic blood pressure; DBP, diastolic blood pressure; waist, waist circumference; hip, hip circumference; beta, beta coefficient.
A one SD increase in WHRadjBMI due to polygenic risk score was associated with a higher risk of type 2 diabetes (OR 1.77 CI 1.57, 2.00; absolute risk increase per 1000 participant years (ARI) 6.0 CI 4.4, 7.8; p=7.3*10−21; number of participants with type 2 diabetes outcome, 40 530; Figure 4). A one SD increase in WHRadjBMI due to polygenic risk score was also associated with higher risk of CHD (OR 1.46, CI 1.32, 1.62; ARI 1.8 CI 1.3, 2.4; p=9.9*10−14; number of participants with CHD outcome, 66 440; Figure 4).
Figure 4.
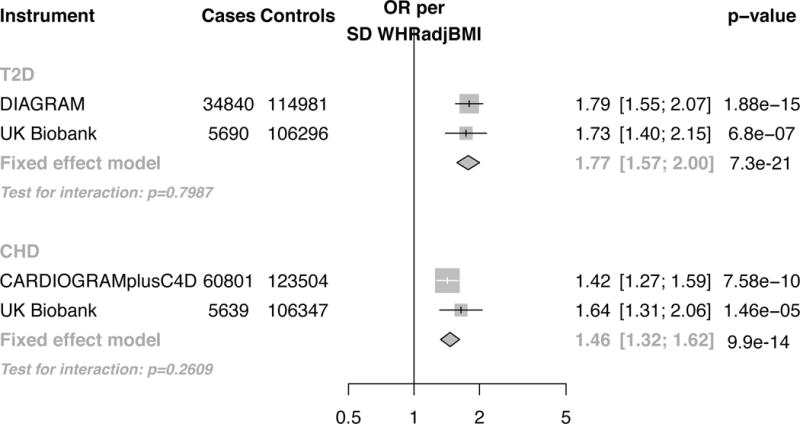
Association of 48 SNP polygenic risk score for WHRadjBMI with type 2 diabetes and coronary heart disease. Results are standardized to a one SD increase in WHRadjBMI due to polygenic risk score. Estimates were independently derived in genome-wide association studies (CARDIOGRAMplusC4D for coronary heart disease and DIAGRAM for type 2 diabetes) and UK Biobank. The threshold of significance was p< 0.025 (0.05/2=0.025). Error bars refer to the 95% confidence interval for each estimate. Size of data marker is inversely proportional to variance of estimate. Abbreviations: OR, odds ratio; SD, standard deviation; SNPs, single nucleotide polymorphisms; WHRadjBMI, waist-to-hip ratio adjusted for body mass index; CHD, coronary heart disease; T2D, type 2 diabetes; CARDIOGRAMplusC4D, Coronary ARtery DIsease Genome-wide Replication and Meta-analysis plus The Coronary Artery Disease Genetics consortium; DIAGRAM, DIAbetes Genetics Replication And Meta-analysis.
Five sensitivity analyses (Supp. Methods D, eFigures 1–9) of the genetic association of WHRadjBMI with cardiometabolic traits, type 2 diabetes and CHD were conducted to examine if results were influenced by pleiotropy (i.e., a violation of Assumptions 2 or 3 in Figure 1). Four of the five sensitivity analyses were consistent with the results not being influenced by pleiotropy (eFigures 1–7). In the fifth sensitivity analysis, eight SNPs associated with elevated WHRadjBMI in women but not men were combined in an additive risk score. If WHRadjBMI causes CHD (rather than results being due to pleiotropy), then a risk score that increases WHRadjBMI in women but not in men should increase risk of CHD in women but not in men. Although a numerically greater magnitude of association with type 2 diabetes and CHD was noted in women as compared to men, no significant difference was observed (p-interaction = 0.10 and 0.11 respectively (eFigures 8 and 9; eMethods D).
Using the polygenic risk score of 48 SNPs associated with WHRadjBMI, a phenome wide association study of 35 additional diseases in UK Biobank was conducted (Figure 5). There was no significant association of WHRadjBMI with any of these diseases at the Bonferroni-adjusted level of significance (p<0.0014).
Figure 5.
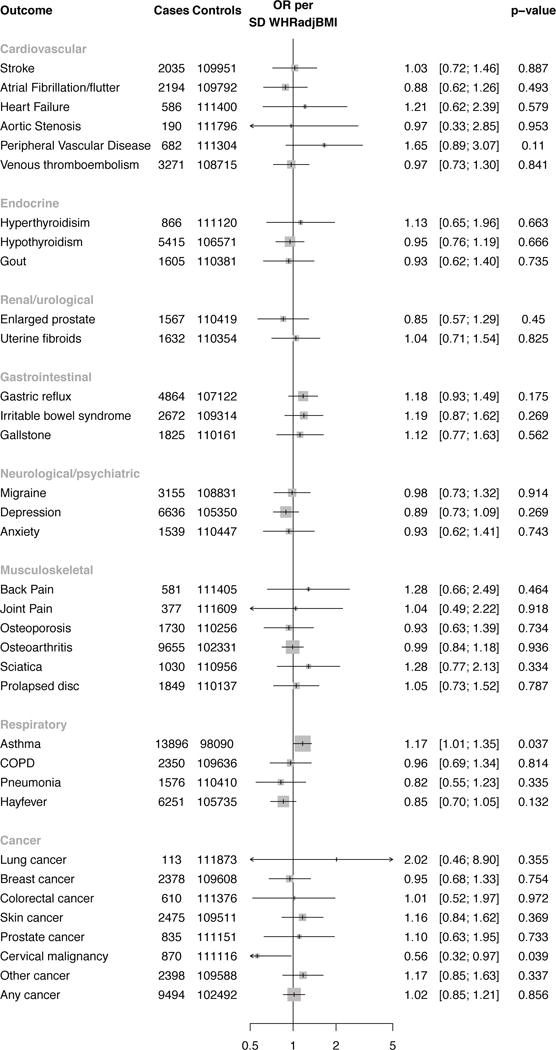
A phenome-wide association study testing if 48 SNP polygenic risk score for WHRadjBMI is associated with a range of disease phenotypes. Results are standardized to a one SD increase in WHRadjBMI due to polygenic risk score. All estimates were derived in UK Biobank using instrumental variables regression (adjusting for age, sex and ten principal components of ancestry). The threshold for significance was p<0.0014 (0.05/35 = 0.0014). Error bars refer to the 95% confidence interval for each estimate. Size of data marker is inversely proportional to variance of estimate. Abbreviations: WHRadjBMI, waist-to-hip ratio adjusted for body mass index; OR, odds ratio; SD, standard deviation; SNPs, single nucleotide polymorphisms; COPD, chronic obstructive pulmonary disease.
In mediation analysis, the association of polygenic risk score for WHRadjBMI with CHD was attenuated from OR 1.46 (CI 1.32, 1.62) to OR 1.23 (CI 1.11, 1.36), after accounting for the association of the polygenic risk score with triglycerides (eFigure 10).
Discussion
Mendelian randomization analyses tested if human genetic evidence supported a causal relationship of WHRadjBMI, a measure of abdominal adiposity, with type 2 diabetes and CHD. Genetic predisposition to higher WHRadjBMI was associated with increased levels of quantitative risk factors (lipids, insulin, glucose, and systolic blood pressure) as well as a higher risk for type 2 diabetes (OR 1.77 CI 1.57, 2.00 per SD higher WHRadjBMI) and CHD (OR 1.46 CI 1.32, 1.62 per SD higher WHRadjBMI).
These results permit several conclusions. First, these findings lend human genetic support to previous observations associating abdominal adiposity with cardiometabolic disease.6,7 In the INTERHEART acute myocardial infarction case-control study, a one SD higher WHR was associated with elevated odds of myocardial infarction (OR 1.37 CI 1.33, 1.40), after adjustment for BMI and other covariates.6 However, residual confounding or reverse causality may have contributed to these associations. Indeed, in this study, observational WHRadjBMI was strongly associated with potential confounders, illustrating a limitation of observational epidemiology. Here, these prior findings were extended by testing a polygenic risk score that appeared independent of measured confounders (eTable 5). Elevation in triglyceride-rich lipoproteins, a risk factor for CHD with genetic and experimental evidence for causality26,27, appeared to mediate a substantial proportion of the increased risk for CHD.
Second, these results suggest that body fat distribution, beyond simple measurement of BMI, could explain part of the variation in risk of type 2 diabetes and CHD noted across individuals and subpopulations. For example, increased abdominal adiposity in South Asians at a given BMI has been proposed as an explanation for the excess risk of CHD observed in South Asians.28 Similarly, greater abdominal adipose tissue at a given BMI has been proposed to underlie the excess risk of CHD at a given BMI among men compared to women.29 In the INTERHEART study, which observed a similar strength of association of WHRadjBMI with myocardial infarction as the genetic estimate reported here, 33.7% of myocardial infarctions were attributed to elevated WHR compared to 10.8% of infarctions to overweight and obesity (BMI > 25).6 When combined with the evidence supportive of causality reported here, these results raise the potential that abdominal adiposity, independent of elevated BMI, is a major driver of global CHD burden.
Third, WHRadjBMI might prove useful as a biomarker for the development of therapies to prevent type 2 diabetes and CHD. Although a substantial focus of drug development has been towards therapeutics to reduce overall adiposity30, there has been little effort towards the development of therapies that modify body fat distribution to reduce abdominal adiposity. Ongoing research to understand the mechanistic links between the numerous genetic loci that influence WHRadjBMI may lead to novel therapeutics strategies to reduce abdominal adiposity and reduce the risk of type 2 diabetes and CHD.
The Mendelian randomization approach used in this study rests on two major principles (Figure 1). First, it requires a strong link between the genetic variants used as an instrument and the exposure (WHRadjBMI, assumption 1 in Figure 1). The 48 SNP polygenic risk score explained 1.5% of variance in WHRadjBMI and had an F-statistic of 1713 in UK Biobank, classifying it as a strong instrument with negligible weak instrument bias.31 Second, Mendelian randomization assumes the absence of pleiotropy, that is, it assumes that the genetic variants used as an instrument affect the outcome (CHD) through the exposure (WHRadjBMI) and not through any other pathway or confounding factors (assumptions 2 and 3 in Figure 1). Although it is not possible to directly test whether pleiotropy is present in any Mendelian randomization study32, a number of steps were taken in this study to reduce the risk of pleiotropy, including use of three different genetic instruments, use of weighted median regression and use of an instrument that was associated with higher WHRadjBMI in women but not men. Results from four of five of these sensitivity analyses were consistent with the primary results. Tests for interaction using sex-specific instruments for CHD and diabetes were directionally consistent with expectation but did not demonstrate significant heterogeneity of effect by gender. This analysis required individual-level data available only in UK Biobank participants and may have been underpowered to detect a difference. Future research that explores such sex-specific instruments in larger datasets may prove more conclusive.
Several limitations deserve mention. First, while a number of approaches were used in an attempt to rule out pleiotropy, it is possible that these results represent a shared genetic basis between WHRadjBMI and CHD rather than a causal relationship. Second, prevalent events largely derived from a verbal interview with a nurse were used for the phenome-wide association study of thirty-five different disorders. Although these events are likely to be of greater specificity and sensitivity than coded mortality data, they have not been independently validated. Third, the phenome-wide association study may have been underpowered to detect an association of genetic WHRadjBMI with outcomes other than type 2 diabetes and CHD. Fourth, this analysis was restricted to individuals of European ancestry; the association of genetic WHRadjBMI with type 2 diabetes and CHD may differ by ethnicity or genetic ancestry.
Conclusions
A genetic predisposition to higher waist-to-hip ratio adjusted for body mass index was associated with increased risk of type 2 diabetes and CHD. These results provide evidence supportive of a causal association between abdominal adiposity and these outcomes.
Supplementary Material
Key Points.
Question
Is genetic evidence consistent with a causal relationship among waist-to-hip ratio adjusted for body mass index (WHRadjBMI), a measure of abdominal adiposity, type 2 diabetes and coronary heart disease?
Findings
In this Mendelian randomization study, a polygenic risk score for increased WHRadjBMI was significantly associated with adverse cardiometabolic traits and higher risks for both type 2 diabetes (OR 1.77) and coronary heart disease (OR 1.46).
Meaning
These results provide evidence supportive of a causal association between abdominal adiposity and the development of type 2 diabetes and coronary heart disease.
Acknowledgments
Conflicts of Interest and Funding
Connor A. Emdin is funded by the Rhodes Trust. Amit V. Khera is funded by an ACCF/Merck Cardiovascular Research Fellowship and a John S. LaDue Memorial Fellowship in Cardiology. Derek Klarin is supported by the National Heart, Lung, and Blood Institute of the National Institutes of Health under award number T32 HL007734. Sekar Kathiresan is supported by the Ofer and Shelly Nemirovsky Research Scholar award from the Massachusetts General Hospital, the Donovan Family Foundation and R01HL127564 from the NIH. He has received grants from Bayer Healthcare and Amarin and reports consulting fees from Regeneron, Merck, Quest Diagnostics, Novartis, Amgen, Genentech, Corvidia, Genomics PLC, Ionis Pharmaceuticals, and Eli Lilly.
No funders or sponsors were involved in the design and conduct of the study; collection, management, analysis, and interpretation of the data; preparation, review, or approval of the manuscript; or decision to submit the manuscript for publication.
Footnotes
Authors Contributions:
Connor Emdin had full access to all the data in the study and takes responsibility for the integrity of the data and the accuracy of the data analysis.
Study concept and design: Emdin, Khera, Kathiresan
Acquisition of data: Emdin, Natarajan, Klarin, Kathiresan
Analysis and interpretation of data: All authors
Drafting of the manuscript: Emdin, Khera, Kathiresan
Critical revision of the manuscript for important intellectual content: All authors
Statistical analysis: Emdin, Hsiao
Study supervision: Kathiresan
References
- 1.Nordestgaard BG, Palmer TM, Benn M, et al. The effect of elevated body mass index on ischemic heart disease risk: causal estimates from a Mendelian randomisation approach. In: Minelli C, editor. PLoS medicine. 5. Vol. 9. 2012. p. e1001212. [DOI] [PMC free article] [PubMed] [Google Scholar]
- 2.Prospective Studies Collaboration. Whitlock G, Lewington S, et al. Body-mass index and cause-specific mortality in 900 000 adults: collaborative analyses of 57 prospective studies. Lancet. 2009;373(9669):1083–1096. doi: 10.1016/S0140-6736(09)60318-4. [DOI] [PMC free article] [PubMed] [Google Scholar]
- 3.Després J-P. Body fat distribution and risk of cardiovascular disease: an update. Circulation. 2012;126(10):1301–1313. doi: 10.1161/CIRCULATIONAHA.111.067264. [DOI] [PubMed] [Google Scholar]
- 4.Ashwell M, Cole TJ, Dixon AK. Obesity: new insight into the anthropometric classification of fat distribution shown by computed tomography. Br Med J (Clin Res Ed) 1985;290(6483):1692–1694. doi: 10.1136/bmj.290.6483.1692. [DOI] [PMC free article] [PubMed] [Google Scholar]
- 5.Seidell JC, Björntorp P, Sjöström L, Sannerstedt R, Krotkiewski M, Kvist H. Regional distribution of muscle and fat mass in men–new insight into the risk of abdominal obesity using computed tomography. Int J Obes. 1989;13(3):289–303. [PubMed] [Google Scholar]
- 6.Yusuf S, Hawken S, Ounpuu S, et al. Obesity and the risk of myocardial infarction in 27,000 participants from 52 countries: a case-control study. Lancet. 2005;366(9497):1640–1649. doi: 10.1016/S0140-6736(05)67663-5. [DOI] [PubMed] [Google Scholar]
- 7.Vazquez G, Duval S, Jacobs DR, Silventoinen K. Comparison of body mass index, waist circumference, and waist/hip ratio in predicting incident diabetes: a meta-analysis. Epidemiol Rev. 2007;29(1):115–128. doi: 10.1093/epirev/mxm008. [DOI] [PubMed] [Google Scholar]
- 8.Han TS, Bijnen FC, Lean ME, Seidell JC. Separate associations of waist and hip circumference with lifestyle factors. Int J Epidemiol. 1998;27(3):422–430. doi: 10.1093/ije/27.3.422. [DOI] [PubMed] [Google Scholar]
- 9.Smith GD, Ebrahim S. “Mendelian randomization”: can genetic epidemiology contribute to understanding environmental determinants of disease? Int J Epidemiol. 2003;32(1):1–22. doi: 10.1093/ije/dyg070. [DOI] [PubMed] [Google Scholar]
- 10.Bowden J, Davey Smith G, Haycock PC, Burgess S. Consistent Estimation in Mendelian Randomization with Some Invalid Instruments Using a Weighted Median Estimator. Genet Epidemiol. 2016;40(4):304–314. doi: 10.1002/gepi.21965. [DOI] [PMC free article] [PubMed] [Google Scholar]
- 11.Global Lipids Genetics Consortium. Willer CJ, Schmidt EM, et al. Discovery and refinement of loci associated with lipid levels. Nat Genet. 2013;45(11):1274–1283. doi: 10.1038/ng.2797. [DOI] [PMC free article] [PubMed] [Google Scholar]
- 12.Scott RA, Lagou V, Welch RP, et al. Large-scale association analyses identify new loci influencing glycemic traits and provide insight into the underlying biological pathways. Nat Genet. 2012;44(9):991–1005. doi: 10.1038/ng.2385. [DOI] [PMC free article] [PubMed] [Google Scholar]
- 13.Shungin D, Winkler TW, Croteau-Chonka DC, et al. New genetic loci link adipose and insulin biology to body fat distribution. Nature. 2015;518(7538):187–196. doi: 10.1038/nature14132. [DOI] [PMC free article] [PubMed] [Google Scholar]
- 14.Locke AE, Kahali B, Berndt SI, et al. Genetic studies of body mass index yield new insights for obesity biology. Nature. 2015;518(7538):197–206. doi: 10.1038/nature14177. [DOI] [PMC free article] [PubMed] [Google Scholar]
- 15.Pattaro C, Teumer A, Gorski M, et al. Genetic associations at 53 loci highlight cell types and biological pathways relevant for kidney function. Nat Commun. 2016;7:10023. doi: 10.1038/ncomms10023. [DOI] [PMC free article] [PubMed] [Google Scholar]
- 16.Myocardial Infarction Genetics and CARDIoGRAM Exome Consortia Investigators. Coding Variation in ANGPTL4, LPL, and SVEP1 and the Risk of Coronary Disease. N Engl J Med. 2016;374(12):1134–1144. doi: 10.1056/NEJMoa1507652. [DOI] [PMC free article] [PubMed] [Google Scholar]
- 17.Morris AP, Voight BF, Teslovich TM, et al. Large-scale association analysis provides insights into the genetic architecture and pathophysiology of type 2 diabetes. Nat Genet. 2012;44(9):981–990. doi: 10.1038/ng.2383. [DOI] [PMC free article] [PubMed] [Google Scholar]
- 18.International Consortium for Blood Pressure Genome-Wide Association Studies. Ehret GB, Munroe PB, et al. Genetic variants in novel pathways influence blood pressure and cardiovascular disease risk. Nature. 2011;478(7367):103–109. doi: 10.1038/nature10405. [DOI] [PMC free article] [PubMed] [Google Scholar]
- 19.CARDIoGRAMplusC4D Consortium. A comprehensive 1000 Genomes-based genome-wide association meta-analysis of coronary artery disease. Nat Genet. 2015;47(10):1121–1130. doi: 10.1038/ng.3396. [DOI] [PMC free article] [PubMed] [Google Scholar]
- 20.Moffatt MF, Gut IG, Demenais F, et al. A large-scale, consortium-based genomewide association study of asthma. N Engl J Med. 2010;363(13):1211–1221. doi: 10.1056/NEJMoa0906312. [DOI] [PMC free article] [PubMed] [Google Scholar]
- 21.Burgess S, Butterworth A, Thompson SG. Mendelian randomization analysis with multiple genetic variants using summarized data. Genet Epidemiol. 2013;37(7):658–665. doi: 10.1002/gepi.21758. [DOI] [PMC free article] [PubMed] [Google Scholar]
- 22.Stock JH, Wright JH, Yogo M. A Survey of Weak Instruments and Weak Identification in Generalized Method of Moments. Journal of Business & Economic Statistics. 2012;20(4):518–529. doi: 10.1198/073500102288618658. [DOI] [Google Scholar]
- 23.Voight BF, Peloso GM, Orho-Melander M, et al. Plasma HDL cholesterol and risk of myocardial infarction: a mendelian randomisation study. Lancet. 2012;380(9841):572–580. doi: 10.1016/S0140-6736(12)60312-2. [DOI] [PMC free article] [PubMed] [Google Scholar]
- 24.Price AL, Patterson NJ, Plenge RM, Weinblatt ME, Shadick NA, Reich D. Principal components analysis corrects for stratification in genome-wide association studies. Nat Genet. 2006;38(8):904–909. doi: 10.1038/ng1847. [DOI] [PubMed] [Google Scholar]
- 25.Burgess S, Davies NM, Thompson SG, EPIC-InterAct Consortium Instrumental variable analysis with a nonlinear exposure-outcome relationship. Epidemiology. 2014;25(6):877–885. doi: 10.1097/EDE.0000000000000161. [DOI] [PMC free article] [PubMed] [Google Scholar]
- 26.Do R, Willer CJ, Schmidt EM, et al. Common variants associated with plasma triglycerides and risk for coronary artery disease. Nat Genet. 2013;45(11):1345–1352. doi: 10.1038/ng.2795. [DOI] [PMC free article] [PubMed] [Google Scholar]
- 27.Nordestgaard BG, Varbo A. Triglycerides and cardiovascular disease. Lancet. 2014;384(9943):626–635. doi: 10.1016/S0140-6736(14)61177-6. [DOI] [PubMed] [Google Scholar]
- 28.Gupta M, Singh N, Verma S. South Asians and cardiovascular risk: what clinicians should know. Circulation. 2006;113(25):e924–e929. doi: 10.1161/CIRCULATIONAHA.105.583815. [DOI] [PubMed] [Google Scholar]
- 29.Barrett-Connor E. Sex differences in coronary heart disease. Why are women so superior? The 1995 Ancel Keys Lecture. Circulation. 1997;95(1):252–264. doi: 10.1161/01.cir.95.1.252. [DOI] [PubMed] [Google Scholar]
- 30.Rodgers RJ, Tschöp MH, Wilding JPH. Anti-obesity drugs: past, present and future. Dis Model Mech. 2012;5(5):621–626. doi: 10.1242/dmm.009621. [DOI] [PMC free article] [PubMed] [Google Scholar]
- 31.Pierce BL, Ahsan H, Vanderweele TJ. Power and instrument strength requirements for Mendelian randomization studies using multiple genetic variants. Int J Epidemiol. 2011;40(3):740–752. doi: 10.1093/ije/dyq151. [DOI] [PMC free article] [PubMed] [Google Scholar]
- 32.Hinke von S, Davey Smith G, Lawlor DA, Propper C, Windmeijer F. Genetic markers as instrumental variables. J Health Econ. 2016;45:131–148. doi: 10.1016/j.jhealeco.2015.10.007. [DOI] [PMC free article] [PubMed] [Google Scholar]
Associated Data
This section collects any data citations, data availability statements, or supplementary materials included in this article.