

Abstract
Improving the accuracy of prediction of gene starts is one of a few remaining open problems in computer prediction of prokaryotic genes. Its difficulty is caused by the absence of relatively strong sequence patterns identifying true translation initiation sites. In the current paper we show that the accuracy of gene start prediction can be improved by combining models of protein-coding and non-coding regions and models of regulatory sites near gene start within an iterative Hidden Markov model based algorithm. The new gene prediction method, called GeneMarkS, utilizes a non-supervised training procedure and can be used for a newly sequenced prokaryotic genome with no prior knowledge of any protein or rRNA genes. The GeneMarkS implementation uses an improved version of the gene finding program GeneMark.hmm, heuristic Markov models of coding and non-coding regions and the Gibbs sampling multiple alignment program. GeneMarkS predicted precisely 83.2% of the translation starts of GenBank annotated Bacillus subtilis genes and 94.4% of translation starts in an experimentally validated set of Escherichia coli genes. We have also observed that GeneMarkS detects prokaryotic genes, in terms of identifying open reading frames containing real genes, with an accuracy matching the level of the best currently used gene detection methods. Accurate translation start prediction, in addition to the refinement of protein sequence N-terminal data, provides the benefit of precise positioning of the sequence region situated upstream to a gene start. Therefore, sequence motifs related to transcription and translation regulatory sites can be revealed and analyzed with higher precision. These motifs were shown to possess a significant variability, the functional and evolutionary connections of which are discussed.
INTRODUCTION
Developing ab initio computer methods for gene finding has a rather long history initiated by the works of Fickett (1), Gribskov et al. (2) and Staden (3). Several frequently used techniques employ a local Bayesian approach analyzing one sequence ‘window’ or one open reading frame (ORF) at a time. In doing so, protein-coding regions are represented by inhomogeneous three-periodic Markov models, either fixed order (4,5) or interpolated (6,7). Other techniques use a global approach and find maximum likelihood sequence parse with regard to specified Hidden Markov model (HMM), either uniform one (8), or one with duration (9). Many current gene finding methods are highly accurate in detecting ORFs in which prokaryotic genes reside. Acceleration of microbial genome sequencing has led to a high need for gene finding methods using non-supervised training. Non-supervised training procedures were described for methods using a local approach, such as GeneMark or Glimmer (7,10–12). A non-supervised training procedure utilizing models with heuristically built pseudocounts was proposed for GeneMark.hmm, a method using a global maximum likelihood approach (13). Non-supervised training may include clustering routines to build models for the atypical gene class, which is assumed to be populated with genes horizontally transferred into a given microbial genome in the course of evolution (10). A different type of non-supervised training method based on sequence similarity searches is used by the ORPHEUS program (14).
Detecting a gene as a protein-coding ORF with an ‘open’ start still does not provide full information for gene annotation. Although several procedures for gene start prediction accuracy have been described (8,9,14–16), verification of the actual accuracy of these methods has been hampered by an insufficient number of experimentally validated translation starts and, therefore, a deficit of reliable data for training and testing. In the absence of a reliable computer procedure for gene start prediction, the rule of the ‘longest ORF’ was frequently applied to annotate complete microbial genomes with gene start assigned to the 5′-most ATG codon (see Table 1). A simple estimate of the accuracy of this rule can be derived as follows. Let us assume that a model of DNA sequence situated upstream of a real translation start is a multinomial model sequence with probabilities of occurrence of nucleotides T, C, A and G, estimated by their observed frequencies in non-coding DNA and designated as fT, fC, fA and fG, respectively. The probability, P, that a 5′-most ATG in a given ORF is a real translation start is provided then by the formula:
Table 1. Characteristics of 34 completely sequenced microbial genomes available in GenBank.
| Species |
Date submitted |
G + C (%) |
Base pairs |
Number of genes |
Number of genes whose starts are not leftmost
start codon |
|
Synechocystis PCC6803 |
1997 |
47.7 |
3 573 470 |
3163 |
0 (0%) |
|
Aeropyrum pernix |
1999 |
56.3 |
1 669 695 |
2694 |
1 (0%) |
|
Mycoplasma pneumoniae |
1996 |
40.0 |
816 394 |
677 |
2 (0%) |
|
Rickettsia prowazekii |
1998 |
29.0 |
1 111 523 |
833 |
4 (0%) |
|
Borrelia burgdorferi |
1997 |
28.6 |
910 724 |
850 |
4 (0%) |
|
Pyrococcus horikoshii |
1998 |
41.9 |
1 738 505 |
2058 |
8 (0%) |
|
Methanococcus jannaschii |
1998 |
31.4 |
1 664 970 |
1715 |
12 (1%) |
|
Aquifex aeolicus |
1997 |
43.5 |
1 551 335 |
1522 |
21 (1%) |
|
Haemophilus influenzae
Rd |
1995 |
38.1 |
1 830 138 |
1709 |
33 (2%) |
|
Vibrio cholera |
2000 |
47.7 |
2 961 149 |
2736 |
61 (2%) |
|
Mycoplasma genitalium |
1995 |
31.7 |
580 074 |
480 |
12 (3%) |
|
Ureaplasma urealyticum |
2000 |
25.5 |
751 719 |
611 |
17 (3%) |
|
Campylobacter jejuni |
2000 |
30.5 |
1 641 481 |
1653 |
55 (3%) |
|
Archaeoglobus fulgidus |
1997 |
48.6 |
2 178 400 |
2407 |
79 (3%) |
|
Chlamydia muridarum |
2000 |
40.3 |
1 069 412 |
909 |
34 (4%) |
|
Chlamydia trachomatis |
1998 |
41.3 |
1 042 519 |
892 |
36 (4%) |
|
Helicobacter pylori
26695 |
1997 |
38.9 |
1 667 867 |
1566 |
64 (4%) |
|
Chlamydia pneumoniae |
1998 |
40.6 |
1 230 230 |
1052 |
62 (6%) |
|
Methanobacterium thermoautotrophicum |
1997 |
49.5 |
1 751 377 |
1869 |
120 (6%) |
|
Pyrococcus abyssi |
1999 |
44.7 |
1 765 118 |
1763 |
124 (7%) |
|
Escherichia coli |
1998 |
50.8 |
4 639 221 |
4288 |
288 (7%) |
|
Helicobacter pylori
J99 |
1999 |
39.2 |
1 643 831 |
1478 |
114 (8%) |
|
Buchnera sp. APS |
2000 |
26.3 |
640 681 |
564 |
49 (9%) |
|
Thermotoga maritima |
1999 |
46.2 |
1 860 725 |
1846 |
159 (9%) |
|
Deinococcus radiodurans |
1999 |
67.0 |
2 648 638 |
2580 |
229 (9%) |
|
Halobacterium sp.
NRC-1 |
2000 |
67.9 |
2 014 239 |
2058 |
221 (11%) |
|
Treponema pallidum |
1998 |
52.8 |
1 138 011 |
1031 |
133 (13%) |
|
Xylella fastidiosa |
2000 |
52.7 |
2 679 306 |
2766 |
392 (14%) |
|
Neisseria meningitidis
Z2491 |
2000 |
51.8 |
2 184 406 |
2143 |
320 (15%) |
|
Mycobacterium tuberculosis |
1998 |
65.6 |
4 411 529 |
3909 |
697 (18%) |
|
Bacillus subtilis |
1997 |
43.5 |
4 214 814 |
4097 |
786 (19%) |
|
Thermoplasma acidophilum |
2000 |
46.0 |
1 564 906 |
1478 |
321 (22%) |
|
Bacillus halodurans |
2000 |
43.7 |
4 202 353 |
4066 |
888 (22%) |
| Pseudomonas aeruginosa | 2000 | 66.6 | 6 264 403 | 5565 | 1381 (25%) |
The last column indicates the percentage of genes whose annotated start codons are located inside the longest possible ORF, and not at its 5′ end.
P = 1 – fATG/(fATG + fTAA + fTAG + fTGA), where fXYZ = fXfYfZ.
Further refinement of this formula is possible for more complex DNA sequence models. If nucleotide frequencies are equal to each other, then P = 0.75. This value may serve as an estimate of the accuracy of the ‘longest ORF’ rule for a large number of genomes. This level does not seem to be sufficient. The computer procedures described earlier for annotating gene starts (8,9,14–16) use, in most cases, the model of the ribosomal binding site (RBS), either derived by supervised training or inferred from prior knowledge of the species 16S rRNA sequence. The GeneMark and GeneMark.hmm programs use the RBS model (9,17) in a form of positional nucleotide frequency matrix, motif, whose parameters are derived by Gibbs sampling multiple alignment of DNA sequences situated upstream of annotated translation starts. The new program GeneMark.hmm 2.0 additionally uses a probability distribution of the length of a spacer, the sequence between the last nucleotide of the RBS sequence and the first nucleotide of a gene. Typically in prokaryotes, the consensus RBS sequence is complementary to a section of 3′-terminal sequence of 16S rRNA. The Frame-by-frame program (15) does not explicitly use an RBS model. It employs a HMM with several hidden states modeling the trinucleotide frequency pattern specific for sequences immediately upstream, upstream sequence, and downstream of a translation start site. Note that it has been argued that a downstream sequence pattern is not related to the mechanism of ribosome binding, but rather to the bias in composition of amino acid sequences proximal to the protein N-terminal (18). The RBS model is also used by the ORPHEUS program (14). Unlike the GeneMark programs, ORPHEUS uses a weight matrix model of RBS with positional frequencies normalized by the frequency of the most probable nucleotide in a given position. The ORPHEUS model also takes into account the pattern of the spacer length variation. The model is built from the multiple alignment of a set of sequences located upstream (–1 to –20) of predicted protein-coding ORFs selected by the criteria that their starts are both located relatively far from alternative start codons and are not overlapped by other predicted genes. Gene start prediction includes extension of an ORF seed, detected by protein sequence similarity search, to the 5′-most likely start codon. Another method of using the RBS model for gene start prediction was mentioned recently (16), albeit in much less detail than for the ORPHEUS. Glimmer 2.02 assigns, by default, the predicted gene start to the start codon of the longest ORF containing predicted coding region. Optionally, as described in the program documentation, Glimmer 2.02 computes the maximum value of hybridization energy between a fragment of 16S rRNA and any fixed length region located in front of a possible start codon. If this value exceeds a certain threshold and the maximum values defined for all other alternative starts then the codon in question is selected as a predicted gene start.
In this paper, we describe a new non-supervised iterative method, GeneMarkS, performing gene finding in prokaryotic DNA with a specific focus on identifying gene starts. This method makes use of heuristic Markov models of protein-coding regions as well as algorithms developed in our earlier projects on GeneMark and GeneMark.hmm (5,9,13). The Gibbs sampling multiple alignment program (19) is also used as a part of an iterative routine that creates a two-component statistical model of a conserved in evolution site situated in upstream sequence. The two components are the positional frequency matrix, a motif and the spacer length distribution. This two-component model is included in the set of models used by the new v2.0 of GeneMark.hmm. GeneMarkS runs the GeneMark.hmm program iteratively and finds a maximum likelihood parse of a given anonymous sequence into protein-coding and non-coding regions, given the models. Newly predicted sequence parse is utilized to update the models used in the next iteration. This process runs until convergence, in terms of achieving a change in the sequence parses, obtained in two subsequent iterations, less than some predefined small value. The iterative GeneMarkS procedure can be applied to anonymous genomic DNA without prior knowledge of any protein or rRNA coding genes.
By means of its design, besides the ability to find prokaryotic genes and derive models of coding and non-coding regions, GeneMarkS is able to detect functional sites in upstream sequences (such as a RBS) and derive their models. Many algorithms for detecting various DNA functional sites, including RBS, have been described (17,20–30). In the context of gene finding, the separately derived RBS model was used at a post-processing step for further refinement of predicted genes (GeneMark.hmm, Glimmer, ORPHEUS). Here, we emphasize that GeneMarkS is an integrated procedure where parameters of the model for an upstream functional site are derived and refined in the process of adjusting all models used in the gene prediction algorithm in parallel with gene prediction.
In testing selected genomic sequences with reliably annotated genes we have demonstrated that GeneMarkS performance matches or exceeds currently known standards and, therefore, GeneMarkS can be used as a single or alternative tool for annotation of newly sequenced prokaryotic genomes.
The ability of GeneMarkS to detect and model functional sites in translation start upstream sequences may lead to a better understanding of translation initiation mechanisms of prokaryotic cells. Particularly, as a rather surprising observation, the GeneMarkS program was able to elucidate transcription initiation related sequence motifs in archaeal genomes Pyrobaculum aerophilum, Aeropyrum pernix (M.Slupska, A.King, S.Fitz-Gibbon, J.Besemer, M.Borodovsky and J.Miller, in press) and Archaeoglobus fulgidus.
MATERIALS AND METHODS
Genome sequence data
Sequence data used in the current study include the following genomes available in the GenBank database: A.pernix (31), A.fulgidus (32), Bacillus subtilis (33), Escherichia coli (34), Haemophilus influenzae (35), Helicobacter pylori (36), Methanobacterium thermoautotrophicum (37), Methanococcus jannaschii (38), Mycobacterium tuberculosis (39), Synechocystis PCC6803 (40).
Additional sequence sets
The GenBank annotation of complete prokaryotic genomes is frequently used as a benchmark for gene finding accuracy tests. However, a simple analysis of GenBank annotation of complete prokaryotic genomes has provided compelling evidence of a systematic bias towards gene start annotation by the longest ORF rule (Table 1). This bias is most pronounced in the genomes listed in the top half of Table 1, with almost all genes annotated as the longest ORFs (with only ATG considered as a possible start codon). On the opposite end of the spectrum (Table 1, bottom), are several prokaryotic genomes whose annotated genes coincide with the longest ORFs in ∼80% of cases.
Unless a special translation mechanism is involved, no specific reason is seen to justify the ubiquitous absence of in frame start codons in a DNA sequence located between the start of a gene annotated as the longest ORF and the first upstream stop codon. Since such a mechanism is not known and may not exist, the GenBank annotation, particularly for genomes from the top half of Table 1, should be used with caution. We assume that the B.subtilis genome is one of a few annotated complete genomes that can be used to assess the accuracy of a gene finding method targeting the gene starts. To assess the robustness of the GeneMarkS prediction accuracy with regard to gene length we used several sets of short genes that were culled from the B.subtilis genomic sequence and verified by protein similarity search. In another test of accuracy of gene start prediction we used a set of 195 E.coli genes whose starts were experimentally confirmed by sequencing of N-termini of their protein products (41).
GeneMarkS algorithm outline
The step-wise diagram of sequence data processing and model training is shown in Figure 1. In the first step, the parameters of heuristic Markov models are determined by a method described earlier (13). The set of heuristic models includes a three-periodic second order Markov model of protein-coding sequence and a second order homogeneous Markov model of non-coding sequence. Transition and initial probability parameters of heuristic models can be estimated from a sample DNA sequence as short as 400 nt (13). This approach uses previously tabulated linear dependencies between codon position specific frequency of a given nucleotide and its global frequency, as well as linear dependencies between frequency of a given amino acid in the species proteome and the GC% of a genome. Parameters of these linear functions were determined by regression analysis of 17 complete bacterial genomes (13).
Figure 1.

Step-by-step diagram of the GeneMarkS procedure.
The set of heuristic models also includes length distributions of coding and non-coding regions described either analytically or numerically. The accuracy of the algorithm was shown to be rather insensitive to species-specific variations in these length distributions (data not shown). Therefore, in the program we used the length distributions derived from GenBank annotation of the E.coli genome.
The new v2.0 of the GeneMark.hmm gene prediction algorithm was used at several iterations of consecutive gene finding and model refinement. The Gibbs sampling procedure was applied in each iteration to align upstream sequences of predicted genes. The ungapped multiple alignment singled out conservative sites situated upstream to gene starts. A positional nucleotide frequency model of this site along with a length distribution of the spacer was used in the GeneMark.hmm 2.0 program to identify gene starts.
The v2.0 of GeneMark.hmm has the capability of predicting genes with overlaps of arbitrary length (Fig. 2). The new version also integrates the two-component models of upstream conservative region, the positional nucleotide frequency model and spacer length distribution into the Viterbi algorithm. In comparison, previously described GeneMark.hmm (9) uses the positional frequency model of RBS at a post-processing step.
Figure 2.

(A) In the process of GeneMarkS training there is no division of the coding sequence into two clusters. However, in applying the GeneMark.hmm 2.0 program, the model of coding region derived by GeneMarkS can be used as the Typical model along with a heuristic model used as the Atypical model (see Table 3). For simplicity, only the direct strand is shown. (B) In this simplified diagram of hidden state transitions in GeneMark.hmm 2.0, the state ‘gene’ represents a sequence composed of an RBS plus a spacer plus the protein-coding sequence (CDS). Gene overlaps encompass all possible types of superpositions: overlap of genes on the same strand (as observed in operons), overlap of genes on opposite strands, overlap of coding region with RBS, and so on.
The set of heuristic models defined in the first step does not contain a model for the conservative site located upstream to gene start (i.e. RBS). Still, the algorithm parsed the full length of an input sequence into coding and non-coding regions and provided the first approximation for the gene starts (Fig. 1). Given this information, a set of upstream sequences was selected. The length of upstream sequence is an algorithm parameter. In our computations it was chosen to be equal to either 25 or 50 nt. Note that use of just a subset of upstream sequences might be sufficient for model derivation. A set of genes whose starts are located at a certain distance (i.e. at least 50 nt) from a preceding gene may constitute such a subset. The upstream sequences of these genes presumably contain conservative functional sites not overlapped by coding regions. The site motif extracted from such a sequence set is a priori expected to be more pronounced. Note that this conjecture was found to be in agreement with sequence analysis results cited below. A set of upstream sequences, selected by default not to contain predicted coding regions, was aligned without gaps by the Gibbs sampling procedure (19,24) that identified the multiple alignment window with the highest information content (24). From this window-wide block of the multiple sequence alignment one could immediately define the positional frequency matrix model, a motif, for the conserved functional site located upstream to translation start and called hereafter a prestart signal. When 25 nt long upstream sequences were used, the alignment usually revealed a motif with consensus sequence complementary to a portion of 16S rRNA of the species under study. However, if 50 nt long upstream sequences were used, in some species, as shown below, the alignment procedure identified motifs typical for promoter related sites.
The length of the spacer defines the precise location of a prestart signal with regard to a translation start. Therefore, two models described the prestart signal, the motif or positional frequency matrix, and the spacer length frequency distribution. In each step of the GeneMarkS training, these two models were derived by means of Gibbs sampling multiple alignment of prestart sequences defined at a previous run of GeneMark.hmm 2.0. In turn, the GeneMark 2.0 program was using the prestart motif and spacer length distribution in all steps but the first (Fig. 1). At this first step the program was run with just heuristic models of coding and non-coding regions and generated the first sequence parse into coding and non-coding regions. The Markov models of coding and non-coding regions derived at all subsequent steps of the regular cycle are called pseudonative models, since they were derived from real DNA sequences classified in silico as coding and non-coding regions. The pseudonative models capture the species-specific oligonucleotide frequency patterns more closely than heuristic models (13).
The set of predicted starts was used in each iteration to determine the fractions of particular types of the start codons ATG, GTG, CTG, TTG. The updated set of frequencies was used in GeneMark.hmm 2.0 at the next iteration.
The GeneMarkS iterations were repeated until the sequence parse was either 99% identical to that of the previous iteration or until the percentage of identity started to fluctuate around some reasonably high level. The sequence parse generated in the final iteration run was the program output along with the models derived and refined up to that point. Note that the Atypical gene model being a part of the original GeneMark.hmm program (9) was effectively switched off in the GeneMarkS iterations. Therefore, the Markov model of protein-coding region produced by GeneMarkS has to be considered as a Typical gene model. Note that there is an interesting option of using the heuristic model in place of an Atypical gene model. We address this issue below.
The GeneMarkS procedure is not restricted to deriving and using Markov models of just the second order. It can build models of higher orders, if deemed reasonable for applications. However, similarly to observations reported earlier (9), in our GeneMarkS tests no significant gain in accuracy was achieved by using higher order models (data not shown). The robustness of the second order models is expected for the prokaryotic type of gene organization with frequent long non-interrupted protein-coding regions. These genes are detectable by low order models due to the ability of the maximum likelihood framework of GeneMark.hmm to accumulate the ‘coding region signal’ within a long ORF even when a lower order model with a low signal-to-noise ratio is used.
RESULTS AND DISCUSSION
Accuracy of gene detection
First we discuss the accuracy of detecting genes or predicting protein coding ORFs with ‘open starts.’ Traditionally, the accuracy of prokaryotic gene finding tools was characterized by their performance in identifying unique markers of prokaryotic genes, their 3′ ends. The GeneMarkS program was run on eight anonymous prokaryotic sequences representing the complete genomes of A.fulgidus, B.subtilis, E.coli, H.influenzae, H.pylori, M.jannaschii, M.thermoautotrophicum and Synechocystis. Upon completing the GeneMarkS iterations, a special run of GeneMark.hmm 2.0 was performed. In this run the newly derived Markov model of protein-coding region was used as a Typical gene model along with another two models derived by GeneMarkS for a prestart signal, positional frequency matrix and spacer length distribution. In addition, to complete a set of models that could be used in GeneMark.hmm 2.0, we utilized an Atypical gene model and the model of non-coding region defined by heuristic methods (13). The 3′ ends of predicted genes were compared with the 3′ ends of genes annotated in GenBank. The figures characterizing sensitivity and specificity of predictions for all eight genomes are shown in Table 2. The figures indicate quite high accuracy for a self-trained single sequence gene finder.
Table 2. Gene prediction accuracy of the GeneMark.hmm program using the protein-coding model derived by GeneMarkS as the Typical gene model and a heuristic model as the Atypical gene model, the model for non-coding sequence is also heuristically derived.
| Gene detection accuracy | ||||
| |
Genes annotated |
Genes detecteda |
Sn (%) |
Sp (%) |
| A.fulgidus | 2406 | 2583 | 98.5 | 91.8 |
| B.subtilis | 4099 | 4445 | 98.8 | 91.1 |
| E.coli | 4288 | 4397 | 96.9 | 94.5 |
| H.influenzae | 1708 | 1807 | 98.2 | 92.8 |
| H.pylori | 1552 | 1753 | 97.7 | 86.5 |
| M.jannaschii | 1714 | 1891 | 99.4 | 90.1 |
| M.thermoautotrophicum | 1868 | 1935 | 97.9 | 94.5 |
| Synechocystis | 3168 | 3521 | 98.7 | 88.8 |
| Average | 98.3 | 91.3 |
aNumber of predictions that match the 3′ end of GenBank annotated genes, with possible misplacement of the 5′ end, as a percentage of the number of annotated genes.
Accuracy of precise gene prediction
One test of the GeneMarkS performance in precise gene prediction was done with the complete B.subtilis genome. The advance of the procedure through the iterations is illustrated in the left half of Table 3. At the first iteration the GeneMark.hmm 2.0 with heuristic models of the B.subtilis coding and non-coding sequence detected 98.0% of the 4099 genes as annotated in GenBank. However, with the RBS module of the program switched off, gene starts were precisely predicted for only 56.6% of the genes. Generation and addition of the RBS model raised the percentage of genes precisely predicted to 80.8%, while the percentage of genes detected, 98.1%, was about the same. At the next step, generation and use of pseudonative models allowed to make precise prediction of 83.1% of all B.subtilis genes while the percentage of detected genes decreased to 97.0%. This change in the number of genes detected confirmed the earlier observation that the heuristic models used in GeneMark.hmm program are able to detect genes of Typical and Atypical classes (13). This increase in sensitivity of heuristic models, however, is achieved at the cost of some decrease in specificity. After three regular cycles the percentage of predictions identical to the previous ones reached 99% and the iterations stopped. At this final step 4224 genes were predicted. From comparison with genes annotated in GenBank it appeared that 83.2% of B.subtilis genes were predicted precisely while 96.7% of the annotated genes were detected. The RBS motif and the spacer length distribution as derived by GeneMarkS are shown in Figure 3A and B in the form of a sequence logo (42) and a line graph, respectively. Previously reported figures of the accuracy of precise prediction of B.subtilis genes were as follows. Frame-by-frame program (15) identified 85.8% of gene starts and ORPHEUS (14) predicted 80.2% of gene starts in a test set of 346 genes. Comparison of the accuracy figures indicates that GeneMarkS, a self-training procedure, is a reasonable alternative to both the frame-by-frame program, which utilizes for training a significant number of previously annotated sequences, and ORPHEUS, which utilizes for non-supervised training datasets compiled from sequence comparisons to a comprehensive database of known protein sequences.
Table 3. Parameters of GeneMarkS prediction accuracy are shown in intermediate steps of the procedure as it runs for the entire B.subtilis genome and a set of 195 experimentally verified E.coli genes.
| Step | B.subtilis (whole genome) | E.coli (verified set) | |||
| |
Genes precisely
predicteda (%) |
Genes
detectedb (%) |
Potential new
genes (%) |
Genes precisely
predicteda (%) |
Genes
detectedb (%) |
| 2 | 56.6 | 98.0 | 11.7 | 67.2 | 100 |
| 4 | 80.8 | 98.1 | 7.2 | 85.1 | 99.5 |
| 4.1 | 83.1 | 97.0 | 6.3 | 94.4 | 100 |
| 4.2 | 83.5 | 96.8 | 6.4 | 94.4 | 100 |
| 4.3 | 83.2 | 96.7 | 6.4 | 94.4 | 100 |
aRefers to the case where both the 5′end and the 3′ end predictions match the annotation.
bRefers to the case where the 3′ end prediction (and not necessarily 5′ end prediction) matches the annotation.
Figure 3.
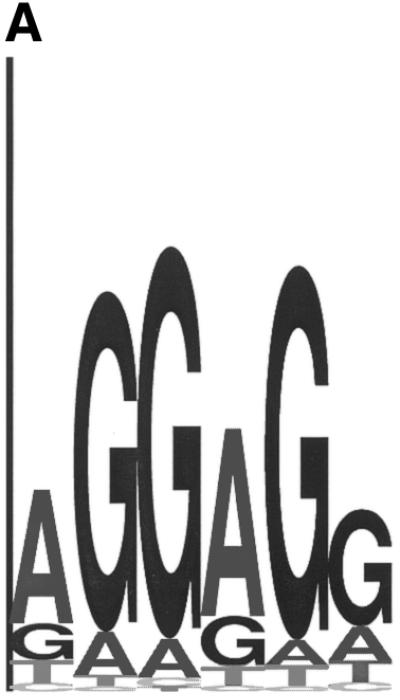

(A) Sequence logo representing the RBS positional frequency pattern detected by GeneMarkS in the analysis of B.subtilis genomic data. The total height of the four letters in each position indicates the position specific information content, while the height of each letter is proportional to the nucleotide frequency (42). (B) Graph of probability distribution of spacer length, the sequence between the RBS sequence and the gene start.
A similar test on the entire E.coli genome showed that GeneMarkS predictions matched the GenBank annotation of gene starts in only 69.7% of cases. However, given the lack of data on verified gene starts this figure should be taken with caution. In a more realistic test we used the set of 195 E.coli genes whose starts were experimentally validated by protein N-terminal sequencing (41). Table 3 (right half) presents a detailed account of this test, iteration by iteration. At the final step, 184 of the 195 genes were precisely predicted (94.4%) and all 195 (100%) were detected. Here the following reservation should be noted. Analysis of the GeneMark scores for these 195 E.coli genes (5) showed that the proportion of genes with high scores, indicating higher codon usage bias and, presumably, higher expression level, was slightly elevated in comparison with an average score distribution for E.coli gene set of the same size. Therefore, the accuracy figures might be slightly elevated as well.
Short genes
To distinguish short genes from random ORFs is notoriously difficult. In order to test the ability of GeneMarkS to find short genes, we used 476 B.subtilis genes with lengths of 300 nt or shorter, as annotated in GenBank. Three subsets of this set were compiled with regard to the results of the analysis of their protein products by BLAST (43). The first set included 123 genes whose protein products possessed at least one significant sequence similarity with known proteins (with E-value <1e–4). Note that any hits to B.subtilis proteins or to proteins annotated as ‘putative’ or ‘hypothetical’ were ignored. The second set comprised 72 genes with at least two strong similarities at a protein level. The third set, with 52 genes, included those genes whose protein products had at least 10 strong similarities to known proteins.
The percentage of genes precisely predicted and genes detected by GeneMarkS in each of these sets are cited in Table 4. It is seen that the accuracy parameters do not change noticeably for short genes as compared to the whole gene set. Therefore, these data demonstrate the robustness of the program performance with regard to gene length.
Table 4. Comparison of the GeneMarkS, Glimmer 2.02 and ORPHEUS gene prediction programs on the following test sets: the B.subtilis genome as annotated in GenBank (A); three sets of B subtilis genes shorter than 300 nt with at least one (B), at least two (C) and at least 10 (D) significant homologies determined by BLAST analysis; and a set of 195 experimentally validated E.coli genes (E).
| Program |
Test Set |
Genes in test set |
Genes precisely
predicteda |
Genes detectedb
(3′ end) |
| Glimmer | A | 4099 | 2556 (62.4%) | 4023 (98.1%) |
| ORPHEUS | A | 3028 (73.9%) | 3484 (85.0%) | |
| GeneMarkS | A | 3412 (83.2%) | 3962 (96.7%) | |
| Glimmer | B | 123 | 70 (57.0%) | 112 (91.1%) |
| GeneMarkS | B | 102 (82.9%) | 113 (91.9%) | |
| Glimmer | C | 72 | 41 (57.0%) | 66 (91.7%) |
| GeneMarkS | C | 64 (88.9%) | 68 (94.4%) | |
| Glimmer | D | 51 | 26 (51.0%) | 45 (88.2%) |
| GeneMarkS | D | 46 (90.2%) | 48 (94,1%) | |
| Glimmer | E | 195 | 139 (71.3%) | 195 (100%) |
| ORPHEUS | E | 148 (75.9%) | 181 (92.8%) | |
| GeneMarkS | E | 184 (94.4%) | 195 (100%) |
Numbers in bold indicate the highest number of genes detected or genes precisely predicted for each test set.
aRefers to the case where both the 5′ end and the 3′ end predictions match the annotation.
bRefers to the case where the 3′ end prediction (and not necessarily 5′ end prediction) matches the annotation.
Comparison with other programs
To compare GeneMarkS performance with that of Glimmer and ORPHEUS we had to download and run these two programs. Glimmer 2.02 was run following the instructions given in the distribution file. Note that as far as gene detection is concerned, the Glimmer 2.02 run with default parameters detected significantly more genes than annotated both for B.subtilis and E.coli. While some of these predictions might detect real genes not annotated in GenBank, it might be unrealistic to assume that the percentage of real genes omitted in GenBank is so large. Still, we did not change the default parameters of Glimmer chosen by its authors as a design decision (7). To get precise gene predictions, Glimmer 2.02 uses ribosome-binding free energy computations. This feature requires prior data on 16S rRNA sequences for a given species. The 16S rRNA sequence was supplied for each species. The option of using ribosome-binding free energy is commented on in Glimmer documentation as ‘not fully tested.’ However, we observed that Glimmer results always improved when this feature was turned on; thus, this option was turned on.
Before running ORPHEUS, a non-redundant protein database was created by merging the updated SWISS-PROT, TrEMBL and PIR databases aided by the NRDB2 software (W.Gish, unpublished material). The default parameter settings of ORPHEUS preclude finding genes <105 nt. However, there were no genes <210 nt in the E.coli test set as well as in the set of short B.subtilis genes: the shortest was 114 nt long.
For the whole B.subtilis genome Glimmer 2.02 detected 98.1% of the annotated genes, while GeneMarkS detected 96.7% and ORPHEUS detected 85% (Table 4). In turn, GeneMarkS precisely found 83.2% of the genes while ORPHEUS made precise predictions for 73.9% of the genes and Glimmer for 62.4%. Note that GeneMarkS at an intermediate step (step 4.1, Fig. 1) produced nearly identical results to those of Glimmer, in terms of genes detected (Table 3). At this step GeneMark.hmm 2.0 used heuristic Markov models and detected 98.1% of the annotated B.subtilis genes. Still, GeneMark.hmm 2.0 at this step made 4316 gene predictions compared to 5075 predictions made by Glimmer 2.02.
For the 195 experimentally verified E.coli genes, both GeneMarkS and Glimmer 2.02 detected all of the genes (Table 4). GeneMarkS identified precisely 94.4% of gene starts, while ORPHEUS and Glimmer 2.02 precisely predicted positions of gene starts in 75.9 and 71.3% of cases, respectively.
For the sets of short B.subtilis genes (as shown in Table 4) predictions made by GeneMarkS appeared to be more accurate than those made by Glimmer.
As far as gene detection is concerned we performed one more comparative test using genomes of E.coli and B.subtilis. We have already pointed out the transition from less precise predictions of a larger number of genes to the more precise prediction of smaller number of genes as the GeneMarkS iteration progress. This change is accounted for by a gradual transition in a process of training from more sensitive and less specific heuristic models to more specific and slightly less sensitive pseudonative models. Essentially, this transition gives GeneMarkS more power to find genes of the typical class while losing some of the ability to find atypical genes.
To combine the strength of heuristic and pseudonative models, we used the models simultaneously in an additional run of GeneMark.hmm 2.0 as described above (see Table 2). The results obtained with this program setting for the B.subtilis and E.coli genomes are also illustrated in Figure 4 where GeneMark.hmm 2.0 predictions are compared, in gene detection terms, with GenBank annotation of these two bacterial genomes and with predictions made by Glimmer 2.02.
Figure 4.

Venn diagram showing group relationships between the GenBank annotation and sets of genes detected by GeneMark.hmm 2.0 and Glimmer 2.02 for the B.subtilis genome (A) and the E.coli genome (B).
Functional and evolutionary variability of motifs in upstream sequences
GeneMarkS provides new opportunities for studying sequence patterns in regions situated upstream to gene starts. In many prokaryotic genomes, the upstream sequence carries a functional site (i.e. an RBS site) characterized by both nucleotide frequency motif (Fig. 3A) and the spacer length distribution (Fig. 3B).
Interestingly, the GeneMarkS derived model of upstream signal may vary depending on the genome under study and on the setting of program parameters. As is shown below, the set of upstream sequences might be inhomogeneous. In general, if different subsets of the set of upstream sequences contribute to different sections of the sequence motif, the ungapped multiple alignment via Gibbs sampling is not quite suitable for deriving the pattern. However, there might be some interesting pattern configurations where the method still works. Below we discuss the details of the analysis separately for bacterial species and for two groups of archaeal species, Euryarchaeota and Crenarchaeota.
In studied bacterial genomes multiple alignment of either 25 or 50 nt long upstream sequences led to extraction of a pronounced RBS motif, similar to one shown for the B.subtilis genome (Fig. 3). However, there are still several concerns. One is a possible variability of RBS sequences within one genome. To explore this possibility we performed additional analysis of several data sets. We selected a set of gene starts overlapped by a preceding gene on the same strand. Note that a same strand gene overlap of 4 nt was observed as the most frequent gene overlap. We scanned and characterized hexamers in the set of upstream sequences by log-odds scores derived from the RBS motif and the background model. The background model was an ordinary Markov model of a coding region for the case of overlapping genes. For non-overlapped starts it was an ordinary Markov model of non-coding sequence. By identifying the putative RBS as one with a maximum score within 50 nt upstream region, we made the following observations for the B.subtilis, E.coli and M.jannaschii genomes. The distribution of scores of RBS sites overlapped by the preceding coding region did not differ significantly in comparison with non-overlapped ones (Fig. 5). The spacer length distribution of overlapped RBS did exhibit a three periodicity (data not shown), which the overall spacer length distribution is lacking completely (Fig. 3B).
Figure 5.


Distributions of log-odds scores of RBS sites, as detected by GeneMarkS, in sets of overlapping and non-overlapping of genes of (A) B.subtilis, (B) E.coli and (C) M.jannaschii. As can be seen, the overlapping genes, which are likely to be located inside operons, frequently have strong RBS sites. Still, most strong sites of ribosome binding precede the non-overlapping genes (stand alone genes and genes leading operons). This tendency is much more apparent in the case of the archaeal genome of M.jannaschii than in the E.coli and B.subtilis genomes.
As an extension of this analysis we derived RBS motifs for sets of upstream sequences related to overlapped gene starts. In several cases significant differences between these motifs and ones derived for non-overlapping starts were observed. Interestingly, for the M.tuberculosis genome the RBS motif derived for genes overlapped by 4 nt by the preceding gene was more pronounced than RBS motif derived for non-overlapping genes. Note that the G+C richness of the M.tuberculosis genome makes RBS patterns difficult to detect (30,39).
The results of the GeneMarkS analysis of archaeal genomes were compatible with the notion that the transcription and translation machinery in Archaea is a complex mixture of eukaryotic and bacterial traits (44). The transcription initiation machinery of Archaea contains much similarity to Eukarya. Particularly, basic initiation factors TFIIB and TFIID as well as eight ‘small’ subunits of the RNA polymerase show homology to their eukaryotic counterparts. Also, the eukaryotic TATA-box binding protein was shown to have homologous proteins in several archaeal species. On the other hand, translation initiation mechanisms in Bacteria and Archaea, although made up of different components, have long being considered functionally similar, centered on the processing of bacterial type polycistronic mRNA (45). The important difference between the archaeal and eukaryal mechanisms for translation initiation is the absence of archaeal homologs of proteins involved in eukaryotic mRNA CAP recognition.
The GeneMarkS application to several archaeal genomes resulted in extracting either a TATA box or an RBS type motif as the model of the conservative site located in upstream sequence. This particular outcome was apparently related to the proportion of the first in operon and isolated genes relative to genes internal in operons. Competition of RBS and promoter sites in the alignment procedure could be excluded by a simple restriction of the length of upstream sequences. In particular, the length had to be at least 50 nt to detect the TATA box related pattern. For 25 nt long upstream sequences of non-overlapped genes the multiple alignment procedure usually produced the RBS type pattern. This result was observed for many archaeal species, but not for all of them.
In Crenarchaeota such as A.pernix and P.aerophilum we found that the TATA box was the only consistent pattern derived for the upstream sequences of non-overlapped genes. This result corroborated the experimentally observed strong bias to leaderless transcripts in P.aerophilum (M.Slupska, A.King, S.Fitz-Gibbon, J.Besemer, M.Borodovsky, J.Miller, in press). On the other hand, the set of upstream sequences for the sample of overlapping genes, presumably those internal in operons, was shown to exhibit the motif complementary to a portion of 16S rRNA. Note that for overlapping genes of A.pernix, GeneMarkS predicted almost equal frequencies of start codons ATG and GTG, an interesting bias not observed in any other species. Genomic sequences of another Crenarchaeote, Sulfolobus solfataricus, were analyzed earlier and detected duality of motifs found in upstream sequences suggested the presence of two distinct mechanisms for translation initiation (46).
Similarly, in upstream sequences of the hyperthermophile euryarchaeote A.fulgidus GeneMarkS detected both transcription and translation initiation related motifs (Figs 6 and 7). In particular, the predominant conservative motif in 50 nt long upstream sequences did not appear to be an RBS motif due to its incompatibility with any portion of 16S rRNA and localization around position –30 (Fig. 8). This motif has a consensus [G/A, G/A, A, A, A, A] and could be interpreted as a eukaryotic type promoter motif. This result was in striking contrast with that obtained for hyperthermophilic euryarchaeon M.jannaschii whose upstream motif, as determined by GeneMarkS, had a preference for locating on much shorter distance from gene start (Fig. 8) and was recognizable as an RBS motif by its consensus complementary to 16S rRNA sequence.
Figure 6.
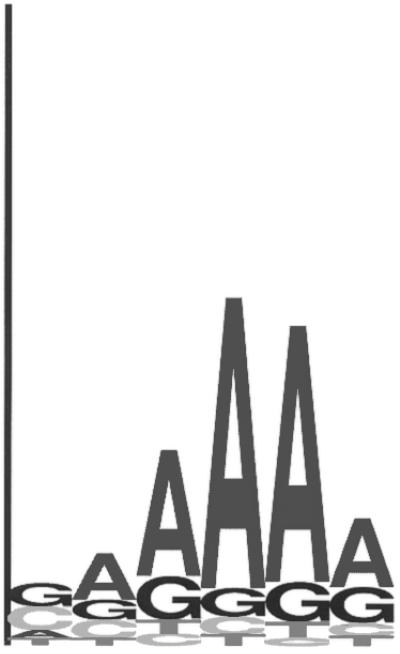
Sequence logo representing the upstream sequence motif detected by GeneMarkS for A.fulgidus. This consensus sequence is rather indicative of a eukaryotic-like promoter element, than an RBS signal as often found in prokaryotes. Sites that match this pattern are ubiquitous in A.fulgidus, although further analysis of a subset of upstream sequences reveals a second motif (see Fig. 7) complementary to the 3′ terminal section of the A.fulgidus 16S rRNA.
Figure 7.
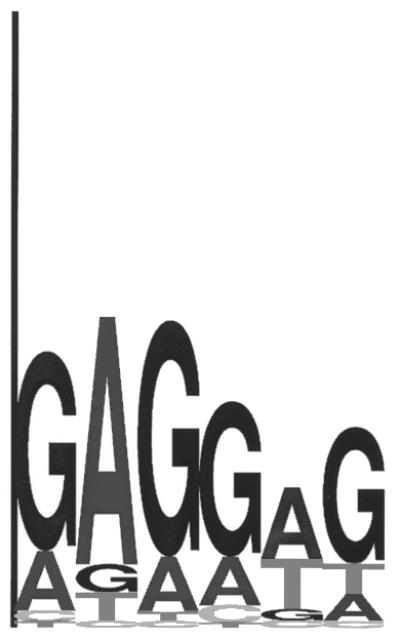
Sequence logo representing the RBS motif observed in a subset of upstream sequences of the A.fulgidus genome. This subset consisted of 50 nt long upstream sequences overlapping the 3′ end of the preceding gene. The consensus of this motif is complementary to a section of the A.fulgidus 16S rRNA.
Figure 8.

Distributions of spacer length for two species with strong RBS patterns, B.subtilis and E.coli (solid and dashed lines, respectively), and one species with a strong eukaryotic promoter-like pattern, A.fulgidus (dotted line). The promoter-like pattern of A.fulgidus is localized much further upstream of the start codon than the RBS patterns of B.subtilis and E.coli.
In a search for the RBS motif in the A.fulgidus genomic sequence, we performed Gibbs alignment for 25 nt long upstream sequences of overlapping genes which are more likely to reside inside operons. The A.fulgidus genome containing a relatively large number of gene overlaps allowed for further reduction of the set of selected upstream sequences by using only genes overlapped by their upstream neighbors by exactly 4 nt. Indeed, the Gibbs sampling alignment of this set of upstream sequences detected a motif with consensus complementary to the 3′ end of the A.fulgidus 16S rRNA (Fig. 7). This finding indicates that leaderless transcripts observed in Crenarcheota may also be present in some euryarchaeote species, while the fraction of leadered transcripts seems to be much higher.
Interestingly, in the recent NCBI annotation of euryarchaeote species Thermoplasma volcanium (ftp://ncbi.nlm.nih.gov/genomes/Bacteria/Thermoplasma_volcanium/), GeneMarkS program was used with the default length of the upstream sequence as 50 nt. Our test of running the GeneMarkS with a 25 nt long upstream sequence length led to very close results, with 98.4% of gene starts predicted at the same location.
In bacterial genomes we have observed that the Gibbs sampling alignment of 50 nt upstream sequences for non-overlapping genes converged to an alignment carrying the RBS motif. This observation suggested that promoter related motifs are pronounced to a lesser degree than the RBS motif.
Results generated by GeneMarkS in some cases reveal non-homogeneity of the set of sequences carrying RBS motif. We illustrate these results for the B.subtilis and M.thermoautotrophicum genomes in Figure 9A and B. In the case of B.subtilis two hexamers, AGGAGG and AGGTGA, can be superimposed within the Gibbs sampling multiple alignment of upstream sequences. Both hexamers are complementary to overlapping sections of the B.subtilis 16S rRNA. The hexamers have distinct preferences for location within mRNA with regard to gene starts (Fig. 9A). These preferences, incidentally, are such that binding of 16S rRNA to one or other hexamer will position the ribosome at the same linear distance from the translation initiation site. This interpretation of the observed data is also supported by the results of experimental mutational studies of the efficiency of translation initiation (47).
Figure 9.


(A) Distribution of spacer lengths observed in the B.subtilis genome for two different types of possible RBS hexamers: AGGAGG and AGGTGA. Multiple alignment allows these hexamers to be superimposed. In actual upstream sequences, these hexamers tend to occupy different locations relative to the start codon. This preference may be involved in the precise positioning of the ribosome at the translation initiation site when the 16S rRNA binds to mRNA. The more frequent hexamer was observed on average at a further distance from the gene start than the rare hexamer. (B) Distribution of spacer lengths observed in the M.thermoautotrophicum genome for two different types of RBS hexamers: GGAGGT and GGTGAT. Properties of these hexamers are similar to the two hexamers observed in the B.subtilis genome (A), except that more frequent hexamer is now found on average at a closer distance to the gene start than the rare hexamer.
Note that splitting the set of upstream sequences into two (or more) homogeneous subsets alludes to the fact that the whole set of genes of a particular species can be divided into two (or more) homogeneous classes, i.e. classes of Typical and Atypical genes. Still, further analysis did not provide any distinct evidence that use of a particular hexamer correlates with a gene type (data not shown).
For the archaeal genome of M.thermoautotrophicum the GeneMarkS analysis led to a similar observation of non-homogeneity of a set of upstream sequences, as illustrated in Figure 9B. Two hexamers, GGAGGT and GGTGAT, can be superimposed within the Gibbs sampling multiple alignment. Both hexamers are complementary to overlapping sections of the M.thermoautotrophicum 16S rRNA. Interestingly, in contrast with the B.subtilis case, more frequently the GGTGAT hexamer is located at a shorter distance from gene starts.
WWW resources
GeneMarkS is accessible via the Internet at http://dixie.biology.gatech.edu/GeneMark/ genemarks.cgi. The input sequence is analyzed by GeneMarkS and the final predictions are returned to the user through email. A database of the predictions made by GeneMarkS for many publicly available prokaryotic genomes is available at http://dixie.biology.gatech.edu/ GeneMark/GeneMarkS/. The three sets of short B.subtilis genes with strong homology to known genes used for testing are available at this location as well as the set of experimentally validated E.coli genes.
Acknowledgments
ACKNOWLEDGEMENTS
M.B and J.B. thank Sorel Fitz-Gibbon and Jeffrey Miller for continuing interest in using GeneMarkS for genomic sequence analysis, which stimulated further development of GeneMarkS. M.B. acknowledges useful discussions with Chris Burge, Phil Green and Gary Stormo at the Institute for Theoretical Physics at the University of California at Santa Barbara. The authors thank John Logsdon for valuable comments on the manuscript. J.B., A.L and M.B. were supported in part by a grant from the US National Institutes of Health. M.B. was also supported in part by a grant from the US Civil Research Development Foundation.
References
- 1.Fickett J.W. (1981) Recognition of protein coding regions in DNA sequences. Nucleic Acids Res., 10, 5303–5318. [DOI] [PMC free article] [PubMed] [Google Scholar]
- 2.Gribskov M., Devereux,J. and Burgess,R.R. (1984) The codon preference plot: graphic analysis of protein coding sequences and prediction of gene expression. Nucleic Acids Res., 12, 539–549. [DOI] [PMC free article] [PubMed] [Google Scholar]
- 3.Staden R. (1984) Measurements of the effects that coding for a protein has on a DNA sequence and their use for finding genes. Nucleic Acids Res., 12, 551–567. [DOI] [PMC free article] [PubMed] [Google Scholar]
- 4.Borodovsky M.Y., Sprizhitskii,Y.A., Golovanov,E.I. and Aleksandrov,A.A. (1986) Statistical patterns in primary structures of functional regions in the in E. coli genome: III. Computer recognition of coding regions. Mol. Biol., 20, 1145–1150. [PubMed] [Google Scholar]
- 5.Borodovsky M.Y. and McIninch,J.D. (1993) GeneMark: parallel gene recognition for both DNA strands. Comput. Chem., 17, 123–153. [Google Scholar]
- 6.Salzberg S.L., Delcher,A.L., Kasif,S. and White,O. (1998) Microbial gene identification using interpolated Markov models. Nucleic Acids Res., 26, 544–548. [DOI] [PMC free article] [PubMed] [Google Scholar]
- 7.Delcher A.L., Harmon,D., Kasif,S., White,O. and Salzberg,S.L. (1999) Improved microbial gene identification with GLIMMER. Nucleic Acids Res., 27, 4636–4641. [DOI] [PMC free article] [PubMed] [Google Scholar]
- 8.Krogh A., Mian,I.S. and Haussler,D. (1994) A hidden Markov model that finds genes in E. coli DNA. Nucleic Acids Res., 22, 4768–4778. [DOI] [PMC free article] [PubMed] [Google Scholar]
- 9.Lukashin A.V. and Borodovsky,M. (1998) GeneMark.hmm: new solutions for gene finding. Nucleic Acids Res., 26, 1107–1115. [DOI] [PMC free article] [PubMed] [Google Scholar]
- 10.Hayes W.S. and Borodovsky,M. (1998) How to interpret an anonymous bacterial genome: machine learning approach to gene identification. Genome Res., 8, 1154–1171. [DOI] [PubMed] [Google Scholar]
- 11.Audic S. and Claverie,J.M. (1998) Self-identification of protein-coding regions in microbial genomes. Proc. Natl Acad. Sci. USA, 95, 10026–10031. [DOI] [PMC free article] [PubMed] [Google Scholar]
- 12.Baldi P. (2000) On the convergence of a clustering algorithm for protein-coding regions in microbial genomes. Bioinformatics, 16, 367–371. [DOI] [PubMed] [Google Scholar]
- 13.Besemer J. and Borodovsky,M. (1999) Heuristic approach to deriving models for gene finding. Nucleic Acids Res., 27, 3911–3920. [DOI] [PMC free article] [PubMed] [Google Scholar]
- 14.Frishman D., Mironov,A., Mewes,H.-W. and Gelfand,M. (1998) Combining diverse evidence for gene recognition in completely sequenced bacterial genomes. Nucleic Acids Res., 26, 2941–2947. [Published erratum in Nucleic Acids Res. (1998) 26, 3870] [DOI] [PMC free article] [PubMed] [Google Scholar]
- 15.Shmatkov A.M., Melikyan,A.A., Chernousko,F.L. and Borodovsky,M. (1999) Finding prokaryotic genes by the ‘frame-by-frame’ algorithm: targeting gene starts and overlapping genes. Bioinformatics, 15, 874–886. [DOI] [PubMed] [Google Scholar]
- 16.Yada T., Nakao,M., Totoki,Y. and Nakai,K. (1999) Modeling and predicting transcriptional units of Escherichia coli genes using hidden Markov models. Bioinformatics, 15, 987–993. [DOI] [PubMed] [Google Scholar]
- 17.Hayes W.S. and Borodovsky,M. (1998) Deriving ribosomal binding site (RBS) statistical models from unannotated DNA sequences and the use of the RBS model for N-terminal prediction. Pac. Symp. Biocomput., 279–290. [PubMed] [Google Scholar]
- 18.Kozak M. (1999) Initiation of translation in prokaryotes and eukaryotes. Gene, 234, 187–208. [DOI] [PubMed] [Google Scholar]
- 19.Neuwald A.F., Liu,J.S. and Lawrence,C.E. (1995) Gibbs motif sampling: detection of bacterial outer membrane protein repeats. Protein Sci., 4, 1618–1632. [DOI] [PMC free article] [PubMed] [Google Scholar]
- 20.Galas D.J., Eggert,M. and Waterman,M.S. (1985) Rigorous pattern-recognition methods for DNA sequences. Analysis of promoter sequences from Escherichia coli. J. Mol. Biol., 186, 117–128. [DOI] [PubMed] [Google Scholar]
- 21.Pevzner P.A., Borodovsky,M.Y. and Mironov,A.A. (1989) Linguistics of nucleotides sequences. I: The significance of deviations from mean statistical characteristics and prediction of the frequencies of occurrence of words. J. Biomol. Struct. Dyn., 6, 1013–1026. [DOI] [PubMed] [Google Scholar]
- 22.Staden R. (1989) Methods for discovering novel motifs in nucleic acid sequences. Comput. Appl. Biosci., 5, 293–298. [DOI] [PubMed] [Google Scholar]
- 23.Hertz G.Z., Hartzell,G.W.,III and Stormo,G.D. (1990) Identification of consensus patterns in unaligned DNA sequences known to be functionally related. Comput. Appl. Biosci., 6, 81–92. [DOI] [PubMed] [Google Scholar]
- 24.Lawrence C.E., Altschul,S.F., Boguski,M.S., Liu,J.S., Neuwald,A.F. and Wootton,J.C. (1993) Detecting subtle sequence signals: a Gibbs sampling strategy for multiple alignment. Science, 262, 208–214. [DOI] [PubMed] [Google Scholar]
- 25.Hertz G.Z and Stormo,G.D (1999) Identifying DNA and protein patterns with statistically significant alignments of multiple sequences. Bioinformatics, 15, 563–577. [DOI] [PubMed] [Google Scholar]
- 26.Fraenkel Y.M., Mandel,Y., Friedberg,D. and Margalit,H. (1995) Identification of common motifs in unaligned DNA sequences: application to Escherichia coli Lrp regulon. Comput. Appl. Biosci., 11, 379–387. [DOI] [PubMed] [Google Scholar]
- 27.Bailey T.L. and Elkan,C. (1995) The value of prior knowledge in discovering motifs with MEME. Ismb, 3, 21–29. [PubMed] [Google Scholar]
- 28.van Helden J., Andre,B. and Collado-Vides,J. (1998) Extracting regulatory sites from the upstream region of yeast genes by computational analysis of oligonucleotide frequencies. J. Mol. Biol., 281, 827–842. [DOI] [PubMed] [Google Scholar]
- 29.Hannenhalli S.S., Hayes,W.S., Hatzigeorgiou,A.G. and Fickett,J.W. (1999) Bacterial start site prediction. Nucleic Acids Res., 27, 3577–3582. [DOI] [PMC free article] [PubMed] [Google Scholar]
- 30.Tompa M. (1999) An exact method for finding short motifs in sequences, with application to the ribosome binding site problem. Ismb, 262–271. [PubMed] [Google Scholar]
- 31.Sako Y., Nomura,N., Uchida,A., Ishida,Y., Morii,H., Koga,Y., Hoaki,T. and Maruyama,T. (1996) Aeropyrum pernix gen. nov., sp. nov., a novel aerobic hyperthermophilic archaeon growing at temperatures up to 100 degrees C. Int. J. Syst. Bacteriol., 46, 1070–1077. [DOI] [PubMed] [Google Scholar]
- 32.Klenk H.P., Clayton,R.A., Tomb,J., White,O., Nelson,K.E., Ketchum,K.A., Dodson,R.J., Gwinn,M., Hickey,E.K., Peterson,J.D. et al. (1997) The complete genome sequence of the hyperthermophilic, sulphate-reducing archaeon Archaeoglobus fulgidus. Nature, 390, 364–370. [DOI] [PubMed] [Google Scholar]
- 33.Kunst F., Ogasawara,N., Mozier,I., Albertini,A.M., Alloni,G., Azevedo,V., Bertero,M.G., Bessieres,P., Bolotin,A., Borchert,S. et al. (1997) The complete genome sequence of the Gram-positive bacterium Bacillus subtilis. Science, 390, 249–256. [DOI] [PubMed] [Google Scholar]
- 34.Blattner F.R., Plunkett,G.,III, Bloch,C.A., Perna,N.T., Burland,V., Riley,M., Collado-Vides,J., Glasner,J.D., Rode,C.K., Mayhew,G.F. et al. (1997) The complete genome sequence of Escherichia coli K-12. Science, 277, 1453–1474. [DOI] [PubMed] [Google Scholar]
- 35.Fleischmann R.D., Adams,M.D., White,O., Clayton,R.A., Kirkness,E.F., Kerlavage,A.R., Bult,C.J., Tomb,J., Dougherty,B.A., Merrick,J.M. et al. (1995) Whole-genome random sequencing and assembly of Haemophilus influenzae Rd. Science, 269, 496–512. [DOI] [PubMed] [Google Scholar]
- 36.Tomb J.-F., White,O., Kerlavage,A.R., Clayton,R.A., Sutton,G.G., Fleischmann,R.D., Ketchum,K.A., Klenk,H.P., Gill,S., Dougherty,B.A. et al. (1997) The complete genome sequence of the gastric pathogen Helicobacter pylori. Nature, 388, 539–547. [DOI] [PubMed] [Google Scholar]
- 37.Smith D.R., Doucette-Stamm,L.A., Deloughery,C., Lee,H.-M., Dubois,J., Aldredge,T., Bashirzadeh,R., Blakely,D., Cook,R., Gilbert,K. et al. (1997) Complete genome sequence of Methanobacterium thermoautotrophicum deltaH: functional analysis and comparative genomics. J. Bacteriol., 179, 7135–7155. [DOI] [PMC free article] [PubMed] [Google Scholar]
- 38.Bult C.J., White,O., Olsen,G.J., Zhou,L., Fleischmann,R.D., Sutton,G.G., Blake,J.A., Fitzgerald,L.M., Clayton,R.A., Gocayne,J.D. et al. (1996) Complete genome sequence of the methanogenic archaeon, Methanococcus jannaschii. Science, 273, 1058–1073. [DOI] [PubMed] [Google Scholar]
- 39.Cole S.T., Brosch,R., Parkhill,J., Garnier,T., Churcher,C., Harris,D., Gordon,S.V., Eiglmeier,K., Gas,S., Barry,C.E.,III et al. (1998) Deciphering the biology of Mycobacterium tuberculosis from the complete genome sequence. Nature, 393, 537–544. [DOI] [PubMed] [Google Scholar]
- 40.Kaneko T., Sato,S., Kotani,H., Tanaka,A., Asamizu,E., Nakamura,Y., Miyajima,N., Hirosawa,M., Sugiura,M., Sasamoto,S. et al. (1996) Sequence analysis of the genome of the unicellular cyanobacterium Synechocystis sp. strain PCC6803. II. Sequence determination of the entire genome and assignment of potential protein-coding regions. DNA Res., 3, 109–136. [DOI] [PubMed] [Google Scholar]
- 41.Link A.J., Robison,K. and Church,G.M. (1997) Comparing the predicted and observed properties of proteins encoded in the genome of Escherchia coli K-12. Electrophoresis, 18, 1259–1313. [DOI] [PubMed] [Google Scholar]
- 42.Schneider T.D. and Stephens,R.M. (1990) Sequence logos: a new way to display consensus sequences. Nucleic Acids Res., 18, 6097–6100. [DOI] [PMC free article] [PubMed] [Google Scholar]
- 43.Altschul S.F., Gish,W., Miller,W., Myers,E.W. and Lipman,D.J. (1990) Basic local alignment search tool. J. Mol. Biol., 215, 403–410. [DOI] [PubMed] [Google Scholar]
- 44.Kyrpides N.C. and Ouzounis,C.A. (1999) Transcription in archaea. Proc. Natl Acad. Sci. USA, 96, 8545–8550. [DOI] [PMC free article] [PubMed] [Google Scholar]
- 45.Keeling P.J. and Doolittle,W.F. (1995) Archaea: narrowing the gap between prokaryotes and eukaryotes. Proc. Natl Acad. Sci. USA, 92, 5761–5764. [DOI] [PMC free article] [PubMed] [Google Scholar]
- 46.Tolstrup N., Sensen,C.W., Garrett,R.A. and Clausen,I.G. (2000) Two different and highly organized mechanisms of translation initiation in the archaeon Sulfolobus solfataricus. Extremophiles, 4, 175–179. [DOI] [PubMed] [Google Scholar]
- 47.Chen H., Bjerknes,M., Kumar,R. and Jay,E. (1994) Determination of the optimal aligned spacing between the Shine–Dalgarno sequence and the translation initiation codon of Escherichia coli mRNAs. Nucleic Acids Res., 22, 4953–4957 [DOI] [PMC free article] [PubMed] [Google Scholar]