

Abstract
Oxidative stress plays a key role in obesity by modifying the function of important biological molecules, thus altering obesogenic pathways such as glucose and lipid signaling. Catalase, is an important endogenous antioxidant enzyme that catabolizes hydrogen peroxide produced by the dismutation of superoxide. Recent studies have shown knockdown of catalase exacerbates insulin resistance and leads to obesity. We hypothesized that overexpressing catalase in an obese mouse will modulate obesogenic pathways and protect against obesity. Therefore, we bred catalase transgenic ([Tg(CAT)+/−] mice with Ob/Ob mice to generate the hybrid “Bob-Cat” mice. This newly generated “stress-less” mouse model had decreased oxidative stress (oxidized carbonylated proteins). ECHO-MRI showed lower fat mass but higher lean mass in “Bob-Cat” mice. Comprehensive Lab Animal Monitoring System (CLAMS) showed light and dark cycle increase in energy expenditure in Bob-Cat mice compared to wild type controls. Circulating levels of leptin and resistin showed no change. Catalase mRNA expression was increased in key metabolic tissues (adipose, liver, intestinal mucosa, and brain) of the Bob-Cat mouse. Catalase activity, mRNA and protein expression was increased in adipose tissue. Expression of the major adipokines leptin and adiponectin was increased while pro-inflammatory genes, MCP-1/JE and IL-1β were lowered. Interestingly, sexual dimorphism was seen in body composition, energy expenditure, and metabolic parameters in the Bob-Cat mice. Overall, the characteristics of the newly generated “Bob-Cat” mice make it an ideal model for studying the effect of redox modulators (diet/exercise) in obesity.
Keywords: obesity, antioxidant, adipokine, sexual dimorphism, oxidative stress, appetite regulation
1. Introduction
Rates of cardiometabolic diseases including obesity and Type 2 diabetes (T2D), are rising in developed and developing nations [1, 2]. In the United States of America (U.S.A), obese individuals make up approximately 35% of the population and the levels will continue to rise without appropriate interventions [2, 3]. The obese phenotype is a consequence of a number of factors including genetics [2, 4] as well as environmental influences [1, 5]. Both of these factors impact physiological processes and the function of biological molecules within an individual. When homeostasis is disrupted, body function is compromised. Redox stress is an imbalance between antioxidants and oxidants, leading to detrimental effects, such as increased production of oxidative species, alterations in signaling pathways, increased inflammation, and eventually cell death. Redox stress is known to play a role in various metabolic diseases including obesity [6, 7].
Increased free radical generation (redox stress) leads to a progressive accumulation of oxidative damage leading to increased adiposity stemming from an imbalance between pro-oxidants and antioxidants [7–10]. Increases in fat mass, manifested as an increase in white adipose tissue (WAT), increases oxidative stress/oxidant production and results in an obese phenotype [11] characterized by a BMI (Body Mass Index) ≥ 30kg/m2 [12]. The obese phenotype is accompanied by mitochondrial dysfunction and increased lipid peroxidation in adipose tissue, further leading to the dysfunction of other metabolic tissues such as liver, muscle, [11, 13] gut, and brain [14].
Strong evidence of the redox theory in obesity stems from research concentrated in models with high levels of adiposity and altered appetite regulation as a result of increased oxidative stress [15, 16]. Rodent body weight changes were shown to alter appetite regulation with alterations in oxidative stress markers [17]. Redox stress has also been implicated in the process of adipogenesis [18]. Adipose dysfunction results in abnormal levels of adipokines and cytokines secreted into circulation, such as leptin, adiponectin, resistin, monocyte chemotactic protein-1 (MCP-1/JE), and interleukin 1 beta (IL1β). These molecules play key roles in appetite and metabolic function, as well as inflammatory processes [19, 20]. In turn, this can further impact superoxide release and promote oxidative stress [21, 22]. These molecules also mediate their effects by acting on immune cells leading to local and generalized inflammation thus impacting obesity related disorders (hypertension, diabetes, atherosclerosis, and insulin resistance) [23].
The body activates defense systems such as the endogenous antioxidants in order to counteract and prevent the negative consequences of increased redox stress. Antioxidants are able to catabolize reactive oxidants and yield products that are less reactive/toxic. Numerous studies have focused on the role of antioxidants in inhibiting disease pathways caused by increased levels of free radical production [24, 25]. Catalase is one of the major endogenous antioxidant enzymes that detoxify the reactive oxygen species (ROS) hydrogen peroxide (H2O2) to water and oxygen. Overexpression of catalase was shown to be beneficial in numerous studies. Our earlier studies have shown a role for catalase overexpression in the prevention of oxidative damage in vascular cells [26, 27] and in vivo in diet-induced atherosclerosis and exercise intervention in LDL r−/− mice [28]. Other evidence includes studies where mitochondria targeted catalase showed a delay of cancer progression by attenuation of mitochondria-generated H2O2 signaling [29]. A cardiac-specific overexpression of catalase protected from oxidative stress and displayed evidence of delayed cardiac aging in mice [30]. In regard to obesity, a mouse model expressing mitochondria specific catalase on a high fat diet displayed attenuated mitochondrial ROS emission, preserved insulin signaling, and no inflammatory response compared to wild type controls [11]. This may be because overexpression of endogenous catalase was shown to regulate the polarization of macrophages within adipose tissue and thereby inhibiting inflammation and insulin resistance [31]. On the other hand, mice devoid of antioxidant catalase developed an obese, prediabetic phenotype that was exacerbated with age [32]. All these evidences suggest catalase as an ideal candidate for modulating redox stress in obesity.
Since high redox stress is one of the major hallmarks of obesity [8], we hypothesized that excess catalase (antioxidant) expression would suppress redox stress mediated obesogenic pathways. In this study, catalase transgenic [Tg(CAT)+/−] mice [33, 34] expressing 3–4 fold higher levels of catalase were bred with the heterozygous, leptin deficient, Ob/Ob mice to create a hybrid that expresses high levels of catalase in an obese background (“Bob-Cat” mice). This newly generated mouse model showed sex specific changes in redox stress and metabolic parameters. Our results suggest that this “stress-less” mouse model can be used as a good model to study the effect of modulators of redox stress (diet or exercise) on obesogenic pathways.
2. Materials and Methods
2.1 Generation of “Bob-Cat” Mice
A successful breeding colony of the catalase transgenic [Tg(CAT)+/−] mice has been established in our laboratory (a generous gift of a breeding pair from Drs. Arlan Richardson and Holly Van Remmen at the University of Texas Health Sciences Center in San Antonio, TX). The transgenic model that overexpresses Catalase was originally generated in C57Bl6 mice using a 33kb human CAT (hCAT) gene as well as the 41kb of 5′ and the 6 kb of 3′ flanking regions. This mouse model was the first transgenic model with increased catalase expression in all tissues [34].
Using the well-established colony at our facility, [Tg(CAT)+/−] mice and the heterozygous Ob/+ mice (homozygous Ob/Ob are a leptin resistant, sterile model which spontaneously develops obesity – Jackson Labs, B6.V-Lep/ob/J) were bred to engineer a novel mouse model with the goal of further understanding the mechanistic effect of lowering redox stress (by increasing catalase) on obesogenic pathways. Through cross-breeding the two genotypes, we developed a mouse model expressing the hCAT gene with a genetically obese background called “Bob-Cat” mice. The “Bob-Cat” mouse model was generated by following the breeding plan as described in Figure 1A. Four breeding pairs of the catalase transgenic mice [Tg(CAT) +/−] were crossbred with Ob/+ mice (purchased from Jackson Labs) (2-male [Tg(CAT)+/−] mice x 2-female Ob/+ mice or 2-male Ob/+ mice x 2-female [Tg(CAT)+/−] mice) allowing the generation of the novel hybrid “Bob-Cat” mice. Once the first generation was established, four breeding pairs were used to sufficiently generate hybrid F2 pups for creating the F3 generation. Both F2 and F3 generation mice were used for further study purposes.
Figure 1. Generation of the Bob-Cat Mouse.
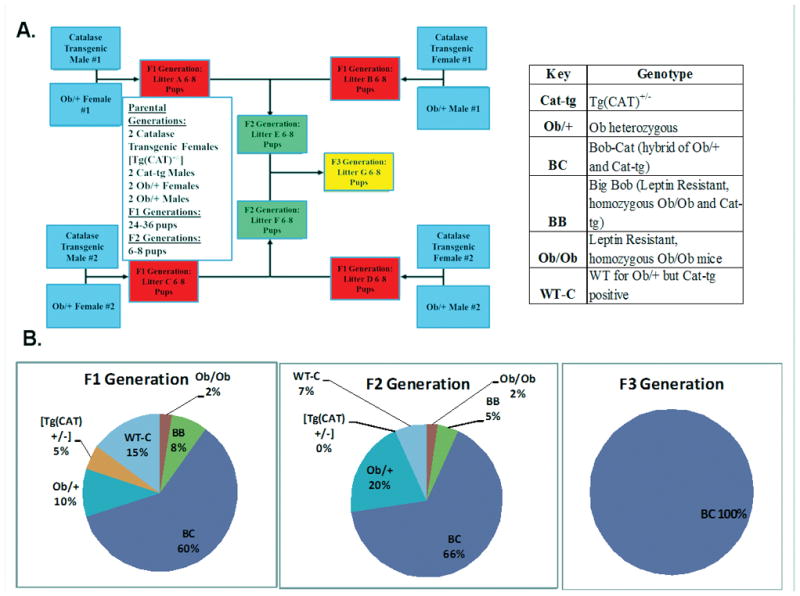
(A) Four breeding pairs were combined (2-male [Tg(CAT)+/−] mice x 2-female Ob/+ mice) or (2-male Ob/+ mice x 2-female [Tg(CAT)+/−] mice) to create the F1 generation. F1 generation offspring were then bred to generate the F2 generation. F3 generations were produced between breeding pairs of the F2 generation. F2 and F3 generations were used in characterizing the novel “Bob-Cat” mouse. Pie charts represent the percent of the males and females generated in the (B) F1 generation, (C) F2 generation, and (D) F3 generation of each genotype. The key denotes each genotype generated from the breeding pairs. The figure provided displays each genotype generated from two breeding pairs. However, multiple breeding pairs were used in the generation of the Bob-Cat Mouse.
2.2 Characterization of “Bob-Cat” Mice
The newly generated hybrid “Bob-Cat” mice were compared to: i) Catalase transgenic [Tg(CAT) +/−] mice that over-express the hCAT gene by approximately 3–4 fold in comparison to C57Bl6 [33], ii) wild type/C57Bl/6J mice (Jackson Lab stock number 000664) and iii) Ob/Ob (Jackson Lab stock number 000632), leptin resistant obese mice purchased from Jackson Laboratories (Bar Harbor, MA). Ob/Ob mice are homozygous for the mutant ob gene. They increase in weight rapidly after 4 weeks of age, and can become up to three times the size of their parent strain C57Bl6 [35]. Along with accumulation of fat, Ob/Ob mice express hyperphagia, hyperglycemia, glucose intolerance, elevated plasma insulin [35], and increased hormone production from both pituitary and adrenal glands. The mice are hypometabolic, hypothermic, (Jackson Laboratory) and immunosuppressed [36]. Due to the subfertility of Ob/Ob mice [37], the heterozygous Ob/+ mice are generally used for breeding. All mice were maintained on “standard chow” (Lab Diet Rodent Chow 5001) consisting of 30% protein, 13% fat, and 57% carbohydrate ad libitum. In the present study, the care and use of animals was conducted according to protocols approved by Marshall University IACUC.
2.3 Genotyping
Four weeks post-birth, animals were ear marked for identification and genotyped by collecting approximately 3–4 mm of the tail and isolating DNA. Tails were lysed in 300 μL of tail lysis buffer and 15 μL of proteinase K then placed overnight in a 55 C water bath followed by centrifugation for 10 min. at 12,000g at room temperature. The supernatant was placed in another eppendorf tube with 300 μL of 100% isopropanol. The tube was centrifuged again at 12,000g for 5 min at room temperature to pellet the DNA. Pellets were dried and subsequently washed with 500 μL of 95% ethanol (EtOH) and centrifuged 5 min. at 12,000g. EtOH was discarded and the DNA pellets were air dried. 10 μL of Tris-EDTA (TE) Buffer was added to each tube and then all samples were placed into a 37 C water bath 5–10 min. until the DNA was completely suspended. DNA was quantified by NanoDrop (Nanodrop Technologies Inc., Thermo Scientific, Wilmington, DE, USA). For genotyping, 0.25 μg (1 μL) of each DNA sample was added to a reaction mix of 18.125 μL RNase free H2O, 2.5 μL of 10X i Taq Buffer, 0.75 μL of MgCl2 50 mM, 0.5 μL dNTP mix 10 mM, 1 μL forward primer, 1 μL reverse primer, 0.125 μL i Taq DNA polymerase to prepare for amplification of DNA in the BioRad MyiQ (BioRad, Hercules, CA). PCR protocol was conducted as described in previous publications [34, 38]. Catalase primers: E12F: 5′-GAGGTCCACCCTGACTACGGG-3′ and E13R: 5′-GCCTCCTCCCTTGCCGCCAAG-3′ [34]. Primers for Ob gene characterization: RFLP-F: 5′-TGAGTTTGTCCAAGATGGACC-3′; RFLP-R: 5′-GCCATCCAGGCTCTCTGG-3′; WtLep-F: 5′-AATGACCTGGAGAATCTCC-3′; and Lepob-R: 5′-GCAGATGGAGGAGGTCTCA-3′ [38]. After amplification by PCR, agarose gel electrophoresis was used to determine the presence of the hCAT gene (450bp), and the Lep Ob genes (heterozygous Ob with WT-specific primer bands at 191 and 104bp and bands at 191 and 123bp for ob-specific primers; homozygous Ob if band at 191bp for Wt-specific primer and bands at 191 and 123bp for the Ob-specific primer). Catalase bands were detected on a 1.2% agarose gel and Ob related bands were detected by use of a 3% agarose gel that also contained Ethidium Bromide (EtBr) that had been electrophoresed at 100V for approximately one hour. Bands were detected using the ChemiDoc and Image Lab Software (BioRad, Hercules, CA) (Suppl. Figure 1).
2.4 Body Weight and Body Composition (fat and lean mass)
[Tg(CAT)+/−] and Bob-Cat mice were weighed weekly from weaning until 20 weeks of age to determine differences in growth rate prior to full development. Growth rates of C57Bl6 and Ob/Ob mice were derived from studies conducted at Jackson Laboratory (where animals were purchased). Body composition (fat and lean mass) was determined using magnetic resonance imaging, ECHO-MRI (Magnetic Resonance Imaging) (Houston, TX). Mice were singly entered in the MRI machine and five measurements were performed on each mouse. The median values of fat and lean mass were computed per mouse, averaged per genotype, and subsequently compared to one another by one-way ANOVA.
2.5 Metabolic Parameters Using Comprehensive Lab Animal Monitoring System (CLAMS)
Metabolic parameters were measured indirectly by determining Volume O2 consumption (VO2) and Volume CO2 production (VCO2), respiratory exchange ratio (RER) as well as X-Ambulatory counts (X AMB) using the CLAMS system (Columbus Instruments, Columbus, OH, USA). Mice were supplied with a sufficient amount of ground standard chow (Lab Diet Rodent Chow 5001) for the duration of the analysis (three days). Computations were made on the middle 48 hours of the three day CLAMS procedure that the mice were subjected to, from approximately 0600 hours of the first day to 0600 hours of the third day. Heat production/energy expenditure (EE), RER average, average food intake (FI) per day, as well as X-Ambulatory locomotor activity per day (counts of movement made across the cage) were determined for each mouse in all groups. Group averages were compared by using a one-way ANOVA.
2.6 Tissue Collection
Animals were anesthetized using isoflurane after overnight fasting. Blood was taken by cardiac puncture, centrifuged, separated into red blood cells (RBC’s) and plasma. Tissues (kidney, lung, skeletal muscle, heart, adipose, liver, intestinal mucosa (IM), and brain) were removed, weighed, and flash frozen in liquid nitrogen, followed by storage at −80 C.
2.7 Blood Analysis
Whole blood was used to measure fasting glucose levels by a Precision Xtra Glucometer. Blood was then centrifuged for 10 min. to separate the plasma and RBCs. 35 μL of plasma was placed on a Cholestech cassette and read on a LDX Cholestech Machine (Cholestech Corporation Hayward, CA) to determine Glucose, High Density Lipoprotein (HDL), Low Density Lipoprotein (LDL), Total Cholesterol (TC), and Triglyceride (TG) levels. The remaining plasma was frozen at −80 C.
Circulating levels of IL6, TNF α, MCP-1/JE, Insulin, Leptin, and Resistin were measured in the plasma of C57Bl6, [Tg(CAT)+/−], and Bob-Cat mice by the use of a Milliplex Mouse Adipokine Array (Millipore) on a Luminex 200 system (Luminex Corp, Austin, TX).
2.8 Catalase RNA Expression
Catalase gene expression in various tissues (kidney, lung, muscle, heart, adipose, liver, intestinal mucosa (IM), and brain) of C57Bl6 (C), [Tg(CAT)+/−] (T), and Bob-Cat (B) mice (male and female) was evaluated by PCR and agarose gel electrophoresis. Total RNA was isolated using Tri-Reagent (Sigma). RNA concentration was measured by the use of the NanoDrop 1000 (NanoDrop Technologies Inc., Thermo Scientific, Wilmington, DE, USA) followed by RT-PCR for amplification (BioRad, Hercules, CA). Samples were evaluated for both Human (hCAT) and Mouse (mCAT) Catalase using 1.2% agarose gel electrophoresis in comparison to the housekeeping gene β-Actin. Primers used were as follows: Human Catalase (hCAT) (Accession Number: NM-001752) Forward: 5′-acatggtctgggacttctgg-3′ and Reverse: 5′-tttgcaataaactgcctccc-3′; Mouse Catalase (mCAT) (Accession Number: NM-009804) Forward: 5′-agtcttcgtcccgagtctctc-3′ and Reverse: 5′-ctggtcggtcttgtaatggaa-3′. β-Actin (Accession Number NM-007393) Forward: 5′-ctacctcatgaagatcctcaccga-3′ and Reverse: 5′-ttctccttaatgtcacgcacgatt-3.′ Bands were detected using the ChemiDoc and Image Lab Software (BioRad, Hercules, CA).
2.9 Abdominal Adipose Tissue mRNA Expression
RNA was isolated from 100 mg of visceral (abdominal) adipose tissue (WAT) using TRI Reagent according to the manufacturer’s recommended protocol (Sigma). Concentrations of RNA were measured by use of the NanoDrop 1000 (NanoDrop Technologies Inc., Thermo Scientific, Wilmington, DE, USA). Reverse transcription of total RNA (1 μg) was performed using iScript™ cDNA Synthesis Kit (Bio-Rad Hercules, CA, USA). RT-qPCR was conducted using iQ SYBR™ Green Supermix (Bio-Rad). The mouse primers for catalase, leptin, adiponectin, MCP-1/JE, IL1β, and β-Actin include: Catalase (Accession Number: NM-009804) Forward: 5′-agtcttcgtcccgagtctctc-3′ and Reverse: 5′-ctggtcggtcttgtaatggaa -3′. Leptin (Accession Number: NM-008493) Forward: 5′-ctcatgccagcactcaaaaa -3′ and Reverse: 5′-agcaccacaaaacctgatcc -3.′ Adiponectin (Accession Number NM-009605) Forward: 5′-gcagagatggcactcctgga -3 and Reverse 5′-cccttcagctcctgtcattcc -3.′ MCP-1/JE (Accession Number: NM-011333.3) Forward: 5′-ttccttcttggggtcagcacagac -3′ and Reverse 5′-actgaagccagctctctcttcctc -3.′ IL1β (Accession Number: NM-008361.3) Forward: 5′-aggagaaccaagcaacgaca -3 and Reverse 5′-tgggtgtgccgtctttcatt -3.′ β-Actin (Accession Number NM-007393) Forward: 5′-ctacctcatgaagatcctcaccga -3′ and Reverse: 5′-ttctccttaatgtcacgcacgatt -3.′ RT-qPCR was performed in the Bio-Rad MyiQ or Bio-Rad CFX Connect™ instrument. All samples were run in duplicates or triplicates. Results were calculated using the Pfaffl Equation (2−ΔΔCt) [39], and expressed as fold change compared to the control wild type/C57Bl6 mice.
2.10 Western Blot
Approximately 50 mg of WAT was homogenized in 100 μL Radioimmunoprecipitation assay buffer (RIPA buffer) supplemented with protease inhibitor cocktail. Protein concentrations were determined by the Lowry Method [40]. Based on these concentrations, predetermined amounts of protein (40–50 μg) per sample were prepared in loading buffer (90% Laemmli and 10% 2-mercaptoethanol) and boiled for 5 min. Samples were run on a SDS-PAGE and separated on 12% or 12.5% EZ Run Protein Gel Solution (Fisher), at 120V for 60–90 minutes. Electrophoretic transfer of the proteins onto a nitrocellulose membrane was performed at 100V for 60 min. on ice. Thermo Scientific Memcode Stain: Pierce MemCode™ Reversible Protein Stain Kit was then used as a loading control. Membranes were blocked with 1X Tris Buffered Saline (1X TBST), 0.05% Tween 20, pH 7.6, and 5% dry milk for one hour at room temperature. Blots were then incubated overnight at 4 C with rabbit anti-bovine catalase antibody (1:3000 in 1X TBST and 5% dry milk) (VWR Rockland) which cross-reacts with both mouse and human catalase. After washing with 1X TBST, membranes were incubated with secondary anti-rabbit IgG (1:1000) in 1X TBST and 5% dry milk for 60 min. at room temperature. The immunocomplex was detected with Luminata™ Forte Western HRP (Millipore, Billerica MA). Densitometry of the bands was quantified using BioRad Image Lab Software (BioRad, Hercules, CA) and normalized to MemCode Stain of total protein in each lane.
2.11 Catalase Enzymatic Activity
Catalase enzymatic activity was measured according to the method of Aebi [41]. A standard curve was first generated using 1–5 units of bovine catalase (Sigma, 9001–9502). Approximately 50 mg of abdominal adipose tissue from each mouse was homogenized in 100 μL of 50 mM KH2PO4, 5 μg/μL Aprotinin, and 2 μL of 0.1 M PMSF. Appropriate dilutions were made and 8 μL of each homogenate was added to 1 mL of 25 mM Hydrogen Peroxide (H2O2) solution (Sigma) and analyzed on a Shimadzu Spectrophotometer for one minute. Initial rate of disappearance of H2O2 was recorded at a wavelength of 240 nm during the 1 minute (A240 nm/min). Each sample was analyzed in duplicate or triplicate. Change in absorbance was recorded for each tissue sample and specific activity was calculated based on protein estimation of the homogenate by the Lowry Method.
2.12 Protein Carbonylation Using OxyBlot
Approximately 50 mg of abdominal adipose tissue per sample was prepared by denaturing and derivatizing the proteins with a solution of 12% Sodium Dodecyl Sulfate (SDS) and Dinitrophenylhydrazine (DNPH) according to OxyBlot (Millipore) protocol. Neutralization solution was used to terminate the derivatization reaction after 15 min. The separation of proteins was achieved using a 12.5% EZ Run Protein Gel Solution (Fisher) or 12% mini PROTEAN TGX 12% (BioRad) at 100V for 50–60 minutes followed by transfer to a nitrocellulose membrane at 100V for 90 minutes. To determine equal loading and transfer efficiency, Pierce MemCode™ Reversible Protein Stain was used to visualize proteins in a BioRad ChemiDoc and analyzed using BioRad Image Lab (BioRad, Hercules, CA). Non-specific binding sites were blocked with 1X Phosphate Buffered Saline and Tween 20 (1X PBST) and 10% Bovine Serum Albumin (BSA) rocking for one hour. A 1:500 dilution of primary antibody, Rabbit-Anti-DNP (Millipore OxyBlot Kit) was added and rocked overnight at 4 C, followed by washes with 1XPBST. Blots were conjugated with a 1:300 dilution of goat anti-rabbit IgG (Horseradish Peroxidase conjugated) for one hour at room temperature with rocking. Bands were visualized with Luminata™ Forte Western HRP (Millipore, Millerica, MA) using BioRad Chemidoc and Image Lab (BioRad, Hercules, CA). OxyBlot data of oxidized proteins were expressed as the densitometric ratio of the dinitrophyenylhydrozone (DNP) bands to total protein in each lane obtained by the Memcode stain.
2.13 Statistical Analysis
Results for body composition and enzymatic activity are presented as mean +/− standard error of the mean (SEM) and plotted using GraphPad Prism. One-way ANOVA and Multiple Comparisons were used to evaluate the differences between the genotypes with Bonferonni post-hoc analysis. p<0.05 was considered statistically significant. For RT-qPCR analysis, expression was determined by use of the Pfaffl equation 2−ΔΔCt [39] and represented as fold change with significance denoted as differences in delta CT/genotype.
3. Results
3.1 Breeding Outcomes for the Bob-Cat Mouse Model
The breeding scheme depicted in Figure 1A was used to generate Bob-Cat mice for three generations. Ratios of genotype of each generation of breeding pairs is depicted in Figure 1B. Approximately 50:50 ratios of males to females were observed in each of the F1–F3 generations. The first and second generations of pups were approximately 60% Bob-Cat while the third generation, F3, consisted of 100% Bob-Cat. In addition to “Bob-Cat” which is heterozygous for the ob gene, there was also the generation of mice that were homozygous for the ob gene that overexpressed catalase (Big-Bob). However, this genotype was rare in occurrence and was more skewed towards females than males (7% F1 and 2% F2 generations). In an effort to elucidate high antioxidant (catalase) effect in a leptin-resistant model, we are continuing to cross-breed, to generate more homozygous ob mutant mice overexpressing catalase.
3.2 Mouse and Human Catalase Gene Expression in Various Tissues
Bob-Cat (B) male and female mice were evaluated for the expression levels of human and mouse catalase in various tissues and compared to C57Bl6 (C) and [Tg(CAT)+/−] (T) mice. Mouse catalase (mCAT) as well as human catalase (hCAT) mRNA levels were analyzed and compared by densitometry ratios to β-Actin using BioRad Image Lab (BioRad, Hercules, CA). Male Bob-Cat mice generally had higher levels of hCAT in comparison to the other genotypes of mice. However, levels of mCAT trended to be lower in comparison to the other two genotypes (Suppl. Figure 2A–F). In general, female Bob-Cat mice showed no statistical difference in hCAT across most tissues, but there was a trend for increase in the brain, significant increase in the liver, and a decrease in muscle compared to C57Bl6. Additionally there was a decrease in intestinal mucosa (IM) in Bob-Cat compared to [Tg(CAT)+/−] (Suppl. Figure 2G–L). With regard to mCAT in female Bob-Cat mice, levels trended to be lower except in the IM and brain where there was a significant increase in comparison to the other genotypes analyzed.
3.3 Body Composition and Tissue Weight
As seen in Table 1A and 1B, both male and female mice that overexpress antioxidant catalase have significantly lower body weight in comparison to the Ob/Ob mice (background of Bob-Cat mice) as do the control C57Bl6 mice. However, body weights of the novel Bob-Cat mouse were not significantly different from the C57Bl6 or [Tg(CAT)+/−] mouse. The male [Tg(CAT)+/−] mice on the other hand are slightly heavier than the C57Bl6 mice at adulthood as seen in Table 1A. No significant differences were seen between Bob-Cat mice and C57Bl6 or [Tg(CAT)+/−] with regard to liver and adipose weight, but as expected, Ob/Ob adipose and liver weights were significantly heavier than all other groups (p<0.0001). This effect was the same in both genders (Table 1A and 1B).
Table 1.
Body Weight and Tissue Weights
| Male | Body Weight (g) | Abdominal Adipose (g) | Liver Weight (g) |
|---|---|---|---|
| C57Bl6 | 27.09 ± 0.79 | 0.77 ± 0.02 | 1.04 ± 0.07 |
| [Tg(CAT)+/−] | 33.32 ± 0.46a* | 1.28 ± 0.11 | 1.55 ± 0.06 |
| Bob-Cat | 31.00 ± 1.02 | 1.73 ± 0.17 | 1.43 ± 0.05 |
| Ob/Ob | 54.45 ± 2.21d*#$ | 8.13 ± 0.71d*#$ | 4.35 ± 0.24d*#$ |
| Female | Body Weight (g) | Abdominal Adipose (g) | Liver Weight (g) |
|---|---|---|---|
| C57Bl6 | 22.74 ± 0.37 | 0.91 ± 0.12 | 1.05 ± 0.05 |
| [Tg(CAT)+/−] | 21.18 ± 0.74 | 0.53 ± 0.06 | 1.05 ± 0.06 |
| Bob-Cat | 24.21 ± 0.24 | 1.12 ± 0.13 | 1.18 ± 0.06 |
| Ob/Ob | 51.71 ± 1.50d*#$ | 7.76 ± 0.21d*#$ | 2.61 ± 0.07d*#$ |
Body and Tissue Weights of Each Genotype: (A) Adult male (n≥4) body weight, adipose and liver weights of C57Bl6, [Tg(CAT)+/−], Bob-Cat, and Ob/Ob mice. (B) Adult female (n≥6) body weight, adipose weight, and liver weight of C57Bl6, [Tg(CAT)+/−], Bob-Cat, and Ob/Ob mice. One-way ANOVA was performed on GraphPad Prism 7. Data reported as mean +/− SEM and significant differences are displayed with letters indicating p values:
p<0.05,
p<0.01,
p<0.001,
p<0.0001; symbols represent significant differences between genotypes,
compared to C57Bl6,
compared to [Tg(CAT)+/−],
compared to Bob-Cat.
From 4 to 20 weeks of age, mice considerably gained weight. However, statistical significance within the four genotypes of males is noted at 5 weeks of age between the Ob/Ob mice and the other three genotypes (p<0.05) (Figure 2A). Female mice, shown in Figure 2B, on the other hand, showed a significant difference in body weight beginning at 4 weeks between the Ob/Ob mice and every other genotype (p<0.0001). C57Bl6 and Ob/Ob body weights were obtained from Jackson Labs: (C57BL/6J https://www.jax.org/jax-mice-and-services/straindata-sheet-pages/body-weight-chart-000664; B6 Cg-Lepob/J https://www.jax.org/jax-mice-and-serviceccs/strain-data-sheet-pages/body-weight-chart-000632).
Figure 2. Weekly Body Weights.

Changes in weekly body weights of each genotype was determined: (A) Male and (B) Female weekly body weight changes of (n≥7/group) C57Bl6, [Tg(CAT)+/−], Bob-Cat, and Ob/Ob mice. Data for C57Bl6 and Ob/Ob were obtained from Jackson Laboratories (C57BL/6J https://www.jax.org/jax-mice-and-services/straindata-sheet-pages/body-weight-chart-000664; B6 Cg-Lepob/J https://www.jax.org/jax-mice-and-serviceccs/strain-data-sheet-pages/body-weight-chart-000632). One-way ANOVA was performed on GraphPad Prism 7. Data are represented as mean +/− SEM. Letters indicate significant p values, b=p<0.01, d=p<0.0001; *=compared to C57Bl6.
3.4 Body Composition (ECHO-MRI)
ECHO-MRI was used to determine the lean and fat mass of all genotypes. A significant difference was observed in the fat mass of the Ob/Ob mouse group compared to both genders of the other genotypes. The lean mass was observed to be greater (p<0.04) for each male genotype that overexpresses antioxidant catalase in comparison to both C57Bl6 and Ob/Ob mice (Figure 3A1 and A2), revealing a difference in body composition that should be further investigated. In the female groups, Bob-Cat mice have a significantly higher fat mass compared to [Tg(CAT)+/−], and lean mass compared to C57Bl6 and [Tg(CAT)+/−] genotypes (p<0.02) (Figure 3B1 and B2). The sex differences in body composition are intriguing and worth investigating in the future.
3.5 Metabolic Parameters Analyzed By CLAMS
Although body weight and fat mass did not significantly differ between C57Bl6 and mice overexpressing antioxidant catalase, significant changes were seen in metabolic parameters as determined by CLAMS within the adult genotypes (Figure 4). Overall (combination of both light/dark cycles) analysis of CLAMS data showed that neither male nor female mice significantly differed with regard to food intake (FI) per day. Significant differences were observed in the energy expenditure levels and X AMB counts in male Ob/Ob mice compared to the other genotypes. RER was not significantly different in either gender.
Figure 4. Metabolic Parameters.

Overall changes in metabolic parameters was determined using CLAMS: Male- (A1) Food Intake of C57Bl6, [Tg(CAT)+/−], Bob-Cat, and Ob/Ob averaged per day; (A2) Metabolic Energy Expenditure of each genotype averaged kcal/h over the middle 48h; (A3) X AMB Counts of each genotype over 48h; (A4) Respiratory Exchange Ratio (RER) average over 48h; (B1–B4) The representative images from female mice are displayed. Data were analyzed by one-way ANOVA on GraphPad Prism 7. Data are represented as mean +/− SEM. Letters indicate significant p values, a=p<0.05, b=p<0.01, c=p<0.0001, d=p<0.0001; symbols represent significant differences between genotypes, *=compared to C57Bl6, # =compared to [Tg(CAT)+/−], $=compared to BobCat.
Independent analysis of CLAMS data collected during the light and dark cycle (Table 2 and Figure 5), showed that the FI and RER did not significantly differ among genotypes of either gender. However, significant differences in EE were seen among the male groups in both light and dark cycles. Bob-Cats showed a trend towards higher levels and [Tg(CAT)+/−] showed significantly higher levels of EE (p<0.008) compared to C57Bl6 males. The same trend was noted for the dark cycle where, Bob-Cats and [Tg(CAT)+/−] did have statistically higher levels of energy expenditure in comparison to C57Bl6 mice (p=0.021). In assessment of physical activity, there was also a trend for higher levels of activity (X AMB) in Bob-Cat males in comparison to the Ob/Ob mouse group; most notably in the light cycle (Figure 5A1–A4). Ob/Ob male mice also had significantly lower activity levels (X AMB) in both the light and dark cycles compared to [Tg(CAT)+/−] and C57Bl6 mice (p<0.01) yet higher levels of energy expenditure compared to all other groups (p<0.01). Within females, all measured parameters with the CLAMS did not significantly differ between the groups except that X AMB counts were much higher in the BobCat female group (p<0.04) compared to both female C57Bl6 and [Tg(CAT)+/−] in both light and dark cycles (Figure 5B1–B4).
Table 2.
Light and Dark Cycles of Metabolic Parameters
| Group | LIGHT | DARK | ||||||
|---|---|---|---|---|---|---|---|---|
| Male | FI (g) | EE (kcal/h) | X Counts | RER (VCO2/VO2) | FI (g) | EE (kcal/h) | X Counts | RER (VCO2/VO2) |
| C57Bl6 | 1.43 ± 0.196 | 0.366 ± 0.010 | 7398 ± 963 | 0.886 ± 0.005 | 3.07 ± 0.271 | 0.445 ± 0.009 | 24858 ± 3432 | 0.942 ± 0.009 |
| [Tg(CAT)+/−] | 1.34 ± 0.042 | 0.442 ± 0.008b# | 9581 ± 2770 | 0.871 ± 0.006 | 2.64 ± 0.208 | 0.509 ± 0.009a* | 24392 ± 4911 | 0.920 ± 0.009 |
| Bob-Cat | 1.35 ± 0.042 | 0.422 ± 0.010 | 5088 ± 1209 | 0.899 ± 0.010 | 2.98 ± 0.247 | 0.508 ± 0.008a* | 17000 ± 3340 | 0.952 ± 0.009 |
| Ob/Ob | 1.04 ± 0.146 | 0.503 ± 0.013b$, d*# | 874.4 ± 112.4a*# | 0.867 ± 0.014 | 3.10 ± 0.444 | 0.589 ± 0.015a*, b#$ | 2421 ± 243.7a$, b#, c* | 0.913 ± 0.016 |
| Female | ||||||||
| C57Bl6 | 1.78 ± 0.137 | 0.398 ± 0.019 | 4791 ± 405 | 0.924 ± 0.015 | 2.82 ± 0.109 | 0.453 ± 0.017 | 17357 ± 1136 | 0.939 ± 0.024 |
| [Tg(CAT)+/−] | 1.67 ± 0.140 | 0.362 ± 0.020 | 4502 ± 910 | 0.932 ± 0.022 | 2.97 ± 0.137 | 0.421 ± 0.022 | 14556 ± 3845 | 0.973 ± 0.017 |
| Bob-Cat | 1.74 ± 0.218 | 0.387 ± 0.017 | 11206 ± 2440 | 0.891 ± 0.010 | 2.80 ± 0.323 | 0.477 ± 0.021 | 40300 ± 8352a*# | 0.910 ± 0.008 |
Light and Dark Cycles of Metabolic Parameters measured by CLAMS Technology: Male and female averaged light and dark cycles of food intake (FI) as average grams (g) of chow consumed per cycle, metabolic energy expenditure (EE) as average kcal/h of each mouse group, counts of physical movement as x ambulatory movement/cycle (X Counts), and average Respiratory Exchange Ratio (RER) as VCO2/VO2 per cycle. One-Way ANOVA was performed using Graph-Pad Prism 7. Data are represented as mean +/− SEM and significant differences are displayed with letters indicating p values:
p<0.05,
p<0.01,
p<.001,
p<.0001; symbols represent significant differences between genotypes,
compared to C57Bl6,
compared to [Tg(CAT)+/−],
compared to Bob-Cat.
Figure 5. Two Hour Time Interval Analysis of Metabolic Parameters.

Light and dark cycle analysis of CLAMS data is provided: Male- (A1) Food Intake grams/day (A2) Metabolic Energy Expenditure averaged kcal/h over the middle 48h (A3) X AMB Counts over 48h (A4) Respiratory Exchange Ratio (RER) average over 48h of male C57Bl6, [Tg(CAT)+/−], Bob-Cat, and Ob/Ob mice. (B1–B4) The representative images from female mice of each genotype are displayed. Data are represented as mean +/− SEM.
Data comparing the Bob-Cat (het Ob/+) to Big Bob (homozygous Ob/Ob) genotypes mice overexpressing catalase is displayed in Suppl. Table 1. Big Bob mice have significantly higher body weight and fat mass. CLAMS data showed a trend toward an overall increase in FI and decrease in X AMB (combined light and dark cycles) as well as significantly higher levels of EE compared to the Bob-Cat mice.
3.6 Circulating Metabolic Profile
Blood glucose levels did not significantly differ between the Bob-Cat mice of either sex compared to C57Bl6 or [Tg(CAT)+/−] (Table 3A–3B). However, the Ob/Ob mouse group had significantly higher levels of plasma glucose compared to all other genotypes. HDL and TC levels were significantly elevated in both sexes of the Ob/Ob mouse strain compared to all other genotypes. Interestingly, male [Tg(CAT)+/−] mice had significantly higher levels of plasma TG (Table 3A) compared to the other male groups, while Bob-Cat mice were highly similar to the C57Bl6 control mice.
Table 3.
Blood Lipid Profile and Glucose Levels
| A. | ||||
|---|---|---|---|---|
| Male | Total Cholesterol (mg/dL) | HDL (mg/dL) | TG (mg/dL) | Glucose (mg/dL) |
| C57Bl6 | <100 | 61.8 ± 9.68 | 46.3 ± 1.08 | 188.4 ± 9.1 |
| [Tg(CAT)+/−] | <100 | 64.8 ± 2.38 | 95.3 ± 15.9a* | 220.1 ± 14.1 |
| Bob-Cat | <100 | 65.8 ± 4.56 | 47.5 ± 0.9b# | 203.4 ± 7.3 |
| Ob/Ob | 150 ± 7.49d*#$ | 98.8 ± 1.08a#$, b* | 67.5 ± 8.5 | 319.8 ± 27.1a#, b*$ |
| B. | ||||
|---|---|---|---|---|
| Female | Total Cholesterol (mg/dL) | HDL (mg/dL) | TG (mg/dL) | Glucose (mg/dL) |
| C57Bl6 | <100 | 48.63 ± 3.45 | 47.4 ± 2.22 | 192.9 ± 13.0 |
| [Tg(CAT)+/−] | <100 | 51.42 ± 3.2 | 50.2 ± 2.72 | 225 ± 9.0 |
| Bob-Cat | <100 | 47.45 ± 2.93 | 54.8 ± 3.27 | 176.3 ± 12.4 |
| Ob/Ob | 119.4 ± 3.8d*#$ | 93.43 ± 3.87d*#$ | 80.3 ± 9.23c*# | 367.8 ± 44.6d*#$ |
Lipid Profile and glucose were determined in blood obtained from both male and female mice of all genotypes on a Cholestech kit: (A) Total Cholesterol, High Density Lipoprotein (HDL), Triglyceride (TG), and Glucose levels in C57Bl6, [Tg(CAT)+/−], Bob-Cat, and Ob/Ob mice (n≥4/group) (B) Total Cholesterol, High Density Lipoprotein (HDL), Triglyceride (TG), and Glucose levels in C57Bl6, [Tg(CAT)+/−], Bob-Cat, and Ob/Ob female mice (n≥6/group). Data reported as mean +/− SEM and significant differences are displayed with letters indicating p values:
p<0.05,
p<0.01,
p<.001,
p<.0001; symbols represent significant differences between genotypes,
compared to C57Bl6,
compared to [Tg(CAT)+/−],
compared to BobCat.
Milliplex Mouse Adipokine Array was used to measure circulating levels of IL6, TNF α, MCP-1, insulin, leptin, and resistin in blood plasma. Results shown in Figure 6A revealed that [Tg(CAT)+/−] and Bob-Cat mice trended to have similar levels of insulin. There were no statistically significant differences for plasma levels of leptin or resistin which are two major adipokines released from adipose tissue, between the control C57Bl6 parent group and mouse groups that over express catalase. The trend was similar in females (Figure 6B), however, it is intriguing to note, the levels were higher compared to male groups. Ob/Ob had significantly higher levels of insulin and resistin and very minimal leptin compared to all other groups. Circulating levels of IL6, TNF α, and MCP-1 were either undetectable or no trends were seen between mouse groups.
Figure 6. Circulating Levels of Metabolic Parameters.

Circulating levels of insulin, leptin, and resistin was measured using an adipokine array on a Luminex System: (A) C57Bl6, Bob-Cat, [Tg(CAT)+/−], and Ob/Ob male mice; (B) C57Bl6, BobCat, [Tg(CAT)+/−], and Ob/Ob female mice. One-way ANOVA was used to determine significant differences between groups. Data are displayed as mean +/− SEM. Significant p values are denoted as letters, a=p<0.05, b=p<0.01, d=p<0.0001; symbols represent significant differences between genotypes, *=compared to C57Bl6.
3.7 Catalase mRNA, Protein Expression, and Enzyme Activity in Adipose Tissue
Being a key metabolic tissue that plays a role in obesity, catalase mRNA expression was determined in visceral (abdominal) adipose tissue (WAT) obtained from both male and female mice of all genotypes using RT-qPCR on a Bio-Rad MyiQ. In male mice, catalase mRNA expression was upregulated by about 35 fold in Bob-Cat mice and was about 5 fold higher in the Ob/Ob mice compared to C57Bl6 (Figure 7A1). Western blot showed increase in catalase protein in [Tg(CAT)+/] and Bob-Cat mice but lower levels in the Ob/Ob mice (Figure 7B). Catalase enzyme activity, as determined by measuring the decomposition of H2O2, showed varying activities in the adipose tissue (Figure 7C1). No significant differences were detected, but mice expressing catalase and Ob/Ob mice trended to have higher activity levels compared to C57Bl6 mice.
Figure 7. Catalase mRNA and Protein Expression, and Enzyme Activity in Adipose Tissue.

(A1) Male and (A2) female catalase mRNA expression measured by RT-qPCR of the adipose tissue in [Tg(CAT)+/−], Bob-Cat, and Ob/Ob mice depicted as fold change compared to C57Bl6 mice (n≥4/genotype) by ddCT method. (B) Western Blot of catalase protein shown as densitometric ratio of anti-Catalase and memcode stain of each genotype (n=3/group). (C) Catalase enzyme activity as measured by Aebi method (C1) male and (C2) female specific activity of catalase (n≥7/group). Data are reported as mean +/− SEM and significance was determined by one-way ANOVA. Letters indicate significant p values a=p<0.05, b=p<0.01, c=p<0.001; t symbols represent significant differences between genotypes, *=compared to C57Bl6, $=compared to Bob-Cat.
In contrast, females displayed no significant difference in catalase mRNA and protein expression in adipose tissue (Figure 7A2 and B). However, mice overexpressing catalase trended to have higher levels within adipose tissue in comparison to C57Bl6 and Ob/Ob mice. With regard to enzyme activity, catalase activity in females was highest in the Ob/Ob mice, but all genotypes trended to have higher levels than the C57Bl6 mice (Figure 7C2).
3.8 Oxyblot Detection of Oxidized Proteins in Adipose Tissue
Oxidized carbonyl groups are a commonly used marker of oxidative stress. Carbonylation of proteins in the adipose tissue was detected using oxyblot and evaluated based on densitometry ratios for each genotype. Male [Tg(CAT)+/−] had significantly lower (p<0.05) and Bob-Cat mice trended to have lower levels of carbonylated proteins within adipose tissue compared to the C57Bl6 control group (Figure 8A1–3). However, Ob/Ob mice had significantly higher levels of oxidized carbonyl groups than the Bob-Cat mice as well as the other two genotypes within the males (p<0.001). Female Bob-Cat mice showed no significant differences in oxidized proteins (Figure 8B1–3).
Figure 8. Oxyblot of Oxidized Proteins.

Oxidized carbonylated proteins in visceral adipose tissue: Male- (A1) Oxyblot of oxidized carbonyl groups; (A2) Memcode stain of total proteins; (A3) densitometry ratios of oxidized proteins to total proteins (memcode) in adipose tissue of C57Bl6, [Tg(CAT)+/−], Bob-Cat, and Ob/Ob male mice; Female- (B1–B3) The representative images from female mice of each genotype are displayed. Data were analyzed on GraphPad Prism 7 by one-way ANOVA and significant differences between groups are displayed. Error is reported as mean +/− SEM. Letters designate significant p values, a= p<0.05, d=<0.0001; symbols represent significant differences between genotypes, *=compared to C57Bl6, # =compared to [Tg(CAT)+/−], $=compared to BobCat.
3.9 mRNA Expression of Metabolic Genes in Adipose Tissue
The mRNA expression of genes involved in adipose function: leptin, adiponectin, MCP-1/JE, and IL1β was evaluated by RT-qPCR. In males, leptin, a key regulator of fat mass, was increased by about 4 fold in [Tg(CAT)+/−], approximately 188-fold in the Bob-Cat mice, and 88 fold in the Ob/Ob genotype compared to the C57Bl6 controls (Figure 9A1). In female mice, there was a significant increase in leptin in both the Bob-Cat and Ob/Ob mice; approximately 69 and 169-fold respectively (Figure 9B1).
Figure 9. Key Adipocytokine mRNA Expression in Adipose Tissue.

mRNA expression levels of (A1 and B1) leptin, (A2 and B2) adiponectin, (A3 and B3) MCP-1, and (A4 and B4) IL1-B measured by RT-qPCR of the adipose tissue in C57Bl6, [Tg(CAT)+/−], Bob-Cat, and Ob/Ob male (A) and female (B) mice, n≥3/genotype and gender. Results are depicted as fold change compared to C57Bl6 mice (n≥4/genotype) by ddCT Method. Data were analyzed by GraphPad Prism 7 using a one-way ANOVA. Significant p values are indicated by letters, a= p<0.05, b= p<0.01, c= p<.001, d=p<0.0001; symbols represent significant differences between genotypes, *=compared to C57Bl6, # =compared to [Tg(CAT)+/−], $=compared to BobCat.
Adiponectin, an anti-inflammatory adipokine which plays a key role in glucose and lipid signaling was also increased in the male Bob-Cat mice compared to C57Bl6 and [Tg(CAT)+/−] mice (Figure 9A2). A similar trend was also noted in female mice (p<0.05). Female Bob-Cat mice had significantly higher adiponectin levels than C57Bl6 mice (p<0.01) followed by the Ob/Ob female mice (p<0.01) (Figure 9B2). Both IL1β and MCP-1/JE, key pro-inflammatory adipokines, showed no significant differences between any of the lean genotypes in either sex; however, increased levels were seen in Ob/Ob mice (Figure 9A3–4, B3–4).
4. Discussion
Obesity, which is at its all-time peak worldwide, increases the risk to other metabolic diseases such as T2D, dyslipidemia, hypertension and atherosclerosis [3, 10]. Adipose tissue expansion and dysfunction is a hallmark of obesity. Over the years, researchers have attempted to understand the pathophysiology of obesity and how it leads to increased cardiometabolic diseases with the hope of finding preventive or treatment strategies [3, 7, 10]. Redox stress is one such common phenomenon that has been associated with obesity and its co-morbidities and is attributed to excess adipose mass and metainflammation [22].
Mitochondrial generation of superoxide or hydrogen peroxide is a major intermediate between intracellular metabolism and insulin signaling [42]. Modulating mitochondrial energetics by using mito-targeted antioxidants or excess catalase, lowered metabolic and energy imbalance and improved insulin sensitivity [43]. Overexpression of superoxide dismutase (SOD) in mice prevented insulin resistance but had very little impact on mitochondrial function [44]. Except for studies that showed that overexpression of catalase in a leptin resistant diabetic mouse model (db/db mice) prevented diabetic nephropathy [45–47] and that catalase knockout mice developed obesity and prediabetic phenotype [32], the effects of increased endogenous catalase expression in obesity models are understudied.
In this study, we successfully generated a new mouse model with an obese parent (Ob/Ob) background that expresses the hCAT gene, named Bob-Cat. Due to its increased catalase activity, it has lower “redox stress,” hence remains “stress-less.” As depicted in Figure 1 and the representative pie charts, Bob-Cat mice (heterozygous to Ob and expressing hCat) dominated the F2 and F3 generations. It was interesting to note that extremely low numbers of mice homozygous for the Ob gene and carrying the catalase gene were obtained during breeding. It is presumptive to assume that this skewness towards heterozygous mice might be due to higher catalase expression.
Confirmation of increased catalase expression in key metabolic tissues (liver, IM, adipose, and brain) of Bob-Cat mice makes this an excellent model to study obesogenic pathways. Phenotyping showed no obvious differences in body weights between the genotypes at weaning ages but ECHO-MRI showed obvious differences in body composition. There were sex differences in overall fat and lean mass. Male Bob-Cat mice had a similar fat mass compared to C57Bl6 mice but lower compared to the Ob/Ob mice. In contrast, female Bob-Cats, had a higher fat mass compared to [Tg(CAT)+/−]. The higher lean mass in male Bob-Cat compared to C57Bl6 mice and in female mice compared to both C57Bl6 and [Tg(CAT)+/−] was intriguing. As expected, only Ob/Ob mice had a significantly higher body weight and fat mass beginning at 4 weeks of age in comparison to C57Bl6.
It has been shown that even though body weights may not be different, the metabolic parameters may be functioning more efficiently in an individual with increased BMI. In contrast, individuals whose BMI falls within a “normal range” may still be metabolically unhealthy [48]. Therefore, we measured the metabolic parameters using CLAMS technology, and determined the VO2 intake, CO2 output, RER (VCO2/VO2), EE (kcal/h), average FI per day, and the X AMB (physical activity) within each genotype. Catalase overexpression, by virtue of lowering redox stress levels, altering adipocyte secretion of key adipokines, and modulating appetite regulation, was expected to increase EE and lower levels of FI. FI did not differ significantly between any genotypes, however, the antioxidant overexpressing mice trended towards decreased FI. Both groups of male mice that overexpressed catalase, [Tg(CAT)+/−] and Bob-Cat, significantly used more energy in heat production. The [Tg(CAT)+/−] genotype trended to have a higher activity level (though not statistically significant) in comparison to the other two genotypes. This may be due to the body’s response to the trend in higher body weight observed in adult [Tg(CAT)+/−] mice. The same could be noted for the Ob/Ob genotype. Heterozygozity of Lepob mice has been shown to display increased FI and altered glucose homeostasis, although mice did not differ in body weights compared to wild type [49]. The adult Ob/+ mice had increased fat mass compared to wild types which might be attributed to lower leptin protein production in these mice [50]. Bob-Cat mice, in spite of its heterozygous Ob/+ genotype, did not significantly differ from the control mouse in respect to RER. Fewer differences in RER and EE were seen in female BobCats. Cumulatively, CLAMS showed that catalase overexpression has a positive influence on energy metabolism.
Bob-Cat mice also did not significantly differ in blood glucose, HDL cholesterol, or TC levels in comparison to C57BL6 mice or [Tg(CAT)+/−]. However, Ob/Ob mice had higher levels of each compared to every other genotype. Although higher levels of HDL cholesterol are indicative of a healthier phenotype, the overall ratio of HDL cholesterol and TC is more important, explaining why the Ob/Ob mice do not have a healthier lipid profile in comparison to antioxidant-excess or control mice. It was interesting to note that [Tg(CAT)+/−] mice had significantly higher levels of TG in comparison to C57BL6, Bob-Cat, and even Ob/Ob mice. Insulin, leptin, and resistin levels did not differ significantly between mice overexpressing catalase (Bob-Cat and [Tg(CAT)+/−]) compared to C57BL6. However, females seemed to have a trend towards slightly lower levels of circulating insulin and leptin.
Catalase expression and activity in the visceral (abdominal) adipose tissue, which is one of the key metabolic tissues in obesity showed differences between the genotypes. The mice overexpressing catalase had higher catalase expression compared to the parent strains. Males had increased expression compared to female mice. Catalase expression was almost 35 fold higher in the adipose tissue of Bob-Cat compared to C57Bl6 mice. The 5 fold increased expression observed in Ob/Ob mice may be the result of a compensatory response to higher levels of oxidative stress in these mice due to increased fat mass and production of pro-inflammatory cytokines [51]. Catalase activity was increased in Bob-Cat mice compared to C57Bl6 mice in male and females. This increase in activity validated the genetic overexpression of endogenous catalase. The increases in catalase activity and lowered oxidative stress, as shown by decreased oxidatively modified proteins in the Bob-Cat mice (Figure 8), make this a novel “stress-less” mouse model.
Leptin and adiponectin are two adipokines that play a key role in adipose function. Leptin is a fundamental regulatory hormone that is primarily produced by adipocytes within WAT of both humans and rodents. The concentration of circulating leptin is directly proportional to total body fat [52]. The hormone’s main function is demonstrated within the arcuate nucleus of the hypothalamic region of the brain where it is able to decrease appetite and increase energy expenditure [53, 54] through signaling systems involved in the orexigenic and anorexigenic pathways [55]. Oxidative stress modulates leptin’s action leading to changes in fat mass, metabolic parameters, and inflammatory status [16]. Like leptin, adiponectin is most abundantly expressed in WAT, yet is downregulated during obesity [56]. Adiponectin protects against diseases such as diabetes and atherosclerosis [57]. Specifically, administration of adiponectin has been shown to both elicit glucose lowering effects and ameliorate insulin resistance [58]. In other studies, suppression of adiponectin signaling pathway resulted in decreased oxidative stress detoxifying enzymes such as catalase [59]. Leptin and adiponectin expression in the WAT were elevated in both sexes of Bob-Cat mice (p<0.0001) in comparison to the control C57Bl6 mice. There was a significant increase in adiponectin in the Bob-Cat genotype in comparison to C57Bl6 mice (p<0.05). Due to elevated leptin and adiponectin expression in Bob-Cat adipose tissue and an increase in catalase expression in other metabolic tissues such as brain, this mouse model can be used to study appetite regulation through the adipose-brain axis. With lower levels of the pro-inflammatory genes, IL1β and MCP-1/JE levels, the Bob-Cat mice is also ideal for studying metabolic changes resulting from dietary interventions or exercise. Table 4 provides a summary of the metabolic characteristics of the novel “stress-less” mouse model. The differences in phenotype observed between the two sexes are intriguing and needs further exploration.
Table 4.
Key Characteristics of the Novel “Stress-Less” Bob-Cat Mouse
| Male Characteristics
|
Female Characteristics
|
|
|---|---|---|
|
Bob-Cat |
|
Bob-Cat Mouse Model Key Characteristics: Bob-Cat genotype compared to C57Bl6 mice increase depicted as (+). Significance represented as p<0.05 +, p<.0001 ++++
Caution should be placed on the knowledge that excess oxidative stress induces antioxidant defense which in turn tilts the balance towards excess reductive stress [60]. Reductive stress in turn then leads to increased oxidative stress and has been implicated in various diseases [61]. This vicious cycle might have been at play in some of the previous studies using antioxidant overexpressing mouse models such as the study where excess glutathione peroxidase-1 showed increased body weight and insulin resistance [62]. Increased quenching of ROS in these mouse models interfered with insulin signaling pathways [63]. Therefore, the Bob-Cat mouse model can also be used as a good model to study the role of reductive stress in metabolic diseases.
5. Conclusions
Overall, based on the phenotypic results obtained in Bob-Cat mice, it is apparent that overexpression of catalase in an obese genotype modulated body composition while retaining a similar body weight in relation to the C57Bl6 and [Tg(CAT)+/−]. Significant changes in energy expenditure and activity levels of Bob-Cat mice compared to other genotypes suggest catalase is playing a role in appetite regulation of this novel “stress-less” mouse model. Significant differences in metabolic profile and oxidative stress make it a good model to study dietary and exercise interventions.
Supplementary Material
Figure 3. Body Composition: Fat and Lean Mass.

Body composition as determined by ECHO-MRI: Male (A1) Fat Mass and (A2) Lean Mass (g) of each genotype (n≥4/group). Female (B1) Fat Mass and (B2) Lean Mass (g) of each genotype (n≥4/group). One-way ANOVA was performed on GraphPad Prism 7. Data are represented as mean +/− SEM. Letters indicate significant p values, a=p<0.05; symbols display significant differences between genotypes, *=compared to C57Bl6, # =compared to [Tg(CAT)+/−].
Highlights.
Novel Bob-Cat mice express human catalase in an obese, leptin resistant background
Antioxidant overexpression modifies body composition and metabolic parameters
Bob-Cat mice show sex-specific differences in redox regulation and adipocytokines
Useful model for studying redox stress and obesogenic pathways
Acknowledgments
The authors acknowledge Dr. Jung Han Kim for her assistance with ECHO-MRI and CLAMS studies.
Funding: This study was partially supported by NIH Grant 5R01HL-074239 (NS) and 5P20RR016477 (NS) and WV-NASA Grant Consortium (DA).
Abbreviations
- 1X PBST
1X Phosphate Buffered Saline and Tween 20
- 1X TBST
1X Tris Buffered Saline
- BMI
Body Mass Index
- BSA
Bovine Serum Albumin
- CLAMS
Comprehensive Lab Animal Monitoring System
- DNPH
Dinitrophenylhydrazine
- ECHO-MRI
Magnetic Resonance Imaging
- EE
Energy Expenditure
- EtOH
Ethanol
- EtBr
Ethidium Bromide
- FI
Food Intake
- HDL
High Density Lipoprotein
- hCAT
Human catalase
- H2O2
Hydrogen Peroxide
- IL1β
Interleukin 1 beta
- IM
Intestinal Mucosa
- LDL
Low Density Lipoprotein
- MCP-1/JE
Monocyte chemotactic protein-1
- mCAT
Mouse catalase
- RIPA buffer
Radioimmunoprecipitation assay buffer
- ROS
Reactive Oxygen Species
- RBC’s
Red Blood Cells
- RER
Respiratory Exchange Ratio
- SDS
Sodium Dodecyl Sulfate
- SEM
Standard Error of the Mean
- SOD
Superoxide Dismutase
- TC
Total Cholesterol
- TG
Triglyceride
- TE
Tris-EDTA
- T2D
Type 2 Diabetes
- U.S.A
United States of America
- VCO2
Volume of CO2 production
- VO2
Volume of O2 consumption
- WAT
White Adipose Tissue
- X AMB
X Ambulatory
Footnotes
Publisher's Disclaimer: This is a PDF file of an unedited manuscript that has been accepted for publication. As a service to our customers we are providing this early version of the manuscript. The manuscript will undergo copyediting, typesetting, and review of the resulting proof before it is published in its final citable form. Please note that during the production process errors may be discovered which could affect the content, and all legal disclaimers that apply to the journal pertain.
References
- 1.Smith KB, Smith MS. Obesity Statistics. Primary care. 2016;43:121–135. ix. doi: 10.1016/j.pop.2015.10.001. [DOI] [PubMed] [Google Scholar]
- 2.Arroyo-Johnson C, Mincey KD. Obesity Epidemiology Worldwide. Gastroenterol Clin North Am. 2016;45:571–579. doi: 10.1016/j.gtc.2016.07.012. [DOI] [PMC free article] [PubMed] [Google Scholar]
- 3.Lewis KH, Edwards-Hampton SA, Ard JD. Disparities in Treatment Uptake and Outcomes of Patients with Obesity in the USA. Curr Obes Rep. 2016;5:282–290. doi: 10.1007/s13679-016-0211-1. [DOI] [PubMed] [Google Scholar]
- 4.Pigeyre M, Yazdi FT, Kaur Y, Meyre D. Recent progress in genetics, epigenetics and metagenomics unveils the pathophysiology of human obesity. Clin Sci (Lond) 2016;130:943–986. doi: 10.1042/CS20160136. [DOI] [PubMed] [Google Scholar]
- 5.Silventoinen K, Jelenkovic A, Sund R, Hur YM, Yokoyama Y, Honda C, Hjelmborg J, Moller S, Ooki S, Aaltonen S, Ji F, Ning F, Pang Z, Rebato E, Busjahn A, Kandler C, Saudino KJ, Jang KL, Cozen W, Hwang AE, Mack TM, Gao W, Yu C, Li L, Corley RP, Huibregtse BM, Christensen K, Skytthe A, Kyvik KO, Derom CA, Vlietinck RF, Loos RJ, Heikkila K, Wardle J, Llewellyn CH, Fisher A, McAdams TA, Eley TC, Gregory AM, He M, Ding X, Bjerregaard-Andersen M, Beck-Nielsen H, Sodemann M, Tarnoki AD, Tarnoki DL, Stazi MA, Fagnani C, D’Ippolito C, Knafo-Noam A, Mankuta D, Abramson L, Burt SA, Klump KL, Silberg JL, Eaves LJ, Maes HH, Krueger RF, McGue M, Pahlen S, Gatz M, Butler DA, Bartels M, van Beijsterveldt TC, Craig JM, Saffery R, Freitas DL, Maia JA, Dubois L, Boivin M, Brendgen M, Dionne G, Vitaro F, Martin NG, Medland SE, Montgomery GW, Chong Y, Swan GE, Krasnow R, Magnusson PK, Pedersen NL, Tynelius P, Lichtenstein P, Haworth CM, Plomin R, Bayasgalan G, Narandalai D, Harden KP, Tucker-Drob EM, Oncel SY, Aliev F, Spector T, Mangino M, Lachance G, Baker LA, Tuvblad C, Duncan GE, Buchwald D, Willemsen G, Rasmussen F, Goldberg JH, Sorensen T, Boomsma DI, Kaprio J. Genetic and environmental effects on body mass index from infancy to the onset of adulthood: an individual-based pooled analysis of 45 twin cohorts participating in the COllaborative project of Development of Anthropometrical measures in Twins (CODATwins) study. Am J Clin Nutr. 2016;104:371–379. doi: 10.3945/ajcn.116.130252. [DOI] [PMC free article] [PubMed] [Google Scholar]
- 6.Spahis S, Borys JM, Levy E. Metabolic Syndrome as a Multifaceted Risk Factor for Oxidative Stress. Antioxid Redox Signal. 2017;26:445–461. doi: 10.1089/ars.2016.6756. [DOI] [PubMed] [Google Scholar]
- 7.Santilli F, Guagnano MT, Vazzana N, La Barba S, Davi G. Oxidative stress drivers and modulators in obesity and cardiovascular disease: from biomarkers to therapeutic approach. Curr Med Chem. 2015;22:582–595. doi: 10.2174/0929867322666141128163739. [DOI] [PubMed] [Google Scholar]
- 8.McMurray F, Patten DA, Harper ME. Reactive Oxygen Species and Oxidative Stress in Obesity-Recent Findings and Empirical Approaches. Obesity (Silver Spring) 2016;24:2301–2310. doi: 10.1002/oby.21654. [DOI] [PubMed] [Google Scholar]
- 9.Savini I, Catani MV, Evangelista D, Gasperi V, Avigliano L. Obesity-associated oxidative stress: strategies finalized to improve redox state. Int J Mol Sci. 2013;14:10497–10538. doi: 10.3390/ijms140510497. [DOI] [PMC free article] [PubMed] [Google Scholar]
- 10.Manna P, Jain SK. Obesity, Oxidative Stress, Adipose Tissue Dysfunction, and the Associated Health Risks: Causes and Therapeutic Strategies. Metab Syndr Relat Disord. 2015;13:423–444. doi: 10.1089/met.2015.0095. [DOI] [PMC free article] [PubMed] [Google Scholar]
- 11.Paglialunga S, Ludzki A, Root-McCaig J, Holloway GP. In adipose tissue, increased mitochondrial emission of reactive oxygen species is important for short-term high-fat diet-induced insulin resistance in mice. Diabetologia. 2015;58:1071–1080. doi: 10.1007/s00125-015-3531-x. [DOI] [PubMed] [Google Scholar]
- 12.Krueger PM, Coleman-Minahan K, Rooks RN. Race/ethnicity, nativity and trends in BMI among U.S. adults. Obesity (Silver Spring) 2014;22:1739–1746. doi: 10.1002/oby.20744. [DOI] [PMC free article] [PubMed] [Google Scholar]
- 13.Shill DD, Southern WM, Willingham TB, Lansford KA, McCully KK, Jenkins NT. Mitochondria-specific antioxidant supplementation does not influence endurance exercise training-induced adaptations in circulating angiogenic cells, skeletal muscle oxidative capacity or maximal oxygen uptake. J Physiol. 2016;594:7005–7014. doi: 10.1113/JP272491. [DOI] [PMC free article] [PubMed] [Google Scholar]
- 14.Ma W, Yuan L, Yu H, Xi Y, Xiao R. Mitochondrial dysfunction and oxidative damage in the brain of diet-induced obese rats but not in diet-resistant rats. Life Sci. 2014;110:53–60. doi: 10.1016/j.lfs.2014.07.018. [DOI] [PubMed] [Google Scholar]
- 15.Haas JT, Staels B. An oxidative stress paradox: time for a conceptual change? Diabetologia. 2016;59:2514–2517. doi: 10.1007/s00125-016-4117-y. [DOI] [PubMed] [Google Scholar]
- 16.Drougard A, Fournel A, Valet P, Knauf C. Impact of hypothalamic reactive oxygen species in the regulation of energy metabolism and food intake. Frontiers in neuroscience. 2015;9:56. doi: 10.3389/fnins.2015.00056. [DOI] [PMC free article] [PubMed] [Google Scholar]
- 17.Diane A, Pierce WD, Mangat R, Borthwick F, Nelson R, Russell JC, Heth CD, Jacobs RL, Vine DF, Proctor SD. Differential expression of hypothalamic, metabolic and inflammatory genes in response to short-term calorie restriction in juvenile obese- and lean-prone JCR rats. Nutr Diabetes. 2015;5:e178. doi: 10.1038/nutd.2015.28. [DOI] [PMC free article] [PubMed] [Google Scholar]
- 18.Wang X, Hai C. Redox modulation of adipocyte differentiation: hypothesis of “Redox Chain” and novel insights into intervention of adipogenesis and obesity. Free Radic Biol Med. 2015;89:99–125. doi: 10.1016/j.freeradbiomed.2015.07.012. [DOI] [PubMed] [Google Scholar]
- 19.Abella V, Scotece M, Conde J, Pino J, Gonzalez-Gay MA, Gomez-Reino JJ, Mera A, Lago F, Gomez R, Gualillo O. Leptin in the interplay of inflammation, metabolism and immune system disorders. Nat Rev Rheumatol. 2017 doi: 10.1038/nrrheum.2016.209. [DOI] [PubMed] [Google Scholar]
- 20.Bluher M, Mantzoros CS. From leptin to other adipokines in health and disease: facts and expectations at the beginning of the 21st century. Metabolism. 2015;64:131–145. doi: 10.1016/j.metabol.2014.10.016. [DOI] [PubMed] [Google Scholar]
- 21.Camargos AC, Mendonca VA, Andrade CA, Oliveira KS, Tossige-Gomes R, Rocha-Vieira E, Neves CD, Vieira EL, Leite HR, Oliveira MX, Junior AL, Coimbra CC, Lacerda AC. Neuroendocrine Inflammatory Responses in Overweight/Obese Infants. PLoS One. 2016;11:e0167593. doi: 10.1371/journal.pone.0167593. [DOI] [PMC free article] [PubMed] [Google Scholar]
- 22.Fernandez-Sanchez A, Madrigal-Santillan E, Bautista M, Esquivel-Soto J, Morales-Gonzalez A, Esquivel-Chirino C, Durante-Montiel I, Sanchez-Rivera G, Valadez-Vega C, Morales-Gonzalez JA. Inflammation, oxidative stress, and obesity. Int J Mol Sci. 2011;12:3117–3132. doi: 10.3390/ijms12053117. [DOI] [PMC free article] [PubMed] [Google Scholar]
- 23.Trostchansky A, Quijano C, Yadav H, Kelley EE, Cassina AM. Interplay between Oxidative Stress and Metabolism in Signalling and Disease. Oxid Med Cell Longev. 2016;2016:3274296. doi: 10.1155/2016/3274296. [DOI] [PMC free article] [PubMed] [Google Scholar]
- 24.Spychalowicz A, Wilk G, Sliwa T, Ludew D, Guzik TJ. Novel therapeutic approaches in limiting oxidative stress and inflammation. Curr Pharm Biotechnol. 2012;13:2456–2466. [PubMed] [Google Scholar]
- 25.Haidara M, Mikhailidis DP, Yassin HZ, Dobutovic B, Smiljanic KT, Soskic S, Mousa SA, Rizzo M, Isenovic ER. Evaluation of the possible contribution of antioxidants administration in metabolic syndrome. Curr Pharm Des. 2011;17:3699–3712. doi: 10.2174/138161211798220882. [DOI] [PubMed] [Google Scholar]
- 26.Santanam N, Aug N, Zhou M, Keshava C, Parthasarathy S. Overexpression of human catalase gene decreases oxidized lipid-induced cytotoxicity in vascular smooth muscle cells. Arterioscler Thromb Vasc Biol. 1999;19:1912–1917. doi: 10.1161/01.atv.19.8.1912. [DOI] [PubMed] [Google Scholar]
- 27.Meilhac O, Zhou M, Santanam N, Parthasarathy S. Lipid peroxides induce expression of catalase in cultured vascular cells. J Lipid Res. 2000;41:1205–1213. [PubMed] [Google Scholar]
- 28.Meilhac O, Ramachandran S, Chiang K, Santanam N, Parthasarathy S. Role of arterial wall antioxidant defense in beneficial effects of exercise on atherosclerosis in mice. Arterioscler Thromb Vasc Biol. 2001;21:1681–1688. doi: 10.1161/hq1001.097106. [DOI] [PubMed] [Google Scholar]
- 29.Ge X, Pettan-Brewer C, Morton J, Carter K, Fatemi S, Rabinovitch P, Ladiges WC. Mitochondrial catalase suppresses naturally occurring lung cancer in old mice. Pathobiol Aging Age Relat Dis. 2015;5:28776. doi: 10.3402/pba.v5.28776. [DOI] [PMC free article] [PubMed] [Google Scholar]
- 30.Yao C, Behring JB, Shao D, Sverdlov AL, Whelan SA, Elezaby A, Yin X, Siwik DA, Seta F, Costello CE, Cohen RA, Matsui R, Colucci WS, McComb ME, Bachschmid MM. Overexpression of Catalase Diminishes Oxidative Cysteine Modifications of Cardiac Proteins. PLoS One. 2015;10:e0144025. doi: 10.1371/journal.pone.0144025. [DOI] [PMC free article] [PubMed] [Google Scholar]
- 31.Park YS, Uddin MJ, Piao L, Hwang I, Lee JH, Ha H. Novel Role of Endogenous Catalase in Macrophage Polarization in Adipose Tissue. Mediators Inflamm. 2016;2016:8675905. doi: 10.1155/2016/8675905. [DOI] [PMC free article] [PubMed] [Google Scholar]
- 32.Heit C, Marshall S, Singh S, Yu X, Charkoftaki G, Zhao H, Orlicky DJ, Fritz KS, Thompson DC, Vasiliou V. Catalase deletion promotes prediabetic phenotype in mice. Free Radic Biol Med. 2017;103:48–56. doi: 10.1016/j.freeradbiomed.2016.12.011. [DOI] [PMC free article] [PubMed] [Google Scholar]
- 33.Chen X, Liang H, Van Remmen H, Vijg J, Richardson A. Catalase transgenic mice: characterization and sensitivity to oxidative stress. Arch Biochem Biophys. 2004;422:197–210. doi: 10.1016/j.abb.2003.12.023. [DOI] [PubMed] [Google Scholar]
- 34.Chen X, Mele J, Giese H, Van Remmen H, Dolle ME, Steinhelper M, Richardson A, Vijg J. A strategy for the ubiquitous overexpression of human catalase and CuZn superoxide dismutase genes in transgenic mice. Mechanisms of ageing and development. 2003;124:219–227. doi: 10.1016/s0047-6374(02)00161-6. [DOI] [PubMed] [Google Scholar]
- 35.Ioffe E, Moon B, Connolly E, Friedman JM. Abnormal regulation of the leptin gene in the pathogenesis of obesity. Proc Natl Acad Sci U S A. 1998;95:11852–11857. doi: 10.1073/pnas.95.20.11852. [DOI] [PMC free article] [PubMed] [Google Scholar]
- 36.Lord GM, Matarese G, Howard JK, Baker RJ, Bloom SR, Lechler RI. Leptin modulates the T-cell immune response and reverses starvation-induced immunosuppression. Nature. 1998;394:897–901. doi: 10.1038/29795. [DOI] [PubMed] [Google Scholar]
- 37.Ingalls AM, Dickie MM, Snell GD. Obese, a new mutation in the house mouse. The Journal of heredity. 1950;41:317–318. doi: 10.1093/oxfordjournals.jhered.a106073. [DOI] [PubMed] [Google Scholar]
- 38.Ellett JD, Evans ZP, Zhang G, Chavin KD, Spyropoulos DD. A rapid PCR-based method for the identification of ob mutant mice. Obesity (Silver Spring) 2009;17:402–404. doi: 10.1038/oby.2008.443. [DOI] [PubMed] [Google Scholar]
- 39.Pfaffl MW. A new mathematical model for relative quantification in real-time RT–PCR. Nucleic Acids Research. 2001;29:e45–e45. doi: 10.1093/nar/29.9.e45. [DOI] [PMC free article] [PubMed] [Google Scholar]
- 40.Lowry OH, Rosebrough NJ, Farr AL, Randall RJ. Protein measurement with the Folin phenol reagent. J Biol Chem. 1951;193:265–275. [PubMed] [Google Scholar]
- 41.Aebi H. Catalase in vitro. Methods in enzymology. 1984;105:121–126. doi: 10.1016/s0076-6879(84)05016-3. [DOI] [PubMed] [Google Scholar]
- 42.Hoehn KL, Salmon AB, Hohnen-Behrens C, Turner N, Hoy AJ, Maghzal GJ, Stocker R, Van Remmen H, Kraegen EW, Cooney GJ, Richardson AR, James DE. Insulin resistance is a cellular antioxidant defense mechanism. Proc Natl Acad Sci U S A. 2009;106:17787–17792. doi: 10.1073/pnas.0902380106. [DOI] [PMC free article] [PubMed] [Google Scholar]
- 43.Anderson EJ, Lustig ME, Boyle KE, Woodlief TL, Kane DA, Lin CT, Price JW, 3rd, Kang L, Rabinovitch PS, Szeto HH, Houmard JA, Cortright RN, Wasserman DH, Neufer PD. Mitochondrial H2O2 emission and cellular redox state link excess fat intake to insulin resistance in both rodents and humans. J Clin Invest. 2009;119:573–581. doi: 10.1172/JCI37048. [DOI] [PMC free article] [PubMed] [Google Scholar]
- 44.Liu Y, Qi W, Richardson A, Van Remmen H, Ikeno Y, Salmon AB. Oxidative damage associated with obesity is prevented by overexpression of CuZn- or Mn-superoxide dismutase. Biochem Biophys Res Commun. 2013;438:78–83. doi: 10.1016/j.bbrc.2013.07.029. [DOI] [PMC free article] [PubMed] [Google Scholar]
- 45.Brezniceanu ML, Liu F, Wei CC, Chenier I, Godin N, Zhang SL, Filep JG, Ingelfinger JR, Chan JS. Attenuation of interstitial fibrosis and tubular apoptosis in db/db transgenic mice overexpressing catalase in renal proximal tubular cells. Diabetes. 2008;57:451–459. doi: 10.2337/db07-0013. [DOI] [PubMed] [Google Scholar]
- 46.Godin N, Liu F, Lau GJ, Brezniceanu ML, Chenier I, Filep JG, Ingelfinger JR, Zhang SL, Chan JS. Catalase overexpression prevents hypertension and tubular apoptosis in angiotensinogen transgenic mice. Kidney Int. 2010;77:1086–1097. doi: 10.1038/ki.2010.63. [DOI] [PubMed] [Google Scholar]
- 47.Lau GJ, Godin N, Maachi H, Lo CS, Wu SJ, Zhu JX, Brezniceanu ML, Chenier I, Fragasso-Marquis J, Lattouf JB, Ethier J, Filep JG, Ingelfinger JR, Nair V, Kretzler M, Cohen CD, Zhang SL, Chan JS. Bcl-2-modifying factor induces renal proximal tubular cell apoptosis in diabetic mice. Diabetes. 2012;61:474–484. doi: 10.2337/db11-0141. [DOI] [PMC free article] [PubMed] [Google Scholar]
- 48.Denis GV, Hamilton JA. Healthy obese persons: how can they be identified and do metabolic profiles stratify risk? Curr Opin Endocrinol Diabetes Obes. 2013;20:369–376. doi: 10.1097/01.med.0000433058.78485.b3. [DOI] [PMC free article] [PubMed] [Google Scholar]
- 49.Flatt PR, Bailey CJ. Abnormal plasma glucose and insulin responses in heterozygous lean (ob/+) mice. Diabetologia. 1981;20:573–577. doi: 10.1007/BF00252768. [DOI] [PubMed] [Google Scholar]
- 50.Chung WK, Belfi K, Chua M, Wiley J, Mackintosh R, Nicolson M, Boozer CN, Leibel RL. Heterozygosity for Lep(ob) or Lep(rdb) affects body composition and leptin homeostasis in adult mice. Am J Physiol. 1998;274:R985–990. doi: 10.1152/ajpregu.1998.274.4.R985. [DOI] [PubMed] [Google Scholar]
- 51.Espinosa-Diez C, Miguel V, Mennerich D, Kietzmann T, Sanchez-Perez P, Cadenas S, Lamas S. Antioxidant responses and cellular adjustments to oxidative stress. Redox Biol. 2015;6:183–197. doi: 10.1016/j.redox.2015.07.008. [DOI] [PMC free article] [PubMed] [Google Scholar]
- 52.Friedman JM, Mantzoros CS. 20 years of leptin: from the discovery of the leptin gene to leptin in our therapeutic armamentarium. Metabolism. 2015;64:1–4. doi: 10.1016/j.metabol.2014.10.023. [DOI] [PubMed] [Google Scholar]
- 53.Spiegelman BM, Flier JS. Obesity and the regulation of energy balance. Cell. 2001;104:531–543. doi: 10.1016/s0092-8674(01)00240-9. [DOI] [PubMed] [Google Scholar]
- 54.Martin RL, Perez E, He YJ, Dawson R, Jr, Millard WJ. Leptin resistance is associated with hypothalamic leptin receptor mRNA and protein downregulation. Metabolism. 2000;49:1479–1484. doi: 10.1053/meta.2000.17695. [DOI] [PubMed] [Google Scholar]
- 55.Frago LM, Chowen JA. Hypothalamic Leptin and Ghrelin Signaling as Targets for Improvement in Metabolic Control. Curr Pharm Des. 2015;21:3596–3605. doi: 10.2174/1381612821666150710145428. [DOI] [PubMed] [Google Scholar]
- 56.Nigro E, Scudiero O, Monaco ML, Palmieri A, Mazzarella G, Costagliola C, Bianco A, Daniele A. New insight into adiponectin role in obesity and obesity-related diseases. Biomed Res Int. 2014;2014:658913. doi: 10.1155/2014/658913. [DOI] [PMC free article] [PubMed] [Google Scholar]
- 57.Wang ZV, Scherer PE. Adiponectin, the past two decades. J Mol Cell Biol. 2016;8:93–100. doi: 10.1093/jmcb/mjw011. [DOI] [PMC free article] [PubMed] [Google Scholar]
- 58.Liu Y, Turdi S, Park T, Morris NJ, Deshaies Y, Xu A, Sweeney G. Adiponectin corrects high-fat diet-induced disturbances in muscle metabolomic profile and whole-body glucose homeostasis. Diabetes. 2013;62:743–752. doi: 10.2337/db12-0687. [DOI] [PMC free article] [PubMed] [Google Scholar]
- 59.Iwabu M, Yamauchi T, Okada-Iwabu M, Sato K, Nakagawa T, Funata M, Yamaguchi M, Namiki S, Nakayama R, Tabata M, Ogata H, Kubota N, Takamoto I, Hayashi YK, Yamauchi N, Waki H, Fukayama M, Nishino I, Tokuyama K, Ueki K, Oike Y, Ishii S, Hirose K, Shimizu T, Touhara K, Kadowaki T. Adiponectin and AdipoR1 regulate PGC-1alpha and mitochondria by Ca(2+) and AMPK/SIRT1. Nature. 2010;464:1313–1319. doi: 10.1038/nature08991. [DOI] [PubMed] [Google Scholar]
- 60.Margaritelis NV, Kyparos A, Paschalis V, Theodorou AA, Panayiotou G, Zafeiridis A, Dipla K, Nikolaidis MG, Vrabas IS. Reductive stress after exercise: The issue of redox individuality. Redox Biol. 2014;2:520–528. doi: 10.1016/j.redox.2014.02.003. [DOI] [PMC free article] [PubMed] [Google Scholar]
- 61.Korge P, Calmettes G, Weiss JN. Increased reactive oxygen species production during reductive stress: The roles of mitochondrial glutathione and thioredoxin reductases. Biochim Biophys Acta. 2015;1847:514–525. doi: 10.1016/j.bbabio.2015.02.012. [DOI] [PMC free article] [PubMed] [Google Scholar]
- 62.McClung JP, Roneker CA, Mu W, Lisk DJ, Langlais P, Liu F, Lei XG. Development of insulin resistance and obesity in mice overexpressing cellular glutathione peroxidase. Proc Natl Acad Sci U S A. 2004;101:8852–8857. doi: 10.1073/pnas.0308096101. [DOI] [PMC free article] [PubMed] [Google Scholar]
- 63.Lei XG, Cheng WH. New roles for an old selenoenzyme: evidence from glutathione peroxidase-1 null and overexpressing mice. J Nutr. 2005;135:2295–2298. doi: 10.1093/jn/135.10.2295. [DOI] [PubMed] [Google Scholar]
Associated Data
This section collects any data citations, data availability statements, or supplementary materials included in this article.