

Summary
Across the domains of spatial navigation and episodic memory, the hippocampus is thought to play a critical role in disambiguating (pattern separating) representations of overlapping events. However, it is not fully understood how and why hippocampal patterns become separated. Here, we test the idea that event overlap triggers a ‘repulsion’ among hippocampal representations that develops over the course of learning. Using a naturalistic route-learning paradigm and spatiotemporal pattern analysis of human fMRI data, we found that hippocampal representations of overlapping routes gradually diverged with learning to the point that they became less similar than representations of non-overlapping events. In other words, the hippocampus not only disambiguated overlapping events, but formed representations that ‘reversed’ the objective similarity among routes. This finding, which was selective to the hippocampus, is not predicted by standard theoretical accounts of pattern separation. Critically, because the overlapping route stimuli that we used ultimately diverged (so that each route contained overlapping and non-overlapping segments), we were able to test whether the reversal effect was selective to the overlapping segments. Indeed, once overlapping routes diverged (eliminating spatial and visual similarity), hippocampal representations paradoxically became relatively more similar. Finally, using a novel analysis approach, we show that the degree to which individual hippocampal voxels were initially shared across route representations was predictive of the magnitude of learning-related separation. Collectively, these findings indicate that event overlap triggers a repulsion of hippocampal representations—a finding that provides critical mechanistic insight into how and why hippocampal representations become separated.
Graphical abstract
Chanales et al. report that representations of overlapping spatial routes in the human hippocampus dramatically diverge with learning, ultimately becoming less similar than representations of non-overlapping routes. These findings suggest that event overlap triggers repulsion of hippocampal representations.
Introduction
Distinct experiences often contain overlapping elements, creating the potential for memory interference. For example, a single location (e.g., a living room) may be the site of many different experiences and corresponding memories. The hippocampus is widely thought to play a critical role in coding overlapping events such that interference is minimized. Compelling evidence for this function comes from intracranial recordings in rodents during spatial navigation. For example, when rodents alternate between left- and right-hand turns in a T-maze, cells within the hippocampus differentially fire during the central stem (the overlapping path), according to whether the current route is a ‘right-turn’ or ‘left-turn’ route [1, 2]. Likewise, hippocampal place fields may completely remap with contextual changes in a rodent's environment [3, 4]. In human studies of episodic memory, fMRI evidence indicates that visual stimuli that are shared across multiple event sequences are distinctly coded in the hippocampus according to the specific sequence to which they belong [5]. While these studies and others have led to general agreement that the hippocampus forms distinct codes for overlapping experiences [6-16], the factors that trigger divergence of hippocampal representations are not fully understood.
The formation of distinct hippocampal representations is traditionally thought to be a result of sparse coding within the hippocampus [17-22]. Although there are not enough neurons in the hippocampus to entirely avoid representational overlap, sparse coding ensures that similar experiences are less likely to share neural units, thereby resulting in orthogonalized representations. While this coding property of the hippocampus may play a critical role in reducing overlap during initial encoding, it is unlikely to provide a complete account of how hippocampal representations become distinct. In particular, overlap among hippocampal representations also changes with experience, suggesting learning-related factors that contribute to divergence. For example, hippocampal remapping in rodents may emerge over the course of learning [3, 23], and even the sensitivity of stable hippocampal place fields can be tuned by experience [24]. Similarly, experience-dependent divergence of hippocampal activity patterns has been observed in human fMRI data [6, 13, 25, 26]. Computational models suggest that one factor that drives learning-related divergence of hippocampal representations is competition [26-29]. When activity patterns overlap–which may reflect residual overlap following initial orthogonalization–this creates competition during learning that the hippocampus ‘solves’ by reducing similarity among representations. This perspective makes a critical prediction: that overlapping representations should systematically move apart from one another over the course of learning. Indeed, the representational distance between overlapping events should increase to a greater degree than the distance between non-overlapping events. This idea, which can be thought of as repulsion, is quite distinct from the idea of orthogonalization because repulsion necessarily requires that an event's representation is directly shaped by a similar (competing) event's representation. Limited evidence from human fMRI studies hints at repulsion among overlapping hippocampal representation [6, 13, 25] but these observations come from episodic memory paradigms with static visual stimuli, which contrasts sharply with the spatial learning and navigation paradigms that have been used to study disambiguation of hippocampal activity patterns in rodents.
Here, we bridge evidence from spatial learning paradigms in rodents and human episodic memory paradigms by testing, in a pair of human fMRI studies, whether overlap among spatial routes triggers an experience-dependent repulsion of hippocampal representations. Modeled after canonical rodent T-maze paradigms, we used a real-world route-learning paradigm that contained pairs of spatially-overlapping routes. However, in contrast to rodent T-maze paradigms, we also included pairs of non-overlapping routes, so that the similarity of overlapping route representations could be expressed relative to the similarity of non-overlapping route representations–a critical comparison for testing whether divergence preferentially occurs among overlapping events. fMRI data were collected over the course of an extended learning session, allowing for representational similarity to be compared across time. Additionally, because our route stimuli were temporally dynamic, we used a novel spatiotemporal pattern analysis method wherein neural representations consisted of patterns of activity distributed across space (fMRI voxels) and time.
Our paradigm allowed us to test several critical predictions. First, if repulsion occurs, representations of overlapping events should diverge to a greater degree than non-overlapping events—that is, overlapping events should systematically move apart from each other. An unambiguous sign of repulsion is if overlapping event representations become less similar than non-overlapping event representations—what we will refer to as a ‘reversal effect’–as this outcome cannot be explained by orthogonalization of neural codes. Recently, we have shown at least one learning context in which a reversal effect is observed in the hippocampus [6], but it remains to be determined whether this seemingly paradoxical result is a general property of the hippocampus and whether it applies to the types of spatial learning paradigms commonly used in rodent studies. Second, to establish the critical point that event overlap itself triggers repulsion of hippocampal representations, it is essential to establish that repulsion only occurs for the segments of routes that actually overlap. For example, in a T-maze paradigm, repulsion should only occur in the central stem of the maze, which is shared across the left- and right-turn routes. To our knowledge, rodent studies have not directly compared population-level neural similarity during overlapping vs. non-overlapping segments of a maze. Third, repulsion should be relatively slow to develop as it is inherently a learning phenomenon [29], which contrasts with the idea that coding properties of the hippocampus allow for an immediate orthogonalization of activity patterns. Finally, as an extension of the prediction that event overlap triggers divergence, we also conducted a novel analysis in which we tested whether the degree of learning-related plasticity that an individual hippocampal voxel experienced was predicted by initial representational overlap within that voxel. This allowed us to determine whether learning-related plasticity preferentially occurs in representational units that are shared across events [27, 28].
Results
Behavioral measures of route discrimination
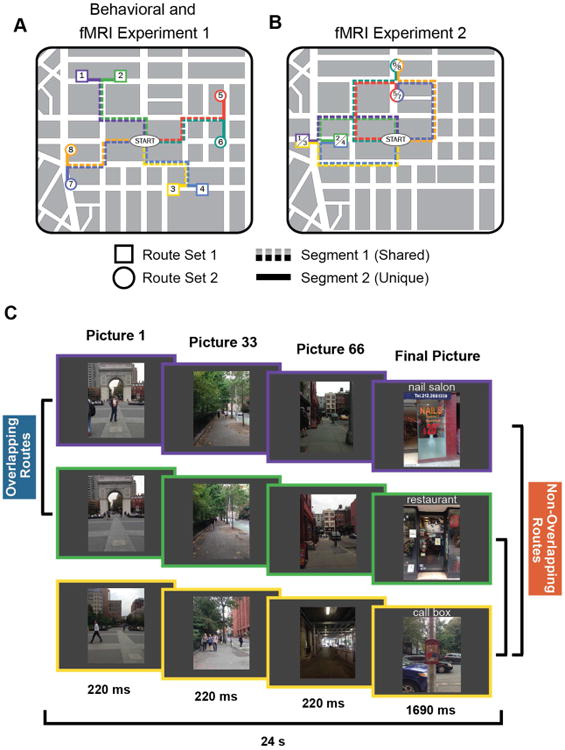
In an initial behavioral experiment, each subject studied sets of real-world routes that included pairs that shared a common path before diverging to terminate at distinct destinations (‘overlapping routes’) and pairs with no paths in common (‘non-overlapping routes’) (Figure 1A). Importantly, each route contributed to both conditions. For example, ‘route 1’ and ‘route 2’ were overlapping routes, but ‘route 1’ and ‘route 3’ were non-overlapping routes (Figure 1C). Each route contained an initial segment that was shared with another route (Segment 1), and a later segment, including the destination, that was route-specific (Segment 2; Figure 1A). Although the real-world spatial locations of the overlapping segments were identical, the pictures for each route were taken at different times and therefore differed subtly in terms of pedestrians, vehicles, etc. (Figure 1C and Movies S1-S4). Routes were studied twice per round for 14 rounds. Subjects were instructed to learn the specific path to each destination, but were not told the destination at the start of the route. After each study round, subjects were shown individual pictures drawn from the routes and selected the destination associated with each picture. Of central interest was accuracy for pictures drawn from Segment 1 of each route because selecting the correct destination for these pictures required discriminating between overlapping routes. Overall, subjects selected the correct destination (‘target’) at a higher rate than the destination of the overlapping route (‘competitor’) and selected the competitor at a higher rate than destinations from non-overlapping routes (‘other’) (ps < 0.000003; Figure 2A). Thus, there was competition between overlapping routes, but subjects generally succeeded in discriminating between them. Moreover, the relative percentage of target vs. competitor responses markedly increased across learning rounds (F1,21 = 38.11, p = 0.000004; Figures 2B and 2C).
Figure 1.
Route stimuli and experimental design.
(A) In the behavioral experiment and fMRI Experiment 1, stimuli consisted of 8 routes that traversed the New York University campus. Each subject learned 4 routes–either Set 1 (routes 1-4) or Set 2 (routes 5-8). Each set included pairs of routes that shared a common path (‘overlapping routes’; e.g. routes 1 and 2) and pairs of routes with no common paths (‘non-overlapping routes’; e.g. routes 1 and 3). Individual routes contained two segments: Segment 1 refers to the portion of each route that shared a path with another route; Segment 2 refers to the unique portion of each route (after the overlapping routes diverged). (B) In fMRI Experiment 2 the stimuli again consisted of 8 routes with each subject learning 4 of the 8 routes, with the 4 routes per set containing overlapping and non-overlapping pairs. However, some of the non-overlapping route pairs in Experiment 2 terminated at the same destination (e.g. routes 1 and 3) whereas others terminated at distinct destinations (e.g., routes 1 and 4). (C) In each Experiment, each trial consisted of a series of rapidly presented pictures that lasted a total of 24s.
See also Movies S1-S8.
Figure 2.
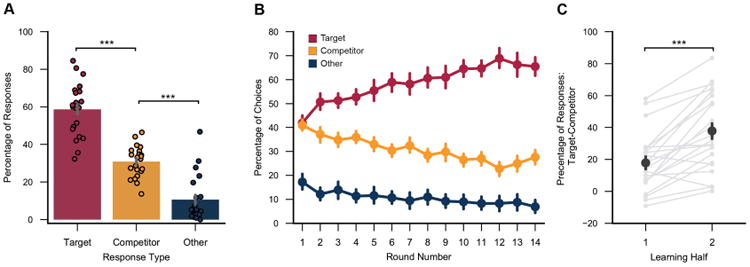
Memory performance for Segment 1 pictures in the behavioral experiment.
(A) After each learning round subjects were shown static images sampled from each route and were asked to choose the corresponding destination from a set of four picture options: the target destination, the destination associated with the overlapping route (‘competitor’) and two destinations associated with non-overlapping routes (‘other’). Subjects were significantly more likely to select the target destination than competitor destination (F1,21 = 43.31, p = 0.000002) and significantly more likely to chose the competitor destination than other destinations (F1,21 = 41.39, p = 0.000002), despite the fact that ‘other’ options were more prevalent (2/4) than competitor options (1/4). (B) The relative percentage of target vs. competitor responses markedly increased over learning rounds (F1,21 = 38.11, p = 0.000004). (C) Discrimination between overlapping routes (percentage target responses - competitor responses) was significantly greater in the 2nd half of learning than the 1st half (t21 = 5.78, p = 0.00001). Error bars reflect +/- SEM. *** p < 0.001. See also Figure S1.
Hippocampal representations of overlapping routes diverge with learning
We next tested for hippocampal repulsion of overlapping routes in two fMRI studies. The first fMRI study used the same stimuli as the behavioral study (Figure 1A). The second fMRI study used a new set of stimuli that again included overlapping and non-overlapping routes, but some of the non-overlapping routes terminated at a common destination (Figure 1B). Except where noted otherwise, all analyses below combine data across experiments and analyses of non-overlapping routes are restricted to those that terminated at distinct destinations (so that comparisons of overlapping and non-overlapping routes were matched in that every route terminated at a distinct destination). For Segment 1 of each route, we obtained a corresponding neural activity pattern by extracting voxel-wise patterns of activity as they unfolded over time. These spatiotemporal activity patterns were then correlated for every pair of routes, resulting in a correlation matrix reflecting pairwise route similarity (Figure 3A). We considered pattern similarity for (1) repetitions of the same route, (2) overlapping routes, and (3) non-overlapping routes. Separate correlation matrices were generated for each subject's hippocampus and for a control region: the ‘parahippocampal place area’ (PPA), which is adjacent to the hippocampus and is involved in scene processing and navigation (Figure 3B) [30, 31]. Because our behavioral experiment indicated that discrimination of overlapping routes robustly improved from the 1st to 2nd half of learning (Figure 2C), we divided the fMRI data into halves and independently computed pattern similarity measures within each of these halves. As in the behavioral experiment, subjects in both fMRI experiments were able to successfully discriminate between the overlapping routes by the end of learning (see Figure S1).
Figure 3.
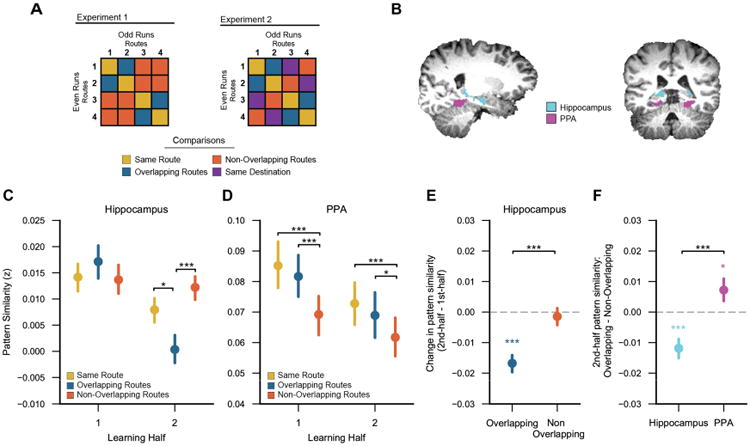
Learning-related changes in hippocampal pattern similarity.
(A) Sample similarity matrices depicting analyses for Experiments 1 and 2 (routes 5-8 are not shown). For each Experiment, Pearson correlations were applied to spatiotemporal activity patterns to measure the similarity between: repetitions of the same route (‘same route’), routes with overlapping paths but distinct destinations (‘overlapping routes’), and routes with non-overlapping paths and distinct destinations (‘non-overlapping routes’). Experiment 2 included an additional comparison of routes with non-overlapping paths that ended at a common destination (‘same destination’). All correlations were applied to spatiotemporal activity patterns from independent fMRI runs (odd vs. even runs). (B) Hippocampus and parahippocampal place area (PPA) regions of interest for a representative subject, displayed on their T1 anatomical scan. (C) Within the hippocampus, the similarity of overlapping routes relative to same routes decreased across learning (1st vs. 2nd half; p = 0.009). Likewise, there was a learning-related decrease in the similarity of overlapping routes relative to non-overlapping routes (p = 0.0008). (D) Within PPA, there was no learning-related change in the relative similarity of overlapping vs. same routes (p = 0.96) nor in the relative similarity of overlapping vs. non-overlapping routes (p = 0.13). (E) Within the hippocampus, overlapping route similarity decreased across learning (1st vs. 2nd half, p = 0.0000006) whereas non-overlapping route similarity did not change with learning (p = 0.63). (F) In the 2nd half of learning, overlapping route similarity was significantly lower than non-overlapping route similarity within the hippocampus (p = 0.0005; ‘reversal effect’) whereas in PPA the opposite was true: overlapping route similarity was significantly greater than non-overlapping route similarity (p = 0.038). Error bars reflect +/- SEM. * p < 0.05, ** p < 0.01, *** p < 0.001. See also Figures S2-S4.
Of critical interest, there was a learning-related decrease in pattern similarity among overlapping compared to non-overlapping routes, as reflected by an interaction between overlap (overlapping/non-overlapping) and learning (1st half/2nd half) (F1,39 = 13.163, p = 0.0008; Figure 3C). Whereas pattern similarity among overlapping routes decreased with learning (F1,39 = 35.21, p = 0.0000006), similarity among non-overlapping routes did not change (F1,39 = 0.24, p = 0.63; Figure 3E). This dissociation is striking when considering that all routes contributed to both the overlapping and non-overlapping comparisons. Thus, learning did not globally reduce similarity among routes; rather, learning specifically reduced similarity between overlapping routes. Moreover, overlapping route similarity decreased to the point that in the 2nd half of learning overlapping routes were markedly less similar than non-overlapping routes (F1,39 = 14.20, p = 0.0005; Figure 3F). This result was significant in each of the fMRI Experiments (ps < .05; see Figure S2 for results separated by experiment). Thus, despite the fact that overlapping routes were spatially and visually more similar than non-overlapping routes, the hippocampus represented overlapping routes as less similar than non-overlapping routes–a result we refer to as a ‘reversal effect’ because the representational structure is opposite to the inherent similarity structure of the routes. This reversal effect was not present in the 1st half of learning (F1,39 = 1.41, p = 0.24), confirming that it developed over learning (see Figure S3 for finer-grain consideration of learning-related changes over time).
We also tested whether overlapping route similarity decreased relative to repetitions of the same route. Indeed, there was a significant learning-related decrease in overlapping route similarity relative to same route similarity (F1,39 = 7.59, p = 0.009). Overlapping route similarity was significantly lower than same route similarity in the 2nd half of learning (F1,39 = 5.61, p = 0.023), but not in the 1st half of learning (F1,39 = 0.85, p = 0.35).
As a comparison point for the hippocampal data, we considered representational structure within PPA. However, there was no learning-related reduction in the similarity of overlapping vs. non-overlapping routes in PPA (Segment 1 data only; F1,39 = 2.42, p = 0.13; Figure 3D). In fact, overlapping route similarity was greater than non-overlapping route similarity in the 1st half (F1,39 = 21.01, p = 0.00005) and 2nd half of learning (F1,39 = 4.63, p = 0.038; Figure 3F; note: this effect differed across Experiments, see Figure S2). Thus, the reversal effect observed in the hippocampus by the end of learning was absent in PPA. The dissociation between PPA and hippocampus at the end of learning was reflected in a highly significant region × overlap interaction (F1,39 = 22.18, p = 0.00003). Similar dissociations were also observed when comparing hippocampus to other cortical areas involved in spatial navigation (retrosplenial cortex), object processing (lateral occipital cortex), and medial temporal lobe cortex, more generally (see Figure S4). Within PPA, there was also no learning-related change in overlapping vs. same route similarity (F1,39 = 0.003, p = 0.96) with no significant difference between overlapping and same route similarity in the 1st half (F1,39 = 0.89, p = 0.35) or 2nd half of learning (F1,39 = 0.86, p = 0.36).
Divergence of hippocampal patterns is triggered by route overlap
If the reversal effect was triggered by route overlap, this makes a paradoxical prediction: that the reversal effect should diminish once overlapping routes diverge. Indeed, when considering data from Segment 2–i.e., after overlapping routes diverged– the reversal effect was absent (F1,39 = 0.31, p = 0.58; Figures 4A and 4B). The selectivity of the reversal effect to the overlapping portion of the overlapping routes was confirmed by a significant overlap × segment interaction (2nd half data only: F1,39 = 4.28, p = 0.045). Thus, the reversal effect only occurred for route segments where visual and spatial overlap was actually present (Segment 1), strongly suggesting that route overlap triggered the reversal effect.
Figure 4.
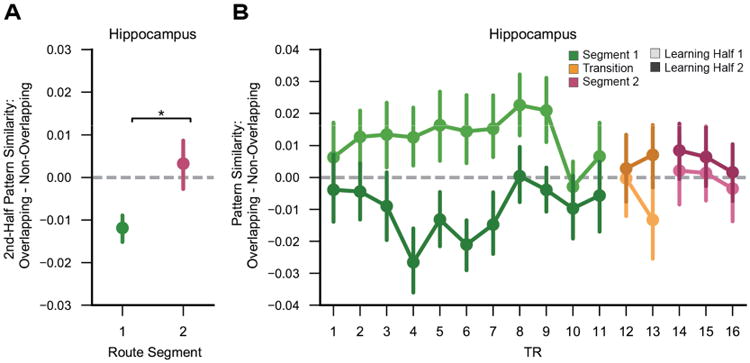
Hippocampal reversal effect across route segments.
(A) In the 2nd half of learning, the hippocampal reversal effect (overlapping route similarity < non-overlapping route similarity) was significant for Segment 1 (p = 0.0005), but not Segment 2 (p = 0.58) and the interaction between overlap and segment was significant (p = 0.045). (B) Time point by time point comparison of spatial pattern similarity for overlapping vs. non-overlapping routes for each learning half. Spatial patterns analyzed at each time point [time to volume repetition (TR)] were computed as the average pattern of a sliding 3-TR window. Transition TRs reflect time points that included the end of Segment 1 and the beginning of Segment 2 Error bars reflect +/-SEM. * p < 0.05.
To further strengthen the argument that the reversal effect was a reaction to route overlap, we next tested whether time point by time point fluctuations in the reversal effect (Figure 4B) were related to behavioral measures of route discrimination. Because memory-based route discrimination was more extensively tested in the behavioral experiment (Figure 2), we used data from this experiment to calculate mean discrimination difficulty for each picture sampled from each route. We then binned these data to match the temporal resolution of the fMRI data (see STAR Methods) so that time point by time point fluctuations in discrimination accuracy could be correlated with fluctuations in the reversal effect. Indeed, there was a remarkably strong correlation between these measures (r = 0.87, p = 0.0003; Figure 5A and 5B). Specifically, the reversal effect was relatively stronger at time points where the routes were relatively difficult to discriminate. The correlation remained marginally significant when only considering time points from Segment 1 (r = 0.58, p = 0.061). These data strongly support the idea that the reversal effect was triggered by competition between route representations.
Figure 5.
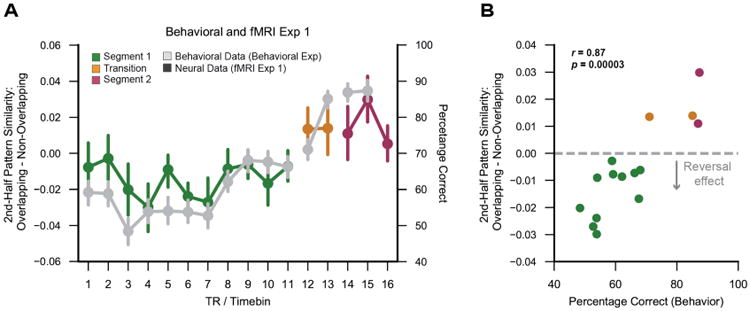
Hippocampal reversal effect as a function of memory-based discrimination.
(A) Grey lines: time point by time point measures of mean memory-based route discrimination in the behavioral Experiment. Colored lines: 2nd-half hippocampal pattern similarity for overlapping – non-overlapping routes in fMRI Experiment 1. Note: fMRI data were only used from fMRI Experiment 1 because fMRI Experiment 2 used different stimuli than the behavioral Experiment. (B) Scatterplot showing the relationship between behavioral discrimination accuracy and hippocampal pattern similarity for overlapping – non-overlapping routes (each dot corresponds to data from one TR/time bin). There was a strong positive correlation (r = 0.87, p = 0.00003) between these measures, reflecting a weaker reversal effect for time points where behavioral discrimination was relatively easy (top-right corner of scatter plot) and a stronger reversal effect for time points where behavioral discrimination was relatively difficult (bottom-left corner of scatter plot). This correlation remains marginally significant if restricted to the time points within Segment 1 (r = 0.58, p = 0.061). Error bars reflect +/- SEM.
Learning-related changes do not reflect destination coding
One way in which hippocampal route representations may diverge is through the learned ability to predict destinations [32-36]. To test this possibility we considered data from Experiment 2, which contained pairs of non-overlapping routes that terminated at distinct destinations as well as pairs of non-overlapping routes that terminated at the same destination. If hippocampal activity patterns reflected navigational goals, pattern similarity from Segment 1 should be greater for ‘same destination’ routes than ‘distinct destination’ routes. However, there was no learning related increase in hippocampal similarity for same destination relative to distinct destination routes (F1,20 = 0.53, p= 0.47), nor was there a difference between same and distinct destination routes when considering 2nd half data alone (M = 0.016 and M = 0.012, respectively; t20 = 0.98, p = 0.34). Thus, the observed divergence of hippocampal activity patterns is not readily explained by destination coding.
Voxel-Level changes in route similarity
The preceding results indicate that hippocampal representations of overlapping events diverged with learning, and that this divergence was triggered by route overlap. But what factors determined the level of plasticity that individual voxels exhibited? On the one hand, the reversal effect potentially reflects a global form of plasticity, with all voxels showing a comparable degree of learning-related divergence. However, a theoretically important alternative, motivated by our main findings above, is that the amount of initial representational overlap (within a voxel) determines the degree to which divergence occurs [27, 28].
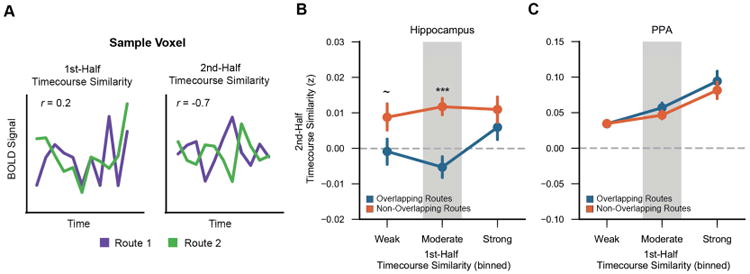
To test whether voxel-level divergence varied according to initial representational overlap, we characterized every voxel in terms of the similarity with which it responded to overlapping routes. Because spatial pattern similarity cannot be computed at the level of individual voxels (i.e., a single voxel has no spatial pattern), we instead capitalized on the temporal dimension of our stimuli, computing the similarity of each voxel's timecourse across pairs of routes. We refer to this measure as ‘timecourse similarity’ (Figure 6A). Voxels were rank-ordered by 1st half timecourse similarity and binned into groups corresponding to ‘weak,’ ‘moderate,’ or ‘strong’ similarity (i.e., the bottom 1/3, middle 1/3, and top 1/3 of similarity values). Importantly, this binning was independently repeated for every pair of routes, each voxel in each region of interest, and each subject. Performing the analysis in a route-specific manner is important because a given voxel may exhibit strong timecourse similarity across one pair of routes but weak timecourse similarity across a different pair of routes (see Figure S6). Timecourse similarity values from the 2nd half of learning were then obtained from these voxel bins. This allowed for timecourse similarity values at the end of learning to be expressed as a function of timecourse similarity at the beginning of learning. Note: we did not measure changes in timecourse similarity from the 1st to 2nd half because such measures would be distorted by regression to the mean.
Figure 6.
Voxel-level plasticity.
(A) Timecourse similarity was defined as the correlation of a single voxel's temporal pattern of activity across two different routes. For each voxel, timecourse similarity was separately computed for the 1st half and 2nd half of learning. (B,C) Second-half timecourse similarity plotted as a function of 1st-half timecourse similarity, separately for the hippocampus (B) and PPA (C) and for overlapping (blue) and non-overlapping (orange) routes. Within the hippocampus, 2nd-half timecourse similarity was markedly lower for overlapping than non-overlapping routes (reversal effect) for voxels that were moderately shared at the beginning of learning (p = 0.00009). Error bars reflect +/- SEM. ∼ p < 0.1, *** p < 0.001. See also Figures S5 and S6.
Within the hippocampus, an ANOVA with factors of overlap (overlapping/non-overlapping) and bin (weak/moderate/strong) revealed a significant overlap × bin interaction (F278 = 3.19, p = 0.046). This interaction reflected a relatively greater difference between overlapping and non-overlapping routes (reversal effect) for voxels that exhibited ‘moderate’ timecourse similarity during the 1 st-half of learning. Namely, the reversal effect was highly significant in the ‘moderate’ bin (F1,39 = 19.17, p = 0.00009), marginally significant in the ‘weak’ bin (F1,39 = 3.62, p = 0.064), and not significant in the ‘strong’ bin (F1,39 = 1.53, p = 0.22). Thus, the reversal effect was most pronounced among voxels that exhibited moderate similarity across overlapping routes at the beginning of learning. Considering overlapping routes alone-as opposed to the difference between overlapping and non-overlapping routes–2nd half timecourse similarity also significantly varied according to 1st half similarity (F2,78 = 4.74, p = 0.012), with the function qualitatively characterized by a dip for voxels in the ‘moderate’ bin (Figure 6B). Indeed, adding a quadratic term to a mixed-effects regression model that included a linear term significantly improved the model fit (χ2= 6.06, p = 0.014), indicating a non-monotonic relationship between timecourse similarity at the beginning vs. end of learning. For non-overlapping routes, 2nd half timecourse similarity did not vary according to 1st half similarity (F2,78 = 0.28, p = 0.76). See Figure S5 for the results of a complementary Bayesian curve-fitting analysis that relates 1st half timecourse similarity to 2nd half timecourse similarity.
The relationship between 1st and 2nd half timecourse similarity for overlapping routes was markedly different in PPA, as reflected by a significant region (hippocampus/PPA) × bin interaction (F2,78 = 18.12, p = 0.0000003). A region × bin × overlap interaction was marginally significant (F2,78 = 2.95, p = 0.058). Qualitatively, PPA voxels that were moderately shared across overlapping routes in the 1st half of learning remained moderately shared in the 2nd half of learning (Figure 6C).
Collectively, these findings suggest a ‘Goldilocks effect,’ wherein intermediate levels of overlap produce the strongest amount of learning-related divergence in the hippocampus. At a more general level, these findings provide unique evidence that initial overlap among hippocampal representations is an important determinant of learning-related plasticity.
Discussion
Here, we found that hippocampal representations of overlapping spatial routes dramatically diverged with learning–to the point that overlapping routes were coded as less similar than non-overlapping routes. This ‘reversal effect’ clearly emerged with learning and it paralleled behavioral improvement in memory-based route discrimination. The result was also selective to the hippocampus, with no evidence of a reversal effect in PPA or other cortical regions (Figure S4). Finally, using a novel analysis approach, we show that plasticity within hippocampal activity patterns was most pronounced for voxels that were moderately shared across overlapping routes at the beginning of learning.
Measuring hippocampal representations of overlapping events
Several details of our paradigm and analyses are critical for interpreting our findings. First, we specifically compared representations of overlapping events to representations of non-overlapping events [6]. This allowed for learning-related changes to be expressed relative to a meaningful baseline—a baseline that, to our knowledge, is absent in rodent T-maze paradigms. Indeed, the fact that hippocampal representations of visually- and spatially-overlapping routes became less similar than routes that contained no spatial overlap or visual similarity is not only striking, but it provides essential insight into the underlying mechanism (a point we detail below). Second, our design did not involve separate sets of routes for the overlapping and non-overlapping comparisons [5, 11, 12]; rather, each route was included in each comparison. For example, whereas routes 1 and 2 represent overlapping routes, routes 1 and 3 represent non-overlapping routes. As such, any observed differences between overlapping and non-overlapping routes cannot be attributed to differences between the actual stimuli or to differences in attention, familiarity, vigilance, etc. It is also of note that our findings generalized across entirely different sets of stimuli (Experiments 1 and 2). Lastly, for our critical comparison of overlapping vs. non-overlapping routes, we focused on spatiotemporal activity patterns during the overlapping segments of the routes (Segment 1 data)–that is, before the overlapping routes diverged. Indeed, once the overlapping routes diverged (Segment 2 data), the hippocampal reversal effect ‘disappeared’ (Figures 4A and 4B). Thus, hippocampal representations of overlapping routes were most dissimilar when routes actually overlapped, clearly suggesting that the reversal effect was triggered by event overlap.
Mechanism underlying hippocampal reversal effect
While there is general agreement that the hippocampus disambiguates overlapping event representations—a phenomenon that has been termed ‘pattern separation’—there remains debate about how pattern separation is achieved, with an emerging perspective that multiple, computationally distinct mechanisms are involved [18, 22]. However, the most prominent account is that pattern separation is achieved by sparse coding in the hippocampus—particularly within the dentate gyrus [17-22]. With sparse codes, the probability of individual neurons being shared across representations is reduced and resulting representations are orthogonalized. While our data do not argue against this idea, this account fails to explain our central findings. In particular, sparse coding does not explain why overlapping route representations would be less similar than non-overlapping representations. If every route were represented by a unique hippocampal code (due to sparse coding), then the similarity among overlapping routes would be equal to—but not lower than—the similarity among non-overlapping routes.
An additional important consideration in understanding the observed reversal effect is that it emerged with learning. While there are several existing accounts of how learning contributes to divergence of hippocampal activity patterns, the critical test of these accounts is whether they can explain why the hippocampus would represent overlapping routes as less similar than non-overlapping routes. For example, the hippocampus is thought to play a critical role in establishing unique contexts for overlapping events [5, 10, 33]. By learning to associate overlapping events with distinct contexts, hippocampal activity patterns should diverge over time [10, 37]. However, associating each route with a unique context should only reduce global similarity among events and does not explain why overlapping routes would be less similar than non-overlapping routes. In fact, this account would, if anything, predict greater hippocampal pattern similarity for overlapping routes than non-overlapping routes because overlapping routes inherently share more contextual information (e.g., spatial locations and landmarks) [10, 37]. Similarly, hippocampal activity patterns may diverge with learning if subjects learn to predict route destinations [32-36], but this account, like a context account, fails to explain why overlapping event representations would be less similar than non-overlapping event representations. Moreover, we did not observe any evidence of destination coding in the present study. Finally, it is possible that, with learning, subjects selectively oriented attention to route-unique features. Again, however, attending to route-unique features should reduce global similarity but does not explain the reversal effect. Moreover, if hippocampal activity patterns were influenced by attention, we would expect to see attention-related effects in high-level visual cortical areas as well [38], but the reversal effect was fully absent in scene- and object-related cortical areas (Figures 3F and S4).
Conceptually, an appealing way to account for the hippocampal reversal effect is that route overlap triggered a repulsion of event representations [27-29]. From this perspective, co-activation of similar memories triggered adaptive changes in hippocampal representations such that overlapping memories specifically ‘moved apart’ from one another. By analogy, this repulsion is similar to a teacher moving feuding children to opposite corners of a classroom in that the goal is to specifically increase the distance between the feuding children (as opposed to the distance between all children). Thus, in contrast to orthogonalization, where overlapping memories are represented as ‘unique,’ a repulsion account holds that overlapping memories are represented as ‘different from one another.’ A repulsion account is not only consistent with the observed reversal effect but also readily explains the striking and seemingly paradoxical finding that the hippocampal reversal effect ‘disappeared’ precisely once routes diverged (Segment 2; Figures 4A and 4B). In fact, when considering more fine-grained temporal fluctuations, the reversal effect was strongly correlated with the difficulty of memory-based discrimination (Figure 5). These findings clearly indicate that the reversal effect was most pronounced when competition between overlapping routes was highest. The idea of competition-induced repulsion among hippocampal representations has been elegantly described in biologically plausible computational models of the hippocampus, and the mechanism underlying this repulsion has been termed ‘differentiation’ [26, 29]. While a limited number of human fMRI studies have provided strong hints of differentiation in the hippocampus [6, 13, 25, 26, 29], the present findings provide the strongest and most unambiguous evidence to date that hippocampal representations of overlapping events diverge to the point that they are less similar than non-overlapping events.
Because we measured hippocampal similarity over the course of an extended learning paradigm, we were also able to show that the reversal effect was remarkably slow to emerge—only emerging after routes had been presented ∼20 times (Figure S3). However, this slow emergence strongly paralleled behavioral improvements in memory-based discrimination of the overlapping routes, as identified in a separate behavioral study (Figure 2). The parallel between the emergence of the reversal effect and behavioral improvement is consistent with the idea that differentiation is a learning-related [26, 29] and behaviorally-relevant mechanism [6].
While we primarily focus on the hippocampal reversal effect as measured during the 2nd half of learning, two other comparisons are worth noting. First, in the 1st half of learning, hippocampal pattern similarity for overlapping routes was numerically, but not significantly, greater than for non-overlapping routes (Figure 3A). While this null result may be partly due to immediate orthogonalization of route representations in the hippocampus [17-22], it is important to note that when considering spatial pattern similarity on a time point by time point basis (as opposed to spatiotemporal pattern similarity), representations of overlapping routes tended to be more similar than representations of non-overlapping routes (Figure 4B); in fact, when aggregating across time points, the difference between overlapping and non-overlapping routes was significant (F1,39 = 6.06, p = 0.018). Thus, there was mixed evidence for greater similarity among overlapping compared to non-overlapping routes at the beginning of learning, which may indicate that initial orthogonalization reduced, but did not fully eliminate, similarity between overlapping and non-overlapping routes [39], and the reversal effect operated upon this residual overlap. Second, it is potentially surprising that hippocampal pattern similarity was not significantly greater (in the 1st or 2nd halves of learning) for same route comparisons relative to non-overlapping routes [by comparison, this difference was highly robust in PPA (1st half: F1,39 = 19.88, p = 0.00007; 2nd half: F1,39 = 9.85, p = 0.003]. However, this curious result is not necessarily at odds with our other findings. Namely, if representations of overlapping routes diverge with learning, this necessarily entails that each route representation changes relative to itself [40]. Critically, whereas a given route representation may systematically move away from its initial state, it need not systematically move away from non-overlapping route representations. Thus, gradual within-route representational changes (which are necessary to achieve differentiation of overlapping routes) may have contributed to the relatively low same route similarity values that we observed.
Voxel-level plasticity
Motivated by our primary findings that route overlap triggered repulsion of hippocampal representations, we considered a separate and novel question: whether the degree of plasticity (reversal effect) that an individual voxel experienced was predicted by representational overlap within that voxel. In most fMRI studies, this question would be difficult to address because representational overlap, as indexed by spatial pattern similarity, cannot be computed at the level of a single voxel. Here, however, because of the temporally-dynamic nature of our stimuli, we used timecourse similarity to measure the similarity with which a single voxel responded to each pair of routes. Indeed, we observed that the reversal effect was not evenly distributed across voxels; rather, there was a ‘sweet spot,’ with the reversal effect disproportionately occurring in voxels that exhibited ‘moderate’ degrees of timecourse similarity at the beginning of learning.
Why might the reversal effect disproportionately occur for voxels with moderate levels of initial timecourse similarity? When a voxel responds similarly to a pair of overlapping routes (i.e., high timecourse similarity), this suggests that the voxel–or ensembles of neurons within that voxel–are ‘shared’ across those routes' representations. Critically, it is proposed that this form of representational ‘sharing’ is precisely what triggers hippocampal differentiation. Namely, if two overlapping events— A and A′—share common representational units (voxels, neurons, or connections between neurons), then activation of one event (A) is likely to activate the overlapping event (A′), and vice versa. For example, when viewing route 1, route 2 (the overlapping route) is likely to be partially activated [41-43]. When this occurs, the co-activated representation is subject to plasticity. Interestingly, and central to interpreting the present findings, it is argued that the plasticity that these co-activated units experience is non-monotonically related to their level of activation, with moderately activated units subject to weakening, whereas strongly activated units are strengthened and weakly activated units do not experience plasticity [27-29, 40, 44-46]. Putatively, this non-monotonic plasticity rule reflects a competition between excitation and inhibition, with moderate activation corresponding to inhibition ‘overcoming’ excitation. From this perspective, the present finding of a non-monotonic relationship between initial timecourse similarity and the reversal effect potentially reflects the same putative non-monotonic relationship between activation and plasticity. That said, our analysis does not constitute a direct test of this model—mainly because timecourse similarity is not a direct measurement of co-activation. However, this perspective offers a theoretically grounded and biologically plausible interpretation of our findings. Regardless of the specific mechanistic account, the present findings provide novel evidence that the degree of representational divergence experienced by individual hippocampal voxels is determined, at least in part, by the degree of representational overlap during initial stages of learning. This finding further strengthens our central argument that overlap itself triggers a repulsion of hippocampal representations.
Comparison to rodent studies
While, the experimental design of the present study was inspired by canonical rodent T-maze paradigms [1, 2], our paradigm and analyses afford unique insight relative to these studies. A classic finding from T-maze studies is that the hippocampus differentially represents the central stem of the maze according to whether the upcoming turn is a left or right turn. Put another way, two left-turn trials will elicit more similar hippocampal responses than will left- and right-turn trials. However, this L-L vs. L-R comparison is most closely aligned with the comparison of same vs. overlapping routes in the present study. While we did find greater hippocampal similarity for same routes than overlapping routes (Figure 3C), this comparison is open to many mechanistic interpretations. Instead, our critical focus was on the comparison between overlapping and non-overlapping routes. In a T-maze paradigm, this comparison would be most analogous to comparing the similarity of L-R trials in the central stem of one maze to the central stem responses across two different mazes. Based on our findings, the predicted result would be that L-R hippocampal similarity within the central stem of a maze would be lower than central-stem similarity across two different mazes. To our knowledge, however, this comparison/result has not been reported in rodent T-maze studies.
Pattern separation in the rodent hippocampus has also been studied in the context of remapping [4]. The present findings raise the question of whether remapping might also be triggered by overlap. While we are not aware of prior evidence suggesting this, it is difficult to compare the present findings with evidence for remapping in rodents. First, remapping depends on identifying the spatial preference of individual place cells, which is beyond the current resolution of fMRI. Second, remapping takes multiple forms (global remapping and rate remapping) [47] and these distinct forms of remapping are thought to be differentially related to coding for spatial vs. non-spatial information [47, 48]. In the present study, because we did not record from individual place cells, it is difficult to infer whether changes in hippocampal activity patterns more likely reflected something akin to global remapping or rate remapping. For example, it is possible that changes in hippocampal activity patterns reflected changes in spatial reference frames [3, 47, 49] and/or changes in the features represented at specific locations. Although beyond the scope of the present study, an important objective for future research will be to reconcile human fMRI evidence of learning-related changes in hippocampal activity patterns with the phenomena of global and rate remapping in rodents.
Star Methods
Contact For Reagent And Resource Sharing
Further information and requests for resources and reagents should be directed to and will be fulfilled by the Lead Contact, Brice Kuhl (bkuhl@uoregon.edu).
Experimental Model and Subject Details
Subjects
New York University (NYU) students and alumni who were familiar with the NYU campus participated in the study. Subjects were restricted to NYU alumni and students in order to facilitate route learning and to reduce potential between-subject variance. Subjects were between the ages of 18-35, right-handed, native English speakers, had normal or corrected-to-normal vision and had no history of neurological disorders. Twenty-two subjects participated in the behavioral experiment (15 female; mean age = 20.77). Two additional subjects’ data were not collected due to technical errors. Twenty subjects (13 female; mean age = 22.15) participated in fMRI Experiment 1. Four additional subjects were excluded from data analysis - one for falling asleep in the scanner, two for technical errors during scanning, and one due to unreliable localizer data (see Regions of Interest). Twenty-one subjects (9 female; mean age = 23.17) participated in fMRI Experiment 2. One additional subject's data was excluded from data analysis due to excessive head motion and another additional subject was excluded for technical errors during scanning. Sample sizes for the fMRI studies were based on a similar experiment from our lab [6]. Informed consent was obtained according to procedures approved by the New York University Committee on Activities Involving Human Subjects.
Method Details
Stimuli and Design
In the behavioral experiment and fMRI Experiment 1 the stimuli consisted of eight routes that traversed the NYU campus (Figure 1A). Each route was comprised of a series of 98 unique pictures. All pictures were taken at regular intervals (every 10 paces) from an egocentric perspective by a researcher walking along the route. All routes started in the same location and made exactly three turns before ending at distinct destinations. Critically, the 8 routes consisted of 4 overlapping pairs. Overlapping pairs followed the same path for the majority of the route before diverging on the third turn to their respective destinations. The pictures for each route were taken at different times and therefore the pictures during the overlapping portion of routes were subtly different and could be distinguished from one another based on subtle differences in the pedestrians, vehicles, lighting, etc. For analysis purposes, routes were divided into pairs that shared an overlapping path (‘overlapping routes’; e.g. routes 1 and 2) or took distinct paths (‘non-overlapping routes’; e.g. routes 1 and 3). Furthermore, each route was divided into two segments: ‘Segment 1’ refers to the segment of each route that overlapped with another route and ‘Segment 2’ refers to the route-unique segment of each route. The third turn–which marked the boundary between Segments 1 and 2– occurred at the exact same picture numbers within pairs of overlapping routes (e.g., for routes 1 and 2) and varied minimally (between picture numbers 74-77) across sets of overlapping pairs (e.g., for routes 1/2 vs. routes 3/4). Likewise, all turns within a pair of overlapping routes occurred at identical time points in order to maximize the similarity of overlapping routes. There was exactly one overlapping pair that left the starting point in each cardinal direction (north, south, east, west). The 8 routes were divided into 2 sets (north/south routes and east/west routes). Each subject was assigned one set of routes (4 routes total) to learn, with the assignment of route sets alternating subject-by-subject. We included 2 sets of routes in order to ensure our results could not be explained by the idiosyncrasies of any one route.
A new set of 8 routes was used in fMRI Experiment 2 (Figure 1B). The routes were constructed using the same parameters as the routes used in the behavioral and first fMRI experiments, with one key difference. Instead of all routes terminating at distinct locations, fMRI Experiment 2 contained pairs of routes that took distinct paths but ended at the same destination. As before, the 8 routes were divided into two sets of 4 and each set of 4 contained two pairs of overlapping routes. The routes in each set could be divided into pairs that (a) shared an overlapping path but terminated at distinct destinations (‘overlapping routes’; e.g. routes 1 and 2), (b) had non-overlapping paths and terminated at distinct destinations (‘non-overlapping routes’; e.g. routes 1 and 4) or (c) had non-overlapping paths but terminated at the same destinations (‘same destination’; e.g. routes 1 and 3). Due to geographical constraints, the third turn (i.e. when overlapping routes diverged) in this set of routes occurred slightly later (between picture numbers 84-86) than in the set used in the behavioral and first fMRI experiments.
Movies of the overlapping route pairs used in the experiments are available in Supplemental Movies 1-4.
Procedure
Behavioral Experiment
Route Learning
Subjects completed 14 rounds of route learning, with each route presented twice per round in random order. During a route learning trial, pictures from a route were presented in rapid succession (220 ms per picture, 10 ms blank screen in between pictures). Importantly, subjects were not told the destination of the route prior to the trial. Rather, the destination was only revealed at the end of the route, with the final picture (the destination) presented for 1690 ms. The destination's name was also displayed above the final picture. Each route learning trial lasted a total of 24s and was followed by a 1-s inter-trial interval (ITI) during which a fixation cross was presented. Each round also contained two ‘catch’ trials to ensure subjects' vigilance but were excluded from all analyses. For each catch trial, a route began as with a normal trial but the presentation stopped at a pre-selected picture number. A cue then appeared above the picture either instructing participants to identify (1) the routes' final destination (destination test) or (2) the direction of the next turn (direction test). During the 3s response period the picture and test cue remained on screen with the four destination labels (destination test) or left/right labels (direction test) printed below the picture and participants selected their response using a keyboard. Catch trials stopped on pictures presented between 3-15s after the trial onset and at intervals of 1.5 s (to coincide with the TR length in the fMRI experiments; see fMRI Acquisition). The combined duration of the two test trials within each round were constrained to equal the duration of a full route learning trial (24 seconds). Although each subject completed an equal number of destination and direction catch trials throughout the experiment, and each route was tested an equal number of times, the assignment of catch trial type to both route number and round was randomized so as not to be predictable. That is, within a given round there could be 2 destination catch trials, 2 direction catch trials, or 1 of each, and a given route could be tested twice via a destination catch trial, twice as a direction catch trial, or once as each test.
Inter-Round Picture Test
At the end of each of the 14 route learning rounds, subjects were shown 20 static pictures, one at a time, drawn from the routes (5 per route in random order) and for each picture subjects were asked to select the corresponding destination from a set of four label options. The inter-round picture test was self-paced and subjects responded via keyboard. To ensure that the five pictures tested from each route in each test round were evenly sampled across positions in the route, each route's 95 pictures (excluding the last 3 pictures that contained visuals of the destination) were divided into 5 time-bins of 19 pictures. For each inter-round picture test, one picture from each time-bin, from each route, was randomly selected to be tested with the constraint that a given picture was only tested once throughout the experiment. Responses on the test were divided into three groups: (1) ‘target’ if subjects selected the correct destination, (2) ‘competitor’ if subjects selected the overlapping route's destination, and (3) ‘other’ if subjects selected the destination from a non-overlapping route.
Map Test
In order to assess each subject's spatial knowledge of the routes, subjects also completed a map test after finishing all rounds of route learning. For each trial on the map test, subjects were cued with a picture of a route's destination for 4s. A map of the NYU campus then appeared on screen and subjects had 8s to click on the spatial location of the cued destination using a computer mouse. They were then prompted to draw with a pen the route taken to that destination on a paper print out of the campus map. Finally, participants completed both the Santa Barbara Sense of Direction Scale (SBSOD) and the Questionnaire on Spatial Representation (QSR) to assess their spatial acuity and reasoning. Results from the map test and questionnaires are not reported in the current study.
fMRI Experiments 1 and 2
Route Learning
The procedures from the behavioral experiment were slightly modified to be suitable for fMRI scanning. In both fMRI experiments, subjects first completed 2 practice route learning rounds (2 repetitions of each route per round) to familiarize them with the routes and task structure. Subjects then entered the scanner and completed an additional 14 rounds of route learning. Each of the 14 rounds of route learning was scanned as a separate run. The practice rounds were identical to the scanner rounds except that the first practice round did not contain any catch trials. During the scanned route learning rounds, the ITI was 6s (fixation cross) to allow for better separation of the hemodynamic response.
Inter-Round Picture Test
The inter-round picture test used in the fMRI experiments was shorter than in the behavioral experiment. In the fMRI version, there were a total of only 4 trials which contained pictures randomly sampled from the 4 routes. The sampled pictures were not constrained to be from different routes. The only constraint was that the pictures used in the inter-round picture test were not used in the post-scan memory test (described below). Additionally, in the fMRI version of the inter-round picture test subjects were shown each picture for a fixed amount of time (2.5s) and could only respond during that time, using an MRI-compatible button box. Because the inter-round picture tests in the fMRI experiments only sparsely assessed route learning, these data are not reported. These test trials were only included to motivate subjects to learn the routes.
Functional Localizer
Following the 14 rounds of route learning subjects completed one localizer scan that was used to functionally define regions of interest for the fMRI analyses. The localizer scan contained 36 alternating blocks of three image types (12 blocks per category): faces, scenes (hallways or houses), and objects (cars or guitars). Each block lasted a total of 6s and contained 12 greyscale images presented for 500ms each. Subjects pressed a button whenever they detected a scrambled image, which occurred on half of all blocks (counterbalanced across category). An additional 12 baseline ‘blocks’ showing a blank grey screen (also 6s each) were randomly interspersed with the other blocks.
Post Tests
After exiting the scanner subjects first completed a map test (identical to the behavioral experiment). Next, subjects completed an extended picture test which included ten pictures drawn from each route (every 10th picture from picture 4 to 94), tested in random order. On each trial, the route picture was presented above the set of destination names (4 destination names in Experiment 1 and 2 destination names in Experiment 2). Subjects used a computer mouse to click on the destination name associated with each picture. This test was self-paced. Finally, subjects completed the Santa Barbara Sense of Direction Scale (SBSOD) and the Questionnaire on Spatial Representation (QSR).
fMRI Data Analysis
MRI Acquisition
Scanning was performed on a 3T Siemens Allegra head-only scanner at the Center for Brain Imaging at New York University using a Siemens head coil. Structural images were collected using a T1-weighted protocol (256 × 256 matrix, 176 1-mm sagittal slices). Functional images were acquired using a T2* weighted EPI single shot sequence containing 26 contiguous axial slices oriented parallel to the long-axis of the hippocampus (repetition time = 1.5 s, echo time = 23 ms, flip angle = 77 degrees, voxel size = 2 × 2 × 2 mm). The functional images did not cover the entire brain; rather, a limited field of view centered on the hippocampus was chosen in order to improve spatial resolution of data from the hippocampus. For the route learning scans, the first 6 volumes (during which time a “Get Ready” screen was presented, followed by a fixation cross) were discarded to account for T1 stabilization. For the localizer scan, the first 8 volumes and last 8 volumes (during which time a fixation cross was presented) were discarded. Field map and calibration scans were collected to improve functional-to-anatomical coregistration.
fMRI Preprocessing
Images were preprocessed using SPM8 (Wellcome Department of Cognitive Neurology, London, United Kingdom), FSL (FMRIB's Software Library, Oxford, United Kingdom) and custom Matlab (The MathWorks, Natick, MA) routines. The preprocessing procedures included correction for head motion, coregistration of functional to anatomical images (using a registration procedure that aligned both functional and anatomical images to a calibration scan), and an unwarping procedure. Images from the functional localizer scan were spatially smoothed using a 4-mm full-width/half-maximum Gaussian kernel. Images from the route learning phase, which were used for pattern analyses, were smoothed using a moderate 2-mm full-width/half-maximum Gaussian kernel in order to improve signal-to-noise ratio. Prior research suggests that smoothing does not reduce sensitivity of pattern-based fMRI analyses [50]. All analyses were performed in subjects' native space.
fMRI univariate analysis
To analyze the localizer data, SPM was used to construct a general linear model with three regressors of interest corresponding to the three visual categories (scenes, faces, objects). These regressors were constructed as boxcar functions that onset at the first image of a category block and lasted for the duration of the block. Motion, block, and linear drift were modeled as regressors of no interest. All regressors were convolved with a canonical double-gamma hemodynamic response function. A linear contrast of scenes vs. faces and objects was used to obtain voxelwise estimates of scene sensitivity and a linear contrast of faces, scenes, and objects vs. baseline was used to obtain voxel-wise estimates of visual sensitivity.
Regions of interest
Analyses were performed using a region of interest (ROI) approach targeting the hippocampus, parahippocampal place area (PPA), retrosplenial cortex (RSC), medial temporal lobe cortex (MTL cortex), and lateral occipital cortex (LO). Anatomical hippocompal and MTL cortex ROIs were defined using freesurfer's automated cortical and sub-cortical segmentation procedure. MTL cortex ROIs were defined as the conjunction of freesurfer's entorhinal and parahippocampal regions. The resultant ROIs were then visually inspected and manually edited for any inaccuracies before registering them to each subject's functional space. Voxels in the MTL cortex mask that were overlapping with the final PPA mask (see below) were removed from the MTL cortex mask to ensure independent ROIs. In order to identify voxels with high signal-to-noise ratios and to create ROI masks the same size as the PPA, RSC, and LO masks (see below), the hippocampal and MTL cortex ROIs consisted of the top 300 visually-responsive voxels within bilateral hippocampus and MTL cortex, as determined from the category localizer (contrast of faces, scenes, and objects vs. baseline). Although this voxel selection procedure was implemented to increase our sensitivity to detect small differences in hippocampal patterns, it is important to note that our main findings were not dependent on such selection methods. Indeed when no voxel selection was applied within the hippocampus the interaction between overlap (overlap/non-overlap) and learning (1st half/2nd half) remained significant (F1,39 = 4.75, p = 0.0354), as did the reversal effect in the 2nd half of learning (F1,39 = 7.30, p = 0.0102).
PPA, RSC, and LO were identified using a combination of the category localizer and group-based probabilistic category-selective ROIs identified from previous studies [51]; http://web.mit.edu/bcs/nklab/GSS.shtml). First, the group-based probabilistic PPA, RSC, and LO masks were registered to each subject's native space and voxels overlapping with the anatomically defined hippocampal masks were removed from the PPA/RSC/LO masks to ensure independent ROIs. Then, the top 300 scene-selective voxels (contrast of scenes vs. faces and objects from the category localizer) within PPA and, separately, within RSC were selected. Likewise, the top 300 object-selective voxels (contrast of object vs. scene and faces from the category localizer) within LO were selected. This method ensured that these category selective cortical ROIs were subject-specific but equal in size (number of voxels) and general location across all subjects [52]. Note: we chose 300 voxels as an a priori threshold for all our ROIs. This number corresponded to roughly the top 20% of the hippocampal and MTL cortex voxels, 30% of the voxels within the group-based PPA mask, 15% of the voxels in the group-based RSC mask, and 6% of the group-based LO mask. One subject from Experiment 1 was excluded because the average t value within their PPA ROI was more than two standard deviations below the mean PPA response in Experiment 1 (this was the only subject with a mean PPA or RSC response that was more than 2 standard deviations below the experiment mean); subjective assessment of the data from this subject confirmed that there was no well-defined cluster within the group-based PPA mask that selectively responded to scenes.
Spatiotemporal pattern similarity
Pattern similarity analyses were performed on ‘raw’ (unmodeled) fMRI data. Several additional preprocessing steps were performed prior to performing pattern analyses. Functional images were detrended, high-pass filtered (0.01 Hz), and then z-scored within run. For route learning trials, volumes 3-19 (corresponding to 3-27s after stimulus onset) were divided into volumes corresponding to Segment 1 (i.e. the portion of each route that shared a path with another route) and Segment 2 (i.e. the unique portion of each route after overlapping paths diverged). The volume in each route corresponding to the transition between Segments 1 and 2 (i.e., the third turn in the routes) was discarded from analyses in order to keep Segments 1 and 2 distinct. In Experiment 1, Segment 1 occurred within the first 11 volumes and Segment 2 occurred within the last 4 volumes. In Experiment 2 the overlapping routes diverged slightly later; thus, Segment 1 corresponded to the first 12 volumes Segment 2 corresponded to the last 3 volumes. To perform pattern analyses, spatial activity patterns were concatenated across volumes of interest so that each route Segment was represented by a spatiotemporal pattern of activity whose vector length was equal to the number of voxels within an ROI × the number of TRs included in the Segment.
For each subject and each ROI, we computed pattern similarity scores (Pearson correlations) reflecting the representational similarity across each pair of routes. Correlations were always performed using data from distinct fMRI runs (odd and even runs) in order to ensure independence. Thus, for analysis of data from the first half of learning, each route's average spatiotemporal activity pattern was obtained from runs 1, 3, and 5 (odd runs) and, separately, from runs 2, 4, and 6 (even runs); average ‘odd run patterns’ were then correlated with average ‘even run patterns.’ Likewise, for analysis of data from the second half of learning, each route's average spatiotemporal activity pattern was obtained from runs 9, 11, and 13 (odd runs) and, separately, from runs 10, 12, and 14 (even runs), and odd and even patterns were correlated. Data from runs 7 and 8 were excluded in order to ensure an equal number of odd and even runs within each half. Because each subject studied 4 routes, a 4 × 4 correlation matrix was generated for each subject (Figure 3A). Unless noted, all analyses below combine data across experiments and all comparisons of non-overlapping routes are restricted to those that terminated at distinct destinations. Before any correlation values were averaged within conditions (e.g., overlapping routes), correlation coefficients were z-transformed (Fisher's z).
Time point by time point analysis of memory-based discrimination accuracy
To compare TR-by-TR fluctuations in hippocampal pattern similarity with behavioral measures of route discrimination, we used behavioral accuracy data from the Inter-Round Picture Test in the behavioral Experiment (see above). This test required that subjects match a randomly sampled picture with its corresponding destination. It therefore required memory-based discrimination between overlapping routes. We first computed mean accuracy (across routes, learning rounds, and subjects) as a function of pictures' serial position. This produced a set of mean accuracy values for every serial position from 1 (the first picture in each route stimulus) to 95 (the last picture in each route tested). To align these behavioral data with the fMRI data—which was sampled at a coarser rate (16 total time points)—the behavioral accuracy values were grouped into bins according to the TR during which they were presented in the fMRI sessions (after adjusting for the hemodynamic response lag; see above). Pictures presented between 0–1.5s relative to trial onset were grouped into the TR 1 bin, pictures presented between 1.5–3s relative to trial onset were grouped into the TR 2 bin, etc. Mean behavioral accuracy was then computed within each of these bins, yielding a vector that could be correlated with the TR-by-TR fMRI data. Note that since TR 16 included just an extended visual of the destination and this final picture was not tested in the behavioral experiment, there is no behavioral accuracy for this TR.
Timecourse similarity
Timecourse similarity indexed the degree to which individual voxels were ‘shared’ across a given pair of routes. To compute timecourse similarity, we first obtained route-specific vectors of activation (using Segment 1 data only) for each voxel. The length of each timecourse vector was equal to the number of Segment 1 TRs (11 in Experiment 1; 12 in Experiment 2). Timecourse vectors were separately averaged across odd and even runs within each half (as with the spatiotemporal pattern analyses). Average timecourse vectors were then correlated (Pearson correlation) for every pair of routes, separately for each learning half (Figure 6B and 6C). Resulting correlation coefficients were z-transformed (Fisher's z).
Quantification and Statistical Analysis
For all behavioral and fMRI analyses we used standard random-effects statistics (paired sample t-tests and repeated measures ANOVA). Two-tailed tests were used throughout at an alpha threshold of 0.05. These statistical tests were implemented in R (https://www.r-project.org). Unless otherwise noted, analyses combined data across Experiments 1 and 2. For all ANOVAs run on these combined data, experiment number was included as a between-subjects factor. For all of the hippocampal ANOVA effects described in the main text, interactions with experiment number were not significant (Ps > 0.2). See Figure S2 for hippocampal and PPA data separated by experiment. Mixed-effects regression models were used to assess the shape of the function relating timecourse similarity measures across experimental halves and were implemented in the lme4 package for R (http://lme4.r-forge.r-project.org). All models were constructed with random intercepts for each subject.
Data and Software Availability
Raw data from the experiment is available on OpenFMRI (https://openfmri.org/dataset/ds000217) and code to run the analyses are available upon request from the first author (avi.chanales@nyu.edu).
Supplementary Material
Movie S1. Experiment 1 Route Set 1 Movies (Routes 1-4).
Movie of the route stimuli presented to subjects in the Behavioral and fMRI Experiment 1 Route Set 1. Note the overlapping routes are displayed side by side for comparison purposes only. They were never actually presented side by side in the experiment.
Movie of the route stimuli presented to subjects in the Behavioral and fMRI Experiment 1 Route Set 2. Note the overlapping routes are displayed side by side for comparison purposes only. They were never actually presented side by side in the experiment.
Movie of the route stimuli presented to subjects in fMRI Experiment 2 Route Set 1. Note the overlapping routes are displayed side by side for comparison purposes only. They were never actually presented side by side in the experiment.
Movie of the route stimuli presented to subjects in fMRI Experiment 2 Route Set 2. Note the overlapping routes are displayed side by side for comparison purposes only. They were never actually presented side by side in the experiment.
Highlights.
Human hippocampal representations of overlapping spatial routes diverge with learning
Representations of overlapping routes become less similar than non-overlapping routes
Representational structure in hippocampus sharply contrasts with other brain regions
Hippocampal voxels exhibit divergence in relation to initial representational overlap
Acknowledgments
We thank Anthony Stigliani and Kalanit Grill-Spector for providing stimuli for the category localizer. This work was supported by a grant from the National Institutes of Health (1RO1NS089729) to B.A.K.
Footnotes
Author Contributions: A.J.H.C, S.E.F. and B.A.K designed the experiment. A.J.H.C. and A.O. ran the experiment. A.J.H.C. analyzed the data. A.J.H.C., S.E.F., and B.A.K. wrote the paper.
Publisher's Disclaimer: This is a PDF file of an unedited manuscript that has been accepted for publication. As a service to our customers we are providing this early version of the manuscript. The manuscript will undergo copyediting, typesetting, and review of the resulting proof before it is published in its final citable form. Please note that during the production process errors may be discovered which could affect the content, and all legal disclaimers that apply to the journal pertain.
References
- 1.Wood ER, Dudchenko PA, Robitsek RJ, Eichenbaum H. Hippocampal Neurons Encode Information about Different Types of Memory Episodes Occurring in the Same Location. Neuron. 2000;27:623–633. doi: 10.1016/s0896-6273(00)00071-4. [DOI] [PubMed] [Google Scholar]
- 2.Frank LM, Brown EN, Wilson M. Trajectory Encoding in the Hippocampus and Entorhinal Cortex. Neuron. 2000;27:169–178. doi: 10.1016/s0896-6273(00)00018-0. [DOI] [PubMed] [Google Scholar]
- 3.Bostock E, Muller RU, Kubie JL. Experience-dependent modifications of hippocampal place cell firing. Hippocampus. 1991;1:193–205. doi: 10.1002/hipo.450010207. [DOI] [PubMed] [Google Scholar]
- 4.Colgin LL, Moser EI, Moser MB. Understanding memory through hippocampal remapping. Trends Neurosci. 2008;31:469–477. doi: 10.1016/j.tins.2008.06.008. [DOI] [PubMed] [Google Scholar]
- 5.Hsieh LT, Gruber MJ, Jenkins LJ, Ranganath C. Hippocampal activity patterns carry information about objects in temporal context. Neuron. 2014;81:1165–1178. doi: 10.1016/j.neuron.2014.01.015. [DOI] [PMC free article] [PubMed] [Google Scholar]
- 6.Favila SE, Chanales AJH, Kuhl BA. Experience-dependent hippocampal pattern differentiation prevents interference during subsequent learning. Nat Commun. 2016;7:11066. doi: 10.1038/ncomms11066. [DOI] [PMC free article] [PubMed] [Google Scholar]
- 7.Chadwick MJ, Hassabis D, Maguire EA. Decoding overlapping memories in the medial temporal lobes using high-resolution fMRI. Learn Mem. 2011;18:742–746. doi: 10.1101/lm.023671.111. [DOI] [PMC free article] [PubMed] [Google Scholar]
- 8.Ginther MR, Walsh DF, Ramus SJ. Hippocampal Neurons Encode Different Episodes in an Overlapping Sequence of Odors Task. J Neurosci. 2011;31:2706–2711. doi: 10.1523/JNEUROSCI.3413-10.2011. [DOI] [PMC free article] [PubMed] [Google Scholar]
- 9.Agster KL, Fortin NJ, Eichenbaum H. The Hippocampus and Disambiguation of Overlapping Sequences. J Neurosci. 2002;22:5760–5768. doi: 10.1523/JNEUROSCI.22-13-05760.2002. [DOI] [PMC free article] [PubMed] [Google Scholar]
- 10.McKenzie S, Frank AJ, Kinsky NR, Porter B, Rivière PD, Eichenbaum H. Hippocampal Representation of Related and Opposing Memories Develop within Distinct, Hierarchically Organized Neural Schemas. Neuron. 2014;83:202–215. doi: 10.1016/j.neuron.2014.05.019. [DOI] [PMC free article] [PubMed] [Google Scholar]
- 11.Brown TI, Ross RS, Keller JB, Hasselmo ME, Stern CE. Which Way Was I Going? Contextual Retrieval Supports the Disambiguation of Well Learned Overlapping Navigational Routes. J Neurosci. 2010;30:7414–7422. doi: 10.1523/JNEUROSCI.6021-09.2010. [DOI] [PMC free article] [PubMed] [Google Scholar]
- 12.Kumaran D, Maguire EA. The Dynamics of Hippocampal Activation during Encoding of Overlapping Sequences. Neuron. 2006;49:617–629. doi: 10.1016/j.neuron.2005.12.024. [DOI] [PubMed] [Google Scholar]
- 13.Schlichting ML, Mumford JA, Preston AR. Learning-related representational changes reveal dissociable integration and separation signatures in the hippocampus and prefrontal cortex. Nat Commun. 2015;6:1–10. doi: 10.1038/ncomms9151. [DOI] [PMC free article] [PubMed] [Google Scholar]
- 14.Grieves RM, Wood ER, Dudchenko PA, Eichenbaum H. Place cells on a maze encode routes rather than destinations. eLife Sciences. 2016;5:e15986. doi: 10.7554/eLife.15986. [DOI] [PMC free article] [PubMed] [Google Scholar]
- 15.Kyle CT, Stokes JD, Lieberman JS, Hassan AS, Ekstrom AD, Eichenbaum H. Successful retrieval of competing spatial environments in humans involves hippocampal pattern separation mechanisms. eLife Sciences. 2015;4:e10499. doi: 10.7554/eLife.10499. [DOI] [PMC free article] [PubMed] [Google Scholar]
- 16.LaRocque KF, Smith ME, Carr VA, Witthoft N, Grill-Spector K, Wagner AD. Global Similarity and Pattern Separation in the Human Medial Temporal Lobe Predict Subsequent Memory. J Neurosci. 2013;33:5466–5474. doi: 10.1523/JNEUROSCI.4293-12.2013. [DOI] [PMC free article] [PubMed] [Google Scholar]
- 17.O'Reilly RC, McClelland JL. Hippocampal conjunctive encoding, storage, and recall: avoiding a trade-off. Hippocampus. 1994;4:661–682. doi: 10.1002/hipo.450040605. [DOI] [PubMed] [Google Scholar]
- 18.Leutgeb JK, Leutgeb S, Moser MB, Moser EI. Pattern Separation in the Dentate Gyrus and CA3 of the Hippocampus. Science. 2007;315:961–966. doi: 10.1126/science.1135801. [DOI] [PubMed] [Google Scholar]
- 19.Bakker A, Kirwan CB, Miller M, Stark CEL. Pattern Separation in the Human Hippocampal CA3 and Dentate Gyrus. Science. 2008;319:1640–1642. doi: 10.1126/science.1152882. [DOI] [PMC free article] [PubMed] [Google Scholar]
- 20.Yassa MA, Stark CEL. Pattern separation in the hippocampus. Trends Neurosci. 2011;34:515–525. doi: 10.1016/j.tins.2011.06.006. [DOI] [PMC free article] [PubMed] [Google Scholar]
- 21.McNaughton BL, Morris RG. Hippocampal synaptic enhancement and information storage within a distributed memory system. Trends Neurosci. 1987;10:408–415. [Google Scholar]
- 22.GoodSmith D, Chen X, Wang C, Kim SH, Song H, Burgalossi A, Christian KM, Knierim JJ. Spatial Representations of Granule Cells and Mossy Cells of the Dentate Gyrus. Neuron. 2017;93:677–690.e5. doi: 10.1016/j.neuron.2016.12.026. [DOI] [PMC free article] [PubMed] [Google Scholar]
- 23.Lever C, Wills T, Cacucci F, Burgess N, O'Keefe J. Long-term plasticity in hippocampal place-cell representation of environmental geometry. Nature. 2002;416:90–94. doi: 10.1038/416090a. [DOI] [PubMed] [Google Scholar]
- 24.Mehta MR, Quirk MC, Wilson MA. Experience-Dependent Asymmetric Shape of Hippocampal Receptive Fields. Neuron. 2000;25:707–715. doi: 10.1016/s0896-6273(00)81072-7. [DOI] [PubMed] [Google Scholar]
- 25.Schapiro AC, Kustner LV, Turk-Browne NB. Shaping of Object Representations in the Human Medial Temporal Lobe Based on Temporal Regularities. Curr Biol. 2012;22:1622–1627. doi: 10.1016/j.cub.2012.06.056. [DOI] [PMC free article] [PubMed] [Google Scholar]
- 26.Kim G, Norman KA, Turk-Browne NB. Neural Differentiation of Incorrectly Predicted Memories. J Neurosci. 2017;37:2022–2031. doi: 10.1523/JNEUROSCI.3272-16.2017. [DOI] [PMC free article] [PubMed] [Google Scholar]
- 27.Norman KA, Newman E, Detre G, Polyn S. How Inhibitory Oscillations Can Train Neural Networks and Punish Competitors. Neural Comput. 2006;18:1577–1610. doi: 10.1162/neco.2006.18.7.1577. [DOI] [PubMed] [Google Scholar]
- 28.Norman KA, Newman EL, Detre G. A neural network model of retrieval-induced forgetting. Psychol Rev. 2007;114:887–953. doi: 10.1037/0033-295X.114.4.887. [DOI] [PubMed] [Google Scholar]
- 29.Hulbert JC, Norman KA. Neural differentiation tracks improved recall of competing memories following interleaved study and retrieval practice. Cereb Cortex. 2015;25:3994–4008. doi: 10.1093/cercor/bhu284. [DOI] [PMC free article] [PubMed] [Google Scholar]
- 30.Epstein R, Harris A, Stanley D, Kanwisher N. The Parahippocampal Place Area. Neuron. 1999;23:115–125. doi: 10.1016/s0896-6273(00)80758-8. [DOI] [PubMed] [Google Scholar]
- 31.Epstein RA. Parahippocampal and retrosplenial contributions to human spatial navigation. Trends Cogn Sci. 2008;12:388–396. doi: 10.1016/j.tics.2008.07.004. [DOI] [PMC free article] [PubMed] [Google Scholar]
- 32.Lee I, Griffin AL, Zilli EA, Eichenbaum H, Hasselmo ME. Gradual Translocation of Spatial Correlates of Neuronal Firing in the Hippocampus toward Prospective Reward Locations. Neuron. 2006;51:639–650. doi: 10.1016/j.neuron.2006.06.033. [DOI] [PubMed] [Google Scholar]
- 33.Brown TI, Hasselmo ME, Stern CE. A High resolution study of hippocampal and medial temporal lobe correlates of spatial context and prospective overlapping route memory. Hippocampus. 2014;24:819–839. doi: 10.1002/hipo.22273. [DOI] [PMC free article] [PubMed] [Google Scholar]
- 34.Brown TI, Carr VA, LaRocque KF, Favila SE, Gordon AM, Bowles B, Bailenson JN, Wagner AD. Prospective representation of navigational goals in the human hippocampus. Science. 2016;352:1323–1326. doi: 10.1126/science.aaf0784. [DOI] [PubMed] [Google Scholar]
- 35.Davachi L, DuBrow S. How the hippocampus preserves order: the role of prediction and context. Trends Cogn Sci. 2015;19:92–99. doi: 10.1016/j.tics.2014.12.004. [DOI] [PMC free article] [PubMed] [Google Scholar]
- 36.Ólafsdóttir HF, Barry C, Saleem AB, Hassabis D, Spiers HJ, Eichenbaum H. Hippocampal place cells construct reward related sequences through unexplored space. eLife Sciences. 2015;4:e06063. doi: 10.7554/eLife.06063. [DOI] [PMC free article] [PubMed] [Google Scholar]
- 37.Milivojevic B, Vicente-Grabovetsky A, Doeller CF. Insight Reconfigures Hippocampal-Prefrontal Memories. Curr Biol. 2015;25:821–830. doi: 10.1016/j.cub.2015.01.033. [DOI] [PubMed] [Google Scholar]
- 38.Aly M, Turk-Browne NB. Attention promotes episodic encoding by stabilizing hippocampal representations. Proc Natl Acad Sci USA. 2016;113:E420–E429. doi: 10.1073/pnas.1518931113. [DOI] [PMC free article] [PubMed] [Google Scholar]
- 39.Chadwick MJ, Bonnici HM, Maguire EA. CA3 size predicts the precision of memory recall. Proc Natl Acad Sci USA. 2014;111:10720–10725. doi: 10.1073/pnas.1319641111. [DOI] [PMC free article] [PubMed] [Google Scholar]
- 40.Poppenk J, Norman KA. Briefly Cuing Memories Leads to Suppression of Their Neural Representations. J Neurosci. 2014;34:8010–8020. doi: 10.1523/JNEUROSCI.4584-13.2014. [DOI] [PMC free article] [PubMed] [Google Scholar]
- 41.Tanaka KZ, Pevzner A, Hamidi AB, Nakazawa Y, Graham J, Wiltgen BJ. Cortical Representations Are Reinstated by the Hippocampus during Memory Retrieval. Neuron. 2014;84:347–354. doi: 10.1016/j.neuron.2014.09.037. [DOI] [PubMed] [Google Scholar]
- 42.Cai DJ, Aharoni D, Shuman T, Shobe J, Biane J, Song W, Wei B, Veshkini M, La-Vu M, Lou J, et al. A shared neural ensemble links distinct contextual memories encoded close in time. Nature. 2016;534:115–118. doi: 10.1038/nature17955. [DOI] [PMC free article] [PubMed] [Google Scholar]
- 43.Kuhl BA, Rissman J, Chun MM, Wagner AD. Fidelity of neural reactivation reveals competition between memories. Proc Natl Acad Sci USA. 2011;108:5903–5908. doi: 10.1073/pnas.1016939108. [DOI] [PMC free article] [PubMed] [Google Scholar]
- 44.Newman EL, Norman KA. Moderate Excitation Leads to Weakening of Perceptual Representations. Cereb Cortex. 2010;20:2760–2770. doi: 10.1093/cercor/bhq021. [DOI] [PMC free article] [PubMed] [Google Scholar]
- 45.Detre GJ, Natarajan A, Gershman SJ, Norman KA. Moderate levels of activation lead to forgetting in the think/no-think paradigm. Neuropsychologia. 2013;51:2371–2388. doi: 10.1016/j.neuropsychologia.2013.02.017. [DOI] [PMC free article] [PubMed] [Google Scholar]
- 46.Lewis-Peacock JA, Norman KA. Competition between items in working memory leads to forgetting. Nat Commun. 2014;5:5768. doi: 10.1038/ncomms6768. [DOI] [PMC free article] [PubMed] [Google Scholar]
- 47.Leutgeb JK, Leutgeb S, Treves A, Meyer R, Barnes CA, McNaughton BL, Moser MB, Moser EI. Progressive Transformation of Hippocampal Neuronal Representations in “Morphed” Environments. Neuron. 2005;48:345–358. doi: 10.1016/j.neuron.2005.09.007. [DOI] [PubMed] [Google Scholar]
- 48.Rennó-Costa C, Lisman JE, Verschure PFMJ. The Mechanism of Rate Remapping in the Dentate Gyrus. Neuron. 2010;68:1051–1058. doi: 10.1016/j.neuron.2010.11.024. [DOI] [PMC free article] [PubMed] [Google Scholar]
- 49.Kentros C, Hargreaves E, Hawkins RD, Kandel ER, Shapiro M, Muller RV. Abolition of Long-Term Stability of New Hippocampal Place Cell Maps by NMDA Receptor Blockade. Science. 1998;280:2121–2126. doi: 10.1126/science.280.5372.2121. [DOI] [PubMed] [Google Scholar]
- 50.de Beeck HPO. Against hyperacuity in brain reading: Spatial smoothing does not hurt multivariate fMRI analyses? NeuroImage. 2010;49:1943–1948. doi: 10.1016/j.neuroimage.2009.02.047. [DOI] [PubMed] [Google Scholar]
- 51.Julian JB, Fedorenko E, Webster J, Kanwisher N. An algorithmic method for functionally defining regions of interest in the ventral visual pathway. NeuroImage. 2012;60:2357–2364. doi: 10.1016/j.neuroimage.2012.02.055. [DOI] [PubMed] [Google Scholar]
- 52.Marchette SA, Vass LK, Ryan J, Epstein RA. Outside Looking In: Landmark Generalization in the Human Navigational System. J Neurosci. 2015;35:14896–14908. doi: 10.1523/JNEUROSCI.2270-15.2015. [DOI] [PMC free article] [PubMed] [Google Scholar]
- 53.R Core Team. R: A Language and Environment for Statistical Computing. Vienna, Austria: R Foundation for Statistical Computing; 2015. [Google Scholar]
- 54.Bates D, Mächler M, Bolker B, Walker S. Fitting linear mixed-effects models using lme4. J Stat Softw. 2015;67 [Google Scholar]
Associated Data
This section collects any data citations, data availability statements, or supplementary materials included in this article.
Supplementary Materials
Movie S1. Experiment 1 Route Set 1 Movies (Routes 1-4).
Movie of the route stimuli presented to subjects in the Behavioral and fMRI Experiment 1 Route Set 1. Note the overlapping routes are displayed side by side for comparison purposes only. They were never actually presented side by side in the experiment.
Movie of the route stimuli presented to subjects in the Behavioral and fMRI Experiment 1 Route Set 2. Note the overlapping routes are displayed side by side for comparison purposes only. They were never actually presented side by side in the experiment.
Movie of the route stimuli presented to subjects in fMRI Experiment 2 Route Set 1. Note the overlapping routes are displayed side by side for comparison purposes only. They were never actually presented side by side in the experiment.
Movie of the route stimuli presented to subjects in fMRI Experiment 2 Route Set 2. Note the overlapping routes are displayed side by side for comparison purposes only. They were never actually presented side by side in the experiment.