

Abstract
Half of all prostate cancers are caused by the TMPRSS2–ERG genefusion, which enables androgens to drive expression of the normally silent E26 transformation-specific (ETS) transcription factor ERG in prostate cells1,2. Recent genomic landscape studies of such cancers3–8 have reported recurrent point mutations and focal deletions of another ETS member, the ETS2 repressor factor ERF9. Here we show these ERF mutations cause decreased protein stability and mostly occur in tumours without ERG upregulation. ERF loss recapitulates the morphological and phenotypic features of ERG gain in normal mouse prostate cells, including expansion of the androgen receptor transcriptional repertoire, and ERF has tumour suppressor activity in the same genetic background of Pten loss that yields oncogenic activity by ERG. In the more common scenario of ERG upregulation, chromatin immunoprecipitation followed by sequencing indicates that ERG inhibits the ability of ERF to bind DNA at consensus ETS sites both in normal and in cancerous prostate cells. Consistent with a competition model, ERF overexpression blocks ERG-dependent tumour growth, and ERF loss rescues TMPRSS2–ERG-positive prostate cancer cells from ERG dependency. Collectively, these data provide evidence that the oncogenicity of ERG is mediated, in part, by competition with ERF and they raise the larger question of whether other gain-of-function oncogenic transcription factors might also inactivate endogenous tumour suppressors.
Recent exome sequencing revealed that 3% of patients in the SU2C-294 metastatic prostate cancer cohort3 (Extended Data Fig. 1a) have somatic point mutations, but not gene fusions, involving the ETS member ERF. ERF was one of a small number of genes whose mutation frequency and predicted functional impact reached significance by the MutSig algorithm10. Loss-of-function ERF germline mutations and lower ERF expression have been previously implicated in the disease complex craniosynostosis11. Notably, the DNA-binding ETS domain of ERF is most similar to the ERG subfamily12. However, unlike oncogenic ETS factors12, ERF possesses a transferable carboxy-terminal domain that mediates transcriptional repression9.
We queried additional prostate cancer genome cohorts (n = 930 patients)4–8 (Extended Data Fig. 1a) and found further evidence of ERF mutations (Fig. 1a) in 1–3% of patients. The mutations include the specific K401fs and G299fs loss-of-function truncations also found in craniosynostosis families11, as well as similar missense mutations in the ETS domain. Mapping of these ETS missense mutations onto the known crystal structure of ERG13 revealed that the altered residues are located within conserved helices (Extended Data Fig. 1b), with four of the five conserved mutations predicted to be destabilizing14. Expression of complementary DNAs (cDNAs) containing the ETS missense or truncating mutations in LNCaP prostate cancer cells led to reduced ERF steady-state levels relative to wild-type ERF despite robust messenger RNA (mRNA) expression (Extended Data Fig. 1c, d), in agreement with the craniosynostosis studies11. In addition, only full-length ERF was detected following immunoprecipitation in prostate cancer cells possessing an endogenous heterozygous K401fs allele5 (Extended Data Fig. 1e). Consistent with destabilization, we were unable to isolate mutant ERF ETS domains through recombinant expression in bacteria, whereas appreciable amounts of wild-type ERF ETS were obtained (Extended Data Fig. 1f).
Figure 1. Recurrent ERF loss-of-function mutations and focal deletions are found in prostate cancer and are mostly exclusive to tumours without TMPRSS2–ERG.
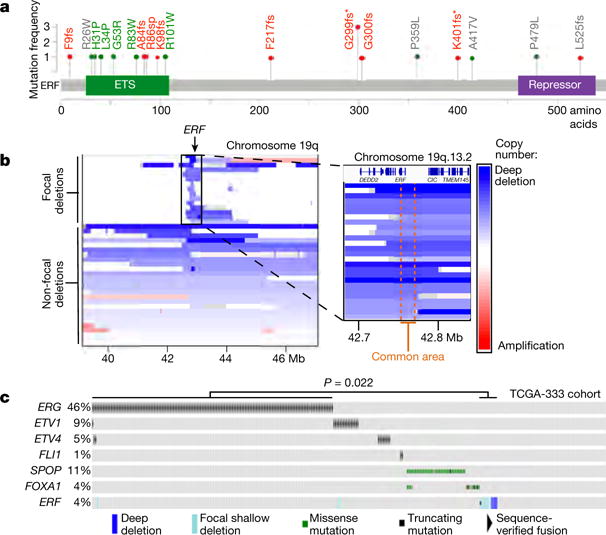
a, ERF point mutations identified in all prostate cancer cohorts3–8. * Mutations shared with patients having craniosynostosis. Green: ETS missense mutations of residues conserved with ERG. Red: frameshift (fs)/splice-site (sp) mutations upstream of repressor domain. b, ERF copy number deletions in TCGA-333 human primary prostate cancer cohort4. c, cBio Oncoprint of patients with primary prostate cancer (n = 333 patients)4. Each column corresponds to a unique patient’s tumour profile. P value calculated by Fisher’s exact two-tailed test.
In addition to destabilizing mutations, we observed remarkably narrow deletions of the ERF locus within the TCGA-333 primary tumour cohort4 (Fig. 1b). Median ERF expression in those tumours containing focal hemizygous deletions is lower than in normal prostate and diploid ERF tumours (Extended Data Fig. 2a P = 0.019). Intriguingly, tumours with either ERF mutations or focal deletions are mostly exclusive to TMPRSS2–ERG-negative tumours (Fig. 1c P = 0.022). Metastatic tumours in the SU2C-294 cohort3 containing ERF point mutations are also mostly exclusive to those without upregulated ERG, but this distinction does not reach statistical significance (Extended Data Fig. 2b P = 0.066).
The near complete lack of ERF mutations in tumours with TMPRSS2–ERG fusions led us to investigate whether ERF loss recapitulates the phenotype of ERG gain. ERG is not expressed in benign prostate epithelium and displays potent oncogenicity in a mouse Pten−/− background2,15. On the other hand, ERF is endogenously expressed in normal prostate (Extended Data Fig. 2a). To determine whether its loss yields a phenotype similar to ERG gain, we infected prostate organoids16 derived from Pten+/+ and Pten−/− mice15 with short hairpin RNA (shRNA) targeting mouse Erf (shErf_m) (Extended Data Fig. 3a). The Pten+/+ shErf_m organoids acquired morphological characteristics of ERG overexpression17: they formed single-cell luminal structures lacking basal cells (Fig. 2a), and profiling by RNA sequencing (RNA-seq) demonstrated profound loss of expression of most basal signature genes18 (Fig. 2b and Extended Data Fig. 2b–d). Consistent with these changes17,18, RNA-seq profiling revealed significant enrichment for genes whose expression is upregulated by androgen in human prostate cancer cells (Extended Data Fig. 2c, e). The Pten−/− organoids16 infected with shErf_m also demonstrated a marked luminal shift (Fig. 2a) and were able to form tumours when grafted back into mice, recapitulating the phenotype of ERG overexpression15 (Fig. 2c).
Figure 2. ERF is a tumour suppressor, a negative regulator of androgen signalling, and its loss phenocopies TMPRSS2-ERG gain.
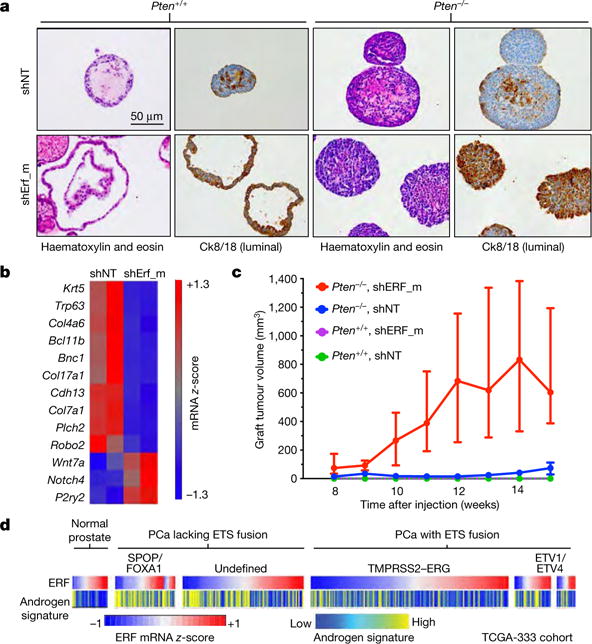
a, Immunohistochemistry of mouse prostate organoids infected with non-targeting shRNA (shNT) or targeting ERF (shErf_m). b, Basal signature18 applied to Pten+/+ organoid RNA-seq (n = 2 biological replicates). c, Tumour volumes of organoid grafts. Data are median ± interquartile range; n = 10 tumours per condition. d, Human TCGA primary prostate cancer (PCa) cohort4 (n = 333 patients) interrogated for ERF mRNA level and the Hieronymus androgen transcriptional activity signature4,19,20.
To assess the impact of ERF loss in the half of human prostate cancers that lack ERG expression similarly to normal prostate, we infected a human cancer-derived cell line lacking the TMPRSS2–ERG gene fusion, CWR22Pc, with shRNA targeting ERF (Extended Data Fig. 4a) and analysed its androgen transcriptome. We observed both an increase in the number of differentially expressed androgen receptor target genes and in the magnitude of the expression changes (Extended Data Fig. 4b), despite no alteration of androgen receptor mRNA or protein levels (Extended Data Fig. 4a, c). Next, we interrogated the mRNA expression profiles of the primary and metastatic human prostate cohorts TCGA-333 and SU2C-150 (refs 3, 4), respectively. In agreement with our functional studies, ERF mRNA levels are inversely correlated with two androgen transcriptional activity signatures19,20, both in normal human prostate and in all primary tumour subtypes (Fig. 2d and Extended Data Fig. 5a). This reciprocal association is also observed in metastatic cancers if the analysis is limited to tumours without amplification of or mutations in the AR gene, which encodes the androgen receptor (Extended Data Fig. 5b). The fact that reduced ERF expression enhances androgen receptor transcriptional output even in the absence of mutation or deletion, raises the possibility that ERF may have a broader role in prostate oncogenesis.
The inverse correlation between ERF mRNA level and the androgen receptor signature is also observed in the half of prostate cancers that possess the TMPRSS2–ERG fusion (Fig. 2d), suggesting that ERF may have an androgen receptor repressive function in this subtype as well. To investigate this possibility, the expression of ERG or ERF was separately inhibited via shRNA (Extended Data Fig. 6a, b) in the ERG-fusion-positive VCaP cell line and the androgen transcriptome analysed as before. Consistent with earlier work15, inhibition of ERG expression (‘ERG-low’) resulted in a contracted androgen transcriptome compared with the wild-type state (‘ERG-high’). Conversely, ERF inhibition increased the change in expression of androgen receptor target genes and doubled the size of the androgen transcriptome (Fig. 3a and Extended Data Fig. 7). ERF and ERG knockdown had no effect on each other’s expression, on androgen receptor protein levels, or on androgen receptor subcellular localization (Extended Data Fig. 6c, d).
Figure 3. ERF and TMPRSS2–ERG have opposing effects on the androgen receptor transcriptome and cistrome.
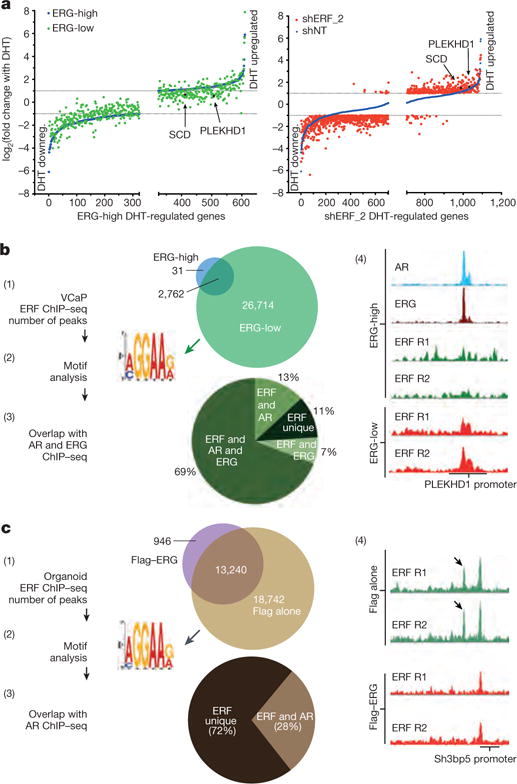
a, Androgen-regulated genes (as in Extended Data Fig. 4b) analysed by magnitude of change in VCaP cells infected with a doxycycline-inducible shRNA targeting ERG (with doxycycline, ERG-low; without doxycycline, ERG-high) or a constitutive shRNA targeting ERF (shERF_2); n = 3 biological replicates. DHT downreg., DHT downregulated. b, ERF ChIP–seq in VCaP cells (n = 2 biological replicates: R1, R2) analysed by (1) peak overlap, (2) motif analysis, (3) overlap with ERG and androgen receptor ChIP–seq, and (4) example ChIP–seq signals. c, ERF ChIP–seq in normal prostate organoids infected with either a Flag–ERG lentivirus or Flag alone, both treated with doxycycline (n = 2 biological replicates: R1, R2) and analysed as in b.
Given the similarity of their ETS domains12 (Extended Data Fig. 1b), we postulated that the opposing effects of ERF and ERG on androgen signalling could be explained by competition for androgen-receptor-associated ETS binding sites, which we investigated by ERF chromatin immunoprecipitation followed by sequencing (ChIP–seq) in the ERG-high and ERG-low states (Fig. 3b and Extended Data Fig. 8). De novo motif analysis identified the canonical ETS motif as the primary ERF binding site, with 2,793 binding sites in the ERG-high condition ((1) and (2) in Fig. 3b). Remarkably, an additional 26,714 ERF binding sites were observed in the ERG-low state, 76% of which were bound by ERG before ERG knockdown ((1) and (3) in Fig. 3b, and Extended Data Fig. 8d). Furthermore, the ChIP–seq signal intensity of the smaller number of ERF peaks observed in the ERG-high state was increased in the ERG-low state in almost all cases (Extended Data Fig. 8c, e). Finally, ERF peaks in the ERG-low state largely overlap with androgen receptor binding peaks ((3) in Fig. 3b), as previously reported for ERG15, and are exemplified by PLEKHD1 and SCD20 ((4) in Fig. 3b, and Extended Data Fig. 8f). In the ERG-high state, both genes have prominent androgen-receptor- and ERG-associated binding but only limited ERF binding. However, in the ERG-low state, ERF binding is substantially increased in parallel with a decrease in their androgen-induced expression (Fig. 3a).
Given the role that ERF also plays in benign prostate cells, we performed ChIP–seq to confirm that ERF binds ETS sites in the normal prostate organoids (Fig. 3c). Moreover, transient overexpression of ERG led to a significant decrease of ERF chromatin occupancy (Fig. 3c and Extended Data Fig. 9), consistent with the competition for binding also seen in VCaP cancer cells. We explored the overlap between androgen receptor and ERF sites in normal prostate organoids by androgen receptor ChIP–seq and found 28% of the ERF sites overlap with androgen receptor binding sites ((3) in Fig. 3c). This was lower than observed in the ERG-positive VCaP tumour cells, consistent with differences in androgen receptor chromatin occupancy between normal prostate and cancer21.
We next asked whether ERF could modulate oncogenicity mediated by ERG expression. First, we used CRISPR–Cas9 (clustered regularly interspaced short palindromic repeats and CRISPR-associated protein 9) to partially delete ERF (sgErf) in pooled mouse Pten−/−;R26ERG/ERG organoids (Extended Data Fig. 10a), which require ERG to form tumours15. The sgErf organoids formed tumours more rapidly than those infected with a non-targeting CRISPR (Fig. 4a). Likewise, induction of human ERF expression in these cells blocked androgen-dependent gene expression (Extended Data Fig. 10b, c) and prevented tumour formation (Fig. 4b). To address the role of ERF in transformation of human prostate cancer cells, we predicted that the anti-proliferative effect of ERG knockdown in ERG-positive cells22 should be rescued by concurrent knockdown of ERF. Consistent with previous findings22, partial ERG deletion via CRISPR–Cas9 led to a complete halt of proliferation (Fig. 4c and Extended Data Fig. 10d). Strikingly, stable shRNA knockdown of ERF before partial ERG deletion rescued cells from ERG-dependent proliferation and survival. Moreover, ERF knockdown restored the constricted androgen transcriptome conferred by ERG loss, including restoration of SCD and PLEKHD1 mRNA upregulation (Fig. 4d and Extended Data Fig. 10e).
Figure 4. TMPRSS2-ERG activity is mediated, in part, by inactivation of ERF function.
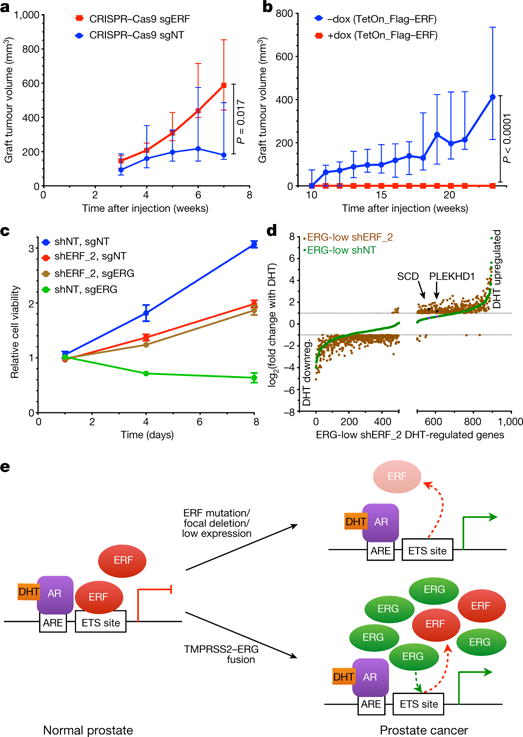
a, Tumour volumes of grafts derived from Pten−/−;R26ERG/ERG organoids infected with CRISPR–Cas9 targeting ERF (sgERF). Data are median ± interquartile range; n = 10 tumours per condition, P value via Mann-Whitney exact two-tailed test. b, Similar to a but infected instead with doxycycline-inducible Flag–ERF. c, Cell viability assay in pooled VCaP cells infected first with shRNA targeting ERF (shERF_2) followed by sgERF. Data are mean ± s.e.m.; n = 3 biological replicates. d, Androgen-regulated genes (as in Extended Data Fig. 4b) in ERG-low VCaPs and shERF_2 analysed by magnitude of change; n = 3 biological replicates. DHT downreg., DHT downregulated. e, ERF inactivation model for genes with androgen receptor and ETS binding sites.
We propose that loss of ERF activity, either by rare genomic loss-of-function mutations or more commonly by competition with the TMPRSS2–ERG oncogenic gene product, leads to activation of the androgen receptor pathway and prostate cancer (Fig. 4e). The consequences of ERF loss and ERG gain have many common functional consequences, including regulation of luminal morphology, expanded activity of androgen receptor, and an ability to form tumours in a Pten−/− background. Such similarities are consistent with their mutual exclusivity and the ability of ERF loss to rescue ERG-positive prostate cancer cells from ERG dependency. On the other hand, the fact that ERG translocations are more common than ERF mutant tumours (46% versus 4%, respectively, in the TCGA-333 primary prostate cancer cohort) raises the possibility that ERG has additional gain-of-function activities that favour oncogenic transformation, such as an intrinsic androgen receptor reprogramming activity15,21. A related but unresolved question is whether the oncogenic phenotype of ERF loss is simply due to loss of repression, or to gain-of-function conferred by competition with an unknown endogenous ‘positive’ ETS factor. Understanding ETS competition has implications also for ETS-driven leukaemias and sarcomas, and perhaps more broadly for other oncogenic transcription factors for which corresponding loss-of-function mutations in cognate repressors might be considered.
METHODS
Cell lines
Mouse prostate organoids were isolated and grown as described previously16 from the prostates of normal (Pten+/+), Pten−/−, and Pten−/−; R26ERG/ERG mice15. Isolation and growth of MSK-PCa3 cells were described previously5. LNCaP cells were obtained from American Type Culture Collection (ATCC) and maintained as previously described23. CWR22Pc were a gift from M. Nevalainen and maintained as described previously23. For CWR22Pc cells specifically charcoal-stripped media was used for transcriptome analysis. VCaP cells were obtained from ATCC (CRL-2876) and maintained as previously described23. Cells were confirmed to be free of mycoplasma using a Lonza detection kit (LT07-318). Cell line authentication was confirmed by SNP fingerprinting and hallmark gene-fusions/mutations were identified by deep sequencing.
Prostate cancer tumour profiling
Profiles of the various cohorts3–7 outlined in Extended Data Fig. 1a can be explored in the cBioPortal for Cancer Genomics (http://www.cbioportal.org). The TCGA data can also be accessed through the Broad Institute FireBrowse portal (http://firebrowse.org/?cohort=PRAD), and the ICGC–CRUK Prostate Adenocarcinoma data can be accessed through the ICGC Portal (https://icgc.org/icgc/cgp/70/508/71331). In Fig. 1a and Extended Data Fig. 2b, we report four previously unpublished mutations in ERF from a larger Stand Up to Cancer3 (SU2C) cohort that will be described in the future.
Organoid histology and xenografts
Organoids were infected with the indicated lentivirus, selected with puromycin and further selected with FACS. For histology and immunohistochemistry, organoids were processed as described previously5,16. Immunohistochemistry was performed using a Ventana BenchMark ULTRA. The anti-CK8/18 antibody was purchased from Abcam (ab53280). In vivo xenograft experiments were performed as described previously23, using 7-week-old male C.B17 SCID mice (Taconic): one million cells were injected into the flank for a total of ten tumours per shRNA and cell type. Once tumours were palpable, tumour volume was measured weekly using a Peira TM900 system (Peira, Belgium). The maximal tumour volume permitted by our Institutional Animal Care and Use Committee under protocol 06-07-012 was 2 cm3, beyond which mice were euthanized. All animal experiments were performed in compliance with the guidelines of the Research Animal Resource Center of Memorial Sloan Kettering Cancer Center.
Inhibition of gene expression, and overexpression
ERF shRNA knockdown experiments were performed by infection and puromycin selection of cells with lentivirus containing the miR-E based SGEP or SGEN vectors24 gifted by J. Zuber containing the following guide sequences: shErf_m: TTGAACTTGTAGGTGAACCGTT, shERF_2: TTGTTTTGAATACATTCTCCAG, shERF_1: TTGAAATTGAACTTGTAGGTGA, shNT was previously described as Ren.713 targeting Renilla luciferase24. ERG shRNA knockdown experiments were performed by infection and neomycin selection of cells with lentivirus containing the Tet-pLKO-neo vector gifted by D. Wiederschain (Addgene plasmid 21916) using the previously published ERG shRNA and non-targeting sequences25. For Tet-responsive reporters, either dimethylsulfoxide (DMSO) vehicle or doxycycline (Sigma) was added at 100 ng ml−1. CRISPR–Cas9 experiments were performed by infection and puromycin selection of cells with lentivirus containing the lentiCRISPRv2 vector gifted by F Zhang (Addgene plasmid 52961) containing the following guide sequences chosen via the http://www.genome-engineering.org website: sgERG (GATAACTCTGCGCTCGTTCG), sgERFm (CCTGCCAAGCGATGACGCCC), and previously described sgNT26. Overexpression of cDNAs was achieved by the constitutive or Tet-inducible pLV-based lentiviral expression system.
Transcription analysis
RNA was extracted from cell lines using an RNeasy Kit (Qiagen). For quantitative PCR with reverse transcription (RT–qPCR) and RNA-seq experiments, cells were plated in triplicate per condition/infected construct at the beginning of the assay (duplicate for mouse organoid RNA-seq), and thereafter replicates were processed independently. Error bars for bar graphs indicate s.e.m. for the biological replicates. DHT (Sigma) (or DMSO vehicle) was added at 1 nM, and treatments were performed for 16 h. For RT–qPCR, cDNA was generated with a High Capacity cDNA Reverse Transcription Kit (Applied Biosystems). Data were quantified relative to β-actin or GAPDH expression, and relative expression was plotted. Primers for human and mouse ERF were purchased from Qiagen. Other qPCR primers were as follows: androgen receptor (F: CCATCTTGTCGTCAATGTTATGAAGC, R: AGCTTCTGGGTTGTCTCCTCAGTGG), ERG (F: CAAAACTCTCCACGGTTAATGC, R: ACCGGTCCAGGCTGATCT).
For RNA-seq, library preparation and sequencing were performed by the Memorial Sloan Kettering Cancer Center Integrated Genomics Operation Core using Illumina HiSeq with 50 base pair (bp) paired-end reads, with approximately 30 million reads generated for each sample. The output data (FASTQ files) were mapped to the target genome (UCSC HG19 or UCSC MM10) using the rnaStar aligner, which mapped reads genomically and resolved reads across splice junctions. The 2-pass mapping method was used in which the reads were mapped twice. The first mapping pass used a list of known annotated junctions from Ensembl. Novel junctions found in the first pass were then added to the known junctions and a second mapping pass was done (on the second pass the RemoveNoncanonical flag was used). After mapping, we post-processed the output SAM files using the PICARD tools to add read groups, with AddOrReplaceReadGroups, which sorted the file and converted it to the compressed BAM format. We then computed the expression count matrix from the mapped reads using HTSeq (http://www-huber.embl.de/users/anders/HTSeq). The raw count matrix generated by HTSeq was then processed using the R/Bioconductor package DESeq (http://www-huber.embl.de/users/anders/DESeq/), which was used both to normalize the full dataset and to analyse differential expression between sample groups. Androgen-regulated genes were defined as a twofold difference, false discovery rate (FDR) < 0.05 with 1 nM DHT treatment for 16 h DHT. For GSEA, statistical analysis was performed with publicly available software from the Broad Institute (http://www.broadinstitute.org/gsea/index.jsp).
ChIP
Chromatin processing, as well as anti-androgen receptor, anti-ERG, and immunoglobulin-G ChIP were described previously15. ERF ChIP was performed with anti-ERF antibody (Pierce PA5-30237). For ChIP–qPCR, the ETS2 promoter primers (forward: TTACTTCCTCCAGAGACTGACGA; reverse: CGCCGGCCAGAGACGAT) were used. The PSA upstream sequence lacking the ERF motif or androgen receptor binding motif was described previously27. For ChIP–seq, library preparation and RNA-seq were performed by the Memorial Sloan Kettering Cancer Center Integrated Genomics Operation Core using Illumina HiSeq with 50-bp paired-end reads. The reads were aligned to the human genome (hg19, build 37) or the mouse genome (mm10, build 38) using the program BWA (default parameters) within the PEMapper. The software MACS2 (ref. 28) (−q 0.1) was used for peak identification with data from ChIP input DNAs as controls. Peaks of sizes > 100 bp and with at least one base pair covered by > 15 reads were selected as the final peaks. Peaks from different conditions were merged to obtain non-overlapping genomic regions, which were then used to determine conditional specific binding. Overlapped peaks were defined as those sharing at least one base pair. Two replicates were performed per condition, and peaks called in both replicates were used as the final peaks for each condition. To generate heat maps depicting ERF ChIP–seq read density in ±2 kilobase regions of the ERF peak summits, the same number of ChIP–seq reads from different conditions were loaded into the software seqMINER29, and the resulting read density matrices were sorted by the read densities in the ERG-low condition in VCaP cells or wild-type condition for the mouse prostate organoids, before colouring. The criteria for assigning peaks to genes have been described previously30,31. The MEME-ChIP software32 was applied to 300-bp sequences around the peak summits for motif discovery.
Immunoprecipitation and western blot analysis
Protein was extracted from cell lines using M-PER Reagent (Thermo Scientific) and quantified by BCA Protein Assay (ThermoFisher Scientific). Nuclear/cytoplasmic fractionation was achieved with an NE-PER kit (ThermoFisher Scientific). ERF immunoprecipitation was performed with anti-ERF antibody (Pierce PA5-30237). Western blots were imaged using the fluorometric-based LiCor system, using primary antibodies against ERF (Santa Cruz sc-15435 or Abcam ab61108) and PTEN (Cell Signaling 9188). Western blotting for androgen receptor, ERG, GAPDH, and actin was described previously15.
In vitro growth assay
Cells were plated in triplicate and assayed at the time points indicated using CellTiter-Glo (Promega). Viability was plotted normalized to day 1. Error bars indicate s.e.m.
Statistics
Mutual exclusivity in the cBio Oncoprints was calculated using a two-tailed Fisher’s exact test. For RT–qPCR and RNA-seq experiments, cells were plated in triplicate per condition/infected construct at the beginning of the assay (duplicate for mouse organoid RNA-seq), and thereafter replicates were processed independently. RT–qPCR bar graphs are plotted as mean ± s.e.m. For RNA-seq, differentially expressed genes were defined as a twofold difference, FDR < 0.05 of DESeq-normalized expression. For GSEA, statistical analysis was performed with publicly available software from the Broad Institute (http://www.broadinstitute.org/gsea/index.jsp). For the correlation of the androgen transcriptional signatures with ERF mRNA in human tumours, statistical significance of correlations was calculated by Spearman’s test. Mouse graft experiments consisted of ten tumours per condition, and a Mann-Whitney test was used in Fig. 4 to analyse differences in tumour volume. The sample size estimate was based on our experience with previous experiments5,15,23. No formal randomization process was used to assign mice to a given organoid injection, and experimenters were not blinded.
Data availability
All data are available from the authors upon reasonable request. The described RNA-seq and ChIP–seq data have been deposited in the Gene Expression Omnibus under accession number GSE83653.
Extended Data
Extended Data Figure 1. Recurrent ERF loss-of-function mutations are found in prostate cancer and are destabilizing.
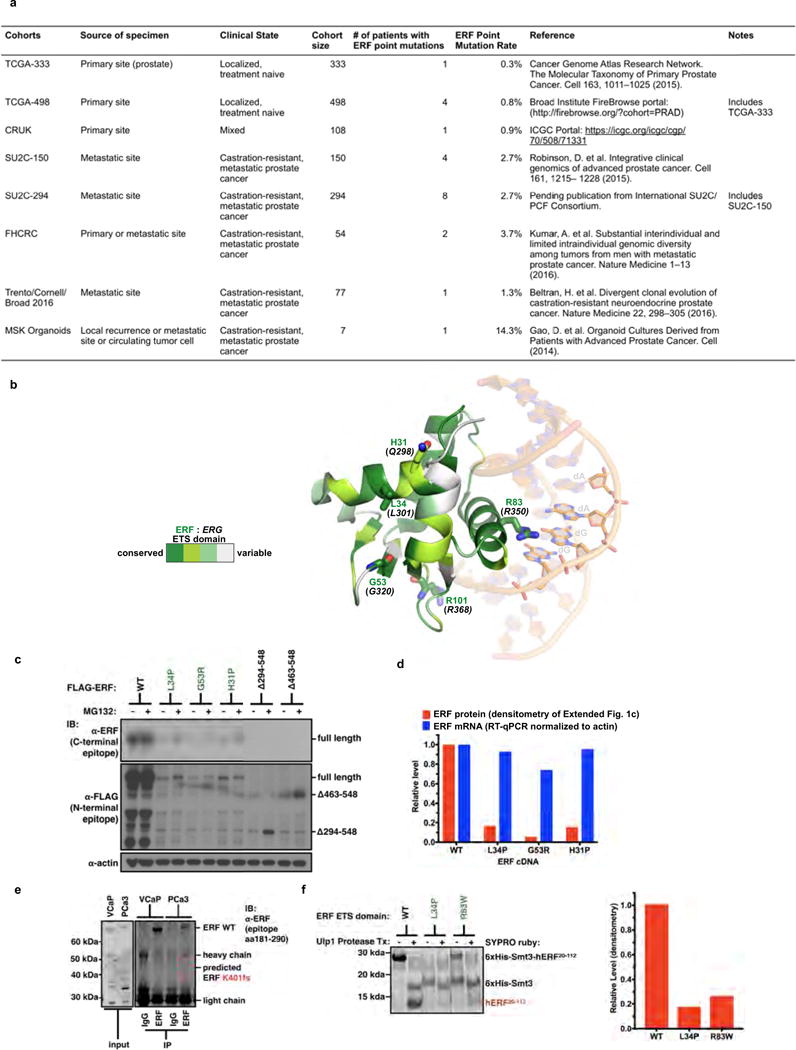
Related to Fig. 1. a, Description of the prostate cancer patient cohorts3–8. b, ERG ETS domain (Protein Data Bank accession number 4IRI) illustrating sequence conservation with ERF. ERF missense mutations indicated by sticks. c, Expression of ERF mutant proteins in LNCaP cells. For gel source data, see Supplementary Fig. 1. d, ERF mutant protein densitometry from immunoblot in Extended Data Fig. 1c compared with mRNA RT–qPCR. e, ERF immunoprecipitation in VCaP and MSK-PCa3 cells. f, Left, bacterially expressed ETS domain (hERF20–112) with ERF tumour mutations before (−) or after (+) Ulp1 protease cleavage. Right, densitometry of in vitro ETS domains.
Extended Data Figure 2. Recurrent ERF loss-of-function mutations and focal deletions are found in prostate cancer and are mostly exclusive to tumours without TMPRSS2–ERG.
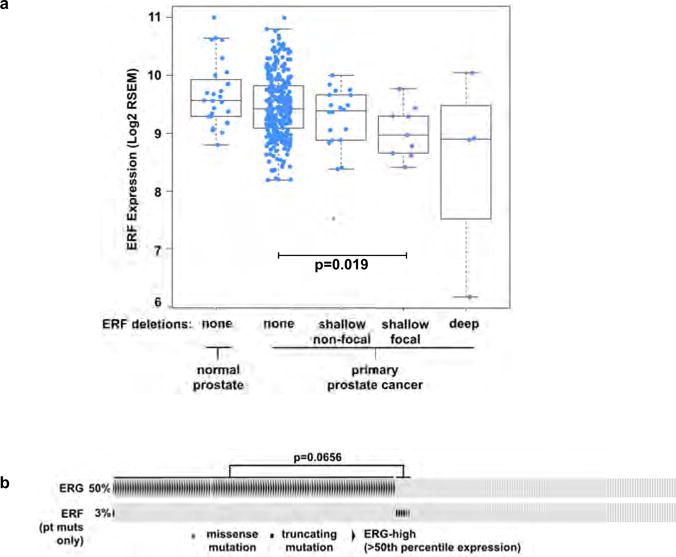
Related to Fig. 1. a, ERF expression in TCGA-333 cohort4 (n = 333 patients) segregated by copy number loss. Data are Tukey box-and-whisker plots; P value calculated by two-tailed t-test of log2(RSEM values). b, cBio Oncoprint of the SU2C-294 (n = 294) metastatic prostate cancer cohort3. Unlike Fig. 1c, focal ERF deletions could not be ascertained because of differences between TCGA and SU2C copy number data3,4. P value calculated by Fisher’s exact two-tailed test.
Extended Data Figure 3. ERF is a negative regulator of androgen signalling.
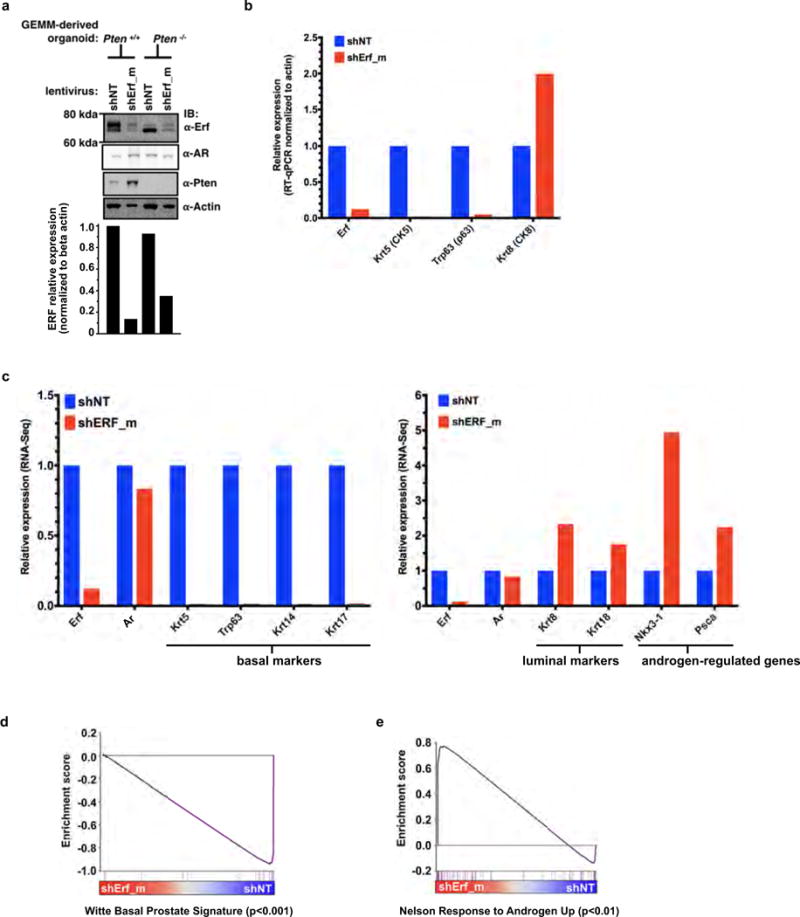
Related to Fig. 2. a, Mouse prostate organoids infected with non-targeting shRNA (shNT) or targeting ERF (shErf_m), grown in three-dimensional culture. For RT–qPCR, n = 2 biological replicates. For gel source data, see Supplementary Fig. 1. b, RT–qPCR analysis of the Pten+/+ organoids; n = 2 biological replicates. c, RNA-seq analysis of organoids derived from Pten+/+ and Pten−/− mouse prostates infected with non-targeting shNT or shErf_m; n = 2 biological replicates. d, Pten+/+ organoid RNA-seq (n = 2 biological replicates) interrogated by GSEA for expression signature of Witte basal prostate cancer18. e, Same data interrogated by GSEA for Nelson androgen up expression signature20.
Extended Data Figure 4. ERF is a negative regulator of androgen signalling.
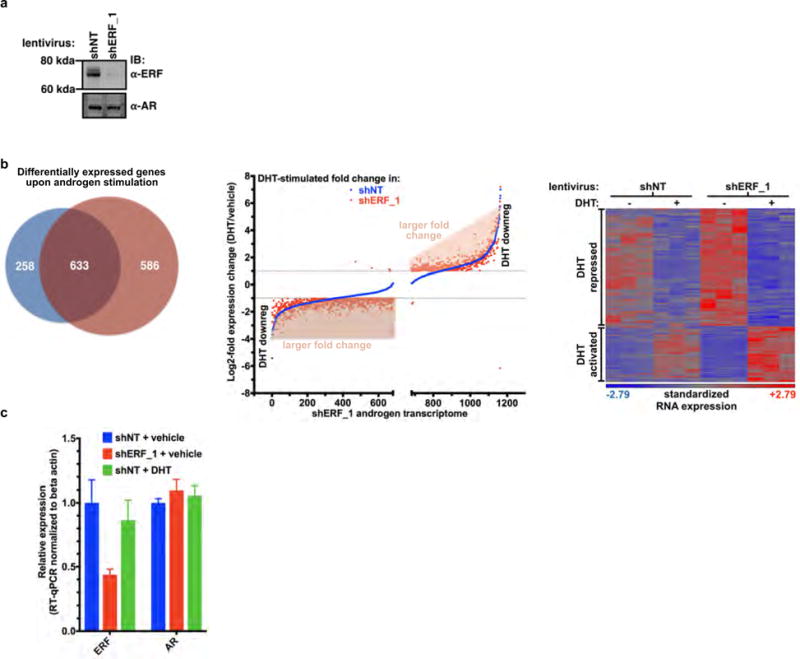
Related to Fig. 2. a, CWR22Pc cells infected with shRNA targeting human ERF (shERF_1) or a non-targeting shRNA (shNT). For gel source data, see Supplementary Fig. 1. b, Androgen-regulated genes (at least a twofold change, FDR < 0.05 by RNA-seq with 1 nM DHT for 16 h) in CWR22PC cells infected with either shERF_1 or shNT, analysed by the number (left, Venn diagram), the magnitude of expression change (centre, graph), and heat map (right); n = 3 biological replicates. c, RT–qPCR from CWR22Pc cells infected with shERF_1 or shNT. Data are mean ± s.e.m.; n = 3 biological replicates.
Extended Data Figure 5. ERF is a negative regulator of androgen signalling.
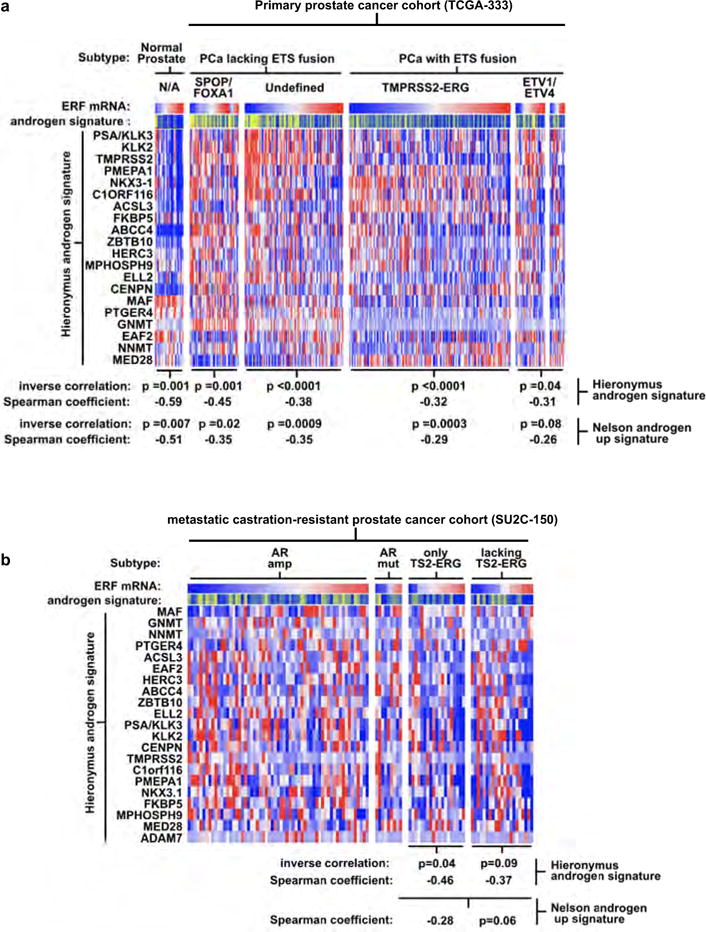
Related to Fig. 2. a, Full version of Fig. 2d. Expression profiles of the TCGA-333 primary prostate cancer cohort4 (n = 333 patients) were interrogated for correlation between the ERF mRNA level and two androgen transcriptional activity signatures4,19. P values were calculated by the Spearman correlation test. b, The same analysis as a was applied to the SU2C-150 (n = 150 patients) metastatic castration-resistant prostate cancer cohort3 (mCRPC).
Extended Data Figure 6. ERF and ERG knockdown do not affect androgen receptor levels or its subcellular localization.
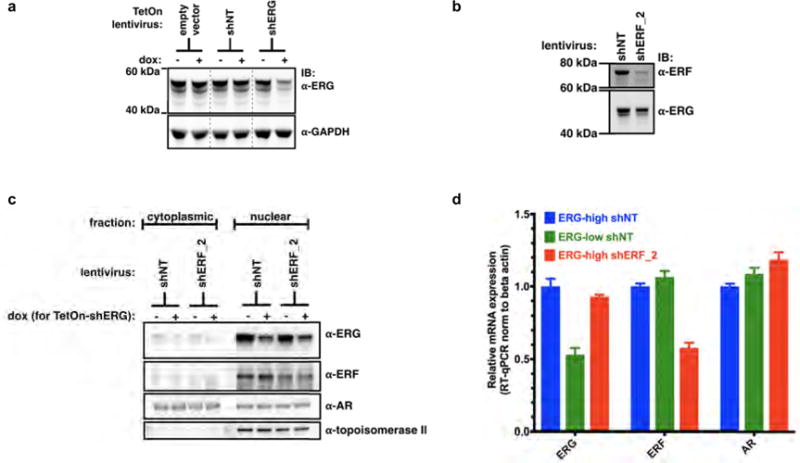
Related to Fig. 3. a, VCaP cells infected with doxycycline (dox)-inducible shRNA targeting ERG (+dox, ERG-low; −dox, ERG-high). For gel source data, see Supplementary Fig. 1. b, VCaP cells infected with shRNA targeting ERF (shERF_2) or a non-targeting shRNA (shNT). c, Nuclear/cytoplasmic fractionation of VCaP cells infected with shNT or shERF_2, and the doxycycline-inducible shRNA targeting ERG (shERG). d, RT–qPCR with ERG-low VCaP cells compared with those infected with shERF_2. Data are mean ± s.e.m.; n = 3 biological replicates.
Extended Data Figure 7. ERF and TMPRSS2–ERG have opposing effects on the androgen transcriptome.
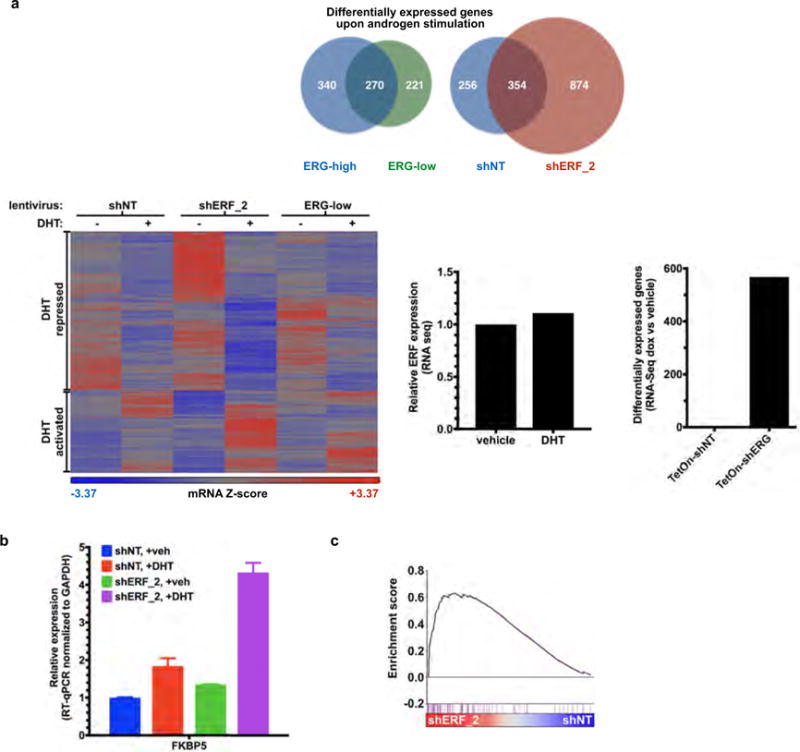
Related to Fig. 3. a, Androgen-regulated genes (at least a twofold change, FDR < 0.05 by RNA-seq with 1 nM DHT for 16 h) in VCaP cells infected with a doxycycline-inducible shRNA targeting ERG (with doxycycline, ERG-low; without doxycycline, ERG-high) or a constitutive shRNA targeting ERF (shERF_2) and analysed by number (top) and heat map (bottom left); n = 3 biological replicates. Bottom centre, RNA-seq analysis evaluating the effect of dihydrotestosterone on ERF expression. Bottom right, the effect of doxycycline alone on RNA-seq differential expression analysis. b, RT–qPCR of shERF_2-infected VCaP cells treated ± DHT. Data are mean ± s.e.m.; n = 3 biological replicates. c, Interrogation of RNA-seq in shERF_2 VCaP cells (n = 3 biological replicates) by GSEA for Nelson androgen up expression signature20.
Extended Data Figure 8. ERF and TMPRSS2–ERG have opposing effects on the androgen receptor cistrome.
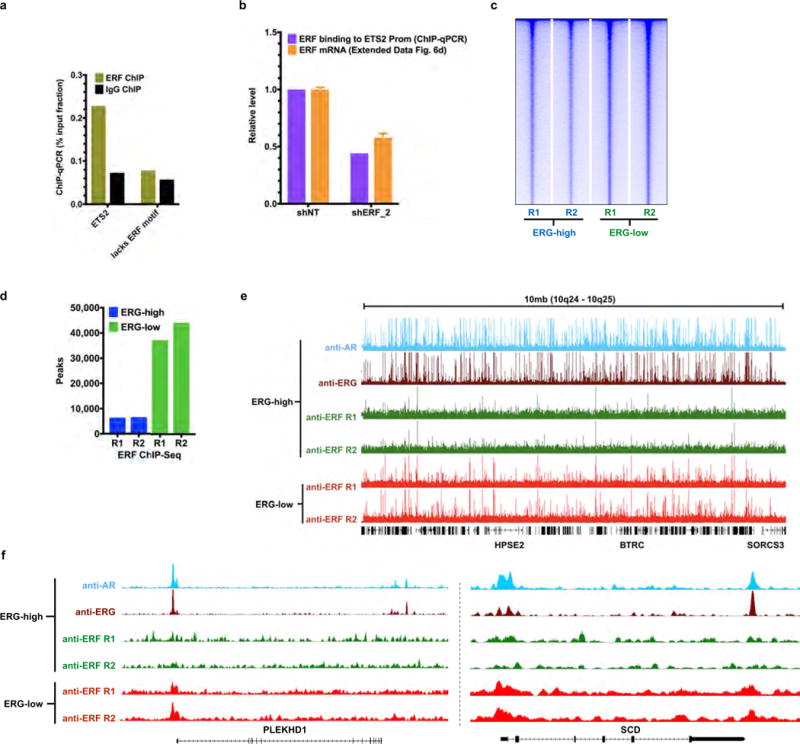
Related to Fig. 3. a, ChIP–qPCR (n = 2 biological replicates) in VCaP cells, amplifying either the ETS2 promoter region that contains a known ERF binding site9, or an upstream element of PSA27 lacking the ERF binding motif noted in (2) in Fig. 3b. b, The effect of ERF shRNA knockdown on its binding to the ETS2 promoter as assessed by ChIP–qPCR (n = 2 biological replicates), compared with its effect on ERF mRNA by RT–qPCR. Data are mean ± s.e.m.; n = 3 biological replicates. c, ERF ChIP–seq in ERG-high or ERG-low (n = 2 biological replicates: R1, R2) analysed by heat maps. d, Comparison of ERF ChIP–seq peak numbers, n = 2 biological replicates: R1, R2. e, A 10-Mb region illustrating ChIP–seq of ERF binding in ERG-high condition compared with ERG-low. f, ChIP–seq signals for the SCD and PLEKHD1 loci. In both e and f, ChIP–seq signals at the y axis were normalized by read depths.
Extended Data Figure 9. ERG expression decreases the ERF cistrome in normal prostate organoids.
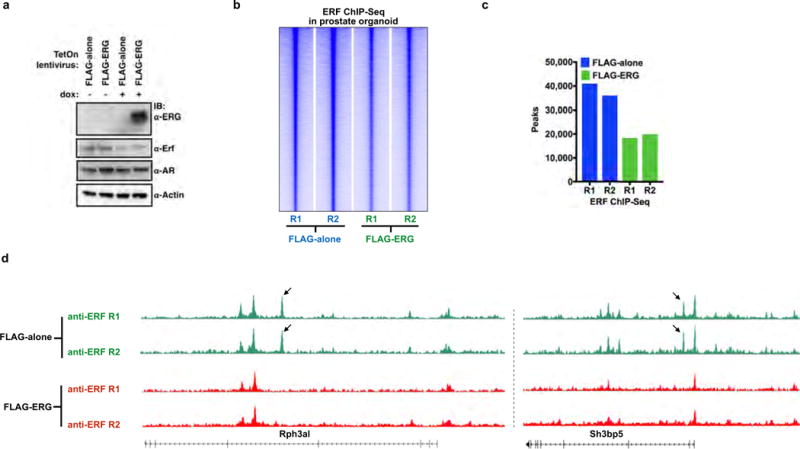
Related to Fig. 3. a, Mouse normal prostate organoids were infected with a TetOn doxycycline-inducible Flag–ERG or empty vector (Flag-alone) and treated with or without doxycycline. For gel source data, see Supplementary Fig. 1. b, ERF ChIP–seq in normal prostate organoids infected with either Flag-alone or Flag–ERG lentivirus, both treated with doxycycline (n = 2 biological replicates: R1, R2), and analysed with heat maps. c, Comparison of ERF ChIP–seq peak numbers, n =2 biological replicates (R1, R2). d, ERF ChIP–seq signals for the Rph3a1 and Sh3bp5 loci, normalized by read depths.
Extended Data Figure 10. TMPRSS2–ERG activity is mediated, in part, by inactivation of ERF function.
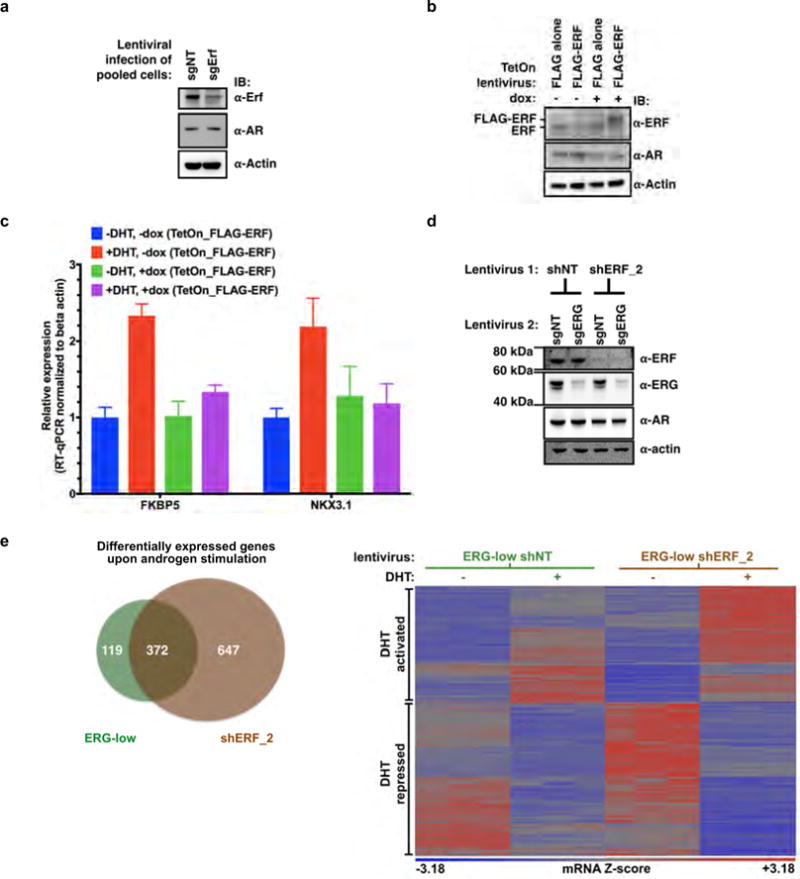
Related to Fig. 4. a, Pooled mouse Pten−/−; R26ERG/ERG organoids infected with CRISPR–Cas9 targeting AAVS1 (sgNT) or ERF (sgErf). For gel source data, see Supplementary Fig. 1. b, Pten−/−; R26ERG/ERG organoids infected instead with a doxycycline-inducible Flag–ERF or empty vector (Flag alone). c, RT−qPCR of mRNA isolated from the Flag−ERF-infected organoids and treated with or without doxycycline, with or without dihydrotestosterone 1 nM for 16 h. Data are mean ± s.e.m.; n = 3 biological replicates. d, Pooled VCaP cells were first infected with non-targeting shRNA (shNT) or ERF (shERF_2), followed by sgNT or sgERF CRISPR–Cas9. e, Androgen-regulated genes (at least a twofold change, FDR < 0.05 by RNA-seq with 1 nM DHT for 16 h) in VCaP cells infected with a doxycycline-inducible shRNA targeting ERG (with doxycycline, ERG-low) and either a constitutive shRNA targeting ERF (shERF_2) or a non-targeting shRNA (shNT). Data analysed by number (left, Venn diagram) and heat map (right); n = 3 biological replicates.
Supplementary Material
Acknowledgments
We thank A. Heguy, H. Hieronymous, J. Li, Y. Liang, E. Peguero, M. Pirun, N. Socci, P. Watson, A. Viale, Y. Zhang, Memorial Sloan Kettering Cancer Center core facilities, and the members of the Sawyers laboratory for comments. R.B. was supported by an American Society of Clinical Oncology (ASCO) Young Investigator Award, a Department of Defense Physician Training Award, and a Prostate Cancer Foundation Young Investigator Award. W.A. was supported by an ASCO Young Investigator Award and Prostate Cancer Foundation Young Investigator Award. M.G.D. was supported by a Howard Hughes Medical Institute (HHMI) Summer Medical Fellowship. N.Sch. is supported by the Prostate Cancer Foundation. C.L.S. is an investigator of the HHMI and this project was supported by National Institutes of Health grants CA155169, CA19387, CA092629, and CA008748.
The International SU2C/PCF Prostate Cancer Dream Team
Dan Robinson9,10, Eliezer M. Van Allen11,12, Yi-Mi Wu9,10, Nikolaus Schultz13,14, Robert J. Lonigro9, Juan-Miguel Mosquera15,16,17,18, Bruce Montgomery19,20,21, Mary-Ellen Taplin11, Colin C. Pritchard22, Gerhardt Attard23,24, Himisha Beltran16,17,18,25, Wassim Abida26, Robert K. Bradley19, Jake Vinson27, Xuhong Cao9,28, Pankaj Vats9, Lakshmi P. Kunju9,10,29, Maha Hussain29,30,31, Scott A. Tomlins9,10,29,31, Kathleen A. Cooney29,30,31, David C. Smith29,30,31, Christine Brennan9, Javed Siddiqui9, Rohit Mehra9,10, Yu Chen9,25,26, Dana E. Rathkopf25,26, Michael J. Morris25,26, Stephen B. Solomon32, Jeremy C. Durack32, Victor E. Reuter33, Anuradha Gopalan33, Jianjiong Gao14, Massimo Loda11,12,34,35, Rosina T. Lis11,34, Michaela Bowden11,34,35, Stephen P. Balk36, Glenn Gaviola37, Carrie Sougnez12, Manaswi Gupta12, Evan Y. Yu20,21, Elahe A. Mostaghel19,20,21, Heather H. Cheng19,20,21, Hyojeong Mulcahy38, Lawrence D. True39, Stephen R. Plymate20,21, Heidi Dvinge19, Roberta Ferraldeschi23,24, Penny Flohr23,24, Susana Miranda23,24, Zafeiris Zafeiriou23,24, Nina Tunariu23,24, Joaquin Mateo23,24, Raquel Perez-Lopez23,24, Francesca Demichelis16,40, Brian D. Robinson15,16,17,18, Marc Schiffman15,18,41, David M. Nanus16,17,18,25, Scott T. Tagawa16,17,18,25, Alexandros Sigaras16,42,43, Kenneth W. Eng16,42,43, Olivier Elemento42, Andrea Sboner15,16,18,42, Elisabeth I. Heath44,45, Howard I. Scher25,26, Kenneth J. Pienta46, Philip Kantoff3, Johann S. de Bono23,24, Mark A. Rubin15,16,17,18, Peter S. Nelson18,20,21,47,48, Levi A. Garraway11,12, Charles L. Sawyers49 & Arul M. Chinnaiyan9,10,28,29,31
9Michigan Center for Translational Pathology, University of Michigan Medical School, Ann Arbor, Michigan 48109, USA. 10Department of Pathology, University of Michigan Medical School, Ann Arbor, Michigan 48109, USA. 11Department of Medical Oncology, Dana-Farber Cancer Institute, Boston, Massachusetts 02215, USA. 12Broad Institute of Massachusetts Institute of Technology and Harvard, Cambridge, Massachusetts 02142, USA. 13Department of Epidemiology and Biostatistics, Memorial Sloan Kettering Cancer Center, New York, New York 10065, USA. 14Marie-Josée and Henry R. Kravis Center for Molecular Oncology, Memorial Sloan Kettering Cancer Center, New York, New York 10065, USA. 15Department of Pathology and Laboratory Medicine, Weill Medical College of Cornell University, New York, New York 10021, USA. 16Institute for Precision Medicine, Weill Medical College of Cornell University, New York, New York 10021, USA. 17New York Presbyterian Hospital, New York, New York 10021, USA. 18Meyer Cancer, Weill Medical College of Cornell University, New York, New York 10021, USA. 19Computational Biology Program, Public Health Sciences Division and Basic Science Division, Fred Hutchinson Cancer Center, University of Washington, Seattle, Washington 98109, USA. 20Department of Medicine, University of Washington, Seattle, Washington 98109, USA. 21Veterans Affairs Puget Sound Health Care System, University of Washington, Seattle, Washington 98109, USA. 22Department of Laboratory Medicine, University of Washington, Seattle, Washington 98195, USA. 23The Royal Marsden, Downs Road, Sutton SM2 5PT, UK. 24The Institute of Cancer Research, Downs Road, Sutton SM2 5PT, UK. 25Department of Medicine, Weill Medical College of Cornell University, New York, New York 10021, USA. 26Genitourinary Oncology Service, Department of Medicine, Sidney Kimmel Center for Prostate and Urologic Cancers, Memorial Sloan Kettering Cancer Center, New York, New York 10065, USA. 27Prostate Cancer Clinical Trials Consortium, Memorial Sloan Kettering Cancer Center, New York, New York 10065, USA. 28Howard Hughes Medical Institute, University of Michigan, Ann Arbor, Michigan 48109, USA. 29Comprehensive Cancer Center, University of Michigan Medical School, Ann Arbor, Michigan 48109, USA. 30Department of Internal Medicine, Division of Hematology Oncology, University of Michigan Medical School, Ann Arbor, Michigan 48109, USA. 31Department of Urology, University of Michigan Medical School, Ann Arbor, Michigan 48109, USA. 32Interventional Radiology, Department of Radiology Service, Memorial Sloan Kettering Cancer Center, New York, New York 10065, USA. 33Department of Pathology, Memorial Sloan Kettering Cancer Center, New York, New York 10065, USA. 34Center for Molecular Oncologic Pathology, Dana-Farber Cancer Institute, Boston, Massachusetts 02215, USA. 35Department of Pathology, Brigham & Women’s Hospital, Boston, Massachusetts 02115, USA. 36Division of Hematology-Oncology, Department of Medicine, Beth Israel Deaconess Cancer Center, Beth Israel Deaconess Medical Center, Harvard Medical School, Boston, Massachusetts 02215, USA. 37Department of Musculoskeletal Radiology, Brigham and Women’s Hospital, Boston, Massachusetts 02115, USA. 38Department of Radiology, University of Washington, Seattle, Washington 98109, USA. 39Department of Pathology, University of Washington Medical Center, Seattle, Washington 98109, USA. 40Laboratory of Computational Oncology, CIBIO, Centre for Integrative Biology, University of Trento, 38123 Mattarello TN, Italy. 41Division of Interventional Radiology, Department of Radiology, New York-Presbyterian Hospital/Weill Cornell Medical Center, New York, New York 10021, USA. 42Institute for Computational Biomedicine, Department of Physiology and Biophysics, Weill Medical College of Cornell University, New York, New York 10021, USA. 43Department of Physiology & Biophysics, Weill Medical College of Cornell University, New York, New York 10021, USA. 44Department of Oncology, Wayne State University School of Medicine, Detroit, Michigan 48201, USA. 45Molecular Therapeutics Program, Barbara Ann Karmanos Cancer Institute, Detroit, Michigan 48201, USA. 46The James Buchanan Brady Urological Institute and Department of Urology, Johns Hopkins School of Medicine, Baltimore, Maryland 21205, USA. 47Division of Human Biology, Fred Hutchinson Cancer Research Center, Seattle, Washington 98109, USA. 48Division of Clinical Research, Fred Hutchinson Cancer Research Center, Seattle, Washington 98109, USA. 49Howard Hughes Medical Institute, Memorial Sloan Kettering Cancer Center, New York, New York 10065, USA.
Footnotes
Online Content Methods, along with any additional Extended Data display items and Source Data, are available in the online version of the paper; references unique to these sections appear only in the online paper.
Supplementary Information is available in the online version of the paper.
Author Contributions R.B. and C.L.S. conceived and oversaw the project, performed data interpretation, and co-wrote the manuscript. R.B., E.V.W., W.A., Z.Z., and P.S.S. performed immunoblots, R.B. and P.S.S. performed RNA analysis, W.R.K., P.J.I. and R.B. performed immunohistochemistry, J.W. performed the mouse grafting, R.B. and A.P. prepared experiments for ChIP–seq, and R.B. performed in vitro cell growth assays. W.R.K. made three-dimensional organoid cultures, E.V.W. made bacterially expressed proteins, and R.B., W.R.K., W.A., E.V.W., P.J.I., and M.G.D. cloned plasmid reagents. E.V.W. performed ETS stability analysis, J.A., N.Sch., and R.B. performed analysis of human prostate cancer cohorts, N.Sh. performed gene set enrichment analysis (GSEA), and P.W., Y.Z., and D.Z. performed ChIP–seq analysis. All individual authors made intellectual contributions and reviewed the manuscript. The International SU2C/PCF Cancer Dream provided four unpublished ERF point mutations. The International SU2C-PCF Dream Team is led by A.M.C. and C.L.S.
The authors declare no competing financial interests. Readers are welcome to comment on the online version of the paper. Publisher’s note: Springer Nature remains neutral with regard to jurisdictional claims in published maps and institutional affiliations.
Reviewer Information Nature thanks J. Carroll, T. Sato, L. Trotman and the other anonymous reviewer(s) for their contribution to the peer review of this work.
References
- 1.Tomlins SA, et al. Recurrent fusion of TMPRSS2 and ETS transcription factor genes in prostate cancer. Science. 2005;310:644–648. doi: 10.1126/science.1117679. [DOI] [PubMed] [Google Scholar]
- 2.Carver BS, et al. Aberrant ERG expression cooperates with loss of PTEN to promote cancer progression in the prostate. Nat Genet. 2009;41:619–624. doi: 10.1038/ng.370. [DOI] [PMC free article] [PubMed] [Google Scholar]
- 3.Robinson D, et al. Integrative clinical genomics of advanced prostate cancer. Cell. 2015;161:1215–1228. doi: 10.1016/j.cell.2015.05.001. [DOI] [PMC free article] [PubMed] [Google Scholar]
- 4.Cancer Genome Atlas Research Network. The molecular taxonomy of primary prostate cancer. Cell. 2015;163:1011–1025. doi: 10.1016/j.cell.2015.10.025. [DOI] [PMC free article] [PubMed] [Google Scholar]
- 5.Gao D, et al. Organoid cultures derived from patients with advanced prostate cancer. Cell. 2014;159:176–187. doi: 10.1016/j.cell.2014.08.016. [DOI] [PMC free article] [PubMed] [Google Scholar]
- 6.Kumar A, et al. Substantial interindividual and limited intraindividual genomic diversity among tumors from men with metastatic prostate cancer. Nat Med. 2016;22:369–378. doi: 10.1038/nm.4053. [DOI] [PMC free article] [PubMed] [Google Scholar]
- 7.Beltran H, et al. Divergent clonal evolution of castration-resistant neuroendocrine prostate cancer. Nat Med. 2016;22:298–305. doi: 10.1038/nm.4045. [DOI] [PMC free article] [PubMed] [Google Scholar]
- 8.International Cancer Genome Consortium. Prostate cancer - adenocarcinoma. ICGC Cancer Genome Projects. 2016 https://icgc.org/icgc/cgp/70/508/71331.
- 9.Sgouras DN, et al. ERF: an ETS domain protein with strong transcriptional repressor activity, can suppress ets-associated tumorigenesis and is regulated by phosphorylation during cell cycle and mitogenic stimulation. EMBO J. 1995;14:4781–4793. doi: 10.1002/j.1460-2075.1995.tb00160.x. [DOI] [PMC free article] [PubMed] [Google Scholar]
- 10.Lawrence MS, et al. Mutational heterogeneity in cancer and the search for new cancer-associated genes. Nature. 2013;499:214–218. doi: 10.1038/nature12213. [DOI] [PMC free article] [PubMed] [Google Scholar]
- 11.Twigg SRF, et al. Reduced dosage of ERF causes complex craniosynostosis in humans and mice and links ERK1/2 signaling to regulation of osteogenesis. Nat Genet. 2013;45:308–313. doi: 10.1038/ng.2539. [DOI] [PMC free article] [PubMed] [Google Scholar]
- 12.Hollenhorst PC, McIntosh LP, Graves BJ. Genomic and biochemical insights into the specificity of ETS transcription factors. Annu Rev Biochem. 2011;80:437–471. doi: 10.1146/annurev.biochem.79.081507.103945. [DOI] [PMC free article] [PubMed] [Google Scholar]
- 13.Regan MC, et al. Structural and dynamic studies of the transcription factor ERG reveal DNA binding is allosterically autoinhibited. Proc Natl Acad Sci USA. 2013;110:13374–13379. doi: 10.1073/pnas.1301726110. [DOI] [PMC free article] [PubMed] [Google Scholar]
- 14.Pires DEV, Ascher DB, Blundell TL. DUET: a server for predicting effects of mutations on protein stability using an integrated computational approach. Nucleic Acids Res. 2014;42:W314–W319. doi: 10.1093/nar/gku411. [DOI] [PMC free article] [PubMed] [Google Scholar]
- 15.Chen Y, et al. ETS factors reprogram the androgen receptor cistrome and prime prostate tumorigenesis in response to PTEN loss. Nat Med. 2013;19:1023–1029. doi: 10.1038/nm.3216. [DOI] [PMC free article] [PubMed] [Google Scholar]
- 16.Karthaus WR, et al. Identification of multipotent luminal progenitor cells in human prostate organoid cultures. Cell. 2014;159:163–175. doi: 10.1016/j.cell.2014.08.017. [DOI] [PMC free article] [PubMed] [Google Scholar]
- 17.Klezovitch O, et al. A causal role for ERG in neoplastic transformation of prostate epithelium. Proc Natl Acad Sci USA. 2008;105:2105–2110. doi: 10.1073/pnas.0711711105. [DOI] [PMC free article] [PubMed] [Google Scholar]
- 18.Smith BA, et al. A basal stem cell signature identifies aggressive prostate cancer phenotypes. Proc Natl Acad Sci USA. 2015;112:E6544–E6552. doi: 10.1073/pnas.1518007112. [DOI] [PMC free article] [PubMed] [Google Scholar]
- 19.Hieronymus H, et al. Gene expression signature-based chemical genomic prediction identifies a novel class of HSP90 pathway modulators. Cancer Cell. 2006;10:321–330. doi: 10.1016/j.ccr.2006.09.005. [DOI] [PubMed] [Google Scholar]
- 20.Nelson PS, et al. The program of androgen-responsive genes in neoplastic prostate epithelium. Proc Natl Acad Sci USA. 2002;99:11890–11895. doi: 10.1073/pnas.182376299. [DOI] [PMC free article] [PubMed] [Google Scholar]
- 21.Pomerantz MM, et al. The androgen receptor cistrome is extensively reprogrammed in human prostate tumorigenesis. Nat Genet. 2015;47:1346–1351. doi: 10.1038/ng.3419. [DOI] [PMC free article] [PubMed] [Google Scholar]
- 22.Wang J, et al. Pleiotropic biological activities of alternatively spliced TMPRSS2/ERG fusion gene transcripts. Cancer Res. 2008;68:8516–8524. doi: 10.1158/0008-5472.CAN-08-1147. [DOI] [PMC free article] [PubMed] [Google Scholar]
- 23.Balbas MD, et al. Overcoming mutation-based resistance to antiandrogens with rational drug design. eLife. 2013;2:e00499. doi: 10.7554/eLife.00499. [DOI] [PMC free article] [PubMed] [Google Scholar]
- 24.Fellmann C, et al. An optimized microRNA backbone for effective single-copy RNAi. Cell Reports. 2013;5:1704–1713. doi: 10.1016/j.celrep.2013.11.020. [DOI] [PubMed] [Google Scholar]
- 25.Mounir Z, et al. TMPRSS2:ERG blocks neuroendocrine and luminal cell differentiation to maintain prostate cancer proliferation. Oncogene. 2015;34:3815–3825. doi: 10.1038/onc.2014.308. [DOI] [PubMed] [Google Scholar]
- 26.Wang T, Wei JJ, Sabatini DM, Lander ES. Genetic screens in human cells using the CRISPR–Cas9 system. Science. 2014;343:80–84. doi: 10.1126/science.1246981. [DOI] [PMC free article] [PubMed] [Google Scholar]
- 27.Wang Q, Carroll JS, Brown M. Spatial and temporal recruitment of androgen receptor and its coactivators involves chromosomal looping and polymerase tracking. Mol Cell. 2005;19:631–642. doi: 10.1016/j.molcel.2005.07.018. [DOI] [PubMed] [Google Scholar]
- 28.Feng J, Liu T, Qin B, Zhang Y, Liu XS. Identifying ChIP–seq enrichment using MACS. Nat Protoc. 2012;7:1728–1740. doi: 10.1038/nprot.2012.101. [DOI] [PMC free article] [PubMed] [Google Scholar]
- 29.Ye T, et al. seqMINER: an integrated ChIP–seq data interpretation platform. Nucleic Acids Res. 2011;39:e35. doi: 10.1093/nar/gkq1287. [DOI] [PMC free article] [PubMed] [Google Scholar]
- 30.Arora VK, et al. Glucocorticoid receptor confers resistance to antiandrogens by bypassing androgen receptor blockade. Cell. 2013;155:1309–1322. doi: 10.1016/j.cell.2013.11.012. [DOI] [PMC free article] [PubMed] [Google Scholar]
- 31.Rockowitz S, Zheng D. Significant expansion of the REST/NRSF cistrome in human versus mouse embryonic stem cells: potential implications for neural development. Nucleic Acids Res. 2015;43:5730–5743. doi: 10.1093/nar/gkv514. [DOI] [PMC free article] [PubMed] [Google Scholar]
- 32.Machanick P, Bailey TL. MEME-ChIP: motif analysis of large DNA datasets. Bioinformatics. 2011;27:1696–1697. doi: 10.1093/bioinformatics/btr189. [DOI] [PMC free article] [PubMed] [Google Scholar]
Associated Data
This section collects any data citations, data availability statements, or supplementary materials included in this article.
Supplementary Materials
Data Availability Statement
All data are available from the authors upon reasonable request. The described RNA-seq and ChIP–seq data have been deposited in the Gene Expression Omnibus under accession number GSE83653.