Abstract
The first whole genome sequence of a symbiotic soil bacterium, Sinorhizobium meliloti (formely named Rhizobium meliloti) strain 1021, is due in 2001. As an active participant in the European and North American consortium that has completed this work, our group has sequenced a region on the chromosome containing clusters rpoBC, str, S10, spc and alpha corresponding to 30 protein genes. The structural organization and function of these genes were compared with those of orthologs in another 15 complete eubacterial genomes available in databases. This study, involving the DNA and amino acid sequences as well as the organization of the whole region (gene order, cluster order, etc.), has shown that the phylogenetic tree resulting from a comparison of the amino acid sequence is rather similar to that derived from 16S rRNA sequence data. However, the tree achieved by aligning DNA sequences groups the organisms with a high GC content (>60% GC), while that based on a comparison of gene cluster orientation and organization reveals a greater level of correspondence between the α-proteobacteria S.meliloti and the firmicute Bacillus subtilis.
INTRODUCTION
Sinorhizobium meliloti (formely Rhizobium meliloti), a soil bacterium living mostly in the rhizosphere, is able to nodulate plants belonging to the genera Medicago, Melilotus and Trigonella (1). In the interaction leading to bacterium–plant symbiosis, each Sinorhizobium differentiates into a bacteroid and reduces atmospheric nitrogen to ammonia (2). The agronomical and ecological benefits of symbiotic nitrogen fixation promoted the DNA sequencing of the three replicons of S.meliloti strain 1021 (a chromosome of 3.7 Mb and two megaplasmids of 1.7 and 1.4 Mb) (3,4) by an international consortium. This project is in the final phase and the whole annotated sequence will soon be released. Sinorhizobium meliloti will then be the first non-pathogenic plant-associated bacterial genome available in the databases.
Complete genome sequences can be used to compare organisms with respect to the nucleotide or amino acid content of large coding regions, a comparison most easily achieved in prokaryotes, in view of the relative simplicity of their genomes (often a single circular chromosome) and the continuity of their coding regions (lack of introns).
In this study we have compared a large region of ∼300 kb containing the rpoBC (5), str (6), S10, spc (7) and alpha clusters (8), encoding most of the ribosomal proteins [30 genes in a total of 55 ribosomal proteins (r-proteins)]. Since transcription units and regulatory mechanisms have not yet been characterized in S.meliloti, the term ‘cluster’ is used to designate the same group of genes in Escherichia coli.
Clustered ribosomal protein genes were chosen in view of their ubiquity, similar conservation rates and purity; horizontal transfer between lineages is unlikely. Since ribosomes were discovered in the mid 1950s (9), while their structure, function, biosynthesis and regulation have been extensively studied, cluster organization and gene location over the chromosome have not. From 1965 to 1977, microbial phylogeny relied on the sequence of proteins such as ferredoxins (10) and cytochromes (11). However, the significance of the latter proteins as molecular clocks does not extend beyond their family circle and cannot be considered as representative of genome-wide evolution. Subsequently, the molecular clock function was assigned to the small subunit rRNA (also named 16S rRNA), as proposed by Olsen and Woese (12). In the present analysis, although the ribosomal proteins that bind to the rRNA molecule can also be considered as molecular clocks, we propose to focus mainly on rpoBC, str, S10, spc and alpha cluster comparisons to correlate the structural organization and function of these orthologous genes. This study was performed by considering the DNA and amino acid sequences as well as the genetic organization of the whole region (gene order, cluster order, etc.) and was intended to investigate the relationships between S.meliloti and another 15 complete eubacterial genomes available in the databases. This study indicated that the three types of data (amino acid sequence, DNA sequence and genetic organization) give divergent results. The most interesting of these is that a close relationship has been revealed between S.meliloti, a Gram-negative proteobacterium, and Bacillus subtilis, a Gram-positive firmicute, by means of a genetic organization comparison. We view this similarity as denoting convergent functional and genome evolution processes rather than phylogenetic relationships between the two bacteria.
MATERIALS AND METHODS
Strain
Sinorhizobium meliloti strain 1021 (SU47, StrR, a derivative of strain RCR 2011; 13) was provided by S. R. Long (Department of Biological Sciences, Stanford University, CA).
Data
Data encompassing the sequences of 15 complete eubacterial genomes (Table 1) are available in the GenBank database. No comparison with Archaea was done, as their ribosomal proteins are distinct and incomplete. However, a comparison with the archaeal consensus sequence proposed by Wächtershaüser (14) is shown in Figure 2. Sequences from S.meliloti strain 1021 were determined on BAC14B8 (http://www.recomgen-univ-rennes1.fr/meliloti) using dye terminator chemistry, an ABI 377 automatic sequencer (Perkin Elmer) and the Phred-Phrap software package (Phil Green, University of Washington, Seattle, WA). The S.meliloti whole genome sequence is in publication (F.Galibert, submitted) and data are available at http://sequence.toulouse.inra.fr/meliloti.html.
Table 1. DNA sequence data.
| Organism |
Strain |
Length (Mb) |
GC (%) |
Accession no. |
Classification |
Chromosomea |
| Aquifex aeolicus | VF5 | 1.55 | 50 | AE000657 | Aquificales | 1C |
| Bacillus subtilis | 1423 | 4.21 | 44 | AL009126 | Firmicutes | 1C |
| Borrelia burgdorferi | 139 | 0.91 | 50 | AE000783 | Spirochaetales | 1C-1L |
| Chlamydia pneumoniae | UW3 | 1.04 | 50 | AE001273 | Chlamydiales | 1C |
| Deinococcus radiodurans | R1 | 3.28 | 67b | AE000513b | Thermus/Deinococcus | 3C |
| Escherichia coli | K12 | 4.63 | 51 | U00096 | Gamma-proteobacteria | 1C |
| Haemophilus influenzae | 71421 | 1.83 | 38 | L42023 | Gamma-proteobacteria | 1C |
| Helicobacter pylori | 26695 | 1.66 | 50 | AE000511 | Epsilon-proteobacteria | 1C |
| Mycobacterium tuberculosis | 1773 | 4.41 | 65 | AL123456 | Firmicutes | 1C |
| Mycoplasma genitalium | G37 | 0.58 | 32 | L43967 | Firmicutes | 1C |
| Mycoplasma pneumoniae | M129 | 0.81 | 40 | U00089 | Firmicutes | 1C |
| Rickettsia prowazekii | MadridE | 1.11 | 50 | AJ235269 | Alpha-proteobacteria | 1C |
| Synechocystis sp. | PCC6803 | 3.57 | 48 | AB001339 | Cyanobacteria | 1C |
| Thermotoga maritima | TM0001 | 1.86 | 50 | AE000512 | Thermotogales | 1C |
| Sinorhizobium meliloti | 1021 | 6.80 | 62b | (In progress) | Alpha proteobacteria | 3C |
| Treponema pallidum | Nichols | 1.13 | 53 | AE000520 | Spirochaetales | 1C |
aC, circular; L, linear.
bData for chromosome 1.
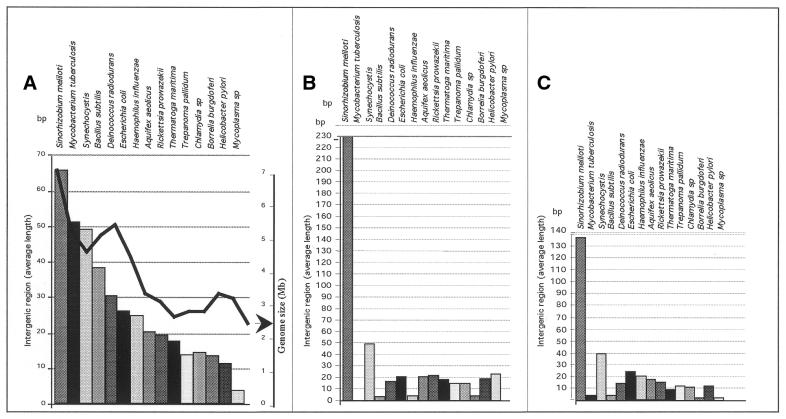
Figure 2.
Comparison of intergenic length. (A) Length of intergenic regions (rectangles) compared with the size of the whole genome (black curve). (B) Intergenic size between rpsM and rpsK. (C) Intergenic size between rplR and rpsE.
Orthologous genes
As the classification and annotation data available in the 16 organisms are comparable, orthologous ribosomal genes (r-protein genes) were easily defined. In addition to r-protein genes, this 300 kb region contains genes encoding non-ribosomal proteins, in particular genes for elongation factors tuf and fus and subunits of RNA polymerase (rpoBC). All the orthologous genes mentioned above are found associated in clusters in other eubacterial genomes, which favors structural organization comparisons at the clustering level.
Sequence alignment
Multiple alignments of protein sequences were performed using CLUSTALW (15) and the BLOSUM-52 matrix. DNA sequences were aligned using CLUSTALX (16). Phylogenetic analyses were determined using PHYLIP v.3.5 software (17). Matrices were used with the neighbor-joining method (18). Bootstrap confidence analysis was performed on 1000 replicates to determine the reliability of the distance tree topologies obtained (17) using SEQBOOT and CONSENSE. Graphical representations of the resulting trees were made using Treeview v.1.5.3. Concerning genetic organization, this work is based on the analysis of certain features that occur in alternative forms, such as presence {1} or absence {0}, colinearity {1} or disruption {0}, etc. In our study, these features are genes or clusters of genes. By asking 20 independent questions examined in random order, we obtained a matrix of 0s and 1s, as shown in Table 2. This matrix was analyzed with SEQBOOT (using the Discrete Morphology parameter) followed by a parsimony study using the MIX program and a consensus tree proposed by CONSENSE.
Table 2. Matrix used for the genetic organization comparison.
| |
RpmJa |
rpsDa |
adka |
Genes between adk and secYa |
alpha and spcb |
rpmDa |
secYa |
rpsJa |
S10 and spcb |
S10 and strb |
str and rpoBCb |
The five clustersb |
The five clustersc |
tufAa |
fusAa |
rpoBCa |
rplJa |
rplLa |
rpsNa |
Into the spc operonb |
| S.meliloti | 0 | 0 | 1 | 0 | 1 | 1 | 1 | 1 | 1 | 1 | 1 | 1 | 1 | 1 | 1 | 1 | 1 | 1 | 1 | 1 |
| Synechocystis | 1 | 0 | 1 | 1 | 1 | 0 | 1 | 0 | 1 | 0 | 0 | 0 | 0 | 1 | 1 | 1 | 1 | 1 | 0 | 1 |
| T.maritima | 1 | 1 | 1 | 1 | 1 | 1 | 1 | 1 | 1 | 1 | 0 | 1 | 0 | 1 | 1 | 1 | 1 | 1 | 1 | 1 |
| D.radiodurans | 1 | 1 | 1 | 1 | 1 | 1 | 1 | 1 | 0 | 1 | 0 | 1 | 0 | 1 | 1 | 1 | 0 | 1 | 1 | 0 |
| C.pneumoniae | 0 | 0 | 0 | 0 | 1 | 0 | 1 | 0 | 1 | 0 | 0 | 0 | 0 | 0 | 0 | 1 | 1 | 1 | 0 | 1 |
| T.pallidum | 1 | 0 | 0 | 0 | 1 | 0 | 1 | 1 | 1 | 0 | 1 | 1 | 0 | 0 | 0 | 0 | 1 | 1 | 1 | 1 |
| B.burgdorferi | 1 | 0 | 0 | 0 | 1 | 1 | 1 | 1 | 1 | 0 | 1 | 1 | 1 | 0 | 0 | 0 | 1 | 1 | 1 | 1 |
| A.aeolicus | 1 | 1 | 1 | 1 | 0 | 1 | 1 | 1 | 0 | 0 | 0 | 1 | 0 | 0 | 0 | 0 | 1 | 1 | 1 | 1 |
| B.subtilis | 1 | 0 | 1 | 1 | 1 | 1 | 1 | 1 | 1 | 1 | 1 | 1 | 1 | 1 | 1 | 1 | 1 | 1 | 1 | 1 |
| Mycoplasma | 1 | 0 | 1 | 1 | 1 | 0 | 1 | 1 | 1 | 0 | 0 | 1 | 0 | 1 | 0 | 1 | 0 | 1 | 1 | 1 |
| R.prowazekii | 0 | 0 | 1 | 0 | 1 | 1 | 1 | 1 | 1 | 0 | 1 | 1 | 0 | 0 | 0 | 1 | 1 | 1 | 1 | 1 |
| H.influenzae | 1 | 1 | 0 | 0 | 1 | 1 | 1 | 1 | 1 | 0 | 0 | 1 | 0 | 0 | 0 | 0 | 1 | 1 | 1 | 1 |
| E.coli | 1 | 1 | 0 | 0 | 1 | 1 | 1 | 1 | 1 | 0 | 0 | 1 | 0 | 0 | 1 | 1 | 1 | 1 | 1 | 1 |
| H.pylori | 1 | 1 | 0 | 1 | 1 | 0 | 1 | 1 | 1 | 0 | 1 | 1 | 1 | 1 | 1 | 1 | 0 | 1 | 1 | 1 |
a1, presence; 0, absence.
b1, colinearity; 0, disruption.
c1, same orientation; 0, different orientation.
Secondary structure determination
Secondary structures were obtained using MFOLD v.2.3 (http://mfold2.wustl.edu/~mfold/rna/form1.cgi).
RESULTS AND DISCUSSION
Ribosomal proteins (r-proteins) in S.meliloti
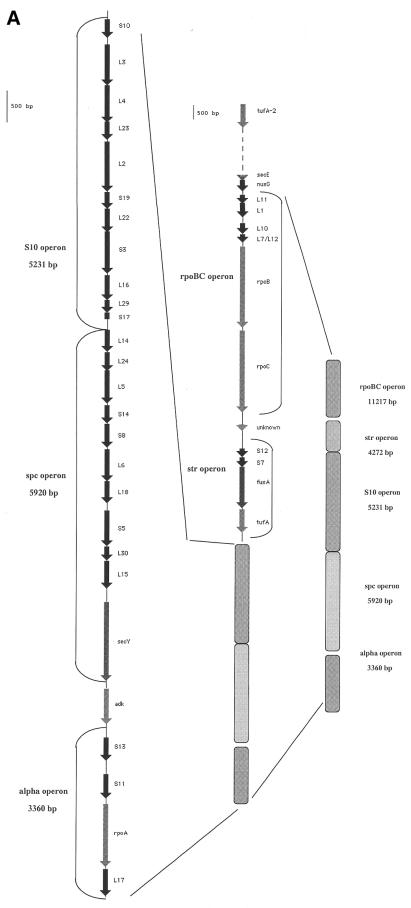
Our study focused on a subgroup of 36 genes (including 30 r-protein genes) clustered in five units called the rpoBC (RNA polymerase β and β′ subunits), str (streptomycin), S10 (r-protein S10), spc (named for the S5 gene for the antibiotic spectinomycin) and alpha (RNA polymerase α subunit) clusters. As indicated in Figure 1A, the five clusters are contiguous in the S.meliloti genome, with short inter-cluster regions (∼100–250 bp) and are all transcribed in the same orientation. Upstream of the rpoBC cluster we found secE and nusG as well as a second copy of tufA (tufA-2). Such a duplication was found in Gram-negative bacteria from three major phyla: purple bacteria, bacteroids and Cyanobacteria, while only a single copy of tuf was found in Gram-positive bacteria, including mycobacteria, mycoplasma and B.subtilis (19).
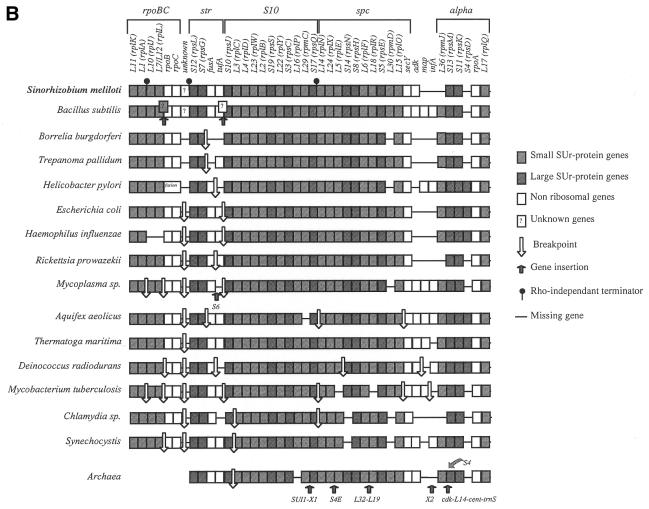
Figure 1.
(A) General organization of five ribosomal clusters on the S.meliloti strain 1021 chromosome. (B) Organization of the gene clusters encoding ribosomal proteins in 16 eubacterial organisms, as compared with the archaeal consensus. Designations and functions of miscellaneous genes are: adk, adenylate kinase; fusA, elongation factor Ef-G; infA, translational initiation factor 1; map, methionine aminopeptidase; rpoA, rpoB and rpoC, RNA polymerases α, β and β′; tufA, translational elongation factor Tu.
Ribosomal protein cluster arrangement in eubacteria
As shown in Figure 1B, by first comparing the 16 eubacteria and the consensus archaea r-protein cluster organization we established a major distinction between the overall complement of genes in these two phyla. In fact, in all archaeal r-protein clusters the str operon contains gene S10, while being located elsewhere on the chromosome. A comparable association between S10 and cluster str is encountered in Synechocystis and Chlamydia. This association in cyanobacteria is interesting as these organisms are considered as ancestors of chloroplasts and this type of bipartition of r-protein clusters has also been retained in Chlorophyta, Euglenophyta and Glaucocystophyta, but not in Metaphyta (land plant), chloroplasts (20). Another particular of archaeal ribosomal clusters is the presence of 10 supernumerary genes. These encode proteins of unknown function (X1, X2) as well as unrelated genes (SU1, a homolog of protein translation factor; cdk, cytidylate kinase; cent, centromere-binding protein; trnS, tRNASer) and other r-protein genes (encoding proteins S4e, L32, L19 and L14). Finally, the position of rpsD is different in the alpha operon, in which the gene lies between rpsM and rpsK in archaea and between rpsK and rpoA in eubacteria (as indicated in Fig. 1B).
As for eubacterial genomes, the overall gene order is remarkably maintained in each species, except for several ribosomal or non-ribosomal genes that are missing in some organisms. The second important finding was that S.meliloti is the only organism, with B.subtilis, that displays an uninterrupted sequence for the five clusters. In all the other 14 bacteria, the presence of unrelated coding regions between the clustered ribosomal genes pointed to several breakpoints. For example, in E.coli, the breakpoint between rpoC and rpsL (Fig. 1B) coincides with insertion of >650 unrelated genes between them, now separated by ∼715 genes. These results are interesting because evolutionary events usually consist of DNA rearrangements manifested by gene loss and fusion/fission processes.
Differences between S.meliloti and B.subtilis cluster organization exclusively result from gene insertion (two genes in S meliloti) or deletion (two genes in S.meliloti). For instance, in the region upstream of rpoBC, the gene pattern in B.subtilis differed from that of S.meliloti by the presence of an open reading frame (orf23), apparently encoding a 23 kDa protein essential in B.subtilis (21). In addition, S.meliloti does not include map and infA downstream of adk and these two genes are located elsewhere in the genome. Furthermore, both B.subtilis and S.meliloti lack a S4 gene (rpsD) in the alpha operon, in contrast to the majority of the eubacterial genomes (Fig. 1B). In all these, rpsD is found as a single unit at another location on the chromosome. Finally, gene rpmJ, encoding the smallest protein of the large subunit of the ribosome (called L36), is distant from the alpha cluster in S.meliloti, Rickettsia prowazekii and Chlamydia.
To evaluate the importance of the breaks between the clusters in proteobacteria, we calculated the distance between str and S10 and between rpoBC and str. Stretches of 250 and 25 kb (for str and S10, respectively) and 70 and 700 kb (for rpoBC and str) were found in Haemophilus influenzae and E.coli.
In view of the mean density of ORFs in prokaryotes (one gene per kb), all long breaks involve many gene integration events between the ribosomal clusters and can probably be best interpreted in terms of gene pattern and regulation processes. Remarkably, both S.meliloti and B.subtilis have their clustered r-protein genes on one strand, all being transcribed in the same orientation.
Intergenic region
Differences in intergenic region length suggest different regulatory mechanisms for protein expression within these operons in the various organisms studied. To investigate this hypothesis further, we decided to inspect and compare the intergenic distance between the stop codon and the following start codon in contiguous genes in the S10, spc and alpha clusters.
A first analysis (Fig. 2A) showed that the intergenic (Ig) average length for each organism is roughly related to genome size. A comparison between the 16 eubacteria indicates that S.meliloti displays the longest Ig sequence length, with a median value of ∼65 bp, this value correlating well with genome size (6.8 Mb). Conversely, it can be seen that Mycoplasma includes remarkably small intergenic regions, with an average of ∼5 bp.
On the whole, the size of the Ig regions does not vary from gene to gene in individual organisms. Instances of important variability occur at the end of the single operon or at positions where comparing these organisms suggested gene insertion/deletion events had taken place (secY and S11 for example; data not shown). Regarding S.meliloti, two exceptions to this rule were detected, concerning the Ig distance between genes S13 and S11 (∼230 bp; Fig. 2B) and between genes L18 and L5 (138 bp; Fig. 2C). The long distance between genes encoding S13 and S11, in conjunction with the absence of rpsD, a protein that regulates the S13, S11 and probably L17 genes (but not rpoA) in E.coli, suggests a new regulation process for the alpha operon in S.meliloti. However, as previously demonstrated by Post et al., sequence similarity in promoters of r-protein clusters is not sufficiently reliable to determine new promoter sites in silico (22). For this reason, in vitro analyses such as primer extension, northern analysis and in vitro transcription reactions are necessary.
Comparison of the S10 leader region and regulatory features
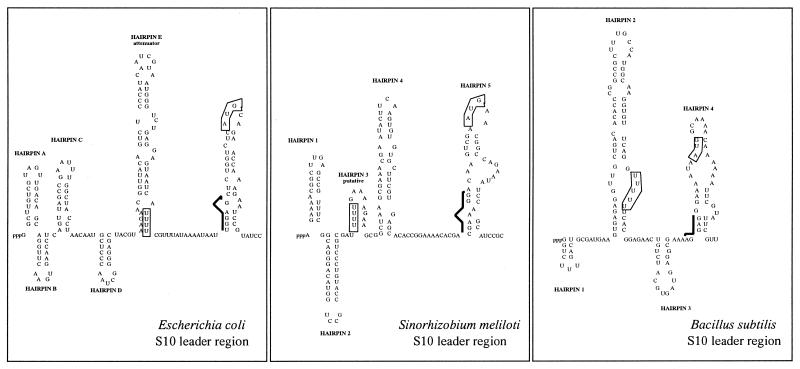
The S10 ribosomal protein operon of E.coli is transcriptionally and translationally regulated by protein L4, one of its structural gene products. The secondary structure of the S10 leader consists of six hairpins (HA–HF, Fig. 3A). The HE hairpin has been shown to bind the L4-mediated transcription termination site, essential for both transcription and translation control, while the HD hairpin is also involved in this regulation (23,24). As shown in Figure 3C, this secondary structure is absent in B.subtilis, in which the S10 cluster is regulated by a mechanism different from L4-mediated control (25).
Figure 3.
Comparison of S10 leader structures of E.coli, B.subtilis and S.meliloti. The structures of the E.coli and B.subtilis S10 leader regions have been previously described (23–25). That of the S meliloti leader was obtained using MFOLD v.2.3 (http://mfold2.wustl.edu/∼mfold/rna/form1.cgi). Putative Shine–Dalgarno sequences are indicated by a black line.
In order to determine whether the leader region (intergenic space between tufA and rpsJ) of the S.meliloti S10 cluster corresponds to the E.coli or B.subtilis 2D structures, we examined this DNA sequence using the program MFOLD. This study indicated that the S10 leader region of S.meliloti is able to form five hairpins (Fig. 3B). The first three hairpins show some similarity with E. coli HA, HB and HC, but no HE or HD-like structures were detectable. In comparison, no clear similarity with the B.subtilis S10 leader region was observed. Consequently, the existence of an L4-mediated regulatory mechanism in S.meliloti cannot be excluded, although the structure of its S10 leader region is sufficiently unlike that of E.coli and B.subtilis to suggest a novel regulatory process for these five gene clusters.
Furthermore, another important feature of this 300 kb S.meliloti region is the occurrence of three Rho-independent terminators (Fig. 1B): (i) downstream of rplK-rplA, which could indicate that the rpoBC cluster is not an operon; (ii) downstream of rpoC; and (iii) downstream of rpsQ, the last gene of the S10 cluster. All these elements should help define a new regulation process in S.meliloti ribosomal clusters.
Phylogeny inferences
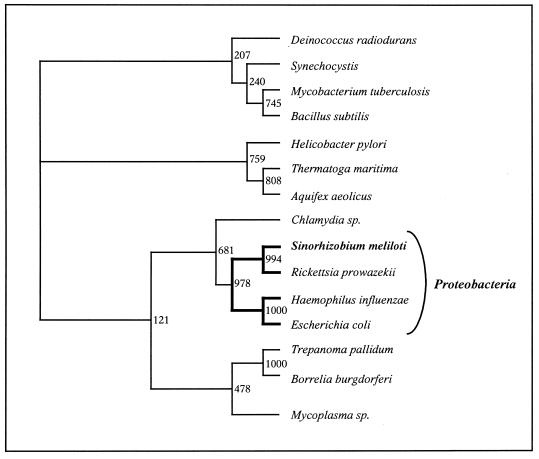
Figures 4–6 provide phylogenetic tree comparisons for these organisms within the five gene clusters based upon multiple sequence alignments of amino acid and nucleic acid sequences as well as gene order analysis. The dendrograms obtained with the three sets of data (amino acid/nucleic acid content and gene organization) are different. The tree resulting from amino acid sequence alignment reflects the current phylogeny, based on 16S rRNA (Fig. 4). Although some minor exceptions can be observed, such as B.subtilis, which is in a distinct phylum relative to other low G+C Gram-positive bacteria (Borrelia burgdoferi and Mycoplasma sp.), all Proteobacteria, including S.meliloti, are clustered in the same monophylitic branch, with a node-support bootstrap value of 68.1%. Such data match the percentage obtained by Snel et al. in their phylogenetic study (26).
Figure 4.
Genome phylogeny based on amino acid sequences of ribosomal proteins encoded by the alpha cluster. The tree was made from a genome distance matrix using the neighbor-joining method (18). Distances are expressed as substitutions per site. Similar results were obtained for the spc, str and S10 clusters (data not shown). Bootstrap value = 1000.
Figure 6.
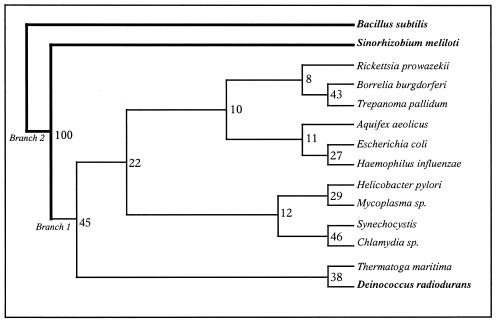
Genome tree based on the discrete morphology (parsimony) method using the programs SEQBOOT, MIX and CONSENSE of the PHYLIP package. Boostrap value = 100.
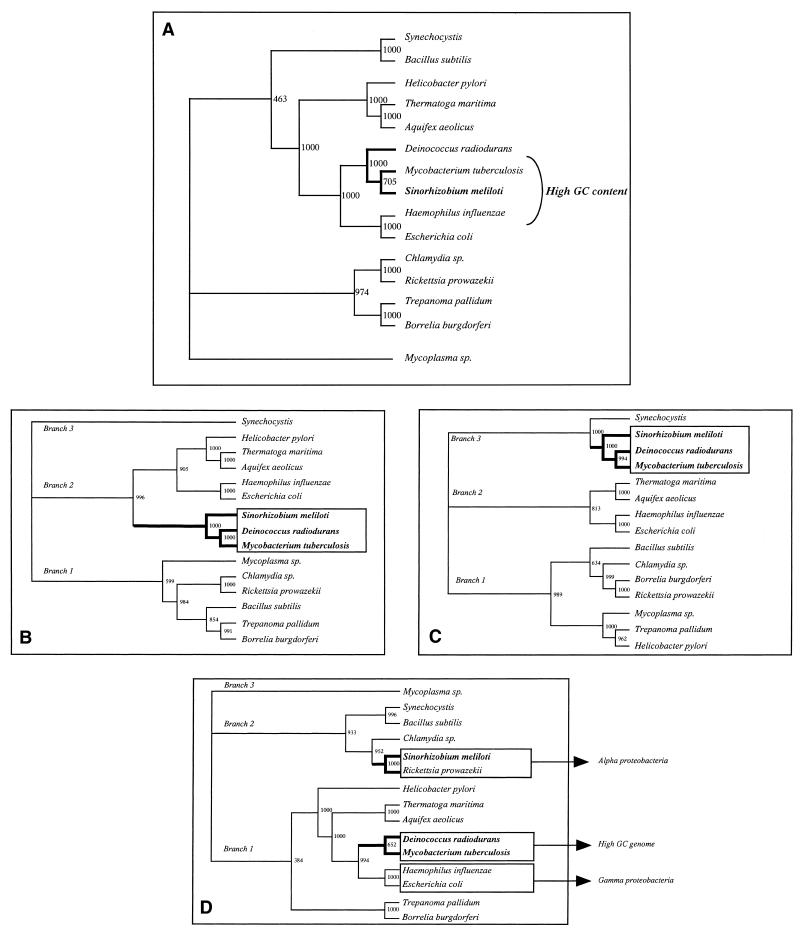
In contrast, trees designed using r-protein gene nucleic acid sequences (Fig. 5A) show a group composed of S.meliloti, Mycoplasma pneumoniae and Deinococcus radiodurans. We hypothesize that a base composition bias accounts for this apparent phylum, since all three bacteria possess a G+C content >60%.
Figure 5.
(A) Genome phylogeny based on nucleic acid sequences of genes encoding the ribosomal proteins of the alpha cluster. The tree was made from a genome distance matrix using the neighbor-joining method (18). Distances are expressed as substitutions per site. Similar results were obtained for the spc, str and S10 clusters (data not shown). Bootstrap value = 1000. (B) Tree after exclusion of the first base of the codon. (C) Tree after exclusion of the second base of the codon. (D) Tree after exclusion of the third base of the codon.
To compute the influence of base composition, we investigated how the third, second and first codon positions of genes in the alpha cluster affect phylogenetic analyses. For this, we eliminated the first, second or third base of each eubacterial genome sequence and performed the comparison again. As shown in Figure 5B–D, corrections for compositional and positional base bias do not completely dismiss monophyly of S.meliloti, Mycobacterium tuberculosis and D.radiodurans. In the case of first or second base exclusion, all three organisms still stand together in the same phylum (Fig. 5B and C). In contrast, and as expected, in the case of third base elimination S.meliloti joins R.prowazekii to create an α-proteobacteria branch while M.tuberculosis and D.radiodurans remain in the same phylum (Fig. 5D). As demonstrated by Majumdar et al. (27), in high GC genomes GC content at the first and second codon positions is lower than at the third codon position. As indicated in Table 3, this is clearly the case with S.meliloti, as after removal of the first base the GC composition is 59.77%, of the second 69.71% and of the third 52.82%. Similar variations were observed in the other high GC content organisms (M.tuberculosis and D.radiodurans) but also in Synechocystis, Trepanoma pallidum, Aquifex aeolicus, Thermatoga maritima and Mycoplasma sp, which are not high GC genomes (Table 3). Nevertheless, removing the third codon is not sufficient to correlate all phylogenetic analyses based on protein sequence and on the corresponding DNA sequence. Actually, even without the third base, the α-proteobacteria (S.meliloti and R.prowazekii) phylum and the γ-proteobacteria branch (E.coli and H.influenzae) are remote. As we are not able to measure the biological significance of the variation in G+C content throughout the bacterial genome, it remains difficult to draw conclusions concerning the lack of congruence between the different trees. As a consequence, we propose completing this investigation by examining the correlation between r-protein gene arrangement in all the genomes investigated, using a matrix of questions and the discrete morphology method as described before. The resulting tree (Fig. 6) is in keeping with the general order given in Figure 1B, particularly the close relationship between B.subtilis and S.meliloti.
Table 3. Influence of base position and %GC.
| |
%GC |
%GC without
1st base |
%GC without
2nd base |
%GC without
3rd base |
| M.tuberculosis | 64.12 | ↓62.36 | ↑73.11 | ↓56.84 |
| D.radiodurans | 63.93 | ↓63.53 | ↑73.82 | ↓54.37 |
| S.meliloti | 60.75 | ↓59.77 | ↑69.71 | ↓52.82 |
| Synechocystis | 52.81 | ↓49.21 | ↑57.44 | ↓51.85 |
| E.coli | 51.82 | ↓46.19 | ↓43.41 | ↑52.73 |
| T.pallidum | 49.62 | ↓46.7 | ↑53.74 | ↓48.49 |
| A.aeolicus | 44.98 | ↓42.49 | ↑48.59 | ↓43.79 |
| T.maritima | 44.7 | ↓42.23 | ↑48.54 | ↓43.38 |
| Mycoplasma | 43.49 | ↓41.46 | ↑47.11 | ↓41.85 |
| H.pylori | 43.03 | ↓42.18 | ↓41.28 | ↑45.56 |
| B.subtilis | 42.67 | ↓35.21 | ↑43.51 | ↑49.24 |
| C.pneumoniae | 40.85 | ↓36.06 | ↑41.73 | ↑44.85 |
| H.influenzae | 40.71 | ↓34.14 | ↓39.4 | ↑48.56 |
| R.prowazekii | 31.51 | ↓26.2 | ↓29.73 | ↑38.56 |
| B.burgdorferi | 31.34 | ↓27.93 | ↓28.97 | ↑37.09 |
↓, GC content decrease; ↑, GC content increase.
Implications for systematics
Because the congruence between different markers usually considered as the most reliable criterion to access evolutionary history is not manifest in this r-protein cluster study, a faithful phylogenic reconstruction between S.meliloti and the other eubacteria remains difficult. We can presume that new projects for bacterial whole-genome sequencing will provide novel information, a prerequisite to consolidate both classification and phylogeny within eubacteria.
As the Gram-negative and Gram-positive branches were expected to have diverged, the close similarity detected between S.meliloti and B.subtilis ribosomal cluster organization found in this study came as a surprise. The degree of instability of operon structures was proposed to be due to the degree of divergence between the genomes compared and the degree of instability depends on evolutionary lineage (28). In this paper we propose that the correspondence between S.meliloti and B.subtilis organization mainly results from a similar low frequency of effective recombination and/or a similar weak occurrence of lateral gene transfer. In this case, the various trees presented in this paper are not contradictory but rather complementary. In fact, the two bacteria belong to their respective phylum, as indicated by the amino acid based-tree, but are each the less ‘altered’ member of their particular branch and thus are closer to the bacterial common ancestor. In fact, Wächtershauser (14) suggested that in the ancestor of all bacteria the ribosomal gene cluster contained at least the genes rpsL, rpsG, fusA, tufA and rpsJ. We have now found in this study that these genes are clustered in B.subtilis and S.meliloti. For this reason, we suggest a scenario according to which bacteria with efficient genome plasticity would lose this ancestral cluster and rearrange the genes into new clusters, whereas bacteria with less plasticity have maintained the ancestral organization.
Implications for functional processes
Danchin and co-workers (29) suggest a significant correlation between the distribution of genes along the chromosome and the physical or functional architecture of the cell. Such relationships must derive from a selection pressure shared by several organisms. We propose that as gene clusters are frequent in bacterial genomes, natural selection tends to prevent their separation. Thus, the occurrence of any rearrangement has to be evolutionarily beneficial to be conserved. In other words, a common selection pressure results in an identical evolutionary response in different organisms sharing the same biotope. This may have been the case for S.meliloti and B.subtilis. While these two organisms have different ways of life, both are commonly found in soil and in the neighborhood of plants. Actually, even if B.subtilis is mainly detected in the phylloplane (30), this organism is sometimes found in soil surrounding plant roots and its genome shows many interesting genes involved in the metabolism of plant-derived carbon compounds, such as opines and starch (31). The whole-genome sequences of B.subtilis and S.meliloti also reveal certain functional homologies, such as the presence of a quorum-sensing apparatus and numerous ABC transporters (31,32). These two bacteria also have specific cellular processes, such as differentiation (sporulation in B.subtilis, bacteroid formation in S.meliloti). It may also be pointed out that the only bacterium capable of plant symbiosis is another Gram-positive bacterium, Frankia. Both Frankia and Rhizobia were shown to produce phytohormones and nitrogenase (33).
This correlation between gene order and functional processes can be assumed to be due to genes encoding related functions being physically close to one another. However, in the case of ribosomal protein operons, previous work tends to prove that the order of genes in the ribosomal operon may not be important for their assembly and function but rather that possible rearrangements have been deleterious for their expression (28). Considering the correlation between the physical interactions of ribosomal proteins and their gene order, we observed two situations: co-occurrence of genes that encode interacting proteins (such as the operon rpsG–rspL, corresponding to proteins S7 and S12 that interact at the interface of the large subunit) or absence of physical proximity (for instance, tufA, encoding protein TufA that physically interacts with the large ribosomal proteins L6, L11 and L22, has never been found near the corresponding genes rplF, rplK and rplV, respectively). In conclusion, we hypothesize that ribosomal gene order conservation may not mainly be due to physical interaction with gene products but rather to a capacity of bacteria to evolve from an ancestral cluster into a viable reconstruction of this ‘ribosomal island’. Bacillus subtilis and S.meliloti seem to have the most stable genomes and therefore have retained the ancestral genome island.
Acknowledgments
ACKNOWLEDGEMENTS
We thank Stéphane Dreano, Edouard Cadieu, Stéphanie Mottier and Stéphanie Gloux (UMR6061-CNRS, Rennes, France) for realization of the DNA sequencing. We are also grateful to Patricia Thébault and Jérôme Gouzy (UMR215 INRA-CNRS, Castanet-Tolosan, France) for computer assistance. Special thanks are due to Pascale Quignon (UMR6061 CNRS, Rennes, France) for assistance in computer programming and to Jean-Claude Chuat for manuscript corrections and for helpful discussions.
References
- 1.Roche P., Maillet,F., Plazanet,C., Debelle,F., Ferro,M., Truchet,G., Prome,J.C. and Denarie,J. (1996) The common nodABC genes of Rhizobium meliloti are host-range determinants. Proc. Natl Acad. Sci. USA, 24, 15305–15310. [DOI] [PMC free article] [PubMed] [Google Scholar]
- 2.Schultze M. and Kondorosi,A. (1998) Regulation of symbiotic root nodule development. Annu. Rev. Genet., 32, 33–57. [DOI] [PubMed] [Google Scholar]
- 3.Galibert F., Barloy-Hubler,F., Capela,D. and Gouzy,J. (2000) Sequencing the Sinorhizobium meliloti genome. DNA Seq., 11, 207–210. [DOI] [PubMed] [Google Scholar]
- 4.Sobral B.W., Honeycutt,R.J., Atherly,A.G. and McClelland,M. (1991) Electrophoretic separation of the three Rhizobium meliloti replicons. J. Bacteriol ., 173, 5173–5180. [DOI] [PMC free article] [PubMed] [Google Scholar]
- 5.Linn T. and Scaife,T. (1978) Identification of a single promoter in E. coli for rplJ, rplL and rpoBC. Nature, 2, 33–37. [DOI] [PubMed] [Google Scholar]
- 6.Ianniciello G., Gallo,M., Arcari,P. and Bocchini,V. (1994) Organization of a Sulfolobus solfataricus gene cluster homologous to the Escherichia coli str operon. Biochem. Mol. Biol. Int., 33, 927–937. [PubMed] [Google Scholar]
- 7.Arndt E. (1990) Nucleotide sequence of four genes encoding ribosomal proteins from the ‘S10 and spectinomycin’ operon equivalent region in the archaebacterium Halobacterium marismortui. FEBS Lett., 16, 193–198. [DOI] [PubMed] [Google Scholar]
- 8.Lindahl L. and Zengel,J.M. (1986) Ribosomal genes in Escherichia coli. Annu. Rev. Genet., 20, 297–326. [DOI] [PubMed] [Google Scholar]
- 9.Frank J. (2000) The ribosome—a macromolecular machine par excellence. Chem. Biol., 7, R133–R141. [DOI] [PubMed] [Google Scholar]
- 10.Fitch W.M. and Bruschi,M. (1987) The evolution of prokaryotic ferredoxins with a general method correcting for unobserved substitutions in less branched lineages. Mol. Biol. Evol., 4, 381–394. [DOI] [PubMed] [Google Scholar]
- 11.Schutz M., Brugna,M., Lebrun,E., Baymann,F., Huber,R., Stetter,K.O., Hauska,G., Toci,R., Lemesle-Meunier,D., Tron,P., Schmidt,C. and Nitschke,W. (2000) Early evolution of cytochrome bc complexes. J. Mol. Biol., 21, 663–675. [DOI] [PubMed] [Google Scholar]
- 12.Olsen G.J. and Woese,C.R. (1993) Ribosomal RNA: a key to phylogeny. FASEB J., 7, 113–123. [DOI] [PubMed] [Google Scholar]
- 13.Meade H.M., Long,S.R., Ruvkun,G.B., Brown,S.E. and Ausubel,F.M. (1982) Physical and genetic characterization of symbiotic and auxotrophic mutants of Rhizobium meliloti induced by transposon Tn5 mutagenesis. J. Bacteriol ., 149, 114–122. [DOI] [PMC free article] [PubMed] [Google Scholar]
- 14.Wächtershauser W. (1998) Towards a reconstruction of ancestral genomes by gene cluster alignement. Syst. Appl. Microbiol., 21, 473–477. [Google Scholar]
- 15.Thompson J.D., Higgins,D.G. and Gibson,T.J. (1994) CLUSTAL W: improving the sensitivity of progressive multiple sequence alignment through sequence weighting, position-specific gap penalties and weight matrix choice. Nucleic Acids Res., 11, 4673–4680. [DOI] [PMC free article] [PubMed] [Google Scholar]
- 16.Thompson J.D., Gibson,T.J., Plewniak,F., Jeanmougin,F. and Higgins,D.G. (1997) The CLUSTAL_X windows interface: flexible strategies for multiple sequence alignment aided by quality analysis tools. Nucleic Acids Res., 15, 4876–4882. [DOI] [PMC free article] [PubMed] [Google Scholar]
- 17.Felsenstein J. (1999) Phylip Version 3.5. University of Washington, Seattle, WA.
- 18.Saitou N. and Nei,M. (1987) The neighbor-joining method: a new method for reconstructing phylogenetic trees. Mol. Biol. Evol., 4, 406–425. [DOI] [PubMed] [Google Scholar]
- 19.Sela S., Yogev,D., Razin,S. and Bercovier,H. (1989) Duplication of the tuf gene: a new insight into the phylogeny of eubacteria. J. Bacteriol ., 171, 581–584. [DOI] [PMC free article] [PubMed] [Google Scholar]
- 20.Stoebe B. and Kowallik,K.V. (1999) Gene-cluster analysis in chloroplast genomics. Trends Genet., 15, 344–347. [DOI] [PubMed] [Google Scholar]
- 21.Boor K.J., Duncan,M.L. and Price,C.W. (1995) Genetic and transcriptional organization of the region encoding the beta subunit of Bacillus subtilis RNA polymerase. J. Biol. Chem., 1, 20329–20336. [DOI] [PubMed] [Google Scholar]
- 22.Post L.E., Arfsten,A.E., Davis,G.R and Nomura,M. (1980) DNA sequence of the promoter region for the alpha ribosomal protein operon in Escherichia coli. J. Biol. Chem., 25, 4653–4659. [PubMed] [Google Scholar]
- 23.Sha Y., Lindahl,L. and Zengel,J.R. (1995) RNA determinants required for L4-mediated attenuation control of the S10 r-protein operon of Escherichia coli. J. Mol. Biol., 245, 486–498. [DOI] [PubMed] [Google Scholar]
- 24.Zengel J.M. and Lindahl,L. (1996) A hairpin structure upstream of the terminator hairpin required for ribosomal protein L4-mediated attenuation control of the S10 operon of Escherichia coli. J. Bacteriol ., 178, 2383–2387. [DOI] [PMC free article] [PubMed] [Google Scholar]
- 25.Li X., Lindahl,L., Sha,Y. and Zengel,J.M. (1997) Analysis of the Bacillus subtilis S10 ribosomal protein gene cluster identifies two promoters that may be responsible for transcription of the entire 15-kilobase S10-spc-alpha cluster. J. Bacteriol ., 179, 7046–7054. [DOI] [PMC free article] [PubMed] [Google Scholar]
- 26.Snel B., Bork,P. and Huynen,M.A. (1999) Genome phylogeny based on gene content. Nature Genet., 21, 108–110. [DOI] [PubMed] [Google Scholar]
- 27.Majumdar S.S., Gupta,K., Sundararajan,V.S. and Ghosh,T.C. (1999) Compositional correlation studies among the three different codon positions in 12 bacterial genomes. Biochem. Biophys. Res. Commun., 9, 66–71. [DOI] [PubMed] [Google Scholar]
- 28.Itoh T., Takemoto,K., Mori,H. and Gojobori,T. (1999) Evolutionary instability of operon structures disclosed by sequence comparisons of complete microbial genomes. Mol. Biol. Evol., 16, 332–346. [DOI] [PubMed] [Google Scholar]
- 29.Rocha E.P., Guerdoux-Jamet,P., Moszer,I., Viari,A. and Danchin,A. (2000) Implication of gene distribution in the bacterial chromosome for the bacterial cell factory. J. Biotechnol., 31, 209–219. [DOI] [PubMed] [Google Scholar]
- 30.Arias R.S., Sagardoy,M.A. and van Vuurde,J.W. (1999) Spatio-temporal distribution of naturally occurring Bacillus spp. and other bacteria on the phylloplane of soybean under field conditions. J. Basic Microbiol., 39, 283–292. [DOI] [PubMed] [Google Scholar]
- 31.Kunst F., Ogasawara,N., Moszer,I., Albertini,A.M., Alloni,G., Azevedo,V., Bertero,M.G., Bessieres,P., Bolotin,A., Borchert,S., Borriss,R., Boursier,L., Brans,A., Braun,M., Brignell,S.C., Bron,S., Brouillet,S., Bruschi,C.V., Caldwell,B., Capuano,V., Carter,N.M., Choi,S.K., Codani,J.J., Connerton,I.F., Danchin,A. et al. (1997) The complete genome sequence of the gram-positive bacterium Bacillus subtilis. Nature, 20, 249–256. [DOI] [PubMed] [Google Scholar]
- 32.Barloy-Hubler F., Capela,D., Batut,J. and Galibert,F. (2000) High-resolution physical map of the pSymb megaplasmid and comparison of the three replicons of Sinorhizobium meliloti strain 1021. Curr Microbiol., 41, 109–113. [DOI] [PubMed] [Google Scholar]
- 33.Preston G.M., Haubold,B. and Rainey,P.B. (1998) Bacterial genomics and adaptation to life on plants: implications for the evolution of pathogenicity and symbiosis. Curr. Opin. Microbiol., 1, 589–597. [DOI] [PubMed] [Google Scholar]


