

Abstract
Heterochromatic DNA domains play important roles in regulation of gene expression and maintenance of genome stability by silencing repetitive DNA elements and transposons. From fission yeast to mammals, heterochromatin assembly at DNA repeats involves the activity of small noncoding RNAs (sRNAs) associated with the RNA interference (RNAi) pathway1–9. Typically, sRNAs, originating from long noncoding RNAs, guide Argonaute-containing effector complexes to complementary nascent RNAs to initiate histone H3 lysine 9 di- and tri-methylation (H3K9me2 and H3K9me3, respectively) and heterochromatin formation10–17. H3K9me is in turn required for recruitment of RNAi to chromatin to promote sRNA amplification11,15,18. Yet, how heterochromatin formation, which silences transcription, can proceed by a co-transcriptional mechanism that also promotes sRNA generation remains paradoxical. Here, using Clr4, the fission yeast S. pombe homolog of mammalian SUV39H H3K9 methyltransferases, we designed active site mutations that block H3K9me3, but allow H3K9me2 catalysis. We show that H3K9me2 defines a functionally distinct heterochromatin state that is sufficient for RNAi-dependent co-transcriptional gene silencing (CTGS) at pericentromeric DNA repeats. Unlike H3K9me3 domains, which are transcriptionally silent, H3K9me2 domains are transcriptionally active, contain modifications associated with euchromatic transcription, and couple RNAi-mediated transcript degradation to the establishment of H3K9me domains. The two H3K9me states recruit reader proteins with different efficiencies, explaining their different downstream silencing functions. Furthermore, transition from H3K9me2 to H3K9me3 is required for RNAi-independent epigenetic inheritance of H3K9me domains. Our findings demonstrate that H3K9me2 and H3K9me3 define functionally distinct chromatin states and uncover a mechanism for formation of transcriptionally permissive heterochromatin that is compatible with its broadly conserved role in sRNA-mediated genome defense.
To determine whether the different methylation states of H3K9 make distinct contributions to heterochromatin formation, we designed mutations in the active site of Clr4 that inhibit H3K9me3 catalysis. SET domain methyltransferases contain a “switch position” that governs the degree of methylation (Fig. 1a, highlighted green)19. Phenylalanine (F) in the switch position, such as in the N. crassa DIM-5 and mammalian SUV39H1/2, allows the catalysis of di- and tri-methylated lysine, while tyrosine (Y), predominantly allows lysine mono- and di-methylation, such as in the A. thaliana SUVH4/KYP (Fig. 1a)19. At the switch position, the Clr4 SET domain contains phenylalanine (F449), equivalent to F294 in DIM-5 and F363 in SUV39H1 (Fig. 1a, b; highlighted green). Moreover, the amino acid at the position equivalent to the S. pombe I418 was previously proposed to affect methylation states, with bulkier residues such as proline in G9a correlating with di-methylation (Fig. 1a, b; highlighted blue)19,20.
Figure 1. Clr4 SET domain mutations that block H3K9me3 result in defective TGS.

a, Diagram illustrating location of the Clr4 chromo (CD) and SET domains, and the mutations used in this study (top). Sequence alignment for the SET domain region containing these mutations in the indicated methyltransferases (bottom). b, Crystal structure of N. crassa DIM-5 catalytic pocket in complex with a histone H3 N-terminal peptide (yellow), showing side chain of lysine 9 in the catalytic pocket. DIM-5 F294 (corresponding to S. pombe F449) is depicted in green; DIM-5 I263 (corresponding to S. pombe I418) is depicted in blue (PDB ID: 1PEG)29. c, H3K9me2 ChIP-seq reads mapped to the pericentromeric repeat regions on the right arm of chromosome 1 in clr4Δ, clr4+, clr4F449Y, and clr4I418P cells. Location of centromere 1 (cen1), innermost repeats (imr1R), outermost dg and dh repeats, and inverted repeat centromere (IRC) sequences are indicated. Top: Chromosome 1 coordinates. Right: sum of normalized reads mapping to chromosome 1 pericentromeric regions. Reads were randomly assigned to the dg and dh repeats of each chromosome and are presented as reads per million (rpm, Y axis). d, Same as c but showing H3K9me3 ChIP-seq reads. e, Left: otr1R::ura4+ transgene silencing assay (see Extended Data Fig. 4a for insert location). N/S, non-selective medium; - Ura, minus uracil medium; + FOA, 5-FOA-containing medium. Image represents 3 individual experiments. Right: RT-qPCR analysis of otr1R::ura4+ transcript. Error bars, s.d.; n = 3 biological replicates. f, Same as c, but showing pol II ChIP-seq reads. Arrowheads indicate primer locations for ChIP-qPCR analysis (see Extended Data Fig. 4). g, RT-qPCR analysis of dg and dh transcripts. Values are shown as fold increase in RNA levels in mutant over clr4+ cells. Error bars, s.d.; n = 3 biological replicates.
We constructed strains expressing endogenous Clr4 protein with substitution of F449 to Y (clr4F449Y) or I418 to P (clr4I418P)(Extended Data Fig. 1a). Clr4F449Y was incorporated into the CLRC methyltransferase complex and interacted with Swi6 with similar efficiency as wild-type Clr4 (Extended Data Fig. 1b, c). Immunoblotting and quantitative mass spectrometry (MS) of an enriched histone fraction showed that H3K9me3 levels were dramatically decreased in clr4F449Y cells, while H3K9me2 levels were increased (Extended Data Fig. 1d, e). Furthermore, chromatin immunoprecipitation followed by high throughput sequencing (ChIP-seq) or quantitative PCR (ChIP-qPCR) showed that while pericentromeric H3K9me2 levels were increased in clr4 mutants relative to clr4+ cells (Fig. 1c; Extended Data Fig. 2a, b), H3K9me3 was lost in clr4F449Y cells and reduced in clr4I418P cells (Fig. 1d; Extended Data Fig. 2c). The increase in H3K9me2 levels in the clr4 mutants is likely due to available H3K9me2 that would otherwise be tri-methylated in clr4+ cells. Moreover, the close correspondence between H3K9me2 peaks in clr4+ and clr4F449Y cells indicated that H3K9me3 was not required for the formation of extended H3K9me domains at pericentromeric DNA repeats (Fig. 1c, d; Extended Data Fig. 2d, e). Both H3K9me2 and me3 reads mapping specifically to unique sequences at the silent mating-type locus and telomeric DNA regions were drastically reduced (Extended Data Fig. 3a–g), supporting previous findings suggesting that H3K9me3 is required for RNAi-independent spreading of heterochromatin away from nucleation sites at these regions21. We have therefore generated two clr4 mutant alleles that affect H3K9me3 to different extents, providing us with tools to determine the role of histone H3K9me states in heterochromatin function.
We next examined the effects of H3K9me states on gene silencing using a ura4+ reporter inserted at the pericentromeric outer repeats of chromosome 1 (otr1R::ura4+, Extended Data Fig. 4a). Silencing of otr1R::ura4+ was monitored by growing cells on medium lacking uracil (− Ura) or containing 5-fluoroorotic acid (+ FOA), which is toxic to cells expressing ura4+, and quantitative RT-PCR (RT-qPCR). Similar to clr4Δ cells, clr4F449Y cells displayed increased growth on − Ura plates and grew poorly on + FOA plates (Fig. 1e, left) indicating a loss of otr1R::ura4+ silencing. clr4I418P had a milder silencing defect, consistent with partial loss of H3K9me3 in this mutant (Fig. 1d, e). In agreement with the growth silencing assay, otr1R::ura4+ transcripts were derepressed in clr4F449Y and to a lesser extent in clr4I418P cells (Fig. 1e, right). Furthermore, we observed increased RNA polymerase II (pol II) occupancy at the endogenous pericentromeric dg and dh repeats, with clr4F449Y cells having similar levels of pol II occupancy to that of clr4Δ cells (Fig. 1f; Extended Data Fig. 4b). Surprisingly, despite the observed loss of transcriptional gene silencing (TGS) in clr4F449Y cells, dg and dh transcript levels were 10- to 15-fold lower in clr4F449Y cells than in clr4Δ cells (Fig. 1g). Together with the absence of detectable H3K9me3 in clr4F449Y cells (Fig. 1d), this result suggests that H3K9me2 may be sufficient for promoting RNAi-CTGS of the dg and dh transcripts.
Consistent with functional RNAi-CTGS (Fig. 2a) in both clr4F449Y and clr4I418P cells, dg siRNA levels were similar or higher than in clr4+ cells and dh siRNA levels were only reduced by about 2-fold, in contrast to clr4Δ cells, which contain trace amounts of dg/dh siRNAs (Fig. 2b)11,12. Furthermore, the pericentromeric recruitment of the RITS complex subunits Chp1 was even increased in both clr4F449Y and clr4I418P cells, presumably due to increased H3K9me2 (Fig. 2c; Extended Data Fig. 5a–c), while Ago1 localized to the dg and dh repeats in clr4F449Y with near wild-type efficiency (Extended Data Fig. 5d). Together with previous observations that siRNA accumulation is completely H3K9me-dependent at dh and partially H3K9me-dependent at dg15, these results demonstrate that H3K9me2 is sufficient for dg siRNA amplification (Fig. 2a), with H3K9me3-dependent steps making partial contribution to siRNA processing at the dh repeats. We therefore conclude that the partial silencing of endogenous pericentromeric transcripts in cells lacking H3K9me3 (Fig. 1g) is due to H3K9me2- and RNAi-dependent co-transcriptional degradation of RNAs transcribed from pericentromeric repeats.
Figure 2. Transcription-permissive H3K9me2 helps recruit RNAi and precedes H3K9me3 establishment.
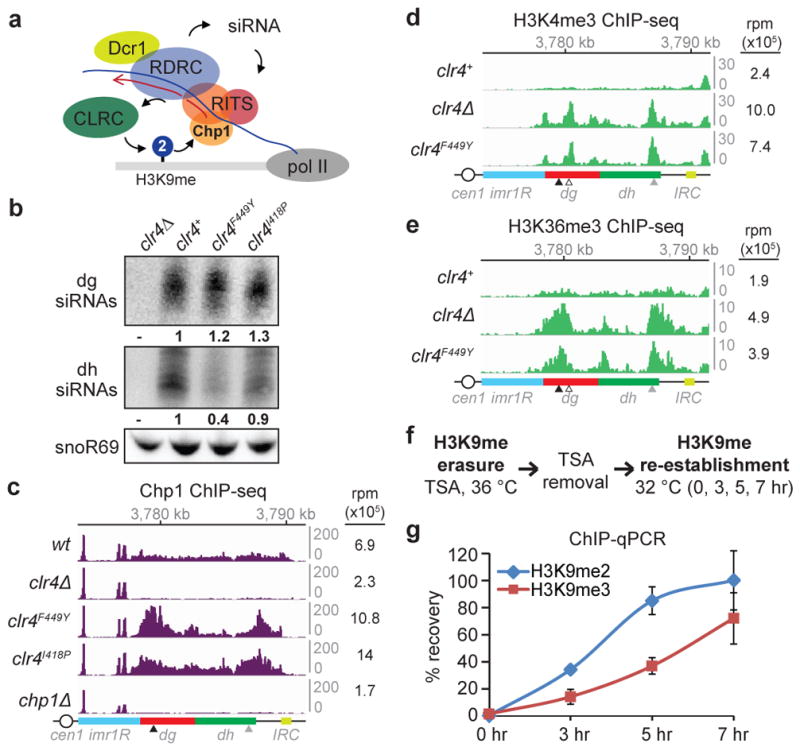
a, Model for recruitment of the RNAi machinery (RITS, RDRC, and Dcr1) and Clr4-containing CLRC to a nascent pericentromeric transcript. b, Northern blot of dg and dh siRNAs in cells with the indicated genotypes. Ratios are determined by fold increase in siRNA levels in mutants over wild-type (wt) cells. snoR69 was used as an internal control. For gel source data, see Supplementary Figure 1. Image represents 3 (dg siRNA) or 2 (dh siRNA) individual experiments. c, Chp1 ChIP-seq reads mapped to the pericentromeric repeat regions on the right arm of chromosome 1. Right, sum of normalized reads mapped to pericentromeric region to the right of cen1. Data is presented as reads per million (rpm, Y axis). Arrows indicate primer locations for ChIP-qPCR analysis in Extended Data Fig. 5. d, e, Same as c, but showing H3K4me3 (d) and H3K36me3 (e) ChIP-seq reads. Empty arrow indicates location for dg2 primers in Extended Data Fig. 5. f, Experimental strategy for de novo H3K9me establishment. g, ChIP-qPCR data showing the recovery kinetics of H3K9me2 (blue) and H3K9me3 (red) at the dh2 pericentromeric repeat. For each time point, H3K9me levels were normalized to that of untreated cells. Error bars, s.d.; n = 3 biological replicates.
Since increased pol II occupancy was associated with high levels of H3K9me2 (Fig. 1c, f; Extended Data Fig. 4b), we tested whether H3K9me2 domains contain histone modifications that are linked to transcription22. ChIP-seq and ChIP-qPCR showed increased levels of transcription-associated H3K4me3, H3K36me3, H3K14 acetylation (H3K14ac), and H4K16 acetylation (H4K16ac) in clr4F449Y relative to clr4+ cells (Fig. 2d, e, and Extended Data Fig. 5e–h). Additionally, quantitative MS analysis of nuclear histones purified from clr4+ cells showed a nearly 1-to-1 ratio of H3K9me2 and H3K9me3, with about 30% of the H3K9me2 peptide, but 0% of the H3K9me3 peptide, containing K14ac (Extended Data Fig. 6). We also detected high levels of H3K9me1 in both clr4+ and clr4Δ cells (Extended Data Fig. 6b), suggesting that fission yeast harbor another enzyme(s) that catalyzes H3K9me1. These results demonstrate that H3K9me2 domains are associated with transcription-coupled histone modifications commonly found in euchromatic domains and raise the possibility that transcriptionally permissive H3K9me2 domains may precede H3K9me3 and TGS during heterochromatin establishment.
To test this hypothesis, we examined whether H3K9me2 precedes H3K9me3 during de novo RNAi-dependent heterochromatin establishment in wild-type cells. We treated S. pombe cells with Trichostatin A (TSA), a histone deacetylase inhibitor previously shown to partially disrupt heterochromatin23, and harvested them at several time points after TSA removal (Fig. 2f). Successful re-establishment of heterochromatin was demonstrated by gradual and partial restoration of silencing at the otr1R::ura4+ transgene over a period of several hours (Extended Data Fig. 7a). In agreement with ChIP-seq results (Extended Data Fig. 7b, c), ChIP-qPCR assays revealed faster recovery kinetics for H3K9me2 relative to H3K9me3 (Fig. 2g). Such temporal separation between H3K9me2 and H3K9me3 may allow the establishment of large domains of transcription- and RNAi-dependent H3K9me throughout several kilobases of pericentromeric chromatin prior to silencing of transcription – which, if it occurred too early, would interfere with siRNA-mediated spreading.
Efficient silencing requires the recruitment of heterochromatin protein 1 (HP1) proteins, Swi6 and Chp2, which bind to H3K9me and promote TGS at least in part by recruiting the Clr3 histone deacetylase complex24,25. We next explored if H3K9me states affect the recruitment of those downstream factors that, unlike Chp1, are not required for H3K9me establishment at pericentromeric repeats (Extended Data Fig. 8a, b). In clr4F449Y cells, Swi6 association with pericentromeric dh repeats was nearly abolished, while its association with dg repeats was reduced by about 3-fold (Fig. 3a, Extended Data Fig. 9a). We also observed weak localization of GFP-Swi6 to a single perinuclear dot in clr4F449Y cells, consistent with its weak association with pericentromeric H3K9me2 (Extended Data Fig. 9b). Chp2 recruitment was also impaired, but to a lesser extent (Fig. 3b, Extended Data Fig. 9c). Moreover, the reduced Swi6 and Chp2 recruitment to pericentromeric DNA repeats in clr4F449Y cells was accompanied by a reduction in Clr3 recruitment (Fig. 3c, Extended Data Fig. 9d). Therefore, defective TGS, associated with the loss of H3K9me3, results at least in part from a defect in HP1 and Clr3 recruitment. To further investigate whether the differential recruitment of chromo domain proteins was due to their differing affinities for H3K9me2 and H3K9me3, we performed quantitative MS using isobaric mass tags to examine the ability of unmodified H3 (H3K9me0), H3K9me2, and H3K9me3 tail peptides to associate with chromo domain proteins in S. pombe extracts (Fig. 3d, e). This assay evaluates binding to histone tails in the context of each protein’s association with its native binding partners. Chp1 and Chp2 bound to H3K9me2 and H3K9me3 peptides with similar efficiency, while Swi6 and Clr4 associated with H3K9me3 peptides more efficiently than with H3K9me2 peptides (Fig. 3f). Together with previous findings26, these results suggest that efficient recruitment of Chp1/RNAi and reduced recruitment of Swi6 to pericentromeric DNA repeats in clr4F449Y cells is due to their different affinities for H3K9me2 relative to H3K9me3, and provide an explanation for efficient H3K9me2-dependent RNAi versus H3K9me3-dependent TGS.
Figure 3. H3K9me states regulate the recruitment of HP1 proteins and Clr4.

a–c, Swi6 (a), Flag-Chp2 (b), and Flag-Clr3 (c) ChIP-seq reads mapped to pericentromeric repeats on the right arm of chromosome 1. Arrowheads indicate the location of primers for ChIP-qPCR analysis presented in Extended Data Fig. 9. d, Quantitative MS analysis of the association of chromo domain proteins with differentially methylated H3K9 peptides. e, Silver stain (top) and western blot (bottom) of proteins isolated by H3 tail peptides. For gel source data, see Supplementary Figure 1. f, Quantification of TMT-labeled peptides for the indicated protein. Error bars, s.d.; n = 3 biological replicates for me2 and me3 peptides. H3K9me3 (g), H3K9me2 (h), and Flag-Clr4 (i) ChIP-seq reads mapped as described for panels a–c.
We next examined the mechanism that governs the transition from H3K9me2 to H3K9me3-dependent TGS. Clr4 localizes to pericentromeric DNA repeats by interaction with the RNAi machinery as well as through the interaction of its chromo domain with H3K9me3. In cells with stably expressed Clr4 carrying a W31G mutation in its chromo domain (Extended Data Fig. 1a), we observed a drastic loss of H3K9me3, but not H3K9me2, throughout pericentromeric DNA repeats, demonstrating that the interaction of Clr4 with the RNAi machinery was sufficient for its recruitment and H3K9me2 catalysis (Fig. 3g, h; Extend Data Fig. 9e, f). ChIP experiments also revealed that in contrast to greatly reduced association of Clr4W31G with chromatin, Clr4F449Y associated with pericentromeric DNA repeats at levels close to that of wild-type Clr4, demonstrating that Clr4 can bind to H3K9me2 via its chromo domain (Fig. 3i; Extended Data Fig. 9g). Together, these results suggest that following RNAi-mediated recruitment of Clr4 to establish H3K9me2, the association of the chromo domain of Clr4 with H3K9me2 is required for transition to H3K9me3 and TGS. We propose that this association promotes H3K9 tri-methylation by either increasing the residence time of Clr4 on chromatin or by inducing a conformational change that favors tri-methylation.
Having determined the role of H3K9me states in RNAi-dependent heterochromatin establishment, we sought to examine their possible role in epigenetic inheritance. We first used a system that allows reversible and RNAi-independent heterochromatin establishment27,28. In this system, a Clr4 protein lacking its chromo domain is fused to the bacterial TetR protein (TetR-Clr4-I) and binds to an array of tet operator (10xtetO) sites located upstream of an ade6+ reporter gene (Fig. 4a), resulting in ade6+ silencing and formation of red colonies on medium with limiting adenine (Fig 4b, left)27,28. In cells containing a wild-type endogenous copy of clr4+, and lacking epe1+, which promotes H3K9 demethylation, this ectopically established silencing is epigenetically inherited after tetracycline-induced release of TetR-Clr4-I (+ tet; Fig 4b, right, 2nd row)27,28. Strikingly, replacement of clr4+ with clr4F449Y or clr4I418P abolished the epigenetic inheritance of ade6+ silencing (Fig. 4b, right). Similarly, consistent with previous results using Clr4 lacking its chromo domain27,28, replacement of clr4+ with clr4W31G abolished heterochromatin maintenance (Fig. 4b). TetR-Clr4-I established broad domains of H3K9me2 in clr4I418P, clr4W31G, and clr4+ cells lacking epe1+ (Fig. 4c; Extended Data Fig. 10a, b), which were maintained after releasing TetR-Clr4-I in clr4+ cells, but declined to background levels in clr4I418P and clr4W31G cells, similar to the levels observed in clr4Δ cells (Fig. 4d; Extended Data Fig. 10a, b). These results indicate that H3K9me3 is critical for epigenetic inheritance of silencing at an ectopic locus. We then asked whether H3K9me3 was required for the epigenetic maintenance of H3K9me at endogenous pericentromeric DNA repeats. RNAi mutant cells contain residual H3K9me at pericentromeric DNA repeats that is epigenetically maintained27. We observed a complete loss of H3K9me2 when clr4I418P mutant was combined with ago1Δ (Fig. 4e, bottom rows; Extended Data Fig. 10c), indicating that H3K9me3 was required for RNAi-independent epigenetic inheritance of H3K9me at endogenous pericentromeric repeats.
Figure 4. H3K9me3 is required for epigenetic inheritance.
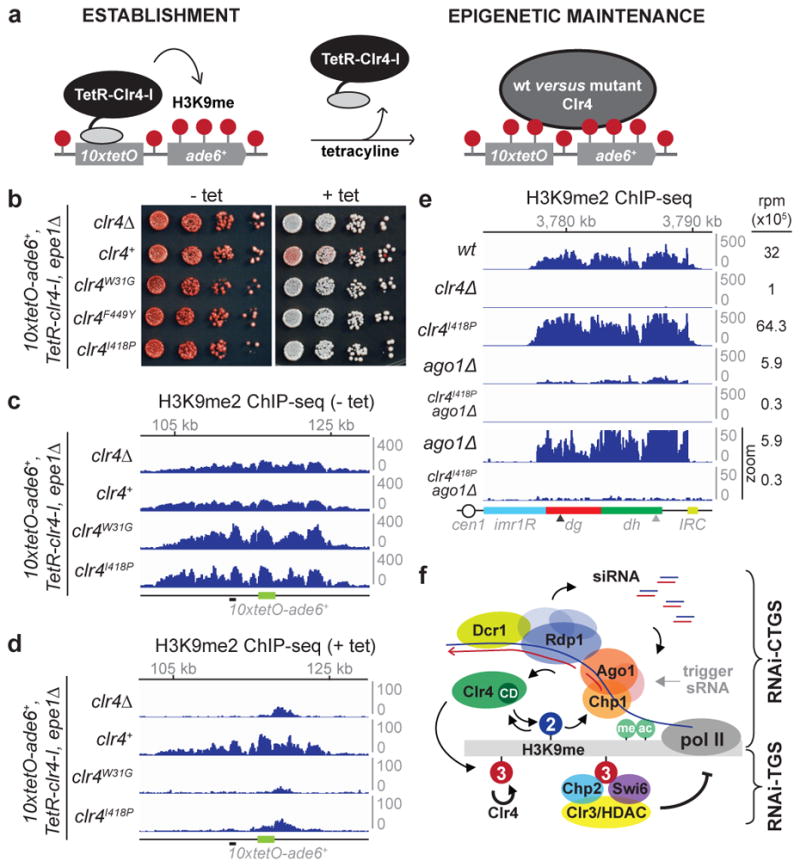
a, Experimental strategy for testing requirements for epigenetic inheritance. b, Silencing assays of 10xtetO-ade6+ on low-adenine medium lacking tetracycline (− tet) or containing tetracycline (+ tet) to assess establishment and maintenance, respectively, in epe1Δ cells, which either lack endogenous clr4+ (clr4Δ), or contain clr4+, clr4W31G, or clr4I418P alleles. Image represents 3 individual experiments. c, H3K9me2 ChIP-seq reads mapped to the 10xtetO-ade6+ region. Both 10xtetO-ade6+ (green) and mug135+ (black dash) located 5 kb upstream of 10xtetO-ade6+ were used for ChIP-qPCR analysis (see Extended Data Fig. 10). d, Same as c, but after 24 hours of growth in + tet medium. e, H3K9me2 ChIP-seq reads mapped to pericentromeric repeats on the right of chromosome 1. The sum of normalized reads is indicated on the right. Data is presented as reads per million (rpm, Y axis). The bottom two tracks have a 10-fold expanded Y axis scale to highlight the complete loss of H3K9me2 in the clr4I418P ago1Δ double mutant cells. f, Schematic summary of the unique roles of H3K9 methylation states. Top: H3K9me2 mediates co-transcriptional degradation of nascent transcripts (RNAi-CTGS) and H3K9me spreading. Bottom: The formation of H3K9me3 domains, which requires the chromo domain (CD) of Clr4, results in efficient recruitment of HP1 proteins and transcriptional gene silencing (RNAi-TGS). H3K9me3, but not H3K9me2, can be epigenetically inherited. See Extended Data section for additional discussion.
In summary, we discovered that RNAi and CTGS are associated with a transcriptionally permissive type of heterochromatin that is defined by H3K9me2 (Fig. 4f). Transition from H3K9me2 to H3K9me3, which requires the association of the chromo domain of the Clr4 methyltransferase with H3K9me2, is required for efficient recruitment of HP1 proteins and TGS (Fig. 4f). We propose that the slower kinetics of de novo H3K9me3 establishment relative to H3K9me2 establishment (this study) allow the siRNA- and transcription-dependent spreading of H3K9me prior to the onset of H3K9me3-dependent TGS. Our findings also indicate that H3K9me3 is required for the epigenetic inheritance of domains of H3K9me following their establishment by either endogenous RNAi or artificial recruitment of Clr4 to an ectopic site. This requirement for H3K9me3 is likely due to the higher affinity of the Clr4 chromo domain for H3K9me3 relative to H3K9me2 (this study)13,26, which would ensure stable binding of Clr4 to parentally inherited histones followed by methylation of newly deposited histones. Histone H3K9me states therefore determine not only the mechanism of silencing within heterochromatin but also its potential epigenetic heritability. The uncoupling of TGS from of H3K9me is likely to be critical for H3K9me-dependent sRNA generation in other organisms, and may be regulated by either H3K9me states, as described here, or other factors that would allow transcription within heterochromatin16–18. Finally, the conservation of H3K9 methylation and its role in chromatin regulation, together with the diversity of methyltransferases that preferentially catalyze H3K9me1, H3K9me2, or H3K9me3 suggest that mechanisms similar to what we have described in fission yeast are likely to be utilized in other organisms. Our findings regarding H3K9me states also further highlight the remarkable utility of lysine methylation states and their power in signaling distinct downstream chromatin-dependent events.
Methods
Strain construction
Strains used in this study are listed in Extended Data Table 1. All Flag-tagged genes were expressed under the control of their endogenous promoters and terminators. SPY5244, SPY5245, SPY5248, and SPY6326 were constructed by integrating full length wild-type or mutant clr4 open reading frames and endogenous clr4+ promoter and terminator sequences about 450 bp upstream of the trp1+ gene in the SPY5086 strain27.
Growth Assays
Cells were grown in YES to log phase, 1 × 10⁷ cells were pelleted, suspended in 100 μl of water, and then serially diluted 10 fold. Three μl of each dilution was spotted on the appropriate growth medium. FOA was used at 1 mg/ml and tetracycline at 2.5 μg/ml. Plates were incubated at 32 °C for 3–4 days. YE plates were used for assaying ade6+ reporter strains and were additionally incubated at 4 °C overnight (to enhance the color red) prior to imaging.
H3K9me Erasure by TSA and Recovery
Cells were inoculated in 50 ml YEA containing 25 μg/ml TSA and grown at 36 °C for 15 hr. Cells were then pelleted and washed to remove TSA, suspended in YEA at 32 °C to reestablish heterochromatin, and harvested at 0, 3, 5, and 7 hr for ChIP analysis.
Chromatin Immunoprecipitation (ChIP)
ChIP was performed as previously described30. Conditions for fixation and immunoprecipitation (IP) are briefly described here. Fifty ml cultures of cells were grown overnight (or 24 hr when 2.5 μg/ml tetracycline was added) in YES to an optical density (OD) of 2 and fixed as follows. For H3K9me2, H3K9me3, H3K4me3, H3K36me3, H3K14ac, H4K16ac, RNA pol II, Chp1, and Flag-Ago1 ChIP, cells were fixed with 1% formaldehyde for 15 min. For Swi6 and other Flag-protein ChIP, we used a modified dual-crosslinking protocol in which cells were first incubated at 18 °C for 2 hr, resuspended in 5 ml of room temperature PBS, and fixed with 1.5 mM ethylene glycol bis-succinimidyl succinate (EGS, Thermo Scientific 21565) for 30 min, followed by addition of formaldehyde to 1% final concentration for another 30 min31. For each IP, ~ 2 μg of antibody was pre-incubated with 30 μl of Invitrogen Dynabeads Protein A or Protein G: anti-H3K9me2 (Abcam 1220) with Protein A, anti-H3K4me3 (Millipore 04–745) with protein G, anti-H3K36me3 (Abcam 9050) with protein A, anti-H3K14ac (Millipore 07–353) with protein-A, anti-H4K16ac (Active Motif 39167) with protein A, anti-Chp1 (Abcam 18191) with protein A, anti-Flag (Sigma F1804) with protein G, anti-Swi6 (rabbit polyclonal) with protein A, anti-RNA pol II 8WG16 (BioLegend MMS-126R-500) with protein A. For IP with H3K9me3 antibody, Dynabeads M-280 Streptavidin beads were first incubated with 1 μg of anti-H3K9me3 (Diagenode C15500003), followed by blocking with 5 μM biotin. All (500 μl for ChIP-seq) or one fifth (100 μl for ChIP-qPCR) of sheared chromatin lysate was added to the antibody-bead mixture and incubated for 2 hr at 4 °C on a rotating device. After reversing cross-links and DNA clean-up, qPCR was performed using primers listed in Extended Data Table 2. fbp1+ was used as internal control in pol II ChIP-qPCR.
Library preparation and high throughput sequencing
For ChIP-seq, immunoprecipitated DNA was cleaned up using the Qiagen PCR Purification Kit after reversing cross-links, RNaseA, and proteinase K treatment. Immunoprecipitated DNA was eluted from column with the provided elution buffer (50 μl × 2), subjected to additional shearing in a Qsonica water bath sonicator at 20% amplitude for 15 min of total shearing time (each cycle is 15 sec on + 15 sec off), followed by vacuum centrifugation to reduce the volume to 30 μl. DNA concentration was measured using Qubit dsDNA HS Kit. One to 10 ng of immunoprecipitated DNA was used for standard Illumina library construction using barcoded adapters and protocol described previously32. Libraries were pooled and sequenced on the Illumina HiSeq2000. Raw reads were mapped to the S. pombe genome using Bowtie’s default parameters, which randomly assigns reads that mapped to repeated regions. Mapped reads were normalized to reads per million (script is available upon request), tiled with igvtools, and visualized with IGV. H3K9me2 and H3K9me3 ChIP-seq were performed twice for wt, clr4Δ, and clr4F449Y cells. All other ChIP-seq experiments were performed once. All ChIP-seq results were verified using ChIP-qPCR.
RNA Extraction and Quantitative Reverse Transcription PCR
RNA extraction and RT-qPCR were performed as previously described30. Briefly, total RNA was extracted with hot phenol followed by ethanol precipitation. The precipitated nucleic acid was treated with DNase I (Roche) and cleaned up with Qiagen RNeasy Mini Kit. cDNA was prepared from 200 ng of RNA using SuperScript III Reverse Transcriptase (Invitrogen) with primers listed in Extended Data Table 2. act1+ cDNA was used as internal control.
Small RNA (sRNA) Extraction and Northern Blot
sRNA was purified from 50 ml of cells (OD = ~1.5) as previously described33. Briefly, total sRNA was purified with the mirVana miRNA Isolation Kit (Ambion), loaded on 17.5% polyacrylamide/7M urea gel, transferred to positively charged nylon membrane (Roche 1417240), and probed with a mixture of 32P-labeled DNA probes corresponding to dg or dh siRNA sequences described previously33.
Quantitative mass spectrometry assay for association of silencing complexes with histone H3 peptides
Exponentially growing wild-type cells expressing 3xFlag-Clr4 under its endogenous promoter (SPY4636) (2.25 × 10¹¹ cells) were harvested by centrifugation, transferred to a 50 ml tube, washed twice in TBS (50 mM Tris [pH 7.6], 150 mM NaCl), and frozen at −80 °C (approximately 20 g cells). All subsequent steps were performed at 4 °C. The frozen cells were resuspended in 1 volume of ice-cold lysis buffer (20 mM HEPES [pH 7.5], 150 mM NaCl, 5 mM MgCl2, 1 mM EDTA [pH 8.0], 0.5 mM DTT, 10% glycerol, 0.25% Triton X-100, 1 mM phenylmethylsulfonyl fluoride [PMSF], complete protease inhibitor cocktail (Roche)) and lysed by glass-bead beating for 6 times 45 sec at 5,000 rpm with 1 ml 0.5 mm glass beads per 800 μl of yeast resuspension (MagNa Lyser, Roche). Tubes were punctured and the crude lysate was collected in a fresh tube by centrifugation. After two consecutive rounds of centrifugation at 12,000 × g for 3 min and 15 min, respectively, the cleared lysates were pooled, diluted to a protein concentration of 25 mg/ml with ice-cold lysis buffer, and divided into 9 aliquots of 4.5 ml in which 7,500 units of Benzonase (Novagen 71205-3) was added. Biotinylated peptides histone H3 1–21 K9me0 (Anaspec AS-61702), H3 1–21 K9me2 (Anaspec AS-64359-1), H3 1–21 K9me3 (Anaspec AS-64360-1) were pre-incubated with washed Streptavidin myOne C1 (Invitrogen 65002) for 4 hr, and washed once with ice-cold lysis buffer. For each immunoprecipitation, 40 μg of biotinylated peptides coupled to 200 μl beads was added to 4.5 ml lysate (25 mg/ml). Samples were rotated for 3 hr at 4 °C, the beads were collected on magnetic stands, and washed 4 times with 1 ml ice-cold lysis buffer and eluted with 800 μl of 500 mM NH4OH at 37 °C for 20 min. 5% of eluted proteins were analyzed by silver staining and 2.5% of eluted proteins were analyzed by Western blotting. The remaining 90% of the eluted protein was analyzed by multiplexed quantitative mass spectrometry. Proteins were subjected to disulfide bond reduction with 5 mM tris (2-carboxyethyl)phosphine (room temperature, 30 min) and alkylation with 10 mM iodoacetamide (room temperature, 30 min in the dark). Excess iodoacetamide was quenched with 15 mM dithiotreitol (room temperature, 15 min in the dark). TCA precipitation followed by one acetone and one methanol wash was performed prior to protease digestion. Samples were resuspended in 200 mM HEPES, pH 8.5 and digested at room temperature for 13 hr with LysC protease at a 100:1 protein-to-protease ratio after which trypsin was added at a 100:1 protein-to-protease ratio for 6 hr at 37 °C. Acetonitrile was added to final concentration of approximately 30% (v/v), after which TMT reagents (0.5 mg) were added. Following incubation at room temperature for 1 hr, the reaction was quenched with hydroxylamine to a final concentration of 0.3% (v/v) for 15 min. The TMT-labeled samples were pooled at a 1:1 ratio for all samples, vacuum centrifuged to near dryness and fractionated using the Pierce High pH Reversed-Phase Peptide Fractionation Kit (Pierce 84868). Twelve fractions were collected using: 5%, 10%, 12.5%, 15%, 17.5%, 20%, 22.5%, 25%, 35%, 50%, 60%, and 80% acetonitrile. From here, every 6th sample was combined, yielding a total of 6 samples. Samples were subsequently acidified with 1% formic acid and vacuum centrifuged to near dryness. Each fraction was desalted via StageTip, dried again via vacuum centrifugation, and reconstituted in 5% acetonitrile, 5% formic acid for LC-MS/MS processing. Mass spectrometry data were collected using an Orbitrap Fusion mass spectrometer (Thermo Fisher Scientific, San Jose, CA) coupled to a Proxeon EASY-nLC 1,200 liquid chromatography (LC) pump (Thermo Fisher Scientific, San Jose, CA). Peptides were fractionated on a 100 μm inner diameter microcapillary column packed with ~35 cm of Accucore150 resin (1.5 μm, 150 Å, Thermo Fisher Scientific, San Jose, CA). For each analysis, we loaded ~1 μg onto the column. Peptides were separated using a 2 h gradient of 7 to 27% acetonitrile in 0.125% formic acid at a flow rate of ~450 nL/min. Each analysis used the multi-notch MS3-based TMT method34 on an Orbitrap Fusion mass spectrometer. The scan sequence began with an MS1 spectrum (Orbitrap analysis; resolution 120,000; mass range 400–1,400 m/z; automatic gain control (AGC) target 5 × 10⁵; maximum injection time 100 ms). Precursors for MS2/MS3 analysis were selected using a Top10 method. MS2 analysis consisted of collision-induced dissociation (quadrupole ion trap analysis; AGC 1.8 × 10⁴; normalized collision energy (NCE) 35; maximum injection time 120 ms). Following acquisition of each MS2 spectrum, we collected an MS3 spectrum using our recently described method in which multiple MS2 fragment ions were captured in the MS3 precursor population using isolation waveforms with multiple frequency notches. MS3 precursors were fragmented by high energy collision-induced dissociation (HCD) and analyzed using the Orbitrap (NCE 55; AGC 3 × 10⁵; maximum injection time 120 ms, resolution was 60,000 at 200 Th). Mass spectra were processed using a Sequest-based in-house software pipeline35. Spectra were converted to mzXML using a modified version of ReAdW.exe. Database searching included all entries from the Uniprot S. pombe database. This database was concatenated with one composed of all protein sequences in the reversed order. Searches were performed using a 50 ppm precursor ion tolerance for total protein level analysis. The product ion tolerance was set to 0.9 Da. These wide mass tolerance windows were chosen to maximize sensitivity in conjunction with Sequest searches and linear discriminant analysis35,36. TMT tags on lysine residues and peptide N termini (+229.163 Da) and carbamidomethylation of cysteine residues (+57.021 Da) were set as static modifications, while oxidation of methionine residues (+15.995 Da) was set as a variable modification. Peptide-spectrum matches (PSMs) were adjusted to a 1% false discovery rate (FDR)37,38. PSM filtering was performed using a linear discriminant analysis, as described previously35, while considering the following parameters: XCorr, ΔCn, missed cleavages, peptide length, charge state, and precursor mass accuracy. For TMT-based reporter ion quantitation, we extracted the summed signal-to-noise (S/N) ratio for each TMT channel and found the closest matching centroid to the expected mass of the TMT reporter ion. PSMs were identified, quantified, and collapsed to a 1% peptide false discovery rate (FDR) and then collapsed further to a final protein-level FDR of 1%. Moreover, protein assembly was guided by principles of parsimony to produce the smallest set of proteins necessary to account for all observed peptides. Proteins were quantified by summing reporter ion counts across all matching PSMs using in-house software, as described previously35. PSMs with poor quality, MS3 spectra with more than eight TMT reporter ion channels missing, MS3 spectra with TMT reporter summed signal-to-noise ratio that is less than 100, or no MS3 spectra were excluded from quantitation39.
Quantitative Mass Spectrometry analysis of histones and the CLRC complex
Flag-tagged strains and non-tagged control strains were grown in YES to log phase, 2 × 10⁷ cells, and washed twice with 1× TBS. Protein purification was performed as described in the previous section with the following modifications. For histones pulldown using Flag-Swi6, extract was incubated with Protein G Dynabeads (Life Technologies) cross-linked with anti-Flag (Sigma F1804) antibody for 4 hr at 4 °C. Around 5% of eluted proteins were analyzed by western using antibodies for H3K9me2 (Abcam 1220) and H3K9me3 (Abcam 8998). Remaining eluted proteins were dried overnight using vacuum centrifugation and resolved in a 12% sodium dodecyl sulfate-polyacrylamide gel. The gel was Coomassie stained and placed on a clean glass plate wiped clean with methanol. Bands lower than 20 kDa were cut out using clean scalpel, diced in a drop of water into as small pieces as possible and collected into a 1.5 ml sterile microcentrifuge tube. Two rounds of propionylation were performed to ensure all free lysines are derivatized. Briefly, 1:1 of 100 mM NH4HCO3 and propionic anhydride were added to gel pieces, followed by washing in 100 mM NH4HCO3, dehydration in 100% acetonitrile and drying in vacuum centrifuge. Subsequently, gel pieces were swelled in 12.5 ng/μl trypsin (Invitrogen) diluted in 50 mM NH4HCO3 on ice for 45 min, removed to be replaced with 50 mM NH4HCO3 and left at room temperature overnight. The gel was dehydrated with 75% MeCN 5% acetic acid and the supernatant containing the derivatized peptides was treated with two more rounds of propionylation to cap the N-termini. Using C18 Stage-tips, the samples were desalted for LC-MS analysis. Samples were then separated using a 75 μm ID × 17 cm Reprosil-Pur C18-AQ (3 μm; Dr. Maisch GmbH, Germany) nano-column mounted on an EASY-nLC nanoHPLC (Thermo Scientific, San Jose, CA, USA) using HPLC gradient: 2% to 28% solvent B (A = 0.1% formic acid; B = 95% MeCN, 0.1% formic acid) over 45 min, from 28% to 80% solvent B in 5 min, 80% B for 10 min at a flow-rate of 300 nL/min. nLC was coupled online to an LTQ-Orbitrap Elite mass spectrometer (Thermo Scientific). Data were acquired using data-independent acquisition (DIA) as previously described40. Briefly, full scan MS (m/z 300–1,100) was acquired in the Orbitrap with a resolution of 120,000 (at 200 m/z) and an AGC target of 5 × 10⁵. MS/MS was acquired in a centroid mode in the ion trap with sequential isolation windows of 50 m/z with an AGC target of 3×10⁴, a CID collision energy of 35 and a maximum injection time of 50 msec. The data was searched using EpiProfile with Schizosaccharomyces pombe database41. The peptide relative ratio was calculated using the total area under the extracted ion chromatograms of all peptides with the same amino acid sequence (including all of its modified forms) as 100%. For isobaric peptides, the relative ratio of two isobaric forms was estimated by averaging the ratio for each fragment ion with different mass between the two species.
For analysis of histone post-translational modifications using total fission yeast histones, histones were prepared by modifications of a previously described protocol42. One liter of culture (SPY137 or SPY815) grown to an OD600 of 0.9 – 1.0 was harvested by centrifugation and washed once with water, once with Buffer A (1.0 M Sorbitol 50 mM potassium phosphate, pH 6.8, 14 mM 2-mercaptoethanol), and resuspended in Buffer A containing 0.1 mg/ml Zymolyase. Cells were incubated at 30 °C with gentle shaking until >90% were converted to spheroplasts. The suspension was pelleted at 3,200 × g for 5 min at 4 °C, washed in cold Buffer A, resuspended in cold Buffer B (18% Ficoll-400, 20 mM potassium phosphate, pH 6.8, 1.0 mM MgCl2, 0.5 mM EDTA, and complete EDTA-free protease inhibitor cocktail (Roche)), and dounced using a prechilled douncer. The sample was then centrifuged at 3,200 × g for 5 min at 4 °C. The supernatant was centrifuged again at 3,200 × g for 5 min at 4 °C. Nuclei were pelleted by spinning at 50,000 × g in a Beckman SW40 Ti rotor. The pellet was resuspended in Buffer C (0.34 M Sucrose, 20 mM Tris-HCl, pH 7.4, 50 mM KCl, 5 mM MgCl2, and complete EDTA-free protease inhibitor cocktail (Roche)), layered on a 2 ml sucrose cushion at the bottom of the tube, and centrifuged at 30,000 × g for 30 min at 4 °C. Nuclei were resuspended in Buffer D (10 mM Tris, pH 8.0, 0.5% NP-40, 75 mM NaCl, and complete EDTA-free protease inhibitor cocktail (Roche)) and pelleted by centrifuging at 3,200 × g at 4 °C for 5 min a total of three times. Nuclei were resuspended in Buffer E (10 mM Tris-HCl, pH 8.0, 400 mM NaCl, complete EDTA-free protease inhibitor cocktail (Roche)). Cold H2SO4 was added slowly to the suspension with mixing to a final concentration of 1.5 M, followed by incubation for 30 min at 4 °C with mixing. The nuclei were centrifuged at 20,000 × g at 4 °C for 5 min, and acid extraction was repeated as before. The supernatant from the acid extractions were pooled and TCA precipitated. The pellet was washed once with cold 0.1% HCl Acetone, twice with cold Acetone, and the pellet was resuspended in water. The sample quality and yield were determined by SDS-PAGE and Bradford assay, respectively. The remaining histones were chemically derivatized using propionic anhydride, trypsin-digested and derivatized again as described previously43. The desalted peptides were resuspended in 0.1N acetic acid and about 1 μg was analyzed using an EASY-nLC nanoHPLC (Thermo Scientific, Odense, Denmark) coupled with a Q-Exactive mass spectrometer (Thermo Fisher Scientific, Bremen, Germany). Nano-liquid chromatography was carried out in a gradient of 0–35% solvent B (A = 0.1% formic acid; B = 95% MeCN, 0.1% formic acid) over 30 min and from 34% to 100% solvent B in 20 min at a flow-rate of 250 nL/min. Full scan MS spectrum (m/z 290–1,650) was performed in the Orbitrap with a resolution of 30,000 (at 400 m/z) with an AGC target of 1 × 10⁶. To facilitate MS/MS-based quantification, the MS/MS events included both data-dependent acquisition and targeted acquisition for isobaric peptides. The relative abundance of histone H3 and H4 peptides were calculated by using EpiProfile.
For Flag-Clr4 WT and F449Y purification, extracts were prepared based on the method described44 using a freezer-mill (Freezer/Mill®, SPEX®SamplePrep). Yeast powder was resuspended in 1 volume of ice-cold lysis buffer 500 mM NaCl (20 mM HEPES [pH 7.5], 500 mM NaCl, 5 mM MgCl2, 1 mM EDTA [pH 8.0], 0.5 mM DTT, 10% glycerol, 0.25% Triton X-100, 1 mM phenylmethylsulfonyl fluoride [PMSF], complete protease inhibitor cocktail (Roche)), sonicated 6 sec ON, 1 min OFF for a total of 2 min and clarified at 4 °C by two consecutive rounds of centrifugation at 16,000 × g for 25 min and 10 min, respectively. The cleared lysates were diluted to a protein concentration of 25 mg/ml with ice-cold lysis buffer 500 mM NaCl and incubated with Protein G Dynabeads (Life Technologies) cross-linked with anti-Flag (Sigma F1804) antibody for 4 hr at 4 °C. The beads were collected on magnetic stands, and washed 4 times with 7 ml ice-cold lysis buffer 500 mM NaCl, followed by two washes with ice-cold lysis buffer 100 mM NaCl (20 mM HEPES [pH 7.5], 100 mM NaCl, 5 mM MgCl2, 1 mM EDTA [pH 8.0], 0.5 mM DTT, 10% glycerol, 0.25% Triton X-100, 1 mM phenylmethylsulfonyl fluoride [PMSF], complete protease inhibitor cocktail (Roche)). Beads were resuspended in 500 μl of ice-cold lysis buffer 100 mM NaCl and incubated with 5,000 units of Benzonase (Novagen 71205-3) for 20 min at 25 °C with mild shaking. Beads were washed twice with ice-cold lysis buffer 100 mM NaCl and eluted with 1 ml of 500 mM NH4OH at 37 °C for 20 min. The eluted proteins were dried overnight using vacuum centrifugation. Proteins were subjected to disulfide bond reduction with 5 mM tris (2-carboxyethyl)phosphine (room temperature, 30 min) and alkylation with 10 mM iodoacetamide (room temperature, 30 min in the dark). Excess iodoacetamide was quenched with 15 mM dithiotreitol (room temperature, 15 min in the dark). TCA precipitation followed by one acetone and one methanol wash was performed prior to protease digestion. Samples were resuspended in 100 mM HEPES, pH 8.5 and digested at room temperature for 13 hr with LysC protease at a 100:1 protein-to-protease ratio. The sample was desalted via StageTip, dried via vacuum centrifugation, and reconstituted in 5% acetonitrile, 5% formic acid for LC-MS/MS processing. Mass spectrometry data were collected using a Q Exactive mass spectrometer (Thermo Fisher Scientific, San Jose, CA) coupled with a Famos Autosampler (LC Packings) and an Accela600 liquid chromatography (LC) pump (Thermo Fisher Scientific). Peptides were separated on a 100 μm inner diameter microcapillary column packed with ~25 cm of Accucore C18 resin (2.6 μm, 150 Å, Thermo Fisher Scientific). For each analysis, we loaded ~1 μg onto the column. Peptides were separated using a 1 hr gradient of 5 to 25% acetonitrile in 0.125% formic acid with a flow rate of ~300 nL/min. The scan sequence began with an Orbitrap MS1 spectrum with the following parameters: resolution 70,000, scan range 300–1,500 Th, automatic gain control (AGC) target 1 × 10⁵, maximum injection time 250 ms, and centroid spectrum data type. We selected the top twenty precursors for MS2 analysis which consisted of HCD high-energy collision dissociation with the following parameters: resolution 17,500, AGC 1 × 10⁵, maximum injection time 60 ms, isolation window 2 Th, normalized collision energy (NCE) 30, and centroid spectrum data type. The underfill ratio was set at 1%, which corresponds to a 1.1 × 10⁴ intensity threshold. In addition, unassigned and singly charged species were excluded from MS2 analysis and dynamic exclusion was set to automatic. Data analysis was performed as described in the section Quantitative mass spectrometry assay for association of silencing complexes with histone H3 peptides except that samples were not TMT labeled and that the product ion tolerance was set to 0.03 Da.
GST-Swi6 pulldown assay
Swi6 protein coding sequence was PCR amplified and inserted between BamHI and XhoI restriction sites of pGEX-6p-1 expression vector (GE Healthcare). This produced a Swi6 fusion protein with an N-terminal GST tag separated by a Precision Protease cleavage site. GST and GST-Swi6 were expressed in BL21 Codon Plus (Agilent Technologies), grown in 1L of LB media supplemented with 100 μg/mL ampicillin at 37 °C to an OD600 of 0.6, and induced with 0.5 mM of IPTG for 4 hr. Cells were harvested and suspended in Buffer A (50 mM Tris-HCl and 0.5 M NaCl, pH 8.0) containing 1 mg/mL Lysozyme, and nutated at 4 °C for 1 hr. The mixture was then sonicated and centrifuged at 32,000 × g for 20 min and the supernatant was loaded onto a Glutathione Sepharose 4B Column (GE Healthcare) equilibrated with Buffer A. The column was washed with buffer A and the protein was eluted with Buffer A containing 10 mM reduced glutathione. Eluted fractions were dialyzed overnight into buffer A to remove the reduced glutathione and then subjected to size exclusion chromatography using a Highload 16/60 Sephadex 200 pg column (GE Healthcare) equilibrated with Buffer A. Fractions containing pure protein were pooled and immobilized on glutathione magnetic agarose beads (Pierce).
Ten μl of magnetic beads with immobilized GST-Swi6 or GST were incubated with 230 μl of whole cell lysate (~16 mg/ml), prepared as follows: 200 ml of cells (SPY137, SPY4636, and SPY4642) were grown in YEA to OD600 of 1.6. Cell pellet were suspended in lysis buffer (20 mM Hepes [pH 7.5], 100 mM NaCl, 5 mM MgCl2, 1 mM EDTA, 10% glycerol, 0.5 mM DTT, 1 mM PMSF, and complete EDTA-free protease inhibitor cocktail (Roche)), and bead beat at 5,000 rpm for 5 × 45 sec with MagNa Lyser (Roche). Samples were incubated for 3 hr at 4 °C. Beads were washed 3 times with lysis buffer and suspended in SDS sample buffer. 0.3% of input and 50% of bound proteins were run on 4–12% gradient SDS-PAGE gel, transferred to nitrocellulose membrane, and blotted with mouse anti-Flag conjugated to HRP (Sigma A8592) at 1:5,000 dilution.
Data reporting
No statistical methods were used to predetermine sample size. The investigators were not blinded to allocation during experiments and outcome assessment. All quantitative experiments are presented as means ± s.d. of three independent biological experiments.
Data availability
The raw and processed ChlP-seq data are publicly available at the NCBI Gene Expression Omnibus under accession number GSE83495.
Extended Data
Extended Data Figure 1. Analysis of mutant Clr4 proteins and their effect on histone H3K9me.

a, Western blot of N-terminal 3xFlag-tagged Clr4 showing that SET mutations (F449Y or I418P) or a chromo domain mutation (W31G) do not affect Clr4 protein stability (top). The same blot stained with Ponceau dye is shown as a loading control (bottom). Image represents 2 individual experiments. b, Flag purification of wild-type Clr4 and Clr4F449Y showing both proteins are incorporated into the CLRC methyltransferase complex. c, Pull-down assays showing that wild-type Clr4 and Clr4F449Y interact with recombinant GST-Swi6 with similar efficiency. d, Coomassie staining (top) and western blot (bottom) of histones enriched for H3K9me using Swi6 affinity pull-down from wild-type and clr4F449Y cells showing that Clr4F449Y primarily catalyzes H3K9me2. Image represents 3 individual experiments. e, Quantitative mass spectrometry of histones showing the redistribution of H3K9 methylation states in clr4+ and clr4F449Y cells. The histones were isolated using Swi6 affinity pull-down to increase detection sensitivity. See Extended Data Fig. 6 for quantitative mass spectrometry of H3 tail modifications in total wild-type histones. For gel source data, see Supplementary Figure 1.
Extended Data Figure 2. ChIP analysis of H3K9me levels in wild-type clr4+ and clr4 mutant cells.

a, Map of the pericentromeric DNA region to the right of centromere 1. Arrowheads indicate the location of primers used for ChIP-qPCR in b and c. b–c, ChIP-qPCR analysis of H3K9me2 (b) and H3K9me3 (c) levels at the dg and dh repeats in cells with the indicated genotypes (clr4dead = clr4H410L, C412A). Error bars, s.d.; n = 3 biological replicates. d, Expanded view of H3K9me2 ChIP-seq reads mapped to the pericentromeric repeat regions on the right arm of chromosome 1 in clr4Δ, clr4+, clr4F449Y, and clr4I418P cells. The location of centromere 1 (cen1), innermost repeats (imr1R), outermost dg and dh repeats, and inverted repeat centromere (IRC) sequences are indicated. Chromosome 1 coordinates are indicated above the tracks. Reads were randomly assigned to the dg and dh repeats of each chromosome. e, Same as d but showing H3K9me3 ChIP-seq reads.
Extended Data Figure 3. Clr4 mutants have reduced H3K9me spreading at mating type and telomeric regions.

a–g, ChIP-seq data showing changes in H3K9me2 and H3K9me3 levels outside of RNAi-dependent nucleation regions (indicated by solid black bars below tracks) at mating type (mat) and telomeric DNA regions (tel1L, tel1R, tel2L, tel2R, tel3L, and tel3R) in clr4Δ, clr4+, clr4F449Y, and clr4I418P cells. tel3L and tel3R represent reads from the rDNA repeats. H3K9me2 reads were randomly assigned to repeated sequences. The reads at cenH are therefore shared with those at the pericentromeric dg and dh repeats (with which cenH shares 98% sequence identity); H3K9me2 reads that map uniquely to the mating type locus are shown (a, right panel). When only unique reads are mapped, a large fraction of total reads corresponding to repeated sequences at centromeres, telomeres, and the mat locus, are removed. This changes the normalized peak heights, which are affected by fewer total mapped reads. Data is presented as reads per million (Y axis).
Extended Data Figure 4. ChIP-qPCR analysis showing increased pol II levels at pericentromeric DNA repeats of clr4 mutant cells.
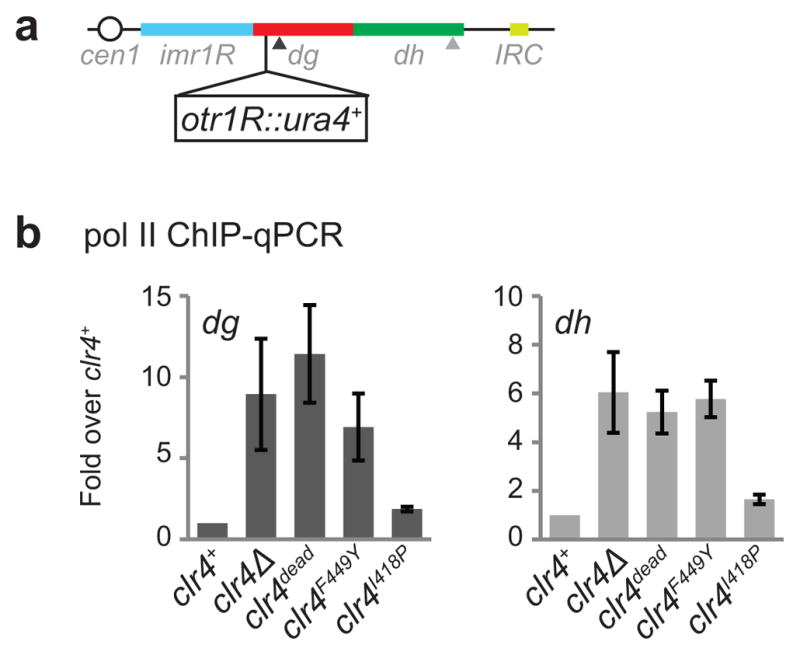
a, Map showing the location of the heterochromatin reporter ura4+ inserted to the right of cen1. b, ChIP-qPCR data showing changes in the association of RNA pol II with the dg and dh pericentromeric DNA repeats in clr4 mutant cells. qPCR primer locations are indicated by arrowheads in a. Error bars, s.d.; n = 3 biological replicates.
Extended Data Figure 5. Clr4 mutant cells have increased levels of Chp1 and activating histone marks at pericentromeric DNA repeats.

a, ChIP-qPCR showing increased Chp1 recruitment to pericentromeric DNA repeats. Error bars, s.d.; n = 3 biological replicates. b, ChIP-seq data showing increased Chp1 reads mapping to pericentromeric regions of chromosome 2 in clr4F449Y and clr4I418P mutants compared to wild-type (wt) cells. c, Same as b, but showing pericentromeric regions of chromosome 3. d, ChIP-qPCR analysis of Flag-Ago1 recruitment to pericentromeric DNA repeats in wild-type clr4+ and clr4F449Y cells. Error bars, s.d.; n = 3 biological replicates. e–h, ChIP-qPCR analysis of H3K4me3 (e) and H3K36me3 (f) levels at pericentromeric DNA repeats in wild-type clr4+ and clr4 mutant cells. dg2 primer location is indicated by empty arrowhead. Error bars, s.d.; n = 3 biological replicates. g, ChIP-seq data showing increased H3K14ac mapped reads at pericentromeric regions of chromosome 1 in clr4F449Y cells. h, ChIP-seq data showing increased H4K16ac mapped reads at pericentromeric regions of chromosome 1 in clr4F449Y cells. Data is presented as reads per million (Y axis).
Extended Data Figure 6. Quantitative mass spectrometry of histone H3 tail modifications.

a, Steps for the isolation of chromatin-bound histones and their analysis by liquid chromatography and tandem mass spectrometry (LC/MS/MS). b, Results of quantitative mass spectrometry analysis of modifications associated with the indicated H3 tail tryptic peptide in wild-type (wt) and clr4Δ cells.
Extended Data Figure 7. H3K9me2 precedes H3K9me3 during heterochromatin establishment.

a,Ten-fold serial dilution of cells plated on non-selective (N/S) and FOA-containing (+ FOA) medium to evaluate re-establishment of otr1R::ura4+ silencing at 0, 3, 5, 7 hours after TSA removal. Untreated and clr4Δ cells serve as positive and negative control for otr1R::ura4+ silencing, respectively. Image represents 3 individual experiments. b, H3K9me2 ChIP-seq reads mapped to pericentromeric repeats to the right of cen1 in untreated and TSA-treated cells at the indicated time points following TSA removal. The highlighted region (darker blue) displayed the greatest loss of H3K9 methylation resulting from TSA treatment. Read ratio (indicated on the right) was obtained by normalizing the sum of reads mapping to the highlighted region for TSA-treated compared to untreated cells. c, Same as b, but showing H3K9me3 ChIP-seq reads. See Fig. 2g for ChIP-qPCR analysis.
Extended Data Figure 8. Chp2 and Swi6 are not required for the formation of H3K9me2 or me3 domains at pericentromeric DNA repeats.

a–b, ChIP-seq data showing that unlike Chp1, Chp2 and Swi6 are not required for RNAi-mediated H3K9 methylation, as indicated by similar levels of H3K9me2 (a) and H3K9me3 (b) mapped reads at pericentromeric regions of chromosome 1 in wild-type (wt), chp2Δ, and swi6Δ cells. clr4Δ serves as a control for specificity of the anti-H3K9me antibodies. Data is presented as reads per million (Y axis).
Extended Data Fig 9. H3K9me states regulate the recruitment of HP1 proteins and Clr4.

a, Swi6 ChIP-qPCR analysis at dg and dh. Error bars, s.d.; n = 3 biological replicates. b, Live cell imaging using confocal microscopy showing the localization of GFP-Swi6 and Cut11-mCherry in clr4+, clr4F449Y, and clr4Δ cells. In wild-type clr4+ cells, GFP-Swi6 foci representing centromeres, telomeres, and the mating type locus are predominantly localized at the nuclear periphery (marked by Cut11-mCherry nuclear pore component). These peripheral GFP-Swi6 foci are lost in clr4Δ cells, but in clr4F449Y cells, in which H3K9me2 is restricted primarily to pericentromeric repeats, one fluorescent focus corresponding to centromeres, which cluster at the nuclear periphery independently of H3K9me, is maintained. The peripheral GFP-Swi6 focus in clr4F449Y cells is weaker than that in clr4+ cells, which is likely due to the lower affinity of Swi6 for H3K9me2 relative to H3K9me3. Correspondingly, diffused GFP-Swi6 signals are observed throughout the nucleoplasm in clr4F449Y cells. Three representative cells for each genotype are presented. 18/18 clr4+, 15/16 clr4F449Y, and 0/10 clr4Δ cells had perinuclear localization of GFP-Swi6. c–g, Flag-Chp2 (c), and Flag-Clr3 (d), H3K9me3 (e), H3K9me2 (f), and Flag-Clr4 (g) ChIP-qPCR analysis at dg and dh in clr4 wild-type and mutant cells. Error bars, s.d.; n = 3 biological replicates.
Extended Data Figure 10. H3K9me3 is required for epigenetic inheritance of H3K9 methylation.

a–b, ChIP-qPCR analysis showing loss of H3K9me2 at the 10xtetO-ade6+ reporter gene (a) and the adjacent mug135+ gene (b) upon the release of tethered TetR-Clr4-I by the addition of tetracycline (− tet versus + tet). c, ChIP-qPCR analysis showing loss of H3K9me2 at pericentromeric dg and dh DNA repeats in ago1Δ clr4I418P double mutant cells. Arrowheads indicate the location of primers used for ChIP-qPCR. Error bars, s.d.; n = 3 biological replicates.
Supplementary Material
Acknowledgments
We thank R.C. Kunz (Thermo Fisher Scientific Center for Multiplexed Proteomics, Harvard Medical School) for performing the initial TMT/MS, the Nikon Imaging Center at Harvard Medical School for access to confocal microscopes, K. Connolly for help with imaging, C.K. Wong and Z. Moqtaderi for help with Illumina library construction and data processing, R. Yu for Python scripts, D. Holoch for the Swi6 antibody, R. Behrouzi, D. Holoch, and G. Shipkovenska for comments on the manuscript, and members of the Moazed lab for discussion. This work was supported by an NIH training grant (T32 GM007226) (G.J), an EMBO long-term fellowship and a Swiss National Science Foundation postdoctoral fellowship (N.I.), NIH RO1 GM072805 (D.M.), K01 DK098285 (J.A.P.), and RO1 GM110174 (B.A.G.). D.M. is a Howard Hughes Medical Institute Investigator.
Footnotes
Author Contributions G.J., N.I., M.A.C., and D.M. designed experiments. N.V.B. and J.A.P. performed MS analysis. G.J., N.I., and M.A.C. performed all other experiments. S.P.G., B.A.G., and D.M. supervised research. G.J., N.I., and D.M. wrote the paper.
The authors declare no competing financial interests.
References
- 1.Holoch D, Moazed D. RNA-mediated epigenetic regulation of gene expression. Nat Rev Genet. 2015;16:71–84. doi: 10.1038/nrg3863. [DOI] [PMC free article] [PubMed] [Google Scholar]
- 2.Castel SE, Martienssen RA. RNA interference in the nucleus: roles for small RNAs in transcription, epigenetics and beyond. Nat Rev Genet. 2013;14:100–112. doi: 10.1038/nrg3355. [DOI] [PMC free article] [PubMed] [Google Scholar]
- 3.Allshire RC, Ekwall K. Epigenetic Regulation of Chromatin States in Schizosaccharomyces pombe. Cold Spring Harb Perspect Biol. 2015;7:a018770. doi: 10.1101/cshperspect.a018770. [DOI] [PMC free article] [PubMed] [Google Scholar]
- 4.Volpe TA, et al. Regulation of heterochromatic silencing and histone H3 lysine-9 methylation by RNAi. Science. 2002;297:1833–1837. doi: 10.1126/science.1074973. [DOI] [PubMed] [Google Scholar]
- 5.Chan SW, et al. RNA silencing genes control de novo DNA methylation. Science. 2004;303:1336. doi: 10.1126/science.1095989. [DOI] [PubMed] [Google Scholar]
- 6.Shirayama M, et al. piRNAs initiate an epigenetic memory of nonself RNA in the C. elegans germline. Cell. 2012;150:65–77. doi: 10.1016/j.cell.2012.06.015. [DOI] [PMC free article] [PubMed] [Google Scholar]
- 7.Buckley BA, et al. A nuclear Argonaute promotes multigenerational epigenetic inheritance and germline immortality. Nature. 2012;489:447–451. doi: 10.1038/nature11352. [DOI] [PMC free article] [PubMed] [Google Scholar]
- 8.Aravin AA, et al. A piRNA pathway primed by individual transposons is linked to de novo DNA methylation in mice. Mol Cell. 2008;31:785–799. doi: 10.1016/j.molcel.2008.09.003. S1097-2765(08)00619-9 [pii] [DOI] [PMC free article] [PubMed] [Google Scholar]
- 9.Sienski G, Donertas D, Brennecke J. Transcriptional silencing of transposons by piwi and maelstrom and its impact on chromatin state and gene expression. Cell. 2012;151:964–980. doi: 10.1016/j.cell.2012.10.040. [DOI] [PMC free article] [PubMed] [Google Scholar]
- 10.Verdel A, et al. RNAi-mediated targeting of heterochromatin by the RITS complex. Science. 2004;303:672–676. doi: 10.1126/science.10936861093686. [pii] [DOI] [PMC free article] [PubMed] [Google Scholar]
- 11.Motamedi MR, et al. Two RNAi complexes, RITS and RDRC, physically interact and localize to noncoding centromeric RNAs. Cell. 2004;119:789–802. doi: 10.1016/j.cell.2004.11.034. S009286740401102X [pii] [DOI] [PubMed] [Google Scholar]
- 12.Buhler M, Verdel A, Moazed D. Tethering RITS to a nascent transcript initiates RNAi- and heterochromatin-dependent gene silencing. Cell. 2006;125:873–886. doi: 10.1016/j.cell.2006.04.025. S0092-8674(06)00514-9 [pii] [DOI] [PubMed] [Google Scholar]
- 13.Zhang K, Mosch K, Fischle W, Grewal SI. Roles of the Clr4 methyltransferase complex in nucleation, spreading and maintenance of heterochromatin. Nat Struct Mol Biol. 2008 doi: 10.1038/nsmb.1406. [DOI] [PubMed] [Google Scholar]
- 14.Bayne EH, et al. Stc1: a critical link between RNAi and chromatin modification required for heterochromatin integrity. Cell. 2010;140:666–677. doi: 10.1016/j.cell.2010.01.038. S0092-8674(10)00073-5 [pii] [DOI] [PMC free article] [PubMed] [Google Scholar]
- 15.Gerace EL, Halic M, Moazed D. The methyltransferase activity of Clr4Suv39h triggers RNAi independently of histone H3K9 methylation. Molecular Cell. 2010;39:360–372. doi: 10.1016/j.molcel.2010.07.017. [DOI] [PMC free article] [PubMed] [Google Scholar]
- 16.Yu Y, et al. Panoramix enforces piRNA-dependent cotranscriptional silencing. Science. 2015;350:339–342. doi: 10.1126/science.aab0700. [DOI] [PMC free article] [PubMed] [Google Scholar]
- 17.Sienski G, et al. Silencio/CG9754 connects the Piwi-piRNA complex to the cellular heterochromatin machinery. Genes Dev. 2015;29:2258–2271. doi: 10.1101/gad.271908.115. [DOI] [PMC free article] [PubMed] [Google Scholar]
- 18.Rangan P, et al. piRNA production requires heterochromatin formation in Drosophila. Curr Biol. 2011;21:1373–1379. doi: 10.1016/j.cub.2011.06.057. [DOI] [PMC free article] [PubMed] [Google Scholar]
- 19.Collins RE, et al. In vitro and in vivo analyses of a Phe/Tyr switch controlling product specificity of histone lysine methyltransferases. J Biol Chem. 2005;280:5563–5570. doi: 10.1074/jbc.M410483200. [DOI] [PMC free article] [PubMed] [Google Scholar]
- 20.Xiao B, et al. Structure and catalytic mechanism of the human histone methyltransferase SET7/9. Nature. 2003;421:652–656. doi: 10.1038/nature01378. [DOI] [PubMed] [Google Scholar]
- 21.Al-Sady B, Madhani HD, Narlikar GJ. Division of labor between the chromodomains of HP1 and Suv39 methylase enables coordination of heterochromatin spread. Mol Cell. 2013;51:80–91. doi: 10.1016/j.molcel.2013.06.013. [DOI] [PMC free article] [PubMed] [Google Scholar]
- 22.Li B, Carey M, Workman JL. The role of chromatin during transcription. Cell. 2007;128:707–719. doi: 10.1016/j.cell.2007.01.015. [DOI] [PubMed] [Google Scholar]
- 23.Ekwall K, Olsson T, Turner BM, Cranston G, Allshire RC. Transient inhibition of histone deacetylation alters the structural and functional imprint at fission yeast centromeres. Cell. 1997;91:1021–1032. doi: 10.1016/s0092-8674(00)80492-4. [DOI] [PubMed] [Google Scholar]
- 24.Motamedi MR, et al. HP1 proteins form distinct complexes and mediate heterochromatic gene silencing by nonoverlapping mechanisms. Mol Cell. 2008;32:778–790. doi: 10.1016/j.molcel.2008.10.026. S1097-2765(08)00806-X [pii] [DOI] [PMC free article] [PubMed] [Google Scholar]
- 25.Sugiyama T, et al. SHREC, an effector complex for heterochromatic transcriptional silencing. Cell. 2007;128:491–504. doi: 10.1016/j.cell.2006.12.035. [DOI] [PubMed] [Google Scholar]
- 26.Schalch T, et al. High-affinity binding of Chp1 chromodomain to K9 methylated histone H3 is required to establish centromeric heterochromatin. Mol Cell. 2009;34:36–46. doi: 10.1016/j.molcel.2009.02.024. [DOI] [PMC free article] [PubMed] [Google Scholar]
- 27.Ragunathan K, Jih G, Moazed D. Epigenetics. Epigenetic inheritance uncoupled from sequence-specific recruitment. Science. 2015;348:1258699. doi: 10.1126/science.1258699. [DOI] [PMC free article] [PubMed] [Google Scholar]
- 28.Audergon PN, et al. Epigenetics. Restricted epigenetic inheritance of H3K9 methylation. Science. 2015;348:132–135. doi: 10.1126/science.1260638. [DOI] [PMC free article] [PubMed] [Google Scholar]
- 29.Zhang X, et al. Structural basis for the product specificity of histone lysine methyltransferases. Mol Cell. 2003;12:177–185. doi: 10.1016/s1097-2765(03)00224-7. [DOI] [PMC free article] [PubMed] [Google Scholar]
- 30.Yu R, Jih G, Iglesias N, Moazed D. Determinants of heterochromatic siRNA biogenesis and function. Mol Cell. 2014;53:262–276. doi: 10.1016/j.molcel.2013.11.014. [DOI] [PMC free article] [PubMed] [Google Scholar]
- 31.Zeng PY, Vakoc CR, Chen ZC, Blobel GA, Berger SL. In vivo dual cross-linking for identification of indirect DNA-associated proteins by chromatin immunoprecipitation. BioTechniques. 2006;41:694, 696, 698. doi: 10.2144/000112297. [DOI] [PubMed] [Google Scholar]
- 32.Wong KH, Jin Y, Moqtaderi Z. Multiplex Illumina sequencing using DNA barcoding. Current protocols in molecular biology/edited by Frederick M. Ausubel … [et al.] 2013;Chapter 7(Unit 7):11. doi: 10.1002/0471142727.mb0711s101. [DOI] [PubMed] [Google Scholar]
- 33.Holoch D, Moazed D. Small-RNA loading licenses Argonaute for assembly into a transcriptional silencing complex. Nat Struct Mol Biol. 2015;22:328–335. doi: 10.1038/nsmb.2979. [DOI] [PMC free article] [PubMed] [Google Scholar]
- 34.Paulo JA, O’Connell JD, Gygi SP. A Triple Knockout (TKO) Proteomics Standard for Diagnosing Ion Interference in Isobaric Labeling Experiments. Journal of the American Society for Mass Spectrometry. 2016;27:1620–1625. doi: 10.1007/s13361-016-1434-9. [DOI] [PMC free article] [PubMed] [Google Scholar]
- 35.Huttlin EL, et al. A tissue-specific atlas of mouse protein phosphorylation and expression. Cell. 2010;143:1174–1189. doi: 10.1016/j.cell.2010.12.001. [DOI] [PMC free article] [PubMed] [Google Scholar]
- 36.Beausoleil SA, Villen J, Gerber SA, Rush J, Gygi SP. A probability-based approach for high-throughput protein phosphorylation analysis and site localization. Nat Biotechnol. 2006;24:1285–1292. doi: 10.1038/nbt1240. [DOI] [PubMed] [Google Scholar]
- 37.Elias JE, Gygi SP. Target-decoy search strategy for increased confidence in large-scale protein identifications by mass spectrometry. Nat Methods. 2007;4:207–214. doi: 10.1038/nmeth1019. [DOI] [PubMed] [Google Scholar]
- 38.Elias JE, Gygi SP. Target-decoy search strategy for mass spectrometry-based proteomics. Methods Mol Biol. 2010;604:55–71. doi: 10.1007/978-1-60761-444-9_5. [DOI] [PMC free article] [PubMed] [Google Scholar]
- 39.McAlister GC, et al. Increasing the multiplexing capacity of TMTs using reporter ion isotopologues with isobaric masses. Analytical chemistry. 2012;84:7469–7478. doi: 10.1021/ac301572t. [DOI] [PMC free article] [PubMed] [Google Scholar]
- 40.Sidoli S, et al. Sequential Window Acquisition of all Theoretical Mass Spectra (SWATH) Analysis for Characterization and Quantification of Histone Post-translational Modifications. Mol Cell Proteomics. 2015;14:2420–2428. doi: 10.1074/mcp.O114.046102. [DOI] [PMC free article] [PubMed] [Google Scholar]
- 41.Yuan ZF, et al. EpiProfile Quantifies Histone Peptides With Modifications by Extracting Retention Time and Intensity in High-resolution Mass Spectra. Mol Cell Proteomics. 2015;14:1696–1707. doi: 10.1074/mcp.M114.046011. [DOI] [PMC free article] [PubMed] [Google Scholar]
- 42.Recht J, et al. Histone chaperone Asf1 is required for histone H3 lysine 56 acetylation, a modification associated with S phase in mitosis and meiosis. Proc Natl Acad Sci U S A. 2006;103:6988–6993. doi: 10.1073/pnas.0601676103. [DOI] [PMC free article] [PubMed] [Google Scholar]
- 43.Sidoli S, Bhanu NV, Karch KR, Wang X, Garcia BA. Complete Workflow for Analysis of Histone Post-translational Modifications Using Bottom-up Mass Spectrometry: From Histone Extraction to Data Analysis. J Vis Exp. 2016 doi: 10.3791/54112. [DOI] [PMC free article] [PubMed] [Google Scholar]
- 44.Oeffinger M, et al. Comprehensive analysis of diverse ribonucleoprotein complexes. Nat Methods. 2007;4:951–956. doi: 10.1038/nmeth1101. [DOI] [PubMed] [Google Scholar]
Associated Data
This section collects any data citations, data availability statements, or supplementary materials included in this article.
Supplementary Materials
Data Availability Statement
The raw and processed ChlP-seq data are publicly available at the NCBI Gene Expression Omnibus under accession number GSE83495.