

Abstract
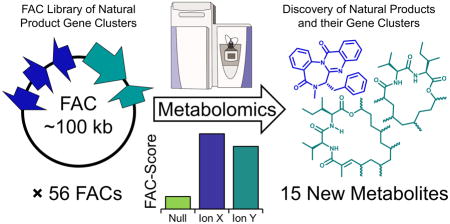
The genomes of filamentous fungi contain up to ~90 biosynthetic gene clusters (BGCs), encoding diverse secondary metabolites, an enormous reservoir of untapped chemical potential. However, recalcitrant genetics, cryptic expression, and unculturability prevent the systematic exploitation of these gene clusters and harvesting of their products. With heterologous expression of fungal BGCs largely limited to expression of single or partial clusters, we established a scalable process for expression of large numbers of full-length gene clusters, called FAC-MS. Using Fungal Artificial Chromosomes (FACs) with Metabolomic Scoring (MS) we screened 56 secondary metabolite BGCs from diverse fungal species for expression in A. nidulans. Fifteen new metabolites were discovered and confidently assigned to their BGCs. A new macrolactone, valactamide A, and its hybrid PKS-NRPS gene cluster were characterized extensively using this integrated platform. Regularizing access to fungal secondary metabolites at an unprecedented scale stands to revitalize drug discovery platforms with renewable sources of natural products.
Graphical Abstract
INTRODUCTION
It is estimated that there are between five hundred thousand and three million ascomycete fungal species on earth1, containing on the order of 50 to 90 BGCs encoding the production of secondary metabolites2–4. However, translating this vast biosynthetic potential of fungal genomes into defined and renewable chemical libraries has proven challenging, with most progress being made in only the handful of fungal species with well-established genetic tools, such as Aspergillus nidulans5–7. Ascomycete fungi represent a tremendous source of natural products, however the industrial scale exploitation of their 20–40 megabase genomes awaits a technology that can access their content in a robust, deterministic fashion with established rates of return.
Discovery of new molecules through expression of secondary metabolite BGCs in heterologous hosts offers many advantages complementing direct studies of secondary metabolism in wild-type fungi. Advantages of heterologous expression include the easy association of mass spectrometry detected metabolites with their biosynthetic gene cluster, production of silent metabolites (i.e. metabolites which are not typically observed to be produced by a given species, but whose BGCs are present), facile genetic dissection of metabolite biosyntheses, overproduction of valuable metabolites, and engineering of metabolites through synthetic biology approaches.
The attractiveness of heterologous reconstitution has led to several reports on the reconstitution of individual megasynthase backbone genes8–11 and entire BGCs12, 13 to produce intermediates or final products of fungal secondary metabolism13–16. However, reports on intact clusters have been limited to analysis of only one or two clusters at a time. Since these reports have used expression vectors such as yeast artificial chromosomes, which are unstable and difficult to handle, or cosmids and fosmids, which are often not large enough to encode complete secondary metabolite BGCs, they require substantial optimization for each construct8, 17. For example, based on antiSMASH18 gene cluster predictions, the 56 complete clusters analyzed in the present report range from 38,211 bp to 108,634 bp in size, meaning they are all at or beyond the size limit of normal fungal heterologous expression approaches. In the case of studies reporting analysis of partial clusters or individual megasynthase genes, no more than 9 megasynthases have been analyzed in a single study, to our knowledge14. One possible reason for this limited scale is the lack of an effective metabolomic strategy. Specifically, there has not been a method reported to quickly differentiate heterologous expression products from the thousands of compounds in the heterologous host’s endogenous metabolome, a critical requirement to deploying a general method for discovery of new metabolites in a scalable fashion.
To address the challenge of heterologously expressing large fungal gene clusters, fungal artificial chromosomes (FACs) can be used to capture randomly sheared fungal genomic DNA with insert sizes up to 300 kb—large enough to contain full-length BGCs with their accessory genes and regulatory elements. A FAC has been successfully used to produce the known metabolite terezine D from its biosynthetic gene cluster through a fungal expression host, demonstrating that FACs are able to act as fungal expression vectors19. However, this approach has not been used for natural product discovery or for large scale screening of fungal BGCs because there is not a tool to sift novel FAC-encoded secondary metabolites of unknown formulae from the thousands of LC-MS signals generated by untargeted analysis of the fungal host’s metabolome.
Here, we report the FAC-MS pipeline and combine large scale generation of FACs with a robust screening and scoring pipeline employing untargeted metabolomics and genetic validation (Fig. 1). Using the FAC-MS approach we screened a library of 56 FACs harboring uncharacterized fungal BGCs from three diverse species within the Aspergillus genus: A. terreus, A. aculeatus, and A. wentii. We detected and confidently assigned 17 compounds to their BGCs, including polyketides, non-ribosomal peptides, and terpenoids. These 17 metabolites were produced by 15 different FACs, including one FAC that expressed three distinct products. Of the 17 metabolites detected and associated with their BGCs, 15 were previously unreported based on secondary metabolite databases, representing newly identified secondary metabolites. Most of these novel metabolites were silent (i.e. not detectable by LC-MS) in their native fungal hosts under the conditions examined. Also among the 17 secondary metabolites detected was the benzodiazepine, benzomalvin A (1), whose BGC was previously unknown. We demonstrate the flexibility of the FAC-MS pipeline by introducing a series of genetic deletants into the FAC encoding benzomalvin to allow the analysis of its biosynthesis for the first time. Furthermore, we demonstrate that the FAC-MS process enables the purification and structural elucidation of new molecules, including the macrolactone valactamide A with a new scaffold produced by a hybrid non-ribosomal peptide synthetase-polyketide synthase (NRPS-PKS) gene cluster.
Figure 1. The FAC-MS Pipeline.

(a) FACs were generated from randomly sheared genomic DNA and cloned into self-replicating E. coli-fungal shuttle vectors. A library of 156 FACs was prepared, each FAC putatively containing at least one unique BGC from A. nidulans, A. wentii, or A. aculeatus. (b) Transformation into the heterologous expression host (A. nidulans), growth, and metabolite extraction was carried out for 56 FACs predicted by bioinformatics to encode novel, uncharacterized BGCs. (c) Untargeted high resolution LC-MS/MS analyses of secondary metabolite extracts from each FAC were carried out. (d) Untargeted feature detection and application of the novel FAC-Score were used to identify FAC-encoded secondary metabolites detected from the complex host metabolic background in a systematic manner. (e) Biosynthetic backbone genes for FAC-Score predicted secondary metabolites were deleted from their FACs and retransformed into A. nidulans. (f) FACs with gene deletions were rescreened by LC-MS to validate the role of the deleted gene in production of each secondary metabolite, confirming the elimination of the predicted metabolite by backbone gene deletion and allowing the detection of biosynthetic intermediates.
RESULTS
FAC library creation and screening
A library of FACs was created by capturing ~100 kb inserts of randomly sheared genomic DNA from A. wentii (strain DTO 134E9) and A. aculeatus (strain ATCC16872), encompassing 95 FACs, each predicted to contain at least one BGC for a secondary metabolite. We combined these 95 FACs with our previously reported library of 61 FACs from A. terreus (strain ATCC 2054219) to give a final library containing 156 FACs spanning ~15 Mb of DNA. We chose the three species used for the FAC library because they are expected to possess distinct chemical repertoires as they are phylogenetically distant Aspergilli 20.
Previously, we reported successful production of the known fungal secondary metabolite terezine D using a FAC19. To test the possibility of using FACs to pursue high-throughput discovery of new secondary metabolites, 56 FACs were selected because they were predicted to contain uncharacterized BGCs, (i.e. BGCs with no known product or well-characterized homolog; Online Methods and Fig. 1a). Each FAC was transformed into A. nidulans for growth and extraction of metabolites (Fig. 1b). Extracts from the 56 FAC-transformed strains (each grown in biological quadruplicate, repeated from the step of FAC-transformation) were then subjected to LC-MS and automated detection of compounds using XCMS21 (Fig. 1c).
Metabolomic scoring of FAC library
After compound detection, we applied a new scoring system developed for FAC-MS featuring a FAC-Score to help identify heterologously expressed metabolites from complex mixtures (Online Methods and Fig. 1d) by filtering out signals present in host extracts or in more than one FAC-strain. In our previous report19, we were unable to identify novel metabolites produced by FAC-encoded gene clusters due to the lack of an effective mechanism to sort through the ~5,000 LC-MS signals detected from each FAC-transformed strain. The FAC-Score simultaneously examined the abundance of a compound across all controls and FAC-transformed strains, assigning high scores to compounds detected in only one FAC-strain and lower scores to compounds detected in multiple FAC-strains or in negative controls. Thus, the FAC-Score allowed the data from 56 FACs to be filtered in order to eliminate endogenous host metabolites. FAC-Scores ranged from −1.9 to 9.6, where values >0 represented compounds likely to be produced by enzymes encoded on the FAC (Supplementary Results, Supplementary Fig. 1). Application of the FAC-Score to the dataset generated from the library of 56 FACs immediately reduced the data for analysis from thousands of compounds per strain to typically one or a handful of top-scoring compounds per strain. In 29 out of 56 FACs the top-scoring compound had a score >0. Each top-scoring compound was then manually analyzed to validate its uniqueness to a single FAC-strain. Sixteen of the 29 compounds were found to be unique to a single FAC-strain, while the other 13 could arguably be detected at very low levels either in negative controls or other FAC-strains, preventing a high confidence assertion that their presence was exclusively FAC-dependent. For the sake of conservatism, these 13 were excluded from further analysis in this study.
One possible source of false positives in FAC-MS could be if a FAC perturbed the host metabolome, leading to compounds with high FAC-Scores that are actually upregulated host metabolites. To empirically validate that detected metabolites were indeed produced by their assigned BGCs, a backbone gene (i.e. a PKS or NRPS gene) was deleted from each FAC (Fig. 1e, Table 1, Supplementary Fig. 2a–q). FACs with backbone gene deletions were then retransformed into the host and analyzed by LC-MS to determine if the signals from the small molecule product(s) with high FAC-Scores were indeed eliminated (Fig. 1f). Importantly, because engineered FACs were generated and propagated in E. coli, this deletion step was facile, eliminating the need for complex genetic manipulation in the parent fungal strains. Due to the difficulty of genetic manipulations, this step is often a major obstacle in studies of secondary metabolite biosynthesis. Of the 16 FAC-strains and putative metabolite products identified from different FACs using the FAC-Score, 15 were supported by the deletion (meaning deletion of the backbone gene lead to elimination of the associated metabolite assigned by the FAC-Score) and one was refuted.
Table 1.
FAC-encoded secondary metabolites detected.
| Species | FAC | FAC-Score | Metabolite Name | Exact Mass | Molecular Formula | Gene Deleted | Cryptic? |
|---|---|---|---|---|---|---|---|
| A. aculeatus | AaFAC6A16 | 8.9 | facms0001 | 402.195 | C25H26N2O3 | NRPS | No |
| A. aculeatus | AaFAC2P8 | 4.9 | facms0002 | 558.226 | C29H30N6O6 | NRPS | Yes |
| A. aculeatus | AaFAC10D7 | 4.5 | facms0003 | 273.028 | C13H7NO6 | PKS | Yes |
| A. terreus | AtFAC9J20 | 9.6 | facms0004/ benzomalvin A | 381.147 | C24H18N3O2 | NRPS | No |
| A. terreus | AtFAC9J20 | 5.6 | facms0005 | 368.27 | C25H36O2 | Terpene Synthase | No |
| A. terreus | AtFAC5L7 | 5 | facms0006 | 673.261 | C36H39N3O10 | NRPS | No |
| A. terreus | AtFAC9H19 | 1.5 | facms0007 | 609.918 | NDa | PKS | Yes |
| A. terreus | AtFAC5N15 | 1.2 | facms0008 | 277.204 | C17H27NO2 | NRPS | Yes |
| A. wentii | AwFAC1H17 | 6 | facms0009 | 422.172 | C25H26O6 | NRPS | Yes |
| A. wentii | AwFAC1K8 | 5.6 | facms0010 | 987.55 | NDa | PKS | Yes |
| A. wentii | AwFAC4D8 | 4.8 | facms0011 | 679.349 | C38H45N7O5 | NRPS | Yes |
| A. wentii | AwFAC4E11 | 3.8 | facms0012 | 576.31 | C35H44O7 | PKS | Yes |
| A. wentii | AwFAC1B1 | 3.5 | facms0013 | 471.202 | C24H29N3O7 | NRPS | Yes |
| A. wentii | AwFAC3D3 | 2.6 | facms0014 | 735.198 | C41H29N5O9 | NRPS | Yes |
| A. wentii | AwFAC4D17 | 1.4 | facms0015 | 541.378 | C33H51NO5 | NRPS | Yes |
| A. terreus | AtFAC7O19 | 5.6 | facms0016 | 309.111 | C17H15N3O3 | NRPS | No |
| A. terreus | AtFAC9J20-ΔbenY | 23.6 | facms0017/valactamide A | 506.408 | C30H54N2O4 | NRPS/PKS | No |
Molecular formula not determined.
Discovery and validation of FAC metabolites
The results of screening 56 FACs from three species, each encoding a previously uncharacterized BGC, are shown as a bar graph of FAC-Scores in Supplementary Figure 1. Supplementary Figure 2 shows a gene cluster diagram for each of the 15 validated FACs with an identified secondary metabolite product. The corresponding molecular formulae, specific backbone gene deletions confirming the metabolite, and partial LC-MS traces for backbone gene deletions and parent strains are also included (Table 1).
To distinguish known vs. novel compounds, we dereplicated the top scoring metabolites from each FAC-strain against the exact masses of ~280,000 known natural products from the Dictionary of Natural Products (http://dnp.chemnetbase.com; Online Methods). Also, observed MS2 spectra of metabolites were compared to computationally predicted MS2 spectra of compounds in PubChem (using the program MAGMa Online, https://www.emetabolomics.org; Online Methods)22. Of the 15 compounds, 14 could not be matched to known molecules in this manner, indicating they represented novel secondary metabolites. The 15th compound (Supplementary Fig. 2a), which had the highest FAC-Score from the A. terreus-derived FAC designated as AtFAC9J20, was predicted to be an atropisomeric mixture of the orphan benzodiazepines, benzomalvin A (1) and benzomalvin D (2) (Fig. 2a), based on molecular formula and MS2 spectra. AtFAC9J20 also expressed several other high scoring compounds which were unrelated to benzomalvin, leading to two additional compounds (Supplementary Fig. 2b–c), each from a distinct gene cluster but all encoded on this FAC (vide infra).
Figure 2. Analysis of benzomalvin A/D biosynthesis.

(a) Based on the deletant data, the biosynthesis of benzomalvin A/D is proposed to occur through the enzymes BenX, BenY, and BenZ, followed by the production of benzomalvins E and B at low levels either through a host cytochrome P450 enzyme (benzomalvin E, 3) or through spontaneous elimination of water (benzomalvin B, 4). Wavy lines indicate phosphopantetheine thioesters; [O] = oxygen. (b and c) The ion abundances of predicted benzomalvin precursors and products are shown for AtFAC9J20, AtFAC9J20-null (simultaneous deletion of all ORFs from benX to valA is shown in Supplementary Table 2), AtFAC9J20-ΔbenX, AtFAC9J20-ΔbenY, and AtFAC9J20-ΔbenZ. Abundances are averages from analysis of biological replicates from the point of fungal transformation. Error bars reflect standard deviation (n=4). b shows the full chart and c is an inset of the area enclosed by the black box in b. The dotted gray line represents the normalized level of each precursor in AtFAC9J20. Bars are color-coded to the intermediates and products shown in a. Deletants of benY and benZ both abolish the signal of each intermediate and product, with the exception of the dipeptide Anth-NmPhe in the case of benY. Deletion of benX substantially decreases, but does not eliminate the levels of each product and intermediate, consistent with the presence of host methyltransferase activity.
We derived FAC AtFAC9J20 from an unsequenced strain of A. terreus ATCC 20542 (from nucleotide 2,151,734 to the telomeric end of chromosome 4). The FAC contained an insert of 102,722 bp that was sequenced (GenBank Accession # KX449366), aligned to the comparable region in the reference A. terreus strain NIH 2624, and annotated (Supplementary Tables 1, 2 and Supplementary Fig. 3). AtFAC9J20 contained a ~36 kb DNA sequence toward the telomeric end that was missing from the NIH2624 reference genome, as well as large insertions, deletions, duplications, inversions, and other genetic variations compared to the same region in NIH 2624 (Supplementary Fig. 3 and Supplementary Tables 1, 2). To map the backbone genes to their metabolite products, and demonstrate the utility of FAC-MS to analyze complex biosynthetic systems, deletants of each predicted backbone gene from AtFAC9J20 were produced to readily assign biosynthetic genes to metabolites and dissect their biosynthetic pathways (Supplementary Table 3). The dissections of three gene clusters for three distinct scaffolds are described in turn below.
Identification of benzomalvin A/D from AtFAC9J20
The highest scoring small molecule from AtFAC9J20, an ion with an m/z = 382.1547 and two different retention times of 38 and 41 min, was predicted to be benzomalvin A/D as described above. Prediction of chemical formula from the accurate mass gave C24H19N3O2, matching that of neutral benzomalvin A/D within 1 part-per-million: (observed: 381.1474, theoretical: 381.1477 Da). This identification was also consistent with the observation of two chromatographic peaks, since benzomalvin A is reported to be in conformational equilibrium with its atropisomer, benzomalvin D, explaining the presence of two LC peaks at different retention times (Supplementary Fig. 4)23. We unambiguously confirmed the identity of the compound by total synthesis of an LC-MS standard for the two atropisomers and direct comparison to the observed products of AtFAC9J20, including through coinjection of the standard and the AtFAC9J20 extract (Supplementary Fig. 5). The benzomalvin BGC is not previously reported, and benzomalvins display inhibition against human 2,3-indoleamine dioxygenase and the neuroreceptor for substance P called NK124, 25.
Extracts from wild-type A. terreus strain 20542 (the strain used to construct FACs) also contained benzomalvin A/D based on matching retention times, accurate mass, and MS2 data (Supplementary Fig. 5), though at ~350-fold lower abundance than in the AtFAC9J20-containing host (Supplementary Fig. 6). By contrast, benzomalvin A/D was not detected in the sequenced reference strain, A. terreus NIH 2624. Additionally, two other known benzomalvins, benzomalvins E (3) and B (4; Fig. 2a), were putatively detected in AtFAC9J20 and A. terreus ATCC 20524 based on accurate mass. To analyze benzomalvin biosynthesis in detail, we made and analyzed deletants of the newly-named genes benX, benY, and benZ from AtFAC9J20 by LC-MS (Fig. 2b–c). Interestingly, deletion of benY led to accumulation of the predicted benzomalvin A/D dipeptide precursor, anthranilate-N-methylphenylalanine (Anth-NmPhe), while deletion of benZ eliminated the dipeptide precursor. Deletion of the predicted SAM-binding methyltransferase gene benX led to a ten-fold decrease in benzomalvin A/D level, but not its complete abolishment (Fig. 2b–c), suggesting a promiscuous host methyltransferase enzyme partially rescuing the benX deletant. Figure 2b–c shows the level of benzomalvin A/D in each deletant, as well as the levels of the following putative biosynthetic precursors and products identified by MS1: Anth-NmPhe, Anth-NmPhe-Anth, the 11-member macrocyclic intermediate, benzomalvin E, and benzomalvin B. Deletant data and bioinformatic analyses were used to propose a model of benzomalvin A/D biosynthesis (Fig. 2a, Supplementary Fig. 7).
Identification of a sesterterpenoid from AtFAC9J20
AtFAC9J20 produced many high-scoring compounds, raising the exciting prospect that a single FAC could express multiple intact BGCs and that FAC-MS combined with genetic deletants could quickly tease this out. Another compound with FAC-Score = 5.6 was found to also be unique to AtFAC9J20. The compound had a molecular cation with m/z = 369.2783 and predicted molecular formula for the neutral compound of C25H36O2 (observed: 368.2703 Da, theoretical: 368.2715 Da, error: −3 ppm), (Supplementary Fig. 8); it also had MS2 fragment ions characteristic of a terpenoid. This molecular formula is reported for four closely related members of the ophiobolin family of sesterterpenoid natural products from A. ustus, as well as the sesterterpenoid variecolin from A. variecolor26–29 (Supplementary Fig. 9). The observed ion was also present in extracts of both A. terreus NIH2624 and A. terreus ATCC 20542, suggesting its biosynthetic machinery would be shared by AtFAC9J20 and NIH2624. AtFAC9J20 contains an adjacent predicted terpene synthase gene sttA and cytochrome P450 gene sttB which are also present in A. terreus NIH2624 (Fig. 3a, Supplementary Fig. 3a). To test the roles of these genes in sesterterpenoid biosynthesis, we deleted them individually from AtFAC9J20 (Supplementary Table 2), leading to elimination of the sesterterpenoid product in both cases (Fig. 3b and Supplementary Fig. 10), identifying sttA and sttB as a sesterterpenoid BGC that definitively produces a metabolite with the molecular formula of C25H36O2.
Figure 3. Analysis of 3 gene clusters on AtFAC9J20.

(a) Map of the AtFAC9J20 construct [118,762 bp = 102,722 (insert) + 16,040 (vector) bp] and biosynthetic products, showing the genes identified as producing three distinct secondary metabolites, and their corresponding products. Purple, benzomalvin BGC; green, sesterterpenoid BGC; teal, valactamide BGC. (b) Effect of FAC backbone gene deletants on the ion abundances of biosynthetic products of AtFAC9J20, colored as in a. Deletants unambiguously confirm assignment of BGCs to the three observed products. Abundances are averages from analysis of biological replicates from the point of fungal transformation. Error bars reflect standard deviation (n=4).
Identification of a new metabolite named valactamide A
To determine if the additional highly reducing PKS (HRPKS, valA) or NRPS (valB) genes on this FAC were able to produce a product, a host harboring AtFAC9J20-ΔbenY was subjected to the FAC-MS pipeline with the hope that inactivation of the benzomalvin BGC would lead to increased activity of other clusters or improved FAC-Scores for new compounds (or both). Strikingly the top ion, initially given the platform name facms0017 (Table 1), received the highest FAC-Score in our study (23.6); it had an m/z of 507.4152 and a predicted molecular formula of C30H54N2O4 (observed: 506.4079 Da, expected: 506.4084 Da, Supplementary Fig. 11). Facms0017 was also present in extracts from A. terreus ATCC 20542, as well as AtFAC9J20 (Supplementary Fig. 12). Deletion of either valB or valA eliminated facms0017 completely (Fig. 3b). Analysis of MS2 data from facms0017 revealed immonium ions and neutral losses matching Val and either Ile or Leu, consistent with the prediction that the two A domains incorporate branched aliphatic amino acids based on their Stachelhaus codes30 (Supplementary Table 4, Supplementary Fig. 11). The molecular formula also indicated that the protein ValA (the HRPKS) must act iteratively in order to introduce enough ketide units31, 32. A basic local alignment search tool (BLAST) analysis of ValA revealed that its closest annotated match was the iterative lovastatin diketide synthase from A. terreus, LovF, which uses an acetyl and malonate unit to produce α-methyl butyrate (31% amino acid identity and E-value = 0.0)33.
In order to determine the structure of facms0017, we purified ~0.2 mg and analyzed it by 1H and 13C NMR spectroscopy, as well as 2-dimensional correlation spectroscopy using COSY, HMBC, and HSQC methods (Online Methods, Supplementary Figs. 13–18, Supplementary Table 5). Analysis of the structure of facms0017 revealed a novel scaffold containing Val and Ile residues, as well as a branched aliphatic chain which is cyclized at its terminus to form a 20-member macrolactone (Fig. 4). The absolute stereochemical configurations of the Val and Ile residues were confirmed as the natural L configuration using Marfey’s Reagent (Supplementary Fig. 19), consistent with the apparent absence of an epimerase domain in the gene cluster. Based on its chemical structure, the platform name facms0017 was replaced with the common name, “valactamide A” (5; Table 1, Fig. 4).
Figure 4. Structure and proposed biosynthesis of valactamide A (facms0017).

The structure of the macrolactone product of the hybrid NRPS-PKS gene cluster found on AtFAC9J20, valactamide A, and its proposed biosynthesis. The atoms proposed to originate from the acetyl starter unit are shown in blue. Methyl groups likely incorporated by the ValA MT domain are shown in red (methyl substituent stereochemistry not determined). Each backbone ketide unit is highlighted as a thick black bond. The ValB-derived amino acid residues are shown in pink. The structure of valactamide A was determined by MS and NMR; all other structures shown are hypothetical.
Using molecular genetic evidence from deletions of valB and valA and high resolution MS1 and MS2 data, we assert that AtFAC9J20 produces a family of valactamide metabolites, valactamides A–H (Supplementary Fig. 20). These family members were distinguished by incorporation of different numbers of ketide units (ranging from 5 to 8), and the presence or absence of the α,β alkene. All shared the macrolactone architecture of valactamide A, with ring sizes ranging from 16–22 atoms. Deletion of either valA or valB eliminated all these metabolites from the metabolome of AtFAC9J20, further supporting that they were produced by the valactamide gene cluster (Supplementary Fig. 21). Each metabolite also shared the same diagnostic MS2 fragment ions with valactamide A that correspond to the presence of Val and Ile residues and several additional MS2 fragments in the 50 to 200 m/z region, confirming their structural relationship (Supplementary Fig. 22).
The proposed biosynthesis of valactamide A is shown in Figure 4 and is consistent both with the structure of valactamide A and the domain architectures of valA and valB. An acetyl starter unit is incorporated by the KS domain of the iterative HRPKS enzyme ValA, followed by subsequent incorporation of six malonyl-CoA derived ketide units, each of which is fully reduced to the alkane form by the action of ketoreductase (KR), dehydratase (DH), and enoylreductase (ER) domains (except for the penultimate unit which is only reduced to the alkene). The final five ketide units are each proposed to be α-methylated by the methyltransferase (MT) domain prior to ketone reduction by the KR domain. The C1 domain of ValB then catalyzes amide bond formation between the heptaketide chain and L-Val attached to the T1 domain (Fig. 4), consistent with prior biochemical studies on hybrid HRPKS-NRPS systems34, 35. Chain elongation is then carried out by the C2 domain incorporating L-Ile, followed by macrolactonization by the CT domain to release the final product. Product release and ring formation by the CT domain aligns well with reports that terminal C domains typically carry out cyclizations in fungal assembly lines 32, 36.
The relative LC-MS abundance for the 8 metabolites in the valactamide family revealed that valactamide A contributed ~95% of the ions attributable to the cluster. The hexaketide products, valactamides B and C, contributed about 3% and 1%, respectively (Supplementary Table 6). Products with either five or eight ketides (valactamides E-H) appeared much less abundant, accounting for between 0.1% and 0.004% of total valactamide signal. Interestingly, the α, β-saturated form of valactamide A, named valactamide D, accounted for only 1% of the signal from the family. This suggests that reduction of the α,β-alkene is strongly disfavored at this site for the heptaketide intermediate, either because it hinders downstream steps of the biosynthesis (and thus not much of the final macrolactone is produced), or because the ER domain of ValA is selective against the heptaketide intermediate. Previously, it has been shown that α- and γ-carbon methylation is important for intermediate transfer between iterative HRPKS and NRPS assembly lines in some systems32, 34. Our result may suggest that an α, β-alkene can also be recognized by the “programming” of iterative HRPKS enzymes to control intermediate length and release.
DISCUSSION
Untargeted metabolomics, empowered by the increasing availability of Fourier transform mass spectrometers, allows natural product discovery by accurate mass37, 38. However, a major challenge in domesticating microbial sources of natural products lies in differentiating LC-MS signals for secondary metabolites versus those from other molecules produced by the host or organism being studied. For example, while the fungus A. nidulans harbors gene clusters for ~50 secondary metabolites and likely only expresses a fraction of these at any given time39, untargeted LC-MS analysis of its metabolome leads to detection of ~5,000 compounds. Even after advanced data processing with programs such as CAMERA40 which help filter out noise and isotope peaks, ~1,000 compounds typically remain, the majority of which likely do not come from secondary metabolites.
To address this challenge, FAC-Scores combined with data from large-scale LC-MS screening of 56 heterologously expressed BGCs simplified the process of discovery from three different species. Importantly, because FACs are fungal–E. coli shuttle vectors, quick cycles of genetic deletions and targeted testing enabled the direct validation of metabolite–gene cluster identifications (Table 1, Supplementary Fig. 2). Genetic validation was an important part of this study since it reduced the possibility that predicted metabolites were artifacts of the host metabolome. Genetic disruption also facilitated investigation of biosynthesis, as demonstrated for both benzomalvin A and the novel macrolactone, valactamide A. It is notable that the structure of valactamide A was solved without extensive FAC engineering (such as introducing an inducible promoter). However, some metabolites discovered by FAC-MS may require overexpression to enable structure elucidation.
Intriguingly, of the 15 new metabolites reported in this study, 11 were not detected in their parent fungi under the same growth conditions (Supplementary Fig. 2). This may indicate that the FAC-MS platform can force the expression of clusters which are silent under similar growth conditions in the parent fungus (Table 1). Two out of seven A. terreus metabolites were silent in the parent strain, while seven out of seven A. wentii metabolites were silent. One possible explanation for this difference may be tied to phylogenetic relatedness between the native hosts and the heterologous host. A. terreus may retain more pro-repressive regulatory mechanisms since it is more closely related to the heterologous host than A. wentii20. Future work will seek to reveal what determines successful FAC-based production of metabolites and whether there is a relationship between the rate of silent metabolite activation and the biological origin of FAC-encoded BGCs. We also plan to develop methods to “turn on” FAC-encoded clusters for those metabolites not detected confidently by the current FAC-MS implementation.
Here, we have demonstrated that FAC-MS can be used to systematically express, discover, and characterize novel secondary metabolites from the phylogenetically diverse Aspergilli A. terreus, A. aculeatus and A. wentii. As the FAC-MS platform is applied to increasingly exotic fungi, the high-throughput discovery of new molecules from hundreds and even thousands of fungal species will become feasible. The greatly improved access to new compounds will enable both the systematic mapping of fungal secondary metabolism and the regularized introduction of natural products into pharmaceutical and agricultural screening campaigns.
ONLINE METHODS
Generation of FACs from Aspergilli
Unbiased random shear FAC libraries of fungi were generated using high molecular weight (HMW) genomic DNA of the Aspergillus species A. aculeatus and A. wentii. BGC-containing FACs were identified by FAC end sequences aligned with their reference genomes and confirmed through PCR. FAC BCGs from the A. aculeatus, A. terreus and A. wentii genomes were predicted by the software program Secondary Metabolite Unique Regions Finder (SMURF, http://jcvi.org/smurf/run_smurf.php). We were able to capture the entire sets of 48 BGCs of A. aculeatus and 47 BGCs from A. wentii each on individual FAC clones, and these were added to our previous library of 61 BGC-containing FACs from A. terreus (for a total library size of 156 FACs). Of the 61 A. terreus FACs, 56 were previously reported by our team and 5 were drawn from the same FAC clone library as previously reported, but were only added to the original 56 for the current study due to identification of new putative BGCs. Alignment with the appropriate reference genomes led to confirmation of 156 FACs each encoding at least one predicted BGC of A. wentii, A. terreus, or A. aculeatus. The backbone of the FAC vector allows self-propagation in both A. nidulans and E. coli through inclusion of the autonomous fungal replicating element AMA119, making amplification, manipulation, and heterologous expression of secondary metabolites (SMs) facile at all stages (Fig. 1). After excluding previously characterized BGCs using multigene sequence alignment, we randomly selected 56 FACs for further studies (drawn from all three species, Supplementary Table 7). High quality DNA was prepared from 200 mL each of FAC LB cultures with a FAC/BAC DNA preparation kit (Intact Genomics), and FAC DNA was dissolved in 200 μL of 10 mM Tris-HCl pH 8.0 for subsequent transformation and secondary metabolite screening.
Transformation of FACs into Host Strain
To improve transformation yield, we modified a published method19. Two μg of FAC DNA were mixed with 10 mM Tris-HCl in a 1.5 mL microcentrifuge tube to 50 μL and incubated on ice for one hour to improve FAC DNA solubility, then mixed with 50 μL of sorbitol-Tris-HCl-CaCl2 (STC: 1.2 M sorbitol, 10 mM Tris–HCl, 50 mM CaCl2, pH 7.5) just before transformation. One hundred μL of 107 protoplasts/mL was gently mixed with the preincubated 100 μL sample containing 2 μg FAC DNA. The tube with the protoplast and DNA mixture was incubated 30 min on ice, and 200 μL of 30% PEG-4,000 with 50 mM CaCl2 was laid under the sample before centrifuging the mixture for 5 min at 250 x g. The sample was gently mixed using an autopipette with a wide tip before gentle tapping. This mixture was additionally incubated for 15 min at room temperature before 1 mL of STC buffer was added. After transferring the mixture into a 13 mL tube, an additional 5 mL of STC was added into the tube and gently mixed. One mL of this final solution was distributed onto regeneration media (glucose minimal medium (GMM) with 1.2M sorbitol and pyridoxine (1mL of 0.1% stock solution) as a supplement) and incubated 3 days at 37°C incubator to obtain transformants.
Fungal Culture and Extraction of Secondary Metabolites
Each A. nidulans FAC transformant was inoculated on four solid GMM plates supplemented with pyridoxine and incubated for six days at 37°C according to standard methods41. Also each parental wild type strain including A. terreus NIH2624, A. terreus ATCC 20542, A. wentii and A. aculeatus was inoculated on four GMM plates and incubated for 10 days at 30°C. Subsequently, the entire contents of the plates were collected and lyophilized for 48 hours. Samples were then pulverized with mortar and pestle prior to the addition of methanol. Air-dried methanol extracts were prepared using a speed-vac system (Savant SpeedVac Concentrator, SC250EXP-115) then further extracted with organic solvent (chloroform:methanol:ethylacetate, 8:1:1). Organic extracts were evaporated to dryness in a speed-vac and stored at −20°C until analysis.
Untargeted Metabolomic Screening of FAC Extracts
Dried SM extracts from 4 complete biological replicates of each A. nidulans FAC strain, or extracts from A. terreus NIH2624, A. terreus ATCC 20542, A. wentii and A. aculeatus were resuspended to a concentration of 2 mg/mL by addition of 50% acetonitrile, followed by bath sonication for 10 minutes. Insoluble material was removed by centrifugation at 21,000 × g for 10 minutes. The supernatant of each reconstituted extract was then transferred to an LC-MS autosampler vial and stored at 4°C until analysis on the same day. Four biological replicates were used based on standard practices for untargeted metabolomic analyses of lab-cultured microbial samples. After analysis, samples were stored at −80°C, and it was our experience that samples could be stored indefinitely this way.
Samples were analyzed by high resolution HPLC-MS/MS using a Thermo Q-Exactive in line with an electrospray source and an Agilent 1200 series high performance liquid chromatography stack (HPLC) consisting of a binary pump, degasser, and autosampler, outfitted with a Phenomenex Luna C-18 column with dimensions of 2 mm × 150 mm, 3 μm dp. A binary linear gradient of water and acetonitrile balanced with 0.1% formic acid was used (Buffer A: H2O, Buffer B: acetonitrile) and 50 μg of extract (25 μL) was injected. The gradient was as follows: at 0 minutes: 2% B, 35 minutes: 70% B, and 54 minutes: 98% B, with a flow rate of 200 μL/min. A 1:4 split was used to transfer sample from the column to the electrospray source, so the flow rate into the ESI source was 40 μL/min. The capillary of the ESI source was set to 275°C, with sheath gas set to 5 arbitrary units and spray voltage set to 3.5 kV. MS1 data was collected at 70,000 resolution from 150 to 2,000 m/z. MS2 scans for the 5 most abundant ions in each MS1 scan were collected at a resolution of 35,000, with a 60 s dynamic exclusion list. Fragmentation was achieved using the higher energy collisional dissociation (HCD) cell set to a NCE value of 30. To minimize the effect of instrumental drift over time, samples were run in a randomized queue. All FACs from a given species were analyzed together (biological quadruplicates) in a single sequence, along with a set of biological quadruplicates from the A. nidulans host harboring an empty FAC vector with no insert. Extracts from A. terreus NIH2624, A. terreus ATCC 20542, A. wentii and A. aculeatus were run in the same manner, but separate from FAC-strains to prevent carryover. Untargeted LC-MS data will be uploaded to the database GNPS42.
Feature Detection of Untargeted Metabolomic Data
Chromatographic and m/z features were extracted and grouped using the open source metabolomics software XCMS, running in the R environment21, 40. Importantly however, any untargeted metabolomic peak-picking software could be used that allows output to a Microsoft Excel spreadsheet, such as the user friendly cloud-based tool, XCMS Online (https://xcmsonline.scripps.edu). Thermo.RAW files were converted to mzML format using the msconvert algorithm from Proteowizard43. FACs from the same species were analyzed together. First, all mzML files for a species (i.e. A. terreus, A. wentii or A. aculeatus) were placed in a parent directory along with the empty FAC controls with which they were run (in the same block of samples). This ranged from 48 to 104 files depending on the species. Then, a subdirectory was created for each treatment (i.e. sets of biological quadruplicates corresponding to a specific FAC or empty FAC negative control). XCMS was run in R using the centwave algorithm for feature detection with the following parameters: ppm=3, peakwidth=c(20,100), snthresh=10, prefilter=c(5,10000), mzCenterFun=”wMean”, integrate=1, mzdiff=0.001, fitgauss=FALSE, noise=1000. Grouping was then carried out using the group command and the parameters: bw=30, minfrac=0.5, mzwid=0.01. Following grouping, retention time correction was carried out using the algorithm retcor with the parameters: family=“s”, plottype=“m”. Typical retention time deviations ranged from 0 to 100 s, with the vast majority of features having less than 10 s deviations. After retention time correction, features were re-grouped and then subjected to peak filling using the algorithm pkfill. Results from XCMS were output into a.csv file. Generally, about 5,000 features were detected for each FAC-strain, with the abundance of each feature in each extract and treatment being recorded. The commands used for XCMS and CAMERA are given in Supplementary Fig. 23. We found the use of CAMERA could be omitted without any substantial effect on the downstream FAC-Score analysis, described below.
Generation of FAC-Scores to Filter Untargeted Metabolomic Data
A FAC-Score for each feature in each FAC was generated to allow ranking of hits within each FAC and identification of FAC strains that appeared to highly express unique (relative to all other FACs and the negative control for a species) heterologous products. Typical untargeted metabolomic analyses search for statistically significant differences in relative feature abundances between treatment groups, however we were interested in features that were qualitatively present in a single FAC strain at a meaningfully high abundance, while absent from all others, i.e. products that were expressed by only one FAC-strain and thus were likely to be heterologous expression products. Therefore, in order to rapidly triage data and highlight heterologously expressed FAC metabolites, a scoring system was developed to rank detected compounds based on their averaged abundance across biological replicates of a particular FAC-transformed strain and their uniqueness to each FAC-transformed strain. Scoring was carried out in Microsoft Excel using equation (1) and (2), and the data generated by XCMS. As stated above, any “peak-picking” program that outputs data into a spreadsheet can be used for FAC-Scoring.
In the FAC-Scoring method, uniqueness was represented by a ratio determined by the averaged abundance of an ion across all replicates of a FAC strain, divided by the averaged abundance of that same ion from every other FAC strain (equation (1)). Theoretically, a feature that was present in one FAC strain, but absent in all others, would have a ratio of infinity. In reality, because of inevitable (trace) carry over between samples, as well as the tendency of untargeted metabolomic peak picking algorithms to occasionally assign non-zero values to noise within a retention time window, features that are unique to a specific FAC strain are often assigned high ratio values ranging from 5×101 to 1×10⁹ (rather than infinity). In cases where this did not occur and features were indeed assigned an abundance of zero, leading to division by zero and a ratio of infinity, the ratio was assigned an arbitrary value of 9.99 × 10⁴ which is roughly in the middle of the dynamic range of observed ratios within the entire study, to facilitate downstream analysis.
| Equation 1 |
To allow comparison of compounds from different FACs and highlight likely heterologous expression products, the ratio and raw relative abundance of each feature in each FAC were combined to create a FAC-Score (equation (2)). The log10 of abundance and ratio values were utilized to account for the large dynamic range of signals for each parameter (which spanned several orders of magnitude). Then the log10 abundance values were standardized to a normal distribution, allowing comparison between FAC strains that globally expressed SMs at very different levels and/or were measured on different days with differing instrument performance. The standardized log10 abundance was then multiplied by the log10 of the ratio for each feature, after filtering out features with negative scores either for log10 ratios or standardized log10 abundances (since multiplying two negative values could conceivably lead to a high FAC-Score, i.e. a false positive). Thus, the final equation used was:
| Equation 2 |
The result of these calculations was a score for each feature. The highest scoring compound from empty, negative control FAC strains ranged from 3.2 to 3.8, with an average of 3.4. The average negative control score was subtracted from the score of each compound for each FAC to give the final FAC-Score, shown in Supplementary Figure 1. Thus, FACs with compounds with positive scores (29/56) were deemed likely to express heterologous BGC products. Manual analysis of these hits revealed that in 16 cases the top feature was clearly unique only to that FAC and was not a known metabolite of the heterologous host strain (A. nidulans) based on dereplication using the Dictionary of Natural Products44 (DNP) and Antibase45 databases of natural products. Of the 13 cases in which the top scoring compound was not determined to be a unique FAC product, in one case (AwFAC3B4), the top scoring feature was identified as an A. nidulans secondary metabolite. In the other 12 cases, the features of interest were arguably detected at trace levels in extracts from other FAC-strains upon manual analysis of LC-MS data. It is likely some of this resulted from carryover between LC-MS runs or cross contamination of samples. However, we chose a conservative process for designating hits in this study and did not consider these FAC-strains for further consideration here.
Gene Cluster Editing via FAC and Production of FAC Deletants
Red/ET tools have been developed for efficient large DNA or BAC-based recombineering and transgenic animal models46, 47. Here we modified the methodology described in those models for FAC recombineering to create a one-step targeting protocol using kanamycin antibiotic selection with the neomycin resistance gene from the plasmid PL451(https://ncifrederick.cancer.gov/research/brb/productDataSheets/recombineering/plasmid.aspx). To delete a gene, primers were created that contained DNA sequences allowing fusion of the kanamycin resistance gene (5′ and 3′ ends) to the homologous DNA sequences of the flanking regions of the FAC locus to be deleted. Each primer contains 50 bp homologous sequence flanking either side of the deletion followed by 21 bp forward or reverse primer for the kanamycin gene to give a total length of 71 bp (Supplementary Table 8).
All PCR products, therefore, resulted in DNA fragments which contained a full kanamycin resistance gene flanked by 50 bp on both sides of fungal DNA to allow for replacement of the FAC locus of interest with the kanamycin gene. To engineer a FAC, FAC DNA was first transformed into the Red/ET-inducible E. coli strain SW102. A gel-purified kanamycin construct was transformed into the FAC containing E. coli strain and plated on YT medium amended with kanamycin. Kanamycin E. coli colonies were grown up and the FACs extracted from each colony. Replacement of the FAC DNA of interest with the kanamycin gene was assessed by PCR, restriction digestion, pulse field gel electrophoresis and sequencing (if needed). The correct recombineered FAC DNA was then extracted from E. coli and prepared with a FAC/BAC DNA preparation kit (Intact Genomics) as above for transformation into A. nidulans.
Validation of Hits with FAC engineering
Targeted genetic deletions of the predicted backbone gene in each FAC identified as a positive “hit” above were prepared, transformed, and screened by LC-MS (see Gene Cluster Editing methods below), in order to confirm the FAC-Score analysis (Table 1). Of the 16 FAC deletants tested, in 15 the previously observed putative FAC-associated ion was eliminated by the deletion without causing substantial additional perturbations to the observed metabolome. In 1 case out of 16, the predicted product was still observed despite the deletion. In summary, 15 FAC-SM associations were validated by backbone gene deletions and 1 was refuted. Thus, we report 15 “hits” in this study (Supplementary Fig. 1 and Table 1).
Analysis of AtFAC9J20 biosynthetic products and intermediates
To analyze the levels of AtFAC9J20 products and intermediates in AtFAC9J20 deletants (including products and intermediates of benzomalvin, valactamide, and sesterterpenoid biosynthesis), an in-house program was written to determine the integrated total ion current (TIC) for each compound, as well as the integrated peak area for each compound of interest based on a 4 minute retention time window and a 5 ppm m/z tolerance. The resulting values were used to calculate the fraction of TIC accounted for by each feature (fracTIC) in a given .RAW file. Values from biological quadruplicates were averaged and error bars were generated by standard deviation of the four values. AtFAC9J20 normalized abundances for features of interest were determined by dividing the fracTIC of a feature from a given deletant by the fracTIC for AtFAC9J20. Error bars for AtFAC9J20 normalized values were generated through propagation of error using the standard deviation for each value and the appropriate equation for propagation of error through division.
Identification of Benzomalvin A/D
Due to its expression of an unusually high number of abundant and unique metabolites, AtFAC9J20 was selected for intensive follow up in this study. Manual analysis revealed that all of the top scoring features were adducts of the ion with m/z 382.1547 and RT of 38 and 41 min. This m/z did not match any known fungal metabolites in either DNP or Antibase. To broaden the dereplication search, the online tool MAGMA was used to search simulated MS2 data for every molecule of the same mass in PubChem against MS2 data attained for AtFAC9J2022. The top three hits were synthetic compounds, however the fourth was benzomalvin A/D. Fragment ions were then assigned using the program Mass Frontier 7.0 (Thermo, San Jose, CA) and a starting hypothesis of benzomalvin A/D as the parent compound, resulting in assignment of all major fragments (Supplementary Fig. 5).
Sequence Analysis of AtFAC9J20(Chr.4: : 2,151,734~telomeric end)
A bar-coded Illumina next-gen sequence (NGS) library of AtFAC9J20 was made with the true-seq kit and pooled for sequencing with other samples at the University of Wisconsin-Madison Biotechnology Center DNA Sequencing Facility. 1,333X coverage of AtFAC9J20 DNA sequence was achieved. A single contig (102.722 kb, completed and finished FAC clone sequence) was obtained by the DNAStar NGS assembling program. The entire FAC sequence of 102.722 kb was confirmed by FAC end sequences, PmeI, NotI digestion and contour-clamped homogeneous electric field (CHEF) gel electrophoresis. From this sequencing, we identified 35,769 kb extra sequence toward the telomere end, missing in the reference genome. We also discovered 1,164 SNPs, 1 inversion, 4 duplications, 59 insertions, 77 deletions, including 8,773 kb insertion and 1,851 kb deletion in AtFAC9J20 as compared to the NIH2624 strain. In total there were 1,305 genomic variations in the 66,953 kb genomic region compared to the A. terreus NIH 2624 reference genome sequence. Interestingly the majority of the genomic variations are within the first 25 kb genomic region. Sixteen predicted ORFs, eight of which are missing in the reference genome data of A. terreus NIH 2624 (Supplementary Table 2), were detected in total. The eight unique ORFs included two predicted NRPS enzymes, benY and benZ, as well as the predicted methyltransferase benX (Supplementary Table 2, Supplementary Fig. 3). The final sequence revealed that the benzomalvin, sesterterpenoid, and valactamide BGCs were captured on this single FAC clone (Supplementary Table 2). The DNA sequence of AtFAC9J20 was deposited at GenBank with the accession KX449366.
The extracted 10 amino acid A domain signatures for both the A domain of benY and the A1 domain of benZ match the distinct signature expected for anthranilate-encoding A-domains30, 48. The A2 domain of benZ is predicted to encode a Phe, NmPhe, or Tyr residue (see Supplementary Table 4). In addition to benY and benZ, the gene benX was discovered, which encodes a predicted SAM-binding N-methyltransferase enzyme and is the only standalone predicted methyltransferase in AtFAC9J20. Additionally, ORFs encoding a predicted PKS, a third NRPS enzyme, and an isoprenoid synthase enzyme were found on the FAC and annotated (Supplementary Table 2 and Supplementary Fig. 6).
Total Synthesis and LC-MS/MS analysis of Benzomalvin A/D
Synthesis of Benzomalvin A/D was carried out as previously described to confirm the identity of the AtFAC9J20 ion with m/z 382.1547 as follows. N-desmethylbenzomalvin A/D was synthesized as previously repported49 replacing Pd/C, H2 nitro reduction with Zn/AcOH, RT 12h. N-desmethylbenzomalvin A/D was methylated with LiHMDS (1.1 eq) and methyl iodide (1.2 eq) in THF to give crude benzomalvin A/D. An analytical sample for LC-MS/MS was prepared by preparative HPLC using a Higgins Analytical 250 × 10mm TARGA C18 5μm column eluted with buffers A (water 0.1% TFA) and B (acetonitrile 0.1% TFA) at 7.5 ml/min. The gradient was ramped from 95% A to 95% B over 12 mins followed by re-equilibration. 1H NMR (500 MHz, Acetone-d6) δ 8.23 (dd, J = 7.9, 1.5 Hz, 1H), 7.90 (ddd, J = 8.5, 7.0, 1.5 Hz, 1H), 7.85 (dd, J = 8.1, 1.3 Hz, 1H), 7.83 (dd, J = 7.7, 1.7 Hz, 1H), 7.70 – 7.67 (m, 1H), 7.67 – 7.62 (m, 1H), 7.59 (dddd, J = 7.2, 5.5, 4.2, 1.4 Hz, 2H), 7.37 (d, J = 6.8 Hz, 1H), 7.32 – 7.20 (m, 3H), 7.19 – 7.13 (m, 1H), 5.08 (t, J = 7.4 Hz, 1H), 3.77 (dd, J = 14.6, 7.4 Hz, 1H), 3.55 (dd, J = 14.6, 7.5 Hz, 1H), 3.03 (s, 3H).13C NMR (126 MHz, Acetone-d6) δ 161.85, 153.72, 138.42, 135.60, 134.21, 132.97, 131.30, 130.26, 130.03, 129.93, 129.71, 129.46, 129.35, 129.04, 128.53, 128.24, 127.86, 127.47, 122.82, 59.29, 33.74, 27.91.
Synthetic benzomalvin A/D was then analyzed by LC-MS/MS as described for FAC extracts above, and its selected ion chromatogram (SIC) for benzomalvin A/D was compared to the SIC for m/z 382.1547 in extract from A. terreus and AtFAC9J20, confirming the identification of the unknown compound as benzomalvin A/D. To confirm that the compound produced by AtFAC9J20 was identical to the synthetic standard, the two were also mixed together and coinjected (Supplementary Figure 3d).
Purification and Structural Analysis of Valactamide A
One hundred plates of AtFAC9J20-ΔbenZ were grown and extracted as described above to yield roughly 130 mg of dry extract. This was re-extracted 5 times with 10 mL hexanes, evaporated in vacuo, and resuspended in 2 mL of methylene chloride. The resuspended extract was loaded on a 12g spherical silica gel column and eluted using a linear gradient 100:0 to 60:40 DCM:EA over 30 minutes. Fractions were collected and screened by LC-MS. Fractions containing the target compound were pooled and evaporated in vacuo to yield 800 μg of dry material which was further refined using preparative TLC eluting with 80:20 DCM:EA yielding 200 μg purified compound. For NMR, the dried extract was resuspended in 300 μL anhydrous CDCl3, and loaded into a Shigemi tube.
The extract was analyzed by NMR spectroscopy, including 1H, 13C, COSY, HSQC, and HMBC. 1H, HSQC, HMBC and COSY NMR spectra were acquired using Agilent DD2 600 MHz Spectrometer, and 13C spectrum was acquired in a Bruker Avance III 500 MHz Spectrometer equipped with a DCH CryoProbe.
1H NMR (600 MHz, CDCl3) δ 0.80 (d, J = 6.3 Hz, 3H), 0.81 (d, J = 6.5 Hz, 3H), 0.82 (m, 1H), 0.86 (d, J = 6.6 Hz, 3H), 0.87 (d, J = 6.9 Hz, 3H), 0.93 (d, J = 6.8 Hz, 3H), 0.93 (dd, J = 7.4, 7.3 Hz, 3H), 0.94 (m, 1H), 0.96 (d, J = 6.7, 3H), 0.99 (m, 1H), 1.00 (ddd, J = 13.4, 7.6, 5.1 Hz, 1H), 1.02 (d, J = 6.9 Hz, 3H), 1.12 (ddd, J = 13.0, 10.6, 3.4 Hz, 1H), 1.20 (m, 1H), 1.23 (d, J = 6.4 Hz, 3H), 1.26 (ddd, J = 13.6, 9.4, 3.3 Hz, 1H), 1.28 (m, 1H), 1.37 (ddd, J = 13.0, 10.9, 2.6 Hz, 1H), 1.43 (m, 1H), 1.44 (m, 1H), 1.48 (m, 1H), 1.49, (m, 1H), 1.51 (m, 1H), 1.62 (m, 1H), 1.90 (m, 1H), 1.93 (d, J = 0.9 Hz, 3H), 2.33 (ddd, J = 6.9, 6.8, 5.0 Hz, 1H), 2.57 (dddd, J = 10.6, 10.2, 6.7, 2.6 Hz, 1H), 4.28 (dd, J = 6.5, 6.2 Hz, 1H), 4.33 (dd, J = 7.6, 5.0 Hz, 1H), 4.93 (ddd, J = 7.0, 6.4, 4.4 Hz, 1H), 6.18 (d, J = 7.5 Hz, 1H), 6.34 (dq, J = 10.2, 0.9 Hz, 1H), 6.56 (d, J = 6.2 Hz, 1H).
13C NMR (126 MHz, CDCl3) δ 11.5, 12.6, 15.1, 17.5, 19.5, 19.6, 20.3, 20.8, 20.9, 21.2, 25.9, 28.5, 29.0, 29.9, 30.2, 30.5, 30.8, 32.6, 37.4, 44.9, 46.1, 48.0, 57.3, 58.8, 72.5, 128.2, 144.6, 169.4, 171.0, 171.2.
The 1H NMR spectrum easily distinguished ten methyl groups (δ 0.80 – 1.94), two CH protons (δ 2.33 and 2.57), one O-CH proton (δ 4.93), two NH protons (δ 6.18 and 6.56) and one olefinic proton (δ 6.34). The aliphatic region of the spectrum is complex and required elucidation through 2D NMR techniques.
The 13C NMR spectrum has thirty signals, which is in accordance with the molecular formula. Three of the signals are carbonyls (δ 171.2 – 169.4), two are olefinic carbons, one CH at δ 144.6 and the other one quaternary at δ 128.2. One O-CH carbon (δ 72.5) was observed which showed single-range correlation with the proton at δ 4.93, as well as two N-CH carbons at δ 57.3 (isoleucine) and δ 58.8 (valine).
The 1H-13C HSQC spectrum successfully deconvoluted the complex aliphatic region in the 1D 1H, matching 26 1H-13C pairs including the identification of 6 carbons bearing diastereomeric CH2 protons. 1H-13C HMBC and COSY 2D experiments were able to characterize the structure. Beginning at C1 a clear path can be traced through the isoleucine, across the amide bond to valine and into the branched aliphatic chain.
Taking H-2 (δ 4.28) as the entry point a COSY sequential coupling path can be traced through H-3 (δ 1.90), onto H-4 (δ 0.87) and H-5 (δ 1.20). From H-5 a coupling to H-6 is apparent (δ 0.93). H-2 (δ 4.28) also feels coupling from HN-Ile (δ 6.56) by COSY. HMBC confirms the structural configuration provide by COSY and adds connection to carbonyl C-1 (δ 171.2) and through HN-Ile (δ 6.56) a connection to a second carbonyl C-7 (δ 171.0). This evidence in combination with 1H integrations and HSQC polarity unambiguously identifies this region as an isoleucine residue.
Working from α carbon C-8 (δ 58.8)/H-8 (δ 4.33) a COSY spin system is seen beginning at H-9 (δ 2.33) and proceeding to methyls C-10 (δ 0.93) and C-11(δ 1.02). H-9 (δ 2.33) is also coupled to HN-Val (δ 6.18). HMBC confirms this arrangement and additionally shows coupling between H-9 (δ 2.33) and C-7 (δ 171.0), connecting this spin system with the isoleucine fragment identified previously. This evidence in combination with 1H integrations and HSQC polarity unambiguously identifies this region as a valine residue.
From HN-Val (δ 6.18) a HMBC coupling is apparent to carbonyl C-12 (δ 169.4). Tracing the HMBC path from this point yields protons and carbons with characteristic olefin shifts, C-13 (δ 128.2) and H/C-15 (δ 6.34, 144.6). The presence and relative location of the double bond between C-13 (δ 128.2) and C-15 (δ 144.6) is confirmed by the chemical shifts; as it is close to a carbonyl group (C-12), C-15 should be more deshielded due to electron δ delocalization. The remainder of the branched aliphatic chain was well characterized by HMBC and COSY correlations. C-29 (δ 72.5) was chosen as the site of cyclization as it must be bonded to an oxygen and no OH proton was observed. Further if carbonyl C-1 (δ 171.2) was a ketone, the chemical shift of it on the isoleucine unit should be around δ 175, but it is shielded due to resonance effect of the oxygen atom. These assignments, all chemical shifts, coupling constants, and correlations observed on the spectra were in accordance with the structure proposed for valactamide A (Supplementary Fig. 18).
Marfey’s Analysis of Valactamide A
Free amino acids (L-Val, D-Val, L-Ile, and D-Ile) 5 mM, 100 μL were individually added to 1 mL tubes. To each tube was added 200 μL FDLA (1-fluoro-2-4-dinitrophenyl-5-L-leucine amide (0.4 mg/mL) and 40 μL 1.0 M sodium bicarbonate solution. After heating at 40° C for 1 hour the reactions were quenched by the addition of 20 μL 2.0 M HCl. Samples were prepared for LC-MS analysis by 1:1 dilution in 50% water 50% acetonitrile.
200 μg valactamide A was added to a 1 mL vacuum hydrolysis tube with 600 μL degassed constant boiling 6 N HCl. The mixture was subjected to two freeze-pump-thaw cycles and then was placed into a bath heated to 100 ° C for 16 hours. The resulting hydrolysate was concentrated in vacuo and resuspended in 100 μL water. Fifty μL of resuspended hydrolysate was combined with 100 μL FDLA (0.4 mg/mL) and 50 μL 1.0 M sodium bicarbonate solution. After heating at 40° C for 1 hour the derivatization reactions were quenched by the addition of 25 μL 2.0 M HCl. Samples were prepared for LC-MS analysis by 1:1 dilution in 50% water 50% acetonitrile.
LC-MS analysis was conducted using a Phenomenex-Luna-C18(2) column at 200 μL/min, coupled to an electrospray source, with the mass spectrometer and source settings described above. Five μL of each sample was injected on the column and the gradient ran linearly from 5% to 75% acetonitrile in water over 33 minutes with 0.1% formic acid v/v held constant throughout the run. For coinjection experiments, samples were prepared by mixing derivatized valactamide A hydrolysate, and derivatives of either L or D Val and L or D Ile 1:1:1. Separate analyses of valactamide A and L-Val revealed a two minute discrepancy in retention time, potentially suggesting a substantial matrix effect. Coinjection of valactamide A and L-Val eliminated this matrix effect yielding only one peak at the retention time observed for valactamide A alone, indicating that valactamide A contains L-Val. (Supplementary Fig. 19a). By contrast, coinjection of valactamide A and D-Val gave two distinct peaks, one of which was at the same retention time as for coinjection with L-Val (Supplementary Fig. 19a) and the other which came off 2.3 min earlier and matched the retention time of D-Val. Similar results were observed for isoleucine, indicating valactamide A contained L-Ile (Supplementary Fig. 19b). The presence of L amino acids and lack of D amino acids in valactamide A was consistent with the lack of an epimerase domain in the valactamide gene cluster.
Supplementary Material
Acknowledgments
This work was supported in part by an SBIR award from the National Institute of Allergy and Infectious Diseases at the National Institutes of Health under grant R44AI094885 to C.C.W. at Intact Genomics, Inc. and to J.W.B and N.L.K. N.L.K. also acknowledges AT009143 for partial support of this work and N.P.K. acknowledges NIH R01-AI065728 for partial support of this work. NMR instrumentation and assistance was provided by the Integrated Molecular Structure Education and Research Center (IMSERC) at Northwestern University.
Footnotes
CONTRIBUTIONS
R.Y., C.C.W., M.L., and M.N.I. worked on the FAC library assembly, FAC end sequencing, FAC DNA preparation, and FAC engineering. C.C.W., J.M.P., C.C., and M.L. did fungal secondary metabolite gene cluster prediction, FAC bioinformatic analyses, and FAC NGS assembly and annotation. J.W.B., T.V., and K.H.Y. performed the A. nidulans transformation with FACs and prepared samples for metabolite identification and structure determination. K.D.C. and P.G. carried out LC-MS analyses. K.D.C. conducted analysis of LC-MS data, including development of the analysis pipeline, invention of the FAC-Score, discovery of valactamide A, and bioinformatic analyses of the benzomalvin and valactamide gene clusters under the supervision of P.M.T. and N.L.K. P.M.T. identified benzomalvin A. G.P.M. carried out total synthesis of benzomalvin A/D. M.H.V, G.P.M, and K.D.C. carried out purification and structural characterization of valactamide A. The paper was written by K.D.C. under the supervision of N.L.K. The Online Methods and supplemental items were prepared by K.D.C., N.P.K., C.C.W., J.W.B., R.Y., G.P.M., M.H.V, and M.T.R. All authors read and approved the final manuscript. C.C.W., N.P.K. and N.L.K. conceived and supervised the project.
COMPETING FINANCIAL INTERESTS
C.C.W., R.Y., C.C., M.L., and M.N.I are employees of Intact Genomics that sells the unbiased Random Shear BAC and FAC libraries, and services for genome discovery and DNA research, as well as BAC cloning, DNA end repairing, E. coli competent cells, and other enzyme kits for DNA and protein research.
DATA AVAILABILITY
The DNA sequence of AtFAC9J20 was deposited at GenBank with the accession KX449366 and is freely available for download. The LC-MS data generated in this study is available from the corresponding author NLK upon reasonable request.
References
- 1.Blackwell M. The fungi: 1, 2, 3 ... 5.1 million species? Am J Bot. 2011;98:426–438. doi: 10.3732/ajb.1000298. [DOI] [PubMed] [Google Scholar]
- 2.Khaldi N, et al. SMURF: Genomic mapping of fungal secondary metabolite clusters. Fungal genetics and biology : FG & B. 2010;47:736–741. doi: 10.1016/j.fgb.2010.06.003. [DOI] [PMC free article] [PubMed] [Google Scholar]
- 3.Inglis DO, et al. Comprehensive annotation of secondary metabolite biosynthetic genes and gene clusters of Aspergillus nidulans, A. fumigatus, A. niger and A. oryzae. BMC microbiology. 2013;13:91. doi: 10.1186/1471-2180-13-91. [DOI] [PMC free article] [PubMed] [Google Scholar]
- 4.Han X, Chakrabortti A, Zhu J, Liang ZX, Li J. Sequencing and functional annotation of the whole genome of the filamentous fungus Aspergillus westerdijkiae. BMC Genomics. 2016;17:633. doi: 10.1186/s12864-016-2974-x. [DOI] [PMC free article] [PubMed] [Google Scholar]
- 5.Andersen MR, et al. Accurate prediction of secondary metabolite gene clusters in filamentous fungi. Proc Natl Acad Sci U S A. 2013;110:E99–107. doi: 10.1073/pnas.1205532110. [DOI] [PMC free article] [PubMed] [Google Scholar]
- 6.Brown DW, Proctor RH. Insights into natural products biosynthesis from analysis of 490 polyketide synthases from Fusarium. Fungal genetics and biology : FG & B. 2016;89:37–51. doi: 10.1016/j.fgb.2016.01.008. [DOI] [PubMed] [Google Scholar]
- 7.Medema MH, et al. Minimum Information about a Biosynthetic Gene cluster. Nature chemical biology. 2015;11:625–631. doi: 10.1038/nchembio.1890. [DOI] [PMC free article] [PubMed] [Google Scholar]
- 8.Anyaogu DC, Mortensen UH. Heterologous production of fungal secondary metabolites in Aspergilli. Front Microbiol. 2015;6:77. doi: 10.3389/fmicb.2015.00077. [DOI] [PMC free article] [PubMed] [Google Scholar]
- 9.Bailey AM, et al. Characterisation of 3-methylorcinaldehyde synthase (MOS) in Acremonium strictum: first observation of a reductive release mechanism during polyketide biosynthesis. Chemical Communications. 2007:4053–4055. doi: 10.1039/b708614h. [DOI] [PubMed] [Google Scholar]
- 10.Holm DK, et al. Molecular and chemical characterization of the biosynthesis of the 6-MSA-derived meroterpenoid yanuthone D in Aspergillus niger. Chem Biol. 2014;21:519–529. doi: 10.1016/j.chembiol.2014.01.013. [DOI] [PubMed] [Google Scholar]
- 11.Richter L, et al. Engineering of Aspergillus niger for the production of secondary metabolites. Fungal Biology and Biotechnology. 2014;1:1–13. doi: 10.1186/s40694-014-0004-9. [DOI] [PMC free article] [PubMed] [Google Scholar]
- 12.Nielsen MT, et al. Heterologous reconstitution of the intact geodin gene cluster in Aspergillus nidulans through a simple and versatile PCR based approach. PloS one. 2013;8:e72871. doi: 10.1371/journal.pone.0072871. [DOI] [PMC free article] [PubMed] [Google Scholar]
- 13.Heneghan MN, et al. First heterologous reconstruction of a complete functional fungal biosynthetic multigene cluster. Chembiochem : a European journal of chemical biology. 2010;11:1508–1512. doi: 10.1002/cbic.201000259. [DOI] [PubMed] [Google Scholar]
- 14.Chiang YM, et al. An efficient system for heterologous expression of secondary metabolite genes in Aspergillus nidulans. J Am Chem Soc. 2013;135:7720–7731. doi: 10.1021/ja401945a. [DOI] [PMC free article] [PubMed] [Google Scholar]
- 15.Smith DJ, Burnham MK, Edwards J, Earl AJ, Turner G. Cloning and heterologous expression of the penicillin biosynthetic gene cluster from penicillum chrysogenum. Biotechnology (N Y) 1990;8:39–41. doi: 10.1038/nbt0190-39. [DOI] [PubMed] [Google Scholar]
- 16.Gressler M, Hortschansky P, Geib E, Brock M. A new high-performance heterologous fungal expression system based on regulatory elements from the Aspergillus terreus terrein gene cluster. Front Microbiol. 2015;6:184. doi: 10.3389/fmicb.2015.00184. [DOI] [PMC free article] [PubMed] [Google Scholar]
- 17.Lazarus CM, Williams K, Bailey AM. Reconstructing fungal natural product biosynthetic pathways. Natural product reports. 2014;31:1339–1347. doi: 10.1039/c4np00084f. [DOI] [PubMed] [Google Scholar]
- 18.Weber T, et al. antiSMASH 3.0-a comprehensive resource for the genome mining of biosynthetic gene clusters. Nucleic acids research. 2015;43:W237–243. doi: 10.1093/nar/gkv437. [DOI] [PMC free article] [PubMed] [Google Scholar]
- 19.Bok JW, et al. Fungal artificial chromosomes for mining of the fungal secondary metabolome. BMC Genomics. 2015;16:343. doi: 10.1186/s12864-015-1561-x. [DOI] [PMC free article] [PubMed] [Google Scholar]
- 20.Samson RA, et al. Phylogeny, identification and nomenclature of the genus Aspergillus. Stud Mycol. 2014;78:141–173. doi: 10.1016/j.simyco.2014.07.004. [DOI] [PMC free article] [PubMed] [Google Scholar]
- 21.Smith CA, Want EJ, O’Maille G, Abagyan R, Siuzdak G. XCMS: processing mass spectrometry data for metabolite profiling using nonlinear peak alignment, matching, and identification. Anal Chem. 2006;78:779–787. doi: 10.1021/ac051437y. [DOI] [PubMed] [Google Scholar]
- 22.Ridder L, et al. Automatic chemical structure annotation of an LC-MS(n) based metabolic profile from green tea. Anal Chem. 2013;85:6033–6040. doi: 10.1021/ac400861a. [DOI] [PubMed] [Google Scholar]
- 23.Sun HH, Barrow CJ, Cooper R. Benzomalvin D, a New 1,4-Benzodiazepine Atropisomer. Journal of Natural Products. 1995;58:1575–1580. [Google Scholar]
- 24.Jang JP, et al. Benzomalvin E, an indoleamine 2,3-dioxygenase inhibitor isolated from Penicillium sp. FN070315. J Antibiot (Tokyo) 2012;65:215–217. doi: 10.1038/ja.2011.141. [DOI] [PubMed] [Google Scholar]
- 25.Sun HH, Barrow CJ, Sedlock DM, Gillum AM, Cooper R. Benzomalvins, new substance P inhibitors from a Penicillium sp. J Antibiot (Tokyo) 1994;47:515–522. doi: 10.7164/antibiotics.47.515. [DOI] [PubMed] [Google Scholar]
- 26.Wei H, et al. Cytotoxic sesterterpenes, 6-epi-ophiobolin G and 6-epi-ophiobolin N, from marine derived fungus Emericella variecolor GF10. Tetrahedron. 2004;60:6015–6019. [Google Scholar]
- 27.Yoganathan K, et al. Inhibition of the human chemokine receptor CCR5 by variecolin and variecolol and isolation of four new variecolin analogues, emericolins A-D, from Emericella aurantiobrunnea. J Nat Prod. 2004;67:1681–1684. doi: 10.1021/np049844c. [DOI] [PubMed] [Google Scholar]
- 28.Liu HB, et al. Ophiobolin Sesterterpenoids and Pyrrolidine Alkaloids from the Sponge-Derived Fungus Aspergillus ustus. Helvetica Chimica Acta. 2011;94:623–631. [Google Scholar]
- 29.Molander GA, Quirmbach MS, Silva LF, Jr, Spencer KC, Balsells J. Toward the total synthesis of variecolin. Org Lett. 2001;3:2257–2260. doi: 10.1021/ol015763l. [DOI] [PubMed] [Google Scholar]
- 30.Stachelhaus T, Mootz HD, Marahiel MA. The specificity-conferring code of adenylation domains in nonribosomal peptide synthetases. Chem Biol. 1999;6:493–505. doi: 10.1016/S1074-5521(99)80082-9. [DOI] [PubMed] [Google Scholar]
- 31.Chiang YM, et al. Molecular genetic mining of the Aspergillus secondary metabolome: discovery of the emericellamide biosynthetic pathway. Chem Biol. 2008;15:527–532. doi: 10.1016/j.chembiol.2008.05.010. [DOI] [PMC free article] [PubMed] [Google Scholar]
- 32.Cacho RA, et al. Understanding Programming of Fungal Iterative Polyketide Synthases: The Biochemical Basis for Regioselectivity by the Methyltransferase Domain in the Lovastatin Megasynthase. J Am Chem Soc. 2015;137:15688–15691. doi: 10.1021/jacs.5b11814. [DOI] [PMC free article] [PubMed] [Google Scholar]
- 33.Meehan MJ, et al. FT-ICR-MS characterization of intermediates in the biosynthesis of the alpha-methylbutyrate side chain of lovastatin by the 277 kDa polyketide synthase LovF. Biochemistry. 2011;50:287–299. doi: 10.1021/bi1014776. [DOI] [PMC free article] [PubMed] [Google Scholar]
- 34.Zou Y, et al. Methylation-dependent acyl transfer between polyketide synthase and nonribosomal peptide synthetase modules in fungal natural product biosynthesis. Org Lett. 2014;16:6390–6393. doi: 10.1021/ol503179v. [DOI] [PMC free article] [PubMed] [Google Scholar]
- 35.Gatto GJ, Jr, McLoughlin SM, Kelleher NL, Walsh CT. Elucidating the substrate specificity and condensation domain activity of FkbP the FK520 pipecolate-incorporating enzyme. Biochemistry. 2005;44:5993–6002. doi: 10.1021/bi050230w. [DOI] [PubMed] [Google Scholar]
- 36.Gao X, et al. Cyclization of fungal nonribosomal peptides by a terminal condensation-like domain. Nature chemical biology. 2012;8:823–830. doi: 10.1038/nchembio.1047. [DOI] [PMC free article] [PubMed] [Google Scholar]
- 37.Henke MT, Kelleher NL. Modern mass spectrometry for synthetic biology and structure-based discovery of natural products. Natural product reports. 2016;33:942–950. doi: 10.1039/c6np00024j. [DOI] [PMC free article] [PubMed] [Google Scholar]
- 38.Bouslimani A, Sanchez LM, Garg N, Dorrestein PC. Mass spectrometry of natural products: current, emerging and future technologies. Natural product reports. 2014;31:718–729. doi: 10.1039/c4np00044g. [DOI] [PMC free article] [PubMed] [Google Scholar]
- 39.Albright JC, et al. Large-scale metabolomics reveals a complex response of Aspergillus nidulans to epigenetic perturbation. ACS Chem Biol. 2015;10:1535–1541. doi: 10.1021/acschembio.5b00025. [DOI] [PMC free article] [PubMed] [Google Scholar]
- 40.Kuhl C, Tautenhahn R, Bottcher C, Larson TR, Neumann S. CAMERA: an integrated strategy for compound spectra extraction and annotation of liquid chromatography/mass spectrometry data sets. Anal Chem. 2012;84:283–289. doi: 10.1021/ac202450g. [DOI] [PMC free article] [PubMed] [Google Scholar]
- 41.Bok JW, Keller NP. LaeA, a regulator of secondary metabolism in Aspergillus spp. Eukaryot Cell. 2004;3:527–535. doi: 10.1128/EC.3.2.527-535.2004. [DOI] [PMC free article] [PubMed] [Google Scholar]
- 42.Wang M, et al. Sharing and community curation of mass spectrometry data with Global Natural Products Social Molecular Networking. Nature biotechnology. 2016;34:828–837. doi: 10.1038/nbt.3597. [DOI] [PMC free article] [PubMed] [Google Scholar]
- 43.Kessner D, Chambers M, Burke R, Agus D, Mallick P. ProteoWizard: open source software for rapid proteomics tools development. Bioinformatics (Oxford, England) 2008;24:2534–2536. doi: 10.1093/bioinformatics/btn323. [DOI] [PMC free article] [PubMed] [Google Scholar]
- 44.Running W. Computer Software Reviews. Chapman and Hall Dictionary of Natural Products on CD-ROM. Journal of Chemical Information and Computer Sciences. 1993;33:934–935. [Google Scholar]
- 45.Laatsch H. Wiley VCH; 2011. [Google Scholar]
- 46.Copeland NG, Jenkins NA, Court DL. Recombineering: a powerful new tool for mouse functional genomics. Nat Rev Genet. 2001;2:769–779. doi: 10.1038/35093556. [DOI] [PubMed] [Google Scholar]
- 47.Muyrers JP, Zhang Y, Stewart AF. Techniques: Recombinogenic engineering--new options for cloning and manipulating DNA. Trends Biochem Sci. 2001;26:325–331. doi: 10.1016/s0968-0004(00)01757-6. [DOI] [PubMed] [Google Scholar]
- 48.Ames BD, Walsh CT. Anthranilate-activating modules from fungal nonribosomal peptide assembly lines. Biochemistry. 2010;49:3351–3365. doi: 10.1021/bi100198y. [DOI] [PMC free article] [PubMed] [Google Scholar]
- 49.Al-Said NH. Effective formal synthesis of benzomalvin A. Monatshefte für Chemie - Chemical Monthly. 2010;141:1249–1251. [Google Scholar]
Associated Data
This section collects any data citations, data availability statements, or supplementary materials included in this article.