Abstract
Effective anti-tumor immunity in humans has been associated with the presence of T cells directed at cancer neoantigens1, which are T cell epitopes with tumor-specific expression arising from non-silent somatic mutations. They are highly immunogenic because they are not expressed in normal tissues and hence bypass central thymic tolerance. Although neoantigens were long-envisioned as optimal targets for an anti-tumor immune response2, their systematic discovery and evaluation only became feasible with the recent availability of massively-parallel sequencing for detection of all coding mutations within tumors, and of machine learning approaches to reliably predict those mutated peptides with high-affinity binding of autologous HLA molecules. We hypothesized that vaccination with neoantigens can both expand pre-existing neoantigen-specific T cell populations and induce a broader repertoire of new T cell specificities in cancer patients, tipping the intra-tumoral balance in favor of enhanced tumor control. Here we demonstrate the feasibility, safety and immunogenicity of a vaccine that targets up to 20 predicted personal tumor neoantigens. Vaccine-induced polyfunctional CD4+ and CD8+ T cells targeted 58 (60%) and 15 (16%), respectively, of the 97 unique neoantigens used across patients. These T cells discriminated mutated from wildtype antigens, and in some cases, directly recognized autologous tumor. Of 6 vaccinated patients, 4 had no recurrence at 25 months post-vaccination, while 2 with progressive disease were subsequently treated with anti-PD-1 therapy and experienced complete tumor regression, with expansion of the repertoire of neoantigen-specific T cells. These data provide a strong rationale for further development of this approach, alone and in combination with checkpoint therapies.
Keywords: Neoantigen, melanoma, vaccine, checkpoint, personal, personalized, pICLC, epitope, HLA
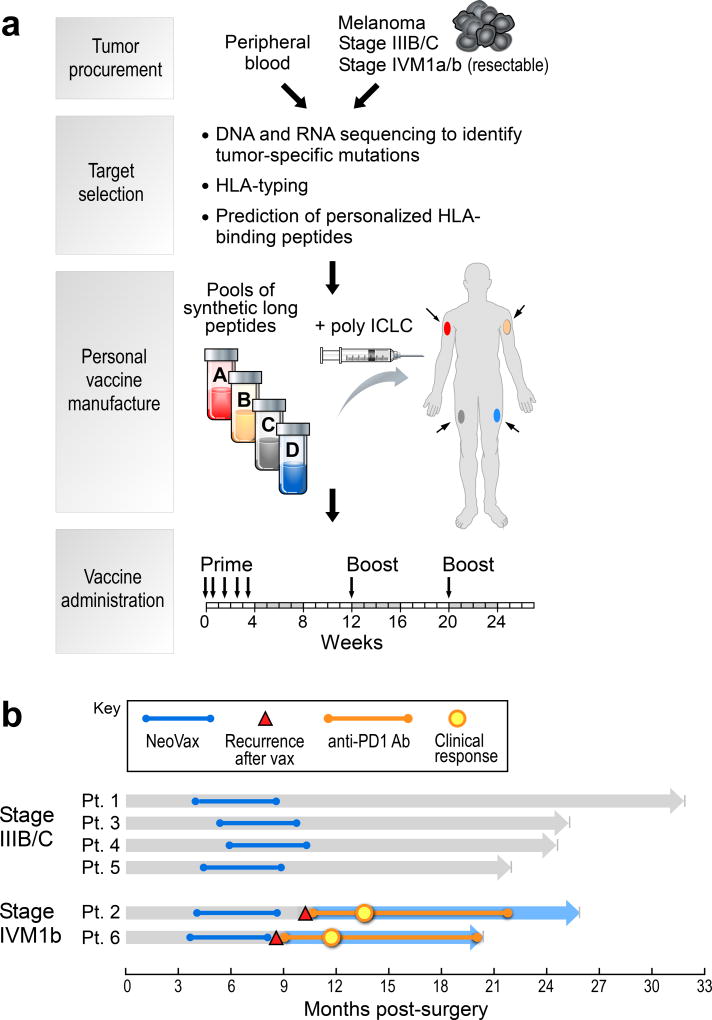
To generate a vaccine that targets personal neoantigens, we conducted whole-exome sequencing of matched tumor and normal cell DNA from individual patients, identified somatic mutations, orthogonally validated and assessed the expression of mutated alleles by RNA-sequencing (RNA-Seq) of the tumor, predicted which mutated peptides were likely to bind autologous HLA-A or HLA-B proteins of the patient, and synthesized clinical-grade long peptides3 targeting up to 20 neoantigens per patient, admixed with the TLR3 agonist poly-ICLC4 (Hiltonol®) (Fig. 1a, Supplementary Information 1–3). We evaluated this vaccine in a phase I study in patients with previously untreated high-risk melanoma (stage IIIB/C and IVM1a/b) following surgical resection with curative intent (Extended Data Tables 1, Supplementary Information 4a).
Figure 1. Generation of a personal, multi-peptide neoantigen vaccine for patients with high-risk melanoma.
a, Somatic mutations were identified by WES of melanoma and germline DNA and their expression confirmed by tumor RNA-sequencing. Immunizing peptides were selected based on HLA binding predictions (Methods). Each patient received up to 20 long peptides in 4 pools. b, Clinical event timeline for 6 vaccinated patients from surgery until time of data cutoff (36 months from study initiation).
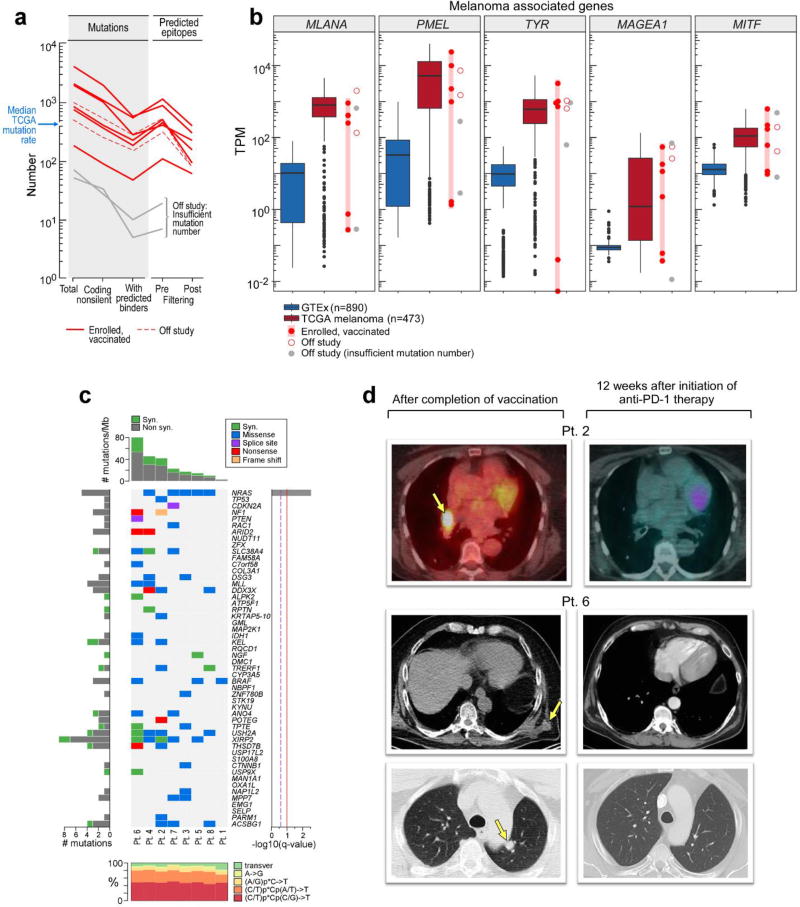
Of the 10 patients enrolled, 8 demonstrated the high mutation rate expected for melanoma, carried expected melanoma-associated mutations (i.e. in BRAF, NRAS and others) and predominantly C→T transitions (consistent with UV exposure), and expressed multiple melanoma markers (Extended Data Fig. 1a–c). For these 8 patients, 13–20 immunizing long peptides (IMP) per patient (with lengths of 15–30 amino acids) were synthesized and grouped into 4 separate immunizing pools (Supplementary Information 5). Six patients initiated vaccination (median time of 18 weeks from surgery to vaccine administration) and each completed the full series of 5 priming and 2 booster vaccinations. Treatment-related adverse events consisted of mild flu-like symptoms, injection site reactions, rash and fatigue (Supplementary Information 4b).
At a median follow-up of 25 months (range 20–32), 4 of 6 patients, who entered the study with stage IIIB/C disease, remain without disease recurrence. Two patients entered with previously untreated stage IVM1b disease (lung metastases); both had disease progression evident on restaging scans obtained after the last vaccination. Subsequently, both patients underwent treatment with the anti-PD-1 antibody pembrolizumab and both achieved complete radiographic responses (CR) after 4 doses (CR rate of pembrolizumab as first-line treatment for metastatic melanoma previously reported as 6.1%5), which are ongoing (Fig. 1b, Extended Data Fig. 1d).
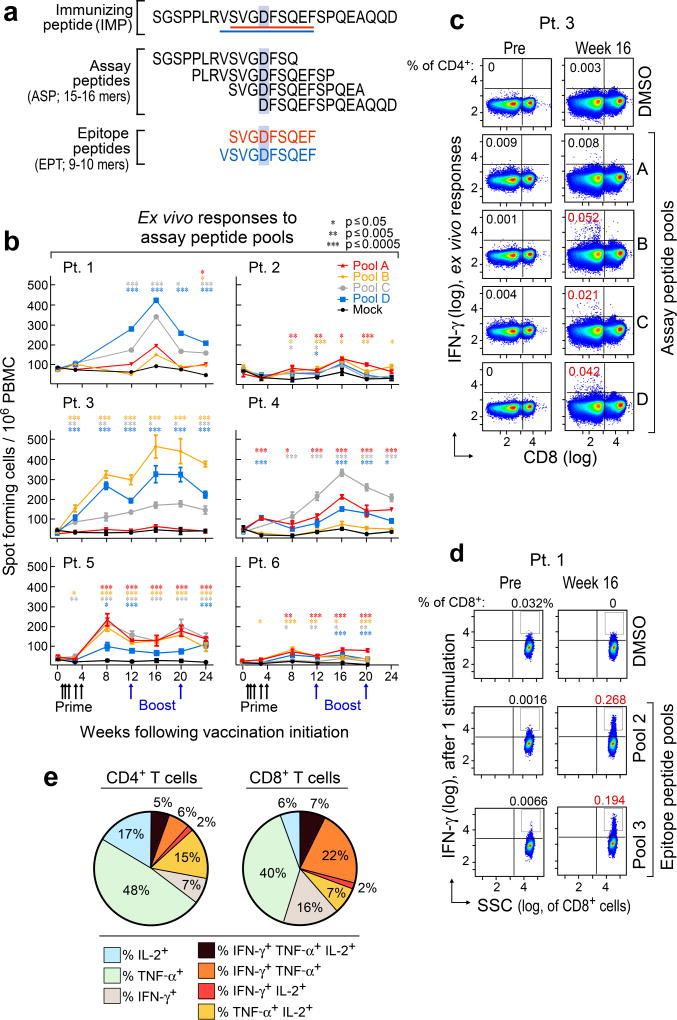
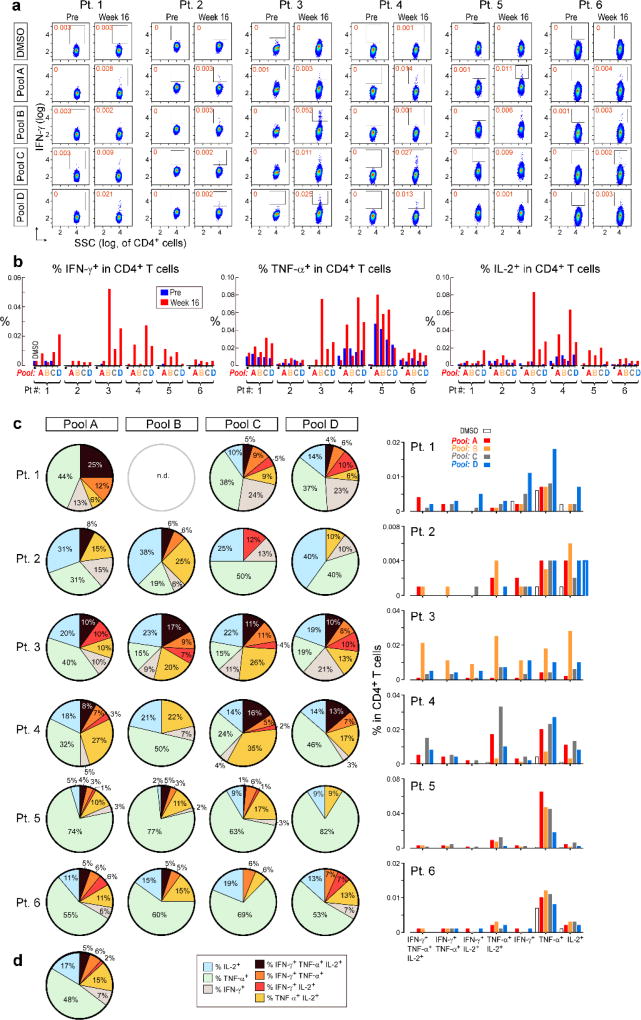
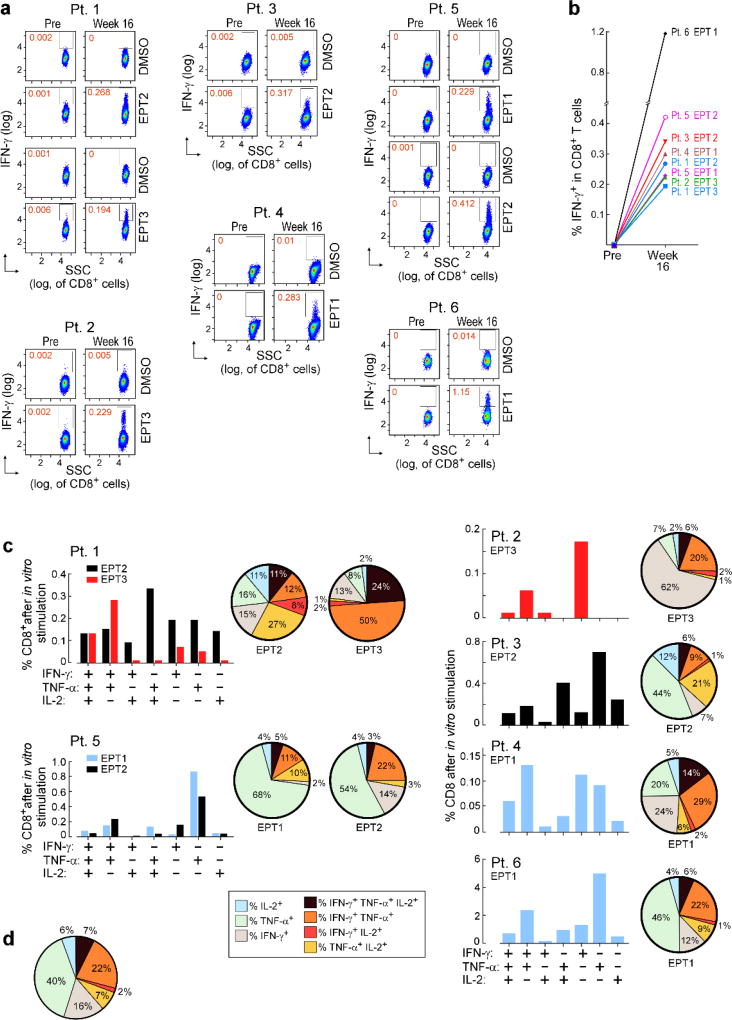
Overlapping 15–16mer assay peptides (‘ASP’) spanning the entirety of each IMP and 9–10mer peptides corresponding to each predicted class I epitope (‘EPT’) were prepared and pooled to match the corresponding IMP pool (Fig. 2a). When measured by ex vivo IFN-γ ELISPOT, we observed reactivity of peripheral blood mononuclear cells (PBMCs) to a median of 3 of 4 pools of overlapping ASP (p < 0.005), suggesting the generation of potent responses against multiple predicted epitopes (Fig. 2b). Ex vivo responses to these peptide pools were undetectable before vaccination but were already evident at the time of earliest sampling, and were sustained over time. By intracellular cytokine staining (ICS), the majority of ex vivo IFN-γ-positive PBMC responses against peptide pools were generated by CD4+ T cells (Fig. 2c; Extended Data Fig. 2a). While neoantigen-reactive CD8+ T cell responses were not observed by IFN-γ ELISPOT nor ICS directly ex vivo, 8 of 17 (47%) pools of EPT across the 6 patients (at least one EPT pool/patient) stimulated detectable IFN-γ secretion after a single round of in vitro expansion (‘pre-stimulation’) with the peptides (Fig. 2d; Extended Data Fig. 3a–b). Responses against these EPT pools were absent in pre-stimulated samples collected prior to vaccination, indicating the generation of new circulating CD8+ T cell responses following vaccination (Extended Data Fig. 3b). For all patients, >30% of neoantigen-reactive CD4+ and CD8+ T cells were polyfunctional as evidenced by secretion of 2–3 inflammatory cytokines (IFN-γ, TNF-α, IL-2) (Extended Data Fig. 2b–d, 3c–d).
Figure 2. Vaccination induces strong multi-functional CD4+ and CD8+ T cell responses in high-risk melanoma patients.
a, Schema of immunizing (IMP), assay (ASP) and epitope (EPT) peptides. Mutated amino acid (aa) shaded. b, Ex vivo IFN-γ ELISPOT of PBMC, with duplicate or triplicate wells/timepoint (bars: SEM; Methods for statistical analysis) c, Ex vivo intracellular cytokine staining (ICS) of Patient 3 PBMC pre- and post-vaccination, pre-gated on CD3+ T cells. d, Patient 1 CD8+ T cell responses after one round of pre-stimulation with EPT peptide pools.
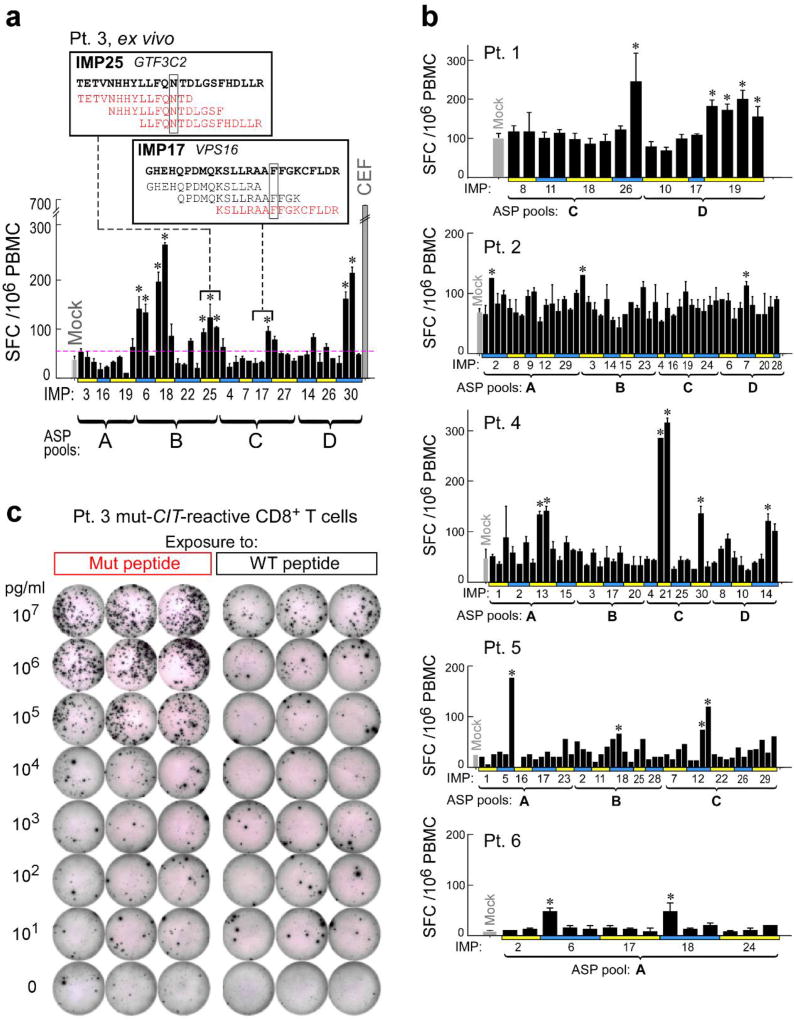
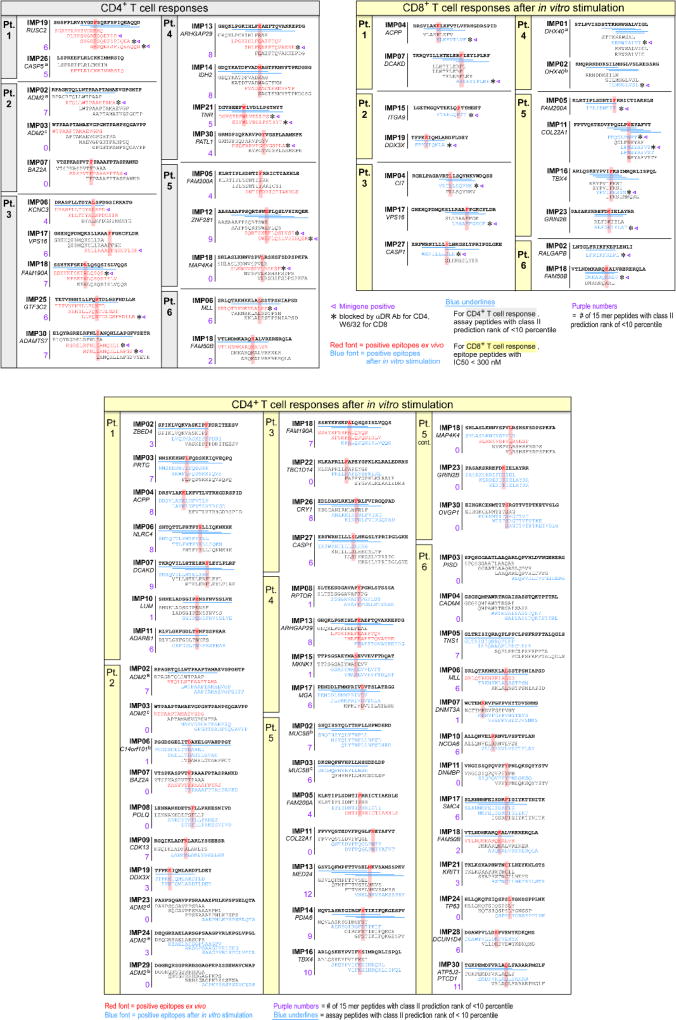
To identify which predicted epitopes within the peptide pools stimulated the T cell responses, we deconvoluted all pools by either ex vivo or pre-stimulation ELISPOT assays (Extended Data Fig. 4a–b, 5). Of 173 9–10mer EPT tested, derived from 91 IMP, CD8+ T cells were reactive against EPT from 15 (16%) immunizing peptides (2–4 immunogenic peptides per patient) (Extended Data Fig. 5; Supplementary Information 5). For CD4+ T cell responses, we tested 297 ASP across 6 patients, corresponding to 97 IMP, and detected responses against ASP from 19 IMP ex vivo, and an additional 39 IMP after one round of pre-stimulation, for a total of 58 (60%) IMP (Extended Data Fig. 5; Supplementary Information 6).
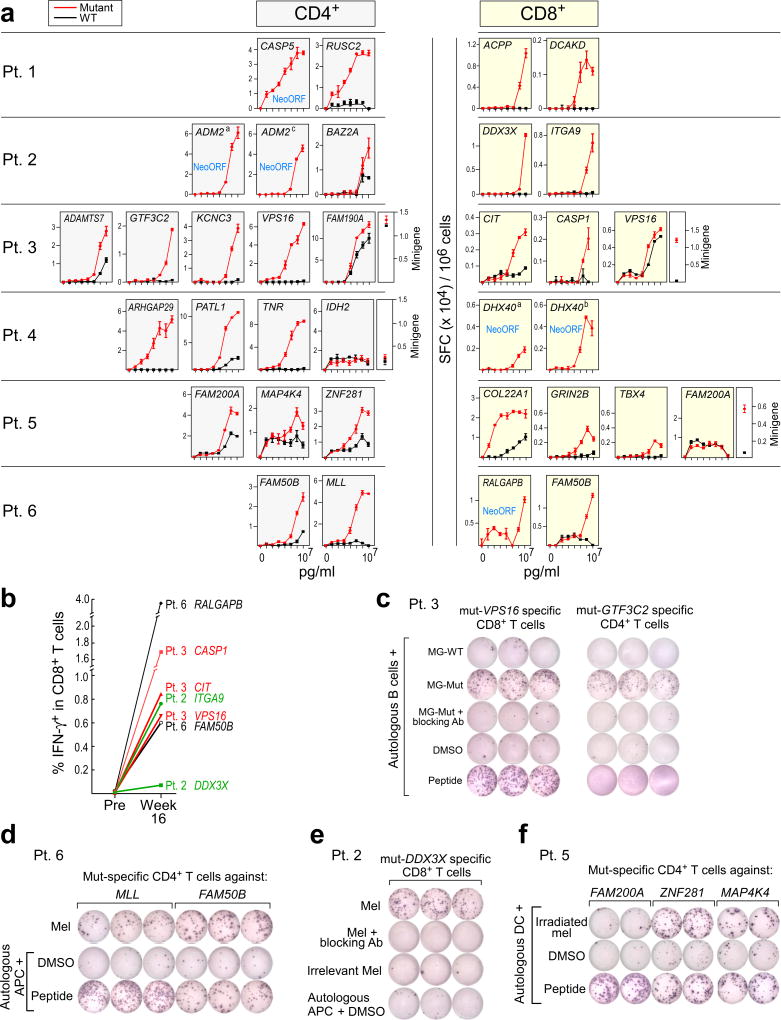
Thirty-four T cell lines with reactivity against each of the ex vivo CD4+-defined and pre-stimulated CD8+ targets were evaluated for sensitivity and specificity by incubation with CD4+/CD8+-depleted PBMC loaded exogenously with mutated or, for single amino acid changes, wildtype peptides over a range of concentrations. In 24 (86%) of 28 T cell lines with reactivity against a mutated peptide, we confirmed preferential reactivity of the mutated compared to the corresponding wildtype peptide (Fig. 3a; Extended Data Fig. 4c). For several predicted epitopes, reactive T cell populations were observed at peptide concentrations as low as ~10 pM (e.g. CD4+ T cell response against mutated RUSC2 [Patient 1]; CD8+ T cell response against mutated COL22A1 [Patient 5]), potentially enabling recognition of tumor cells presenting few peptide:MHC complexes6. These data demonstrate the high level of specificity for neoantigens over corresponding wildtype antigens. Of the 6 T cell lines directed against epitopes predicted to arise from novel open reading frames (neoORFs), several were found highly avid for these epitopes (e.g. CD4+ T cell responses against the CASP5 neoORF [Patient 1]). Neoantigen-reactive CD4+ (Extended Data Fig. 6a) and CD8+ T cells (Fig. 3b) were not detected in samples prior to vaccination, even after one round of pre-stimulation. Notably, 10% of IMP elicited both CD8+ and CD4+ T cell responses.
Figure 3. Vaccine-induced T cells discriminate mutated from wildtype antigens and detect endogenously processed and presented peptides.
a, IFN-γ secretion by neoantigen-reactive T cell lines against mutated and wildtype peptides, focusing on neoantigens generating ex vivo CD4+ and pre-stimulated CD8+ T cell responses (bars: SEM). b, ICS of CD8+ T cell lines stimulated with EPT peptides pre- and post-vaccination. c, IFN-γ secretion by Patient 3 neoantigen-specific T cell lines against minigene (MG)-nucleofected B cells, with/without anti-HLA class I or DR antibodies. d, e, IFN-γ secretion by Patient 6 and Patient 2 neoantigen-specific T cell lines against autologous tumor. f, IFN-γ secretion by Patient 5 neoantigen-specific CD4+ T cells against autologous dendritic cells co-cultured with irradiated autologous melanoma. All T cell lines originated from week 16 PBMC; ELISPOT experiments were performed in duplicate or triplicate wells/condition.
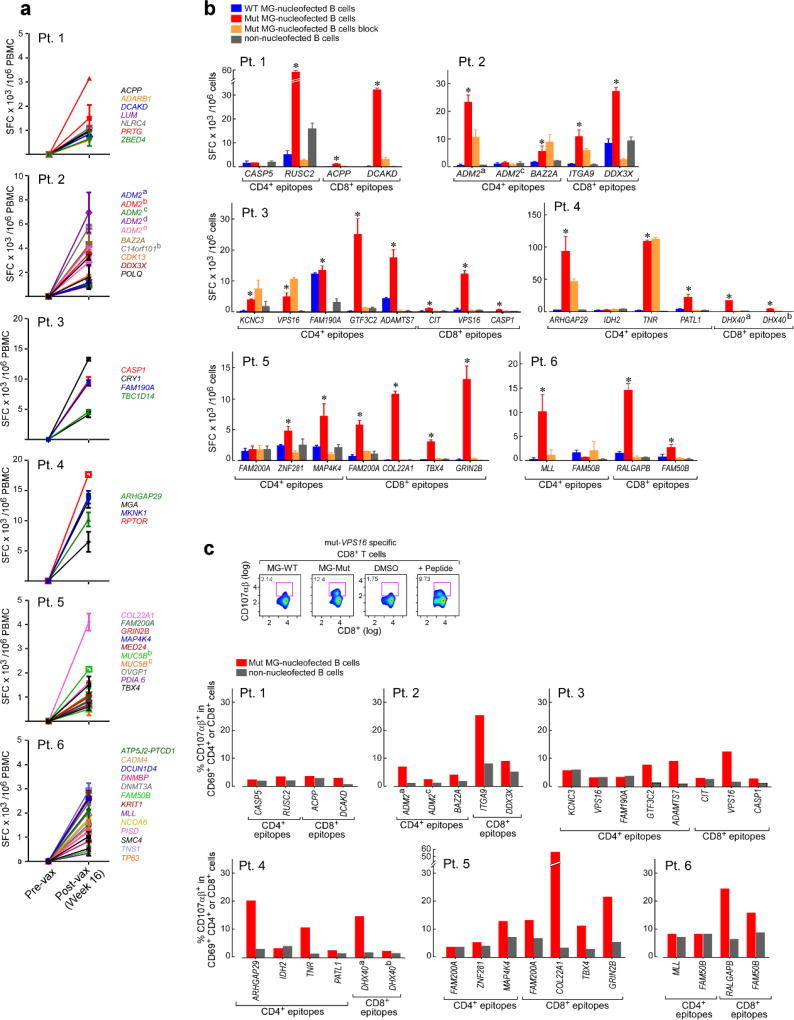
We used multiple approaches to confirm that the detected T cell responses were directed against endogenously processed and presented neoantigens. First, we observed recognition by neoantigen-reactive CD4+ (14 of 19 [73%]) and CD8+ (15 of 15 [100%]) T cell lines of autologous antigen presenting cells (APCs) expressing tandem minigenes encoding a series of 25-mer peptides (and hence requiring processing for presentation; Methods) spanning the predicted mutated sites, but not of APCs expressing minigenes encoding corresponding wildtype peptides (Fig. 3c; Extended Data Fig. 6b). Two of 15 CD8+ T cell lines with clear differential reactivity to mutated vs wildtype peptide-encoding minigenes were unable to discriminate between cells loaded with mutated versus wildtype peptides (Fig. 3a; to VPS16 [Patient 3] and FAM200A [Patient 5]), suggesting that endogenous processing, but not exogenous loading, differs for the mutated and cognate wildtype peptides. For the CD8+ T cell lines, all mutated minigene responses were uniformly blocked by an anti-HLA class I blocking antibody (Extended Data Fig. 6b). For the CD4+ T cell lines, 10 of 19 (52%) were blocked by an anti-HLA-DR blocking antibody; the remainder are presumably restricted by other class II alleles. We observed evidence of cytolytic capacity of these T cell lines since elevated CD107αβ expression was detected following exposure to APCs presenting the mutated minigenes for both CD8+ and CD4+ T cells (Extended Data Fig. 6c).
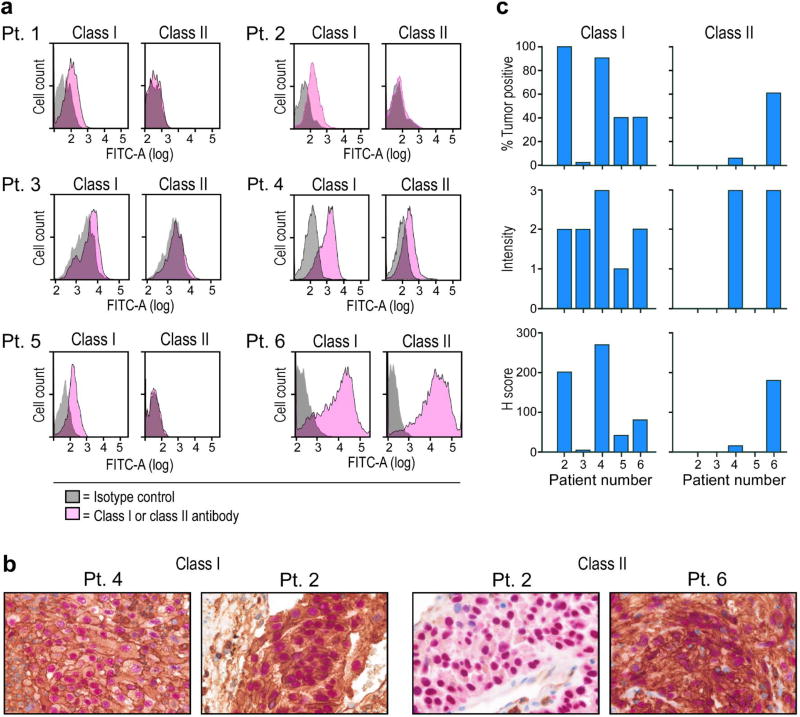
Neoantigen-specific T cells were also tested for reactivity against autologous melanoma cell lines. Flow cytometric analysis of the tumor lines demonstrated variable levels of HLA class I and II expression (Extended Data Fig. 7a). None of the neoantigen-specific T cells recognized cultured tumor cell lines from Patients 1, 3, 4, and 5. For Patients 2 and 6, we detected recognition of autologous tumor by multiple neoantigen-reactive CD4+ and CD8+ T cells (Fig. 3d–e). Additionally, CD4+ T cells from Patient 5 were reactive against autologous dendritic cells exposed to irradiated autologous melanoma cells, demonstrating that tumor-expressed melanoma neoepitopes can be naturally presented by patient APCs (Fig. 3f). Of note, immunohistochemical evaluation of HLA class I and II expression of the originally surgically resected metastatic tumors, available for 5 of 6 patients, demonstrated detectable class I expression in 4 of 5 tumors (Patients 2, 4, 5, 6) (Extended Data Fig. 7b–c), and hence, these tumors have the potential to be recognized by neoantigen-specific T cells in vivo.
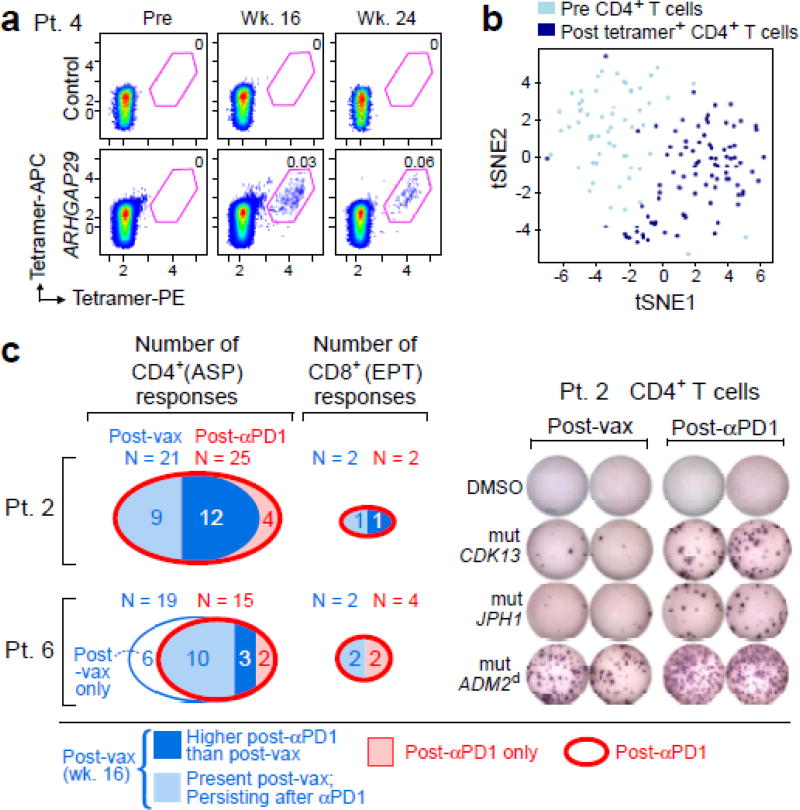
To analyze the frequency and phenotype of vaccine-induced CD4+ T cells, we generated HLA class II tetramers that detect neoantigen-reactive CD4+ cells. The tetramers detected T cells against RUSC2 (Patient 1) and ARHGAP29 (Patient 4) directly ex vivo at week 16, representing ~0.03–0.06% of all circulating CD4+ cells, with persistence of ARHGAP29-reactive cells at week 24 (Fig. 4a–b, Extended Data Fig. 8c–d, Extended Data Table 2). To characterize the functional state of these cells, we sorted CD4+ T cells prior to vaccination and tetramer-positive CD4+ T cells after vaccination in both patients, and compared their gene expression profiles using single cell RNA sequencing (scRNA-Seq). Clustering of T cells showed robust separation of pre- and post-vaccination cells (Fig. 4b; Extended Data Fig. 8d), with hundreds of genes changing their expression after vaccination. These major shifts in gene expression reflect a transition from naïve to effector and memory functions, including silencing of genes that promote naïve T cell homeostatic survival (e.g., IL7R [Patient 4]) and fate (e.g., FOXP1 [Patient 1]), and upregulation of genes involved in Th1 fate (e.g., TBX21/T-bet [Patient 4]) and energy metabolism that is critical for cell proliferation and growth (e.g., glucose and glutamine transporters and MTOR in Patient 4) (Supplementary Information 7). While SATB1, a recently described epigenetic repressor of PD-17, was downregulated in both patients, PD-1 itself was only upregulated in Patient 4, suggesting additional mechanisms regulating PD-1.
Figure 4. Vaccine-induced T cells demonstrate broad shifts in their transcriptional programs; the repertoire of neoantigen-specific T cells persists and broadens following PD-1 blockade.
a, b, Ex vivo class II tetramer staining of Patient 4 CD4+ T cells. Visualization of transcriptomes of single CD4+ T cells pre-vaccination and tetramer-positive CD4+ cells post-vaccination by tSNE. c, Summary of neoantigen-specific T cell responses after vaccination and after PD-1 blockade for Patients 2 and 6. Example IFN-γ ELISPOT results are shown for week 16 post-vaccination and post-PD-1 CD4+ T cells against mut-CDK13, -JPH1, and –ADM2d for Patient 2. For complete response kinetics, see Extended Data Fig. 8a.
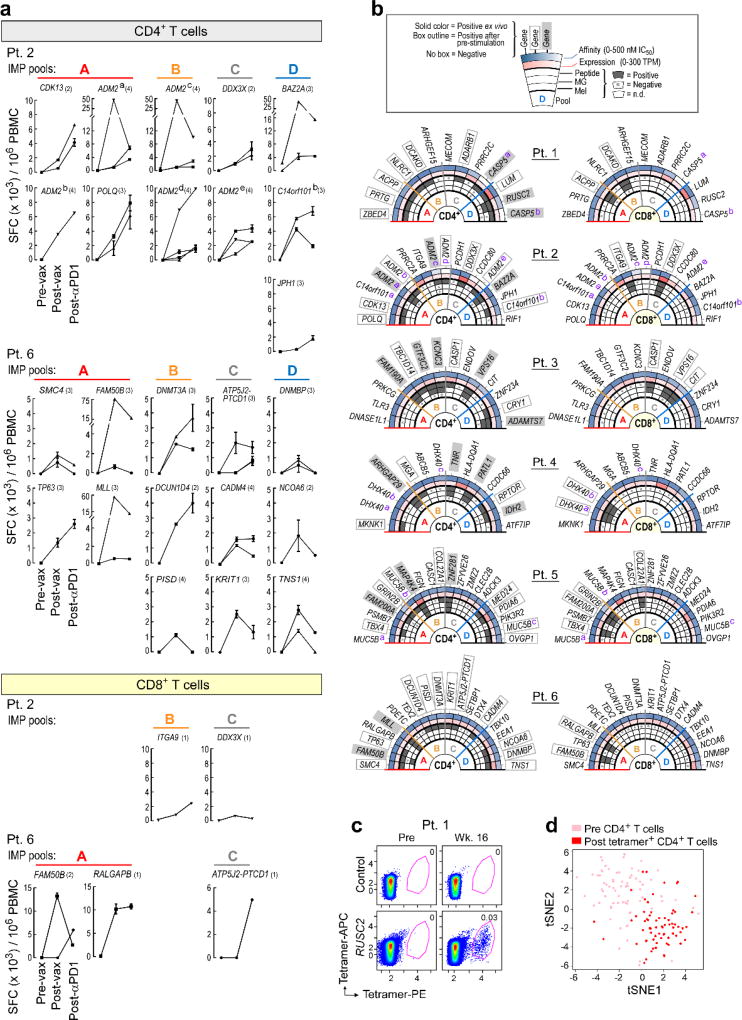
For Patients 2 and 6, who both achieved a CR after treatment with pembrolizumab, we tested samples collected after 9–12 months of pembrolizumab treatment for reactivity against ASP and EPT by IFN-γ ELISPOT. Indeed, CD4+ T cell responses against 25 of 49 ASP (with 4 novel responses) and CD8+ T cell responses against 2 of 18 EPT for Patient 2 were detected (Fig. 4c, Extended Data Fig. 8a). Similarly, for Patient 6, CD4+ T cell responses were detected against 15 of 61 ASP (with 2 novel responses) and CD8+ T cell responses against 4 of 32 EPT (with 2 novel responses). Thus, we observe persistence of the vaccine-induced neoantigen responses over time and broadening of the repertoire of neoantigen-specific T cells following checkpoint blockade therapy.
Our study provides proof-of-principle that a personal vaccine can be produced and administered to a patient to generate highly specific immune responses against that individual’s tumor. Given the importance of both CD8+ and CD4+ T cells in mediating tumor cell killing,8,9 the vaccine, by utilizing long peptides, was designed to activate both types of T cells. Both CD8+ and CD4+ T cell responses against a substantial proportion of IMP were detected (summarized in Extended Data Fig. 8b). Notably, 20% of IMP induced ex vivo CD4+ T cell responses, comparable to the magnitude of responses seen for viral E6 and E7 long peptide therapeutic vaccines in patients with vulvar intraepithelial neoplasia3. Importantly, the proportion of tumor neoantigens inducing a T cell response following vaccination was substantially higher compared to the rates (~1% ex vivo for CD8+ or CD4+ T cells) observed in patients who responded clinically to non-antigen-directed immunotherapy, such as checkpoint blockade or TIL therapy10–13. Thus, in agreement with a reported study showing responses to a DC-based neoantigen vaccine14, our results demonstrate that a personal neoantigen vaccine broadens the repertoire of neoantigen-specific T cells substantially beyond what is induced by existing immunotherapeutics.
Despite the selection of neoantigens based on predicted presentation by HLA class I, the proportion of neoantigens stimulating class II responses was higher than for class I responses (~60% vs. 20%). Nevertheless, this outcome is consistent with recent reports in cancer mouse models demonstrating predominantly CD4+ responses upon vaccination with neoepitopes predicted by class I binding algorithms15,16. A combination of structural (precise N- and C-termini for class I epitopes vs promiscuous binding properties of peptides to MHC class II proteins17–19), cellular (scarcity of MHC class I cross-presenting CLEC9A+ dendritic cells cells20), and other factors likely explain the predominance of CD4+ T cell responses. Recent studies have highlighted a role for neoantigen-specific CD4+ T cell responses in direct tumor clearance8,9,15. Hence, in addition to the licensing of dendritic cells and the activation and maintenance of a tumor-directed CD8+ T cell response21, CD4+ T cells can exert direct anti-tumor effects independent of CD8+ T cells21–23.
In conclusion, we demonstrate that a personal neoantigen vaccine is safe, feasible and capable of eliciting strong T cell responses in a clinical setting unconfounded by prior or intercurrent therapy. The use of a personal neoantigen vaccine is anticipated to help overcome two major barriers to effective cancer therapy: tumor heterogeneity and selective targeting of tumor relative to healthy tissues. Based on the observed induction of de novo T cell clones that detect multiple individual-specific neoantigens and recognize endogenously processed antigens and autologous tumors cells, our vaccine is likely to target a diversity of malignant clones per patient, thus addressing tumor heterogeneity as well as minimizing the chance of tumor escape by loss of antigen. Future neoantigen vaccine trials will take advantage of improved methods for predicting antigen presentation to increase the fraction of neoantigens inducing tumor-reactive T cells24 and will test for synergy with checkpoint blockade and other immunotherapeutics.
Methods
Study design
Patients with high-risk melanoma were provided informed consent and enrolled between April 2014 and October 2015 to a single center, phase I clinical trial approved by the Dana-Farber/Harvard Cancer Center Institutional Review Board (IRB) (NCT01970358). This study was conducted in accordance with the Declaration of Helsinki. Key eligibility criteria were clinically or radiographically evident, pathologically confirmed stage IIIB/C and IVM1a/b melanoma deemed amenable to complete surgical resection and an ECOG performance status of 0 or 1. Other requirements included absolute lymphocyte count of ≥ 800/mcL, absolute neutrophil count of ≥ 1,500/mcL, hemoglobin ≥ 10g/dL, platelet count ≥ 100,000/mcL, aminotransferases ≤ 2×upper limit of the normal range, total serum bilirubin ≤ 1×upper limit of the normal range and serum creatinine ≤ 1.5×upper limit of the normal range. Patients with uveal or mucosal melanoma, prior immune modulating or other cancer directed therapies (except for IFN-α given as systemic adjuvant therapy for a prior melanoma or melanoma recurrence), active autoimmune disease or an immunosuppressive condition were excluded.
The primary endpoints of the study were safety and feasibility; secondary endpoints were induction of tumor- and neoantigen-specific cellular immune responses and the number of patients alive at 2 years after melanoma resection. A personalized neoantigen-targeting vaccine consisting of long peptides combined into 4 distinct immunizing peptide pools with 0.3mg of each peptide admixed with 0.5mg poly-ICLC per pool in a volume of 1ml was generated as described below, and was administered subcutaneously (SC) on days 1, 4, 8, 15, and 22 (priming phase) and weeks 12 and 20 (booster phase). Each of the 4 neoantigen vaccine pools per patient was assigned to one of four “non-rotating” extremities (or the left or right midriff as an alternate anatomical location) for each injection.
Clinical assessments
The safety of study treatment was assessed based on the occurrence of adverse events, which were categorized and graded according to National Cancer Institute Common Terminology Criteria for Adverse Events (CTCAE, version 4.0). During the treatment phase, safety assessments were performed on the day of vaccination and one week after each vaccination. During the follow up phase, safety assessments were conducted every 3 months. Surveillance scans (computer tomography or combined position emission tomography/computer tomography) were performed every 6 months; standard RECIST 1.1 criteria were used for assessment of disease recurrence.
Patient samples
Heparinized blood and serum samples were obtained from study subjects on IRB-approved protocols at the DFCI. Patient peripheral blood mononuclear cells (PBMCs) were isolated by Ficoll/Hypaque density-gradient centrifugation (GE healthcare) and cryopreserved with 10% dimethylsulfoxide in FBS (Sigma-Aldrich). Cells and serum from patients were stored in vapor-phase liquid nitrogen until the time of analysis. HLA class I and class II molecular typings were determined by PCR-rSSO (reverse sequence specific oligonucleotide probe), with ambiguities resolved by PCR-SSP (sequence specific primer) techniques (One Lambda Inc.).
Patient tumor samples were obtained immediately following surgery. A portion of the sample was removed for formalin fixation and paraffin embedding (FFPE). The remainder of the tissue was carefully minced manually, suspended in a solution of collagenase D (200unit/mL) and DNAse I (20unit/ml) (Roche Life Sciences), transferred to a sealable plastic bag and incubated with regular agitation in a Seward Stomacher Lab Blender for 30 – 60min. After digestion, any remaining clumps were removed and the single cell suspension was recovered, washed and immediately frozen in aliquots and stored in vapor-phase liquid nitrogen. For Patients 1, 2, 3 5, 7, 9, and 10, the frozen tumor cell suspensions were used for whole-exome (WES) and RNA-sequencing (RNA-Seq). For Patients 4, 6, 8 and 10 WES and RNA-Seq were performed on scrolls from the FFPE tissue (Supplementary Information 1a,b).
Generation of personal neoantigen vaccines
Whole-Exome Sequencing (WES)
CLIA-certified WES was conducted by the Clinical Research Sequencing Platform, Broad Institute; CLIA #:22D2055652. Library construction from surgical melanoma specimens and matched germline DNA of all 10 patients was performed as previously described25. Genomic DNA was sheared, end repaired, ligated with barcoded Illumina sequencing adapters, amplified, and size selected. For Patients 1, 2, 3, 4, 7 and 9, whole exome capture was performed using the Agilent SureSelect Human All Exon 44Mb v2.0 bait set (Agilent Technologies)26. For Patients 5, 6, 8, and 10, WES was performed using the Illumina Nextera Rapid Capture Exome v1.2 bait set. The Illumina exome specifically targets approximately 37.7Mb of mainly exonic regions made up of all targets from the Agilent exome design (Agilent SureSelect All Exon V2), all coding regions of Gencode V11 genes, and all coding regions of RefSeq gene and KnownGene tracks from the UCSC genome browser (http://genome.ucsc.edu). Resulting libraries were then qPCR quantified, pooled, and sequenced with 76 base paired-end reads using HiSeq 2000 or 2500 sequencers (Illumina). Pooled libraries were normalized to 2nM and denatured using 0.2 N NaOH prior to sequencing. Data were analyzed using the Broad Picard Pipeline which includes de-multiplexing, duplicate marking, and data aggregation.
RNA sequencing (RNA-Seq)
For RNA sequencing library construction, RNA was extracted from frozen cell suspensions (Patients 1, 2, 3, 7, 9, and 10) or FFPE samples (Patients 4, 5, 6, 8 and 10) using Qiagen RNeasy Mini kit or Qiagen FFPE RNeasy kit, respectively. RNA-Seq libraries were prepared using Illumina TruSeq Stranded mRNA Library Prep Kit (for cell suspensions) or Illumina’s TruSeq RNA Access Library Prep Kit (for FFPE samples). Total RNA was quantified using the Quant-iT™ RiboGreen® RNA Assay Kit and normalized to 5ng/µl. For Patients 1, 2, 3, 7 and 9, each sample was transferred into library preparation which was an automated variant of the Illumina TruSeq™ Stranded mRNA Sample Preparation Kit. This method preserves strand orientation of the RNA transcript. It uses oligo dT beads to select mRNA from the total RNA sample. It is followed by heat fragmentation and cDNA synthesis from the RNA template. The resultant 500bp cDNA then goes through library preparation (end repair, base ‘A’ addition, adapter ligation, and enrichment) using Broad designed indexed adapters substituted in for multiplexing. For Patient 4, the mRNA enrichment step was omitted prior to library preparation. The resulting libraries were quantified with qPCR using the KAPA Library Quantification Kit for Illumina Sequencing Platforms and then pooled equimolarly. For Illumina Sequencing, pooled libraries were normalized to 2nM and denatured using 0.1 N NaOH prior to sequencing. Flowcell cluster amplification and sequencing were performed according to the manufacturer’s protocols using either the HiSeq 2000 or HiSeq 2500. Each run was a 101bp paired-end with an eight-base index barcode read. Data was analyzed using the Broad Picard Pipeline which includes de-multiplexing and data aggregation.
For Patients 5, 6, 8 and 10, a RNA transcriptome capture method was used. Using Illumina’s TruSeq RNA Access Library Prep kit, a stranded cDNA library was prepared from isolated RNA which was then hybridized to a set of DNA oligonucleotide probes to enrich the library for mRNA transcript fragments. The transcriptome capture targets 21,415 genes, representing 98.3% of the RefSeq exome (and is the same bait set as the Rapid Capture Exome). Flowcell cluster amplification and sequencing were performed according to the manufacturer’s protocols using either the HiSeq 2000 or HiSeq 2500. Each run is a 76bp paired-end with an eight-base index barcode read. Data was analyzed using the Broad Picard Pipeline which includes de-multiplexing and data aggregation.
DNA quality control
Standard Broad Institute protocols as previously described27,28 were used for DNA quality control. The identities of all tumor and normal DNA samples were confirmed by mass spectrometric fingerprint genotyping of 95 common SNPs by Fluidigm Genotyping (Fluidigm). Sample contamination from foreign DNA was assessed using ContEst29.
Somatic mutation calling
Analyses of whole-exome sequencing data of tumor and matched PBMCs (as source of normal germline DNA) from the patients were used to identify the specific coding-sequence mutations, including single-, di- or tri-nucleotide variants leading to single amino acid missense mutations and small insertions/deletions. Output from Illumina software was processed by the “Picard” data processing pipeline to yield BAM files containing aligned reads (bwa version 0.5.9, to the NCBI Human Reference Genome Build hg19) with well-calibrated quality scores27,30. Somatic alterations were identified using a set of tools within the “Firehose” pipeline (www.broadinstitute.org/cancer/cga). Somatic single nucleotide variations (sSNVs) were detected using MuTect (Firehose version v13112); somatic small insertions and deletions were detected using Indelocator27 and Strelka31. All indels were manually reviewed in integrated genome viewer (IGV)32. All somatic mutations, insertions and deletions were annotated using Oncotator33. The ABSOLUTE algorithm (v1.1) was used to calculate the purity and ploidy of the samples. RNA-Seq data was processed using the PRADA software34. Comparisons of gene expression were conducted against data from GTEx (Analysis V6, dbGaP Accession phs000424.v6.p1, doi: 10.1038/ng.2653) and TCGA ([Broad Institute TCGA Genome Data Analysis Center (2016): Firehose stddata__2016_01_28 run. Broad Institute of MIT and Harvard. doi:10.7908/C11G0KM9]).
Identification of target epitopes for peptide design
NetMHCpan v2.4 was used to identify mutation-containing epitopes that are predicted to bind to the individual patients’ MHC class I molecules19,35,36. Thirty peptides of 15–30 amino acids length (“long peptides”) from up to 30 independent mutations were selected and prioritized for peptide preparation. Epitopes were chosen for inclusion based on a pre-defined set of criteria in the following rank order:
NeoORFs which included predicted binding epitopes
High predicted affinity (< 150 nM) sSNVs due to anchor residue changes
High affinity (<150 nM) sSNVs due to mutations in positions other than anchor residues
NeoORFs with no predicted binding epitopes
Lower affinity (<150 – 500 nM) versions of (2) and (3)
Mutations in oncogenes were given highest priority within each ranked group; otherwise epitopes were ranked by predicted mutated peptide affinity. Only sSNVs that demonstrated expression of the mutated allele were used. Additionally, a variety of possible biochemical properties (hydrophobicity, presence of multiple cysteines) which may have affected the synthesizability or solubility of the long peptide were considered.
Synthesis of long peptides, pooling and final vaccine preparation
GMP peptides were synthesized and purified (CS Bio) using standard solid-phase synthetic peptide chemistry and Reverse Phase High Performance Liquid Chromatography (RP-HPLC). Up to twenty peptides were formulated in an aqueous solution containing ≤4% DMSO in isotonic dextrose and mixed into up to 4 pools (3–5 peptides per pool, with a final dose of 0.3mg of each peptide per vaccine). On the day of vaccine administration, each peptide pool was admixed with 0.5mg poly-ICLC (Hiltonol®; Oncovir Inc.) by syringe-to-syringe transfer at the DFCI Clinical Pharmacy.
Melanoma cell line generation
Fresh tumor cell suspensions or thawed cryopreserved cells were washed and cultured in tissue culture plates containing OptiMEM GlutaMax media (Gibco,Thermofisher) supplemented with fetal bovine serum (5%), sodium pyruvate (1mM), penicillin and streptomycin (100units/ml), gentamycin (50µg/ml), insulin (5µg/ml) and epidermal growth factor (5ng/ml; Sigma-Aldrich). Cell cultures were dissociated and passaged using versene (Gibco,Thermofisher). The expanding cell lines were tested mycoplasma free and verified as melanoma through immunohistochemical stains using antibodies against the melanoma markers HMB45, MITF, MART-1, Melan-A, and S100 that were performed in the Dana-Farber/Harvard Cancer Center Specialized Histopathology Core Laboratory.
Immunohistochemical evaluation of primary melanoma cells
Dual immunohistochemical staining of the antigen presentation components: HLA class I (Abcam, EMR8-5, 1:6000) and HLA class II (Dako, CR3/43 M0775, 1:750) with the melanoma marker SOX10 (EP 268, Cell Marque, 1:1500) was performed using an automated staining system (Bond III, Leica Biosystems) according to the manufacturer's protocol, as previously described37. Semi-quantitative scoring was performed for the intensity of positive staining of melanoma cell membranes for the marker of interest (0, negative; 1, weak; 2, moderate; 3, strong) and for the percentage of positive staining malignant cells (0–100%). A cumulative “H score” was obtained by multiplying intensity score (0–3) by the percentage of malignant cells with positive staining (0%–100%; with any intensity of positive staining). Stained slides were first reviewed and scored independently by two individuals and subsequently reviewed together with a final, consensus score tabulated as previously described37.
Generation and detection of patient neoantigen-specific T cells
PBMCs were cultured in RPMI-1640 medium supplemented with L-glutamine, nonessential amino acids, HEPES, β-mercaptoethanol, sodium pyruvate, penicillin/streptomycin (Gibco), and 10% AB-positive heat-inactivated human serum (Gemini Bioproduct). For in vitro expansion (‘pre-stimulation’) of antigen-specific T cells, PBMCs were stimulated in 24-well cell culture plates at 5×10⁶ cells per well with individual (2µg/ml) or pooled peptides (each at 2µg/ml) in the presence of IL-7 (20 ng/ml; R&D Systems). On day 3, low-dose IL-2 (20U/ml; Amgen) was added. Half-medium change and supplementation of cytokines were performed every 3 days, as described previously38. After 10–21 days, T cell (referred to as ‘T cell lines’) specificity was tested against peptide, minigenes or autologous tumor by interferon (IFN)-γ ELISPOT or CD107αβ degranulation assay in RPMI-1640 medium supplemented with penicillin/streptomycin and 10% FBS (complete RPMI). For deconvolution of CD8+ T cell responses, CD8+ T cells were enriched with CD8+ T cell Isolation Kit beads (Miltenyi Biotec) prior to plating for ELISPOT.
Antigen formats for immune monitoring
Assay (ASP) and predicted class I epitope peptides (EPT) were synthesized and lyophilized (from either JPT Peptide Technologies; or RS Synthesis) (>80% purity). ASP were 15–16 aa and overlapped by at least 11 aa, covering the IMP sequence. EPT were 9–10 aa. Peptides for generation of class II tetramers were synthesized to >90% purity (21st Century Biochemicals). Minigenes were constructed39 such that: (i) for non-synonymous mutations, they encoded the mutated amino acid and surrounding upstream and downstream native amino acids for a total length of ~25 amino acids; (ii) for frame-shift mutations, they encoded the entire corresponding immunizing peptide. Multiple minigenes (3–7 per plasmid) for a given patient were arranged in tandem without additional linker sequences and synthesized as a gBlock (Integrated DNA Technologies). Each tandem minigene construct was inserted into a pcDNA3.1 vector using available EcoRI and BamHI cut sites. RNA was generated by in vitro transcription (IVT) of the tandem minigene plasmids using the mMESSAGE mMACHINE Ultra Kit (Thermo Fisher). 20µg of the IVT RNA was introduced into autologous positively-selected CD19+ B cells (CD19 Microbeads, Miltenyi Biotec) by nucleofection using V-buffer and the X-001 program (Amaxa Cell Line Nucleofector Kit V, Lonza). The B cells were used within 24h of transfection. Transfection efficiency was typically 70–85%, based on 24h GFP expression following nucleofection with control IVT RNA generated using a pcDNA3.1-GFP plasmid. Tandem constructs containing the wildtype versions of the minigenes with non-synonymous mutations were also similarly designed.
In some experiments, antigen-specific T cells were tested against autologous melanoma cells. In other experiments, autologous irradiated melanoma cells were co-cultured with autologous dendritic cells (DC). Immunomagnetically isolated CD14+ cells (Human CD14 MicroBeads; Miltenyi Biotec) were cultured in complete RPMI containing 120ng/ml GM-CSF and 70ng/ml IL-4 at 3×10⁶ cells/well in 6 well plate. Media was exchanged on days 3 and 5. For feeding of melanoma cells to autologous DCs, melanoma cells were irradiated with 150Gy and cultured in serum-free RPMI overnight. DCs were cultured with/without melanoma cells in complete RPMI (0.25×10⁶ DC and 0.25×10⁶ melanoma) in a 48-well plate for 5h at 37°C, followed by addition of 30µg/ml poly-inosinic-poly-cytidylic acid (Sigma-Aldrich) to induce DC maturation. After overnight culture, DCs were harvested and used as antigen-presenting cells on ELISPOT assays.
IFN-γ enzyme-linked immunospot (ELISPOT) assay
IFN-γ ELISPOT assays were performed using 96-well MultiScreen Filter Plates (Millipore), coated with 2µg/ml anti-human IFN-γ mAb overnight (1-D1K, Mabtech). Plates were washed with PBS and blocked with complete RPMI before use. For pre-stimulated T cells, 5×10³ T cells and 1×10⁴ CD8+ T cells for detection of CD4+ and CD8+ T cell responses, respectively, were co-cultured with 1×10⁴ autologous CD4+ and CD8+ T cell-depleted PBMC, 8×10⁴ B cells, 1×10⁴ autologous tumor, or 5×10³ autologous DCs, unless otherwise stated (Figure 3e: 2×10⁴ CD8+ T cells plated; Figure 4c: 1×10⁴ T cells plated). APCs were pulsed with peptides (2–10µg/ml) or peptides were directly added to the ELISPOT wells with APCs and incubated with T cells overnight in complete RPMI at 37°C. For ex vivo ELISPOT, 2×10⁵ PBMC were plated with 2µg/ml peptide and incubated overnight. Plates were rinsed with PBS containing 0.05% Tween-20 and then 1µg/ml anti-human IFN-γ mAb (7-B6-1-Biotin, Mabtech) was added, followed by Streptavidin-ALP (Mabtech). After rinsing, SIGMA FAST 5-Bromo-4-chloro-3-indolyl phosphate/Nitro blue tetrazolium (Sigma-Aldrich) was used to develop the immunospots, and spots were imaged and enumerated (Cellular Technology Ltd). For some experiments, APCs were cultured on the ELISPOT plate with HLA blocking antibodies (10µg/ml; pan anti-DR [clone: L243] or anti-HLA I [clone: W6/32]) for 1–2h in advance of the addition of peptides and T cells to the wells. Ex vivo responses were scored positive if >55 spot forming cells (SFC) were detected and were at least 1.5 standard deviations (SD) over the DMSO control (> 3SD over background for Patients 5 and 6). For Figure 2b, for each patient, the numbers of SFC were regressed on assay, time, and the interaction of assay and time using repeated measures models with an unstructured covariance. P-values (t-test) for the comparisons of each pool against the mock were adjusted using the Benjamini-Hochberg procedure to maintain an overall alpha of 0.05 at each time within patient.
Intracellular cytokine staining and CD107αβ degranulation assay
For ex vivo intracellular cytokine detection, PBMCs were stimulated with 5µg/ml peptide or 50ng/ml PMA (Sigma-Aldrich) and 1µg/ml ionomycin (Sigma-Aldrich) in complete RPMI with 10µg/ml brefeldin A (Sigma-Aldrich) at 37°C overnight. For detection of cytokines from pre-stimulated CD8+ T cells, 2×10⁶ T cells were re-stimulated with 1×10⁶ T cell-depleted PBMCs pulsed with 5µg/ml peptide in complete RPMI with 10µg/ml brefeldin A at 37°C for overnight. Subsequently, cells were stained with antibodies against surface markers for 20min at 4°C, followed by fixation with 1% formaldehyde at 4°C for 20min, and then stained with antibodies against cytokines in 0.5% saponin solution at 4°C for 1h to overnight. Anti-CD4 antibody (conjugated with PerCP-Cy5.5, clone OKT-4, eBioscience), CD8 (PE-Cy7, SK1, eBioscience), CD3 (APCCy7, HIT3a, Biolegend), CD14 (BV510, M5E2, Biolegend), CD19 (BV510, HIB19, Biolegend), IFN-γ (APC, 4S.B3, Biolegend), TNF-α (BV421, Mab11, Biolegend) and IL-2 (PE, MQ1-17H12, Biolegend) were used. CD107αβ degranulation assay was performed by culturing 5×10⁵ T cells and 1.5×10⁵ target minigene-expressing B cells with Alexa Fluor647-conjugated CD107α (H4A3) and CD107β (H4B4) antibodies (BD Biosciences) in complete RPMI for 6h at 37°C. Cells were stained with anti-CD4, CD8 and CD69 (Pacific Blue, FN50, Biolegend) antibodies for 30min at room temperature, followed by fixation with 4% formaldehyde. Flow cytometry analysis was performed on a BD FACSCanto II HTS instrument.
Generation of HLA-DR tetramers loaded with defined neoantigen peptides
DR1/CLIP or and DR4/CLIP complexes were expressed in stably transfected CHO cells as previously described40. The DRα and β chain extracellular domains carried Jun and Fos dimerization domains; a C-terminal BirA site was attached to the DRα chain to enable site-specific biotinylation. The peptide binding site was occupied by a CLIP peptide that was linked through a thrombin-cleavable linker to the N-terminus of the mature DRβ chain. DR/CLIP complexes were purified from CHO cell supernatants by affinity chromatography using mAb L243 (American Type Culture Collection). Purified DR molecules were biotinylated with a 1:20 molar ratio of BirA:DR as described40. Prior to peptide loading, DR complexes were treated with thrombin for 2h to release the CLIP peptide. Peptide-exchange reactions were carried out with a 15-fold molar excess of dansyl-labeled peptides (21st Century Biochemicals) in a buffer containing 50mM sodium citrate, 1% octylglucoside, 100mM NaCl, and 1x protease inhibitor cocktail overnight at 30 °C. DR/peptide complexes were separated from unbound peptide using a Superose 12 HPLC gel filtration column (Amersham). DR molecules loaded with defined neoantigen peptides were then isolated using an anti-dansyl affinity column. Complexes were eluted from the column using 50mM CAPS, pH 11.5 and neutralized with 1M phosphate, pH 6.0. Biotinylated DR/peptide monomers were buffer exchanged with PBS, concentrated to >1mg/mL, and frozen in aliquots at −80°C. Fluorophore-labeled streptavidin (either PE or APC) was added to biotinylated DR/peptide monomers at a 1:4 molar ratio in four separate additions over 40min at room temperature.
Tetramer labeling of CD4+ T cells
Patient PBMCs that were CD4-enriched using CD4+ T cell Isolation Kit (Miltenyi Biotec) were stained with both APC- and PE-labeled tetramers at 20µg/mL in RPMI containing 10% FBS, 10 mM HEPES, 2mM glutamine and 50U/mL Pen/Strep for 1h at room temperature. DR/CLIP tetramers were used as negative controls. The cell density during staining was 10–20×106 cells/mL. Unbound tetramer was removed using two washes with flow staining buffer (PBS +2%FBS). Cells were then stained with Live/Dead Aqua (Invitrogen) for 15min at room temperature, following by staining with anti-CD4 (Alexa Fluor700, OKT4, Biolegend), anti-CD3 (BV421, UCHT1, Biolegend), and anti-CD14/CD19 (BV510) for 20min at 4°C. Cells were washed once with PBS and analyzed on a BD Aria cell sorter.
Single cell trancriptome data generation and analysis
Single cell transcriptomes of CD4+ T cells prior to vaccination and of class II tetramer-positive CD4+ T cells post-vaccination were generated using the CEL-Seq2 protocol with the following modifications: single cells were sorted into 0.6µL of 1% NP-40 buffer in a 384-well plate, into which 0.6µL of barcoded reverse transcriptase reaction (RT) primers and a mixture of dNTPs were added. The plate was incubated at 65°C for 5min, and then moved immediately to ice. Reverse transcription, the 2nd strand synthesis reaction and the in vitro transcription reaction were carried out as previously described41. Amplified RNA (aRNA) was fragmented at 80°C for 3min and cleaned up with RNAClean XP beads. aRNA was converted to cDNA using random priming, and then Illumina adaptor sequences were added by PCR. Paired-end sequencing was performed on the Hiseq 2500 in High Output Run Mode. Raw universal molecular identifier (UMI) data was first filtered to remove all UMIs that had less than 10 corresponding reads. All cells that had at least 200 genes with non-zero UMI counts and < 25% of UMIs originating from mitochondrial genes were retained for downstream analysis. All genes that were not detected in at least 3 cells were excluded. Linear (principal components) and non-linear (t-distributed stochastic neighbor embedding or t-SNE) dimensionality reduction was performed with the Seurat package42. The SCDE package43 was used to identify differentially expressed gene.
Data availability statement
DNA and RNA sequencing data are available through dbGaP (currently applying for an accession number).
Extended Data
Extended Data Figure 1. Mutational landscape of patient melanoma and radiographic evidence of complete response following anti-PD-1 therapy for Patients 2 and 6.
a, Numbers of mutations and predicted epitopes/ patient tumor. Red solid lines—patients with vaccines generated and vaccinations completed (n=6); red dotted—vaccines generated but vaccinations not initiated (n=2); grey— insufficient mutation number for vaccine generation (n=2) b, Expression (measured and normalized as transcripts per million base pairs [TPM] from the RNA-Seq data) of known melanoma-associated genes in the tumor specimens for all 10 patients entered to the trial (circles) compared to normal tissue (blue box, [GTEx data]) and melanoma from TCGA (red box; see [Methods for analysis]). c, The overall mutational landscape of the 8 patient melanoma samples for which immunizing peptides were generated (# mutations/Mb [top]; distribution of nucleotide changes [bottom]), and the presence of mutations in genes previously identified as significant in melanoma TCGA samples (n=290) by the MutSig2CV algorithm ([middle] doi:10.7908/C1J67GCG; genes ordered based on significance of recurrence reported per TCGA, Supplementary Information 2). d, Patient 2, left panel: Positron emission tomography computed tomography (PET/CT) scans obtained 8 weeks after the last booster vaccine demonstrate new intensely fludeoxyglucose F 18 (FDG)-avid right hilar lymphadenopathy measuring ~2.1cm (Maximal Standardized Uptake Value: 20.3 [yellow arrow]). Right panel: PET/CT obtained 12 weeks later, after 4 doses of pembrolizumab at 2mg/kg given every 3 weeks, revealing complete interval resolution of the right hilar lymphadenopathy consistent with a complete response. Patient 6, left panels: CT scans of the chest obtained 1 week after the last booster vaccine demonstrate multiple soft tissue nodules along the left lateral and posterolateral chest wall (left upper panel, yellow arrow indicates a 2.1×1.8 soft tissue nodule as an example) and a left lower lobe pulmonary nodule (left lower panel, yellow arrow). Right panels: CT scans obtained 16.5 weeks later, after 4 doses of pembrolizumab at 2mg/kg given every 3 weeks, revealing complete interval resolution of all lesions consistent with a complete response. On the upper panels, note that the liver is partially visualized on the pre-treatment scan (left upper panel) as a result of expirational state and not visualized on the post-treatment scan (right upper panel) as a result of inspirational state. The cross sections visualizing the soft tissue metastases in the left chest wall versus their resolution after treatment correspond. Pt: patient.
Extended Data Figure 2. Polyfunctional neoantigen-specific CD4+ T cell responses are induced by vaccination in all 6 patients.
Frequencies of CD4+ T cells secreting cytokines in response to pools of 15–16mer assay peptides (ASP), as measured by intracellular cytokine staining (ICS) after stimulation of PBMCs ex vivo with ASP pools. a, IFN-γ-producing CD4+ T cells detected by flow cytometry pre-vaccination and at week 16 post-vaccination for all 6 vaccinated patients. FACS plots were pre-gated on CD4+ T cells. Red - frequencies of ASP pool reactive IFN-γ+ cells as a proportion of all CD4+ T cells. b, Frequencies of IFN-γ, TNF-α and IL-2 producing cells within CD4+ T cells in response to ASP pools tested in samples collected pre-vaccination (blue) and at week 16 post-vaccination (red). c, Pie charts of the total CD4+ T cell responses positive for one, two or three cytokines. Bar graphs are shown of absolute frequencies of ASP pool reactive CD4+ T cells producing one, two, or three cytokines. d, Median percent cytokine production across 6 patients by CD4+ T cells ex vivo against ASP peptide pools.
Extended Data Figure 3. Polyfunctional neoantigen-specific CD8+ T cell responses are induced by vaccination in all 6 patients.
Frequencies of CD8+ T cells secreting cytokines in response to pools of 9–10mer predicted class I epitope peptides (EPT) after a single round of pre-stimulation. PBMCs were cultured with EPT pools for 10–21 days followed by ICS. a, IFN-γ-producing CD8+ T cells detected by flow cytometry pre-vaccination and at week 16 post-vaccination for all 6 vaccinated patients. FACS plots were pre-gated on CD8+ T cells. Percentages shown in red are frequencies of EPT pool reactive IFN-γ+ cells as a proportion of all CD8+ T cells. b, IFN-γ responses of CD8+ T cells against EPT pools after one round of pre-stimulation measured by ICS pre-vaccination and at 16 weeks post-vaccination. c, Bar graphs show absolute frequencies of EPT pool reactive CD8+ T cells producing one, two, or three cytokines. Pie charts summarize the fractions of the total CD8+ T cell response that are positive for one, two or three cytokines. d, Median percent cytokine production across 6 patients by CD8+ T cells following one round of pre-stimulation against EPT peptide pools.
Extended Data Figure 4. Deconvolution of peptide pools to identify neoantigen-specific T cell responses ex vivo against individual 15–16mer ASP.
Deconvolution of T cell reactivity against individual ASP by ex vivo IFN-γ ELISPOT using the week 16 post-vaccination PBMCs, tested in duplicate wells per peptide (bars: SEM). Responses were scored positive (‘*’) if >55 SFC (spot forming cell) were detected and were at least 1.5 standard deviations (SD) over the DMSO control (> 3 SD over background for Pt. 5 and 6). a, Patient 3 deconvolution. Inset: examples of positive IMP/ASP sequences; red- ASP stimulating reactivity, boxed- the mutated aa. b, Deconvolution for all other patients. c, IFN-γ ELISPOT response of Patient 3 CIT-specific CD8+ T cell line from week 16 (7×10⁴ CD8+ T cells/well) against mutated (Mut) versus corresponding wildtype (WT) peptide across a range of concentrations (10pg/ml–10µg/ml) pulsed on 1×10⁴ T cell-depleted PBMCs (hereafter referred to as APCs)/well, tested in triplicate.
Extended Data Figure 5. Mapping of CD4+ and CD8+ T cell responses to individual ASP and EPT to the immunizing peptides (IMP) for all 6 patients.
ASP and EPT covering the immunizing peptides are shown for the IMP that induced T cell responses. T cells from week 16 PBMCs were tested. Red bold and shading – to indicate mutated amino acid; absent in those IMPs arising from neoORFs. Blue underline – for class I epitopes, predicted epitopes (IC50< 300nM) based on NetMHCpan36,44; for class II epitopes, predicted epitopes <10 percentile based on the IEDB-recommended consensus approach combining NN-align, SMM-align, and CombLib if allele predictions are available, otherwise NetMHCIIpan (Supplementary Information 6)44. Red font– peptides that generated an ex vivo CD4+ T cell responses; blue font– peptides that generated T cell response after 1 round of pre-stimulation with peptides, Triangle– ASP or EPT-specific T cells that also recognized a corresponding mutated minigene; *– T cell responses against minigenes that were blocked by pan anti- HLA-DR or anti-HLA class I blocking antibodies for CD4+ or CD8+ T cells, respectively.
Extended Data Figure 6. IFN-γ response of pre- and post-vaccination PBMC against individual ASP; IFN-γ response and CD107αβ degranulation by neoantigen-specific T cell response against expressed minigenes.
PBMCs from week 16 post-vaccination were pre-stimulated with ASP and EPT for measuring CD4+ and CD8+ T cell responses, respectively. a, Detection of IFN-γ responses by ELISPOT of CD4+ T cells against individual ASP after one round of pre-stimulation with ASP pools in matched pre- and 16 weeks post-vaccination samples for Patients 1–6 (1×10⁴ APCs and 1×10⁴ T cells/well), tested in duplicate or triplicate wells per peptide (bars: SEM). b, Autologous B cells were nucleofected with in vitro translated RNA generated from Mut or WT minigenes (‘MG’). T cell lines were cultured with Mut or WT minigene nucleofected B cells, Mut minigene nucleofected B cells with anti-HLA class I or anti-HLA DR antibodies, non-nucleofected B cells with DMSO in IFN-γ ELISPOT (8×10⁴ B cells/well were plated with 5×10³ T cells/well and 1×10⁴ CD8+ T cells/well for CD4+ and CD8+ T cell response detection, respectively), tested in duplicate or triplicate wells per each condition (bars: SEM). c, T cell lines were cultured with Mut minigene nucleofected B cells or non-nucleofected B cells followed by CD107αβ degranulation assay. Representative FACS plot of Patient 3 CD107αβ degranulation assay for VPS16-specific CD8+ T cell lines (top) and other neoantigen-specific CD4+ and CD8+ T cell lines (bottom) from week 16 against autologous B cells nucleofected or not with mutated minigenes. FACS plot were pre-gated on CD8+ T cells.
Extended Data Figure 7. Surface expression of HLA class I and class II on patient melanoma cell lines and originally resected tumor.
a, Flow cytometric staining of autologous melanoma cell lines generated from primary tumor samples with anti-class I and class II or isotype antibodies. b, Dual chromogenic immunohistochemical (IHC) staining of excised FFPE tumors (see Methods for details). Representative images of positive staining for HLA class I (Pt. 4 and 2) and HLA class II (Pt. 6) and negative staining for class II (Pt. 2). Red- melanoma transcription factor SOX10, brown- HLA class I or class II. c, Summary of IHC results of 5 patients with available FFPE tissue. Semi-quantitative scoring was performed for the intensity of positive staining of melanoma cell membranes for class I or II (0, negative; 1, weak; 2, moderate; 3, strong) and for the percentage of positive staining malignant cells (0–100%). A cumulative H score was obtained by multiplying intensity score by the percentage of malignant cells with positive staining.
Extended Data Figure 8. Repertoire of neoantigen-specific T cell responses persists and broadens following PD-1 blockade; summary of all CD4+ and CD8+ T cell responses against neoantigens across the 6 patients.
a, Persistent or new responses to mutated peptides following PD-1 blockade (Pembrolizumab) are shown. PBMCs from Patients 2 and 6 (pre-vaccination, week 16 post-vaccination or 11.5 months [Patient 2] or 8.5 months [Patient 6] after initiation of pembrolizumab therapy) were pre-stimulated for 21 days with ASP or EPT pools, and reactivity against individual ASP and EPT were then tested by IFN-γ ELISPOT. 1×10⁴ APCs/well were plated with 1×10⁴ T cell lines/well and 1×10⁴ CD8+ T cell lines/well for CD4+ and CD8+ T cell response detection, respectively, tested in duplicate or triplicate wells per peptide (bars indicate SEM). Each line represents IFN-γ response against a single ASP or EPT tested per immunizing peptide. (#) for each gene – total number of ASP or EPT tested per immunizing peptide. b, The rings, from outer to inner, show: (1) predicted affinity of peptide for HLA. Heat map scaled from darkest (lowest IC50 [nM], or highest affinity) to lightest (highest IC50 [nM], or lowest affinity); (2) level of transcript expression of the tumor, scaled from darkest (highest number of transcripts per million reads [TPM] ) mapped to lightest (lowest TPM); (3) reactivity to peptide-pulsed autologous APCs; (4) reactivity to B cells nucleofected with minigenes; (5) reactivity to cultured autologous melanoma cells. c, d, Ex vivo class II tetramer staining of Patient 1 CD4+ T cells. Visualization of transcriptomes of single CD4+ T cells pre-vaccination and tetramer-positive CD4+ cells post-vaccination by tSNE.
Extended Data Table 1.
Patient characteristics
| Patient ID | Age | Gender | Primary site | Site of resected disease | Stage | Previous Treatment |
Recurrence after NeoVax Y/N (Wks) |
|---|---|---|---|---|---|---|---|
| 1 | 26 | M | Back | Axillary LN | IIIC (T3bN3M0) | IFNα | N |
| 2 | 68 | F | Back | Lung | IVM1b (T4aN0M1b) | None | Y(*6, †28) |
| 3 | 51 | F | Left Calf | Skin - in transit | IIIC (T3bN2cM0) | None | N |
| 4 | 56 | M | Back | Axillary LN | IIIC (T4bN2bM0) | None | N |
| 5 | 58 | F | Left Arm | Skin | IIIC(T2aN2cM0) | None | N |
| 6 | 61 | M | Chest | Lung | IVM1b (T2aN0M1b) | IFNα | Y (*7, †20) |
|
| |||||||
| 7 | 28 | F | Unknown | Cervical LN | IIIB (TxN1bM0) | None | N/A |
| 8 | 63 | M | Back | Skin - Satellite Nodule | IIIB (T3aN2cM0) | None | N/A |
| 9 | 71 | M | Shoulder | Axillary LN | IIIB (T2aN1bM0) | IFNα | N/A |
| 10 | 34 | M | Right Foot | Femoral LN | IIIC (T4aN3M0) | None | N/A |
M: male; F: female; LN: lymph node; N/A: not applicable; IFNα: Interferon alpha.
Weeks from vaccination initiation to recurrence on vaccine
Weeks from vaccination initiation to further progression after vaccine. Shaded: vaccinated patients.
Extended Data Table 2.
Class II tetramer information
| Patient | Gene | Peptide sequence for tetramer | HLA allele | Predicted class II epitope sequence |
Predicted percentile rank* |
|---|---|---|---|---|---|
| 1 | RUSC2 | SVGDFSQEFSPIQEAQQD(K-dansyl)-amide | HLA- DRB1*04:01 | SVGDFSQEFSPIQEA | 2.16 |
| HLA-DRB1*04:01 | DFSQEFSPIQEAQQD | 5.77 | |||
| 4 | ARHGAP29 | PGKIHLFEAEFTQVAKKE(K-dansyl)-amide | HLA-DRB1*01:01 | LPGKIHLFEAEFTQV | 24.59 |
| HLA-DRB1“01:01 | IHLFEAEFTQVAKKE | 28.84 |
Consensus method in IEDB
Supplementary Material
Acknowledgments
The authors thank J. Russell and the DFCI Center for Immuno-Oncology (CIO) staff, M. Copersino (Regulatory Affairs), B. Meyers, C. Harvey, and S. Bartel (Clinical Pharmacy), A. Lako (CIO), M. Bowden (Center for Molecular Oncologic Pathology), O. Sturtevant, H. Negre, SY Kim, MA Kelley (Cell Manipulation Core Facility), the Pasquarello Tissue Bank (all at DFCI), T. Bowman (DFHCC Specialized Histopathology Core Laboratory), and the Broad Institute’s Biological Samples, Genetic Analysis, and Genome Sequencing Platforms, S. Hodi, G. Dranoff, M. Rajasagi, U. Burkhardt, S. Sarkizova, J. Fan and P. Bachireddy for discussions, J. Petricciani and M. Krane for regulatory advice, B. McDonough (CSBio) and S.Thorne (CuriRx) for peptide development.
This research was made possible by a generous gift from the Blavatnik Family Foundation, and was supported by grants from the Broad Institute SPARC program and the National Institutes of Health (NCI-1RO1CA155010-02, NHLBI-5R01HL103532-03; NCI-SPORE-2P50CA101942-11A1 [to DBK]; NCI-R50 RCA211482A [to SS]), from the Francis and Adele Kittredge Family Immuno-Oncology and Melanoma Research Fund (to PAO), the Faircloth Family Research Fund (to PAO) and the DFCI Center for Cancer Immunotherapy Research fellowship (to ZH). C.J.W. is a Scholar of the Leukemia and Lymphoma Society.
Footnotes
Author Contributions
P.A.O. was the Principal Investigator and IND holder. C.J.W., N.H., P.A.O. and E.F.F. directed the overall study design. Z.H. designed and performed experimental and data analysis together with D.B.K., D.J.B., W.Z., L.P., C.C., S.L. and D.J.L.; S.A.S., T.A.C., J.S., J.S. and W.J.L. and E.F.F. analyzed sequencing data and selected neoantigen targets; D.H.B. and M.S enabled sample collection and immune monitoring; H.D. and J.R. directed vaccine preparation; A.L. and K.W. designed and generated tetramers; A.G.H. and D.N. designed and performed statistical analyses; T.E., A.S., I.J. and K.N. helped design the vaccine formulation; O.O. coordinated clinical research; P.A.O., E.I.B. and C.H.Y. provided patient samples; J.C.A., E.G. and S.J.R performed pathology review; M.H., N.L., S.G. and G.G. helped devise the computational pipeline; N.H., C.J.W., E.F.F., T.A.C and E.S.L. developed the overall program strategy. P.A.O., Z.H., E.F.F., N.H. and C.J.W. wrote the manuscript; all authors discussed and interpreted results.
Competing Financial Interests (Online only)
E.F.F is a founder and employee of Neon Therapeutics; N.H. and C.J.W. are founders of Neon Therapeutics and members of its scientific advisory board. P.A.O. has advised Neon Therapeutics. E.S.L. is a founder of Neon Therapeutics and a member of the Board of Directors. K.N. and I.J. are employees of CuriRx. Patent applications have been filed on aspects of the described work entitled as follows: Compositions and Methods for Personalized Neoplasia Vaccines (N.H., E.F.F., and C.J.W.), Methods for Identifying Tumor Specific Neo-Antigens (N.H. and C.J.W.), Formulations for Neoplasia Vaccines (E.F.F., K.N., and I.J.) and Combination Therapy for Neoantigen Vaccine (N.H., C.J.W., and E.F.F). S.J.R. receives research funding from Bristol-Myers Squibb, MedImmune and is on the scientific advisory board for Perkin Elmer Inc. The remaining authors declare no competing financial interests.
References
- 1.Schumacher TN, Schreiber RD. Neoantigens in cancer immunotherapy. Science. 2015;348:69–74. doi: 10.1126/science.aaa4971. [DOI] [PubMed] [Google Scholar]
- 2.Hacohen N, Fritsch EF, Carter TA, Lander ES, Wu CJ. Getting personal with neoantigen-based therapeutic cancer vaccines. Cancer immunology research. 2013;1:11–15. doi: 10.1158/2326-6066.CIR-13-0022. [DOI] [PMC free article] [PubMed] [Google Scholar]
- 3.Kenter GG, et al. Vaccination against HPV-16 oncoproteins for vulvar intraepithelial neoplasia. The New England journal of medicine. 2009;361:1838–1847. doi: 10.1056/NEJMoa0810097. [DOI] [PubMed] [Google Scholar]
- 4.Caskey M, et al. Synthetic double-stranded RNA induces innate immune responses similar to a live viral vaccine in humans. The Journal of experimental medicine. 2011;208:2357–2366. doi: 10.1084/jem.20111171. [DOI] [PMC free article] [PubMed] [Google Scholar]
- 5.Robert C, et al. Pembrolizumab versus Ipilimumab in Advanced Melanoma. The New England journal of medicine. 2015;372:2521–2532. doi: 10.1056/NEJMoa1503093. [DOI] [PubMed] [Google Scholar]
- 6.Sykulev Y, Joo M, Vturina I, Tsomides TJ, Eisen HN. Evidence that a single peptide-MHC complex on a target cell can elicit a cytolytic T cell response. Immunity. 1996;4:565–571. doi: 10.1016/s1074-7613(00)80483-5. [DOI] [PubMed] [Google Scholar]
- 7.Stephen TL, et al. SATB1 Expression Governs Epigenetic Repression of PD-1 in Tumor-Reactive T Cells. Immunity. 2017;46:51–64. doi: 10.1016/j.immuni.2016.12.015. [DOI] [PMC free article] [PubMed] [Google Scholar]
- 8.Tran E, et al. Cancer immunotherapy based on mutation-specific CD4+ T cells in a patient with epithelial cancer. Science. 2014;344:641–645. doi: 10.1126/science.1251102. [DOI] [PMC free article] [PubMed] [Google Scholar]
- 9.Schumacher T, et al. A vaccine targeting mutant IDH1 induces antitumour immunity. Nature. 2014;512:324–327. doi: 10.1038/nature13387. [DOI] [PubMed] [Google Scholar]
- 10.van Rooij N, et al. Tumor exome analysis reveals neoantigen-specific T-cell reactivity in an ipilimumab-responsive melanoma. Journal of clinical oncology : official journal of the American Society of Clinical Oncology. 2013;31:e439–442. doi: 10.1200/JCO.2012.47.7521. [DOI] [PMC free article] [PubMed] [Google Scholar]
- 11.Rizvi NA, et al. Cancer immunology. Mutational landscape determines sensitivity to PD-1 blockade in non-small cell lung cancer. Science. 2015;348:124–128. doi: 10.1126/science.aaa1348. [DOI] [PMC free article] [PubMed] [Google Scholar]
- 12.Linnemann C, et al. High-throughput epitope discovery reveals frequent recognition of neo-antigens by CD4+ T cells in human melanoma. Nat Med. 2015;21:81–85. doi: 10.1038/nm.3773. [DOI] [PubMed] [Google Scholar]
- 13.Prickett TD, et al. Durable Complete Response from Metastatic Melanoma after Transfer of Autologous T Cells Recognizing 10 Mutated Tumor Antigens. Cancer immunology research. 2016;4:669–678. doi: 10.1158/2326-6066.CIR-15-0215. [DOI] [PMC free article] [PubMed] [Google Scholar]
- 14.Carreno BM, et al. Cancer immunotherapy. A dendritic cell vaccine increases the breadth and diversity of melanoma neoantigen-specific T cells. Science. 2015;348:803–808. doi: 10.1126/science.aaa3828. [DOI] [PMC free article] [PubMed] [Google Scholar]
- 15.Kreiter S, et al. Mutant MHC class II epitopes drive therapeutic immune responses to cancer. Nature. 2015;520:692–696. doi: 10.1038/nature14426. [DOI] [PMC free article] [PubMed] [Google Scholar]
- 16.Martin SD, et al. Low Mutation Burden in Ovarian Cancer May Limit the Utility of Neoantigen-Targeted Vaccines. PloS one. 2016;11:e0155189. doi: 10.1371/journal.pone.0155189. [DOI] [PMC free article] [PubMed] [Google Scholar]
- 17.Stern LJ, et al. Crystal structure of the human class II MHC protein HLA-DR1 complexed with an influenza virus peptide. Nature. 1994;368:215–221. doi: 10.1038/368215a0. [DOI] [PubMed] [Google Scholar]
- 18.Rossjohn J, et al. T cell antigen receptor recognition of antigen-presenting molecules. Annual review of immunology. 2015;33:169–200. doi: 10.1146/annurev-immunol-032414-112334. [DOI] [PubMed] [Google Scholar]
- 19.Falk K, Rotzschke O, Stevanovic S, Jung G, Rammensee HG. Allele-specific motifs revealed by sequencing of self-peptides eluted from MHC molecules. Nature. 1991;351:290–296. doi: 10.1038/351290a0. [DOI] [PubMed] [Google Scholar]
- 20.Mildner A, Jung S. Development and function of dendritic cell subsets. Immunity. 2014;40:642–656. doi: 10.1016/j.immuni.2014.04.016. [DOI] [PubMed] [Google Scholar]
- 21.Spitzer MH, et al. Systemic Immunity Is Required for Effective Cancer Immunotherapy. Cell. 2017;168:487–502 e415. doi: 10.1016/j.cell.2016.12.022. [DOI] [PMC free article] [PubMed] [Google Scholar]
- 22.Haabeth OA, et al. Idiotype-specific CD4(+) T cells eradicate disseminated myeloma. Leukemia. 2016;30:1216–1220. doi: 10.1038/leu.2015.278. [DOI] [PubMed] [Google Scholar]
- 23.Hirschhorn-Cymerman D, et al. Induction of tumoricidal function in CD4+ T cells is associated with concomitant memory and terminally differentiated phenotype. The Journal of experimental medicine. 2012;209:2113–2126. doi: 10.1084/jem.20120532. [DOI] [PMC free article] [PubMed] [Google Scholar]
- 24.Abelin JG, et al. Mass Spectrometry Profiling of HLA-Associated Peptidomes in Mono-allelic Cells Enables More Accurate Epitope Prediction. Immunity. 2017;46:315–326. doi: 10.1016/j.immuni.2017.02.007. [DOI] [PMC free article] [PubMed] [Google Scholar]
- 25.Fisher S, et al. A scalable, fully automated process for construction of sequence-ready human exome targeted capture libraries. Genome biology. 2011;12:R1. doi: 10.1186/gb-2011-12-1-r1. [DOI] [PMC free article] [PubMed] [Google Scholar]
- 26.Gnirke A, et al. Solution hybrid selection with ultra-long oligonucleotides for massively parallel targeted sequencing. Nature biotechnology. 2009;27:182–189. doi: 10.1038/nbt.1523. [DOI] [PMC free article] [PubMed] [Google Scholar]
- 27.Chapman MA, et al. Initial genome sequencing and analysis of multiple myeloma. Nature. 2011;471:467–472. doi: 10.1038/nature09837. [DOI] [PMC free article] [PubMed] [Google Scholar]
- 28.Berger MF, et al. The genomic complexity of primary human prostate cancer. Nature. 2011;470:214–220. doi: 10.1038/nature09744. [DOI] [PMC free article] [PubMed] [Google Scholar]
- 29.Cibulskis K, et al. ContEst: estimating cross-contamination of human samples in next-generation sequencing data. Bioinformatics. 2011;27:2601–2602. doi: 10.1093/bioinformatics/btr446. [DOI] [PMC free article] [PubMed] [Google Scholar]
- 30.DePristo MA, et al. A framework for variation discovery and genotyping using next-generation DNA sequencing data. Nature genetics. 2011;43:491–498. doi: 10.1038/ng.806. [DOI] [PMC free article] [PubMed] [Google Scholar]
- 31.Saunders CT, et al. Strelka: accurate somatic small-variant calling from sequenced tumor-normal sample pairs. Bioinformatics. 2012;28:1811–1817. doi: 10.1093/bioinformatics/bts271. [DOI] [PubMed] [Google Scholar]
- 32.Robinson JT, et al. Integrative genomics viewer. Nature biotechnology. 2011;29:24–26. doi: 10.1038/nbt.1754. [DOI] [PMC free article] [PubMed] [Google Scholar]
- 33.Ramos AH, et al. Oncotator: cancer variant annotation tool. Human mutation. 2015;36:E2423–2429. doi: 10.1002/humu.22771. [DOI] [PMC free article] [PubMed] [Google Scholar]
- 34.Torres-Garcia W, et al. PRADA: pipeline for RNA sequencing data analysis. Bioinformatics. 2014;30:2224–2226. doi: 10.1093/bioinformatics/btu169. [DOI] [PMC free article] [PubMed] [Google Scholar]
- 35.Hoof I, et al. NetMHCpan, a method for MHC class I binding prediction beyond humans. Immunogenetics. 2009;61:1–13. doi: 10.1007/s00251-008-0341-z. [DOI] [PMC free article] [PubMed] [Google Scholar]
- 36.Lundegaard C, Lund O, Nielsen M. Prediction of epitopes using neural network based methods. Journal of immunological methods. 2011;374:26–34. doi: 10.1016/j.jim.2010.10.011. [DOI] [PMC free article] [PubMed] [Google Scholar]
- 37.Roemer MG, et al. Classical Hodgkin Lymphoma with Reduced beta2M/MHC Class I Expression Is Associated with Inferior Outcome Independent of 9p24.1 Status. Cancer immunology research. 2016;4:910–916. doi: 10.1158/2326-6066.CIR-16-0201. [DOI] [PMC free article] [PubMed] [Google Scholar]
- 38.Cai A, et al. Mutated BCR-ABL generates immunogenic T-cell epitopes in CML patients. Clinical cancer research : an official journal of the American Association for Cancer Research. 2012;18:5761–5772. doi: 10.1158/1078-0432.CCR-12-1182. [DOI] [PMC free article] [PubMed] [Google Scholar]
- 39.Lu YC, et al. Efficient identification of mutated cancer antigens recognized by T cells associated with durable tumor regressions. Clinical cancer research : an official journal of the American Association for Cancer Research. 2014;20:3401–3410. doi: 10.1158/1078-0432.CCR-14-0433. [DOI] [PMC free article] [PubMed] [Google Scholar]
- 40.Day CL, et al. Ex vivo analysis of human memory CD4 T cells specific for hepatitis C virus using MHC class II tetramers. The Journal of clinical investigation. 2003;112:831–842. doi: 10.1172/JCI18509. [DOI] [PMC free article] [PubMed] [Google Scholar]
- 41.Hashimshony T, et al. CEL-Seq2: sensitive highly-multiplexed single-cell RNA-Seq. Genome biology. 2016;17:77. doi: 10.1186/s13059-016-0938-8. [DOI] [PMC free article] [PubMed] [Google Scholar]
- 42.Satija R, Farrell JA, Gennert D, Schier AF, Regev A. Spatial reconstruction of single-cell gene expression data. Nature biotechnology. 2015;33:495–502. doi: 10.1038/nbt.3192. [DOI] [PMC free article] [PubMed] [Google Scholar]
- 43.Kharchenko PV, Silberstein L, Scadden DT. Bayesian approach to single-cell differential expression analysis. Nature methods. 2014;11:740–742. doi: 10.1038/nmeth.2967. [DOI] [PMC free article] [PubMed] [Google Scholar]
- 44.Lundegaard C, et al. NetMHC-3.0: accurate web accessible predictions of human, mouse and monkey MHC class I affinities for peptides of length 8–11. Nucleic acids research. 2008;36:W509–512. doi: 10.1093/nar/gkn202. [DOI] [PMC free article] [PubMed] [Google Scholar]
Associated Data
This section collects any data citations, data availability statements, or supplementary materials included in this article.
Supplementary Materials
Data Availability Statement
DNA and RNA sequencing data are available through dbGaP (currently applying for an accession number).


