Abstract
Loss-of-function mutations in the Notch ligand, Jagged1 (Jag1), result in multi-system developmental pathologies associated with Alagille syndrome (ALGS). ALGS patients present with skeletal manifestations including hemi-vertebrae, reduced bone mass, increased fracture incidence and poor bone healing. However, it is not known whether the increased fracture risk is due to altered bone homeostasis (primary) or nutritional malabsorption due to chronic liver disease (secondary). To determine the significance of Jag1 loss in bone, we characterized the skeletal phenotype of two Jag1-floxed conditional knockout mouse models: Prx1-Cre;Jag1f/f to target osteoprogenitor cells and their progeny, and Col2.3-Cre;Jag1f/f to target mid-stage osteoblasts and their progeny. Knockout phenotypes were compared to wild-type (WT) controls using quantitative microcomputed tomography, gene expression profiling and mechanical testing. Expression of Jag1 and the Notch target genes Hes1 and Hey1 was downregulated in all Jag1 knockout mice. Osteoblast differentiation genes were downregulated in whole bone of both groups, but unchanged in Prx1-Cre;Jag1f/f cortical bone. Both knockout lines exhibited changes in femoral trabecular morphology including decreased bone volume fraction and increased trabecular spacing, with males presenting a more severe trabecular osteopenic phenotype. Prx1-Cre;Jag1f/f mice showed an increase in marrow mesenchymal progenitor cell number and, counterintuitively, developed increased cortical thickness resulting from periosteal expansion, translating to greater mechanical stiffness and strength. Similar alterations in femoral morphology were observed in mice with canonical Notch signaling disrupted using Prx1-Cre-regulatable dominant-negative mastermind like-protein (dnMAML). Taken together, we report that 1) Jag1 negatively regulates the marrow osteochondral progenitor pool, 2) Jag1 is required for normal trabecular bone formation and 3) Notch signaling through homotypic Jag1 signaling in osteochondral progenitors, but not mature osteoblasts, inhibits periosteal expansion. Therefore, Jag1 signaling within the osteoblast lineage regulates bone metabolism in a compartment-dependent manner. Moreover, loss of Jag1 function in osteoblast lineage cells may contribute to the skeletal phenotype associated with ALGS.
Keywords: Stromal/stem cells, Osteoblasts, Osteoporosis, Genetic animal models, Bone QCT/µCT
1. Introduction
The Notch signaling pathway is a highly conserved cell-cell signaling mechanism regulating developmental processes including proliferation, differentiation and cell fate determination [1]. Activation of this pathway occurs when a Notch ligand (Jagged 1, 2 or Delta-like 1, 3, or 4) expressed on the surface of a signaling cell interacts with a Notch receptor (Notch 1–4) expressed on the surface of a receiving cell. The Notch intracellular domain (NICD) is liberated via-a multi-stage proteolytic event mediated first by the metalloproteinase, ADAM17, and then by the γ-secretase complex, comprised of Presenilins 1 and 2 (Psen 1, 2). Cleaved NICD translocates to the nucleus where it binds to RBPJκ, converting the function of RBPJκ from a transcriptional repressor to an activator. Mastermind-like proteins (MAML) then bind to the NICD-RBPJκ complex and serve as a scaffold to recruit other co-activators necessary to initiate transcription of the canonical Notch target gene families, Hes and Hey [2,3].
Loss-of-function mutations in the Notch ligand gene, JAG1, are responsible for Alagille syndrome (ALGS) in humans [4,5], inducing multi-organ developmental defects, most notably bile duct paucity in the liver, congenital heart defects and skeletal anomalies [6]. ALGS patients present clinically with decreased bone mass [7] and increased risk of long bone fracture [8], traits historically assumed to be secondary to chronic cholestasis and malabsorption of fat-soluble vitamins and other dietary nutrients. However, recent liver-specific Notch knockout models have revealed that Notch signaling deficiencies impair hepatobiliary development and regeneration, but alterations in bone formation or structure are not reported [9–11]. Further supporting a direct bone-specific role for Jag1-mediated Notch signaling in regulating bone formation, a genome-wide association study identified a polymorphism at the JAG1 locus as a heritable factor predisposing certain non-ALGS individuals and populations to low bone mineral density and high risk of osteoporotic fracture [12].
Notch signaling regulates bone development and maturation in a context-specific manner [13,14]. Deletion of Notch1 and Notch2 in mesenchymal progenitor cells (Prx1-Cre;Notch1−/fNotch2f/f) or similar deletion of Psen1 and Psen2 (Prx1-Cre;Psen1f/fPsen2−/−) stimulates osteoblast differentiation and early trabecular bone formation, which is ultimately lost during aging due to depletion of the progenitor pool and increased osteoclast activity [15]. Deletion of Notch receptors or Psen in committed osteoblasts (Col2.3-Cre;Psen1f/fPsen2−/−) [16] or mature osteoblasts (Ocn-Cre;Notch1f/f) [17] does not alter early bone formation, but results in osteopenia during aging. Considered together, early expression of Notch components maintains progenitors in an undifferentiated state, but expression of these same components in cells that are committed to the osteoblast lineage supports their anabolic function. Indeed, overexpression of NICD in mature osteocytes results in increases in both trabecular and cortical bone volume, as well as enhanced canonical Wnt signaling and downregulated osteoclast activity [20]. Global deletion of the Notch target gene Hey1 also results in osteopenia [21]. Notch also has context specific effects on osteoclasts. Notch inhibits osteoclast commitment, but once osteoclasts are committed, Notch signaling enhances osteoclast maturation and function [18,19]. These results conclusively demonstrate a developmentally and temporally dependent role of Notch in bone development and homeostasis; however, the roles of specific Notch ligands during embryological bone development and maturation are still incompletely understood.
Jag1 is the most highly expressed Notch ligand during skeletal development [22] and healing [23], and its expression persists within osteoblast progenitor cell populations throughout their lifespan [24]. High Jag1 expression in mouse osteochondral progenitor cells gradually decreases during chondrogenic differentiation [25], whereas Jag1 is expressed at multiple stages of osteoblast differentiation [23]. Jag1 expression in the mesenchymal lineage also regulates hematopoietic cell behavior [26]. Activation of parathyroid hormone and its receptor in osteoblast-lineage cells increases Jag1 expression, which then promotes hematopoietic stem cell expansion [27]. Co-culture of Jag1-expressing stromal cells with bone marrow-derived macrophages inhibits osteoclast differentiation [28]. Targeted deletion of Jag1 in cranial neural crest cells using Wnt1-Cre causes maxillary hypoplasia as a result of delayed ossification, decreased bone mineral density and reduced expression of osteoblast regulators [29,30].Work in our group has shown Jag1 to be highly expressed in mesenchymal lineage cells during bone fracture healing [23] and that Jag1 can induce osteoblast differentiation. Wang et al. recently reported that loss of Notch signaling in progenitor cells, but not osteoblasts or chondrocytes, precludes fracture union [31]. Collectively, the data suggest that Jag1 positively regulates bone formation and may inhibit resorption. However, the role of Jag1 in osteoprogenitor cell-mediated long bone development and remodeling has not been adequately investigated.
The objective of this study was to determine the context-specific role of Jag1 during bone formation by using two skeletal-specific conditional Jag1 knockout mouse models: specifically, early- and late-stage differentiation. Herein, we show that Jag1 expression and signaling in osteoblast lineage cells directly alters bone geometry and bone mass.
2. Methods
2.1. Generation of mice
Jag1f/f mice [9] were crossed with mice expressing Cre recombinase (+/+ or +/−) under the control of the Prx1 promoter, both on a C57BL/6 background. All mesenchymal lineage cells in the developing mouse limb bud are derived from Prx1-expressing cells, and the Prx1 promoter is active in undifferentiated osteochondral progenitor cells [32]. Therefore, in this model (Prx1-Cre;Jag1f/f) Jag1 is conditionally deleted in progenitor cells of the limb-bud prior to skeletal development, as well as all of their progeny (Supplemental Fig. 1). WT mice for comparison are Prx1-Cre;Jag1+/+ or Prx1-Cre;Jag1f/+.
Jag1f/f mice (C57BL/6 background) were also crossed with mice expressing Cre recombinase (+/+ or +/−) from the 2.3 kb fragment of the Col1a1 promoter known as Col2.3 (Col2.3-Cre;Jag1f/f) on a CD1 background. The Col2.3 promoter is active in committed osteoblasts, but not early-stage osteoprogenitors, throughout the bone, periosteum and growth plate [33,34]. Therefore, in this model (Col2.3-Cre;Jag1f/f) Jag1 is conditionally deleted in committed osteoblasts and their progeny. WT mice for comparison are Col2.3-Cre;Jag+/+ or Col2.3-Cre;Jag1f/+ on the same C57BL/6;CD1 genetic background.
Dominant Negative Mastermind-like (dnMAML) (Prx1-Cre; dnMAML+/−) transgenic mice and littermate controls on a C57BL/6 background were also utilized in this study as a canonical Notch signaling antagonist. An established model in the field for over a decade, these animals experience Notch inhibition [35]. Following (+/+ or +/−) Cre-mediated deletion of a floxed stop cassette, these animals express a truncated dnMAML-GFP fusion protein that contains the NICD-RBPjκ complex-binding NICD domain but lacks its co-activator recruiting function. Therefore, dnMAML mice lose canonical Notch signaling just prior to gene transcription [35–37]. > 90% of cell culture purified osteoprogenitor cells express dnMAML-GFP and GFP is greatly upregulated (50-fold). Our previous results show dnMAML expression in fracture decreases Hes and Hey and markers of osteoblast differentiation [37].
2.2. Experimental design
Femurs were harvested for micro-computed tomography (µCT) analysis of bone formation from Prx1-Cre;Jag1f/f, Col2.3-Cre;Jag1f/f or dnMAML mice with respective littermate controls at 2 months (8 weeks) of age (n = 6–10). Additional femurs were collected from Prx1-Cre;Jag1f/f and control mice at 9 months of age (n = 7–12) and from dnMAML mice at 6 months (n= 3–10).
RNA from whole tibiae (including cortical bone, trabecular bone and marrow) was generated for quantitative real-time polymerase chain reaction (qPCR) analysis of gene expression in Prx1-Cre;Jag1f/f and Col2.3-Cre;Jag1f/f mice with respective littermate controls at 2 months of age. RNA was also isolated from the tibial cortical bone compartment (excluding trabecular bone and marrow) from Prx1-Cre;Jag1f/f and control mice at 2 months (n = 3–5). Animals were separated by sex for analysis based on the dimorphic intensities of observed phenotypes.
2.3. Embryonic skeletons
Mouse embryos were stained with Alcian blue and alizarin red at E18.5 in accordance with previously published methods [38].
2.4. Gene expression (qPCR)
Sample tissues were placed in RNAlater solution (Life Technologies) and stored at −80 °C until further processing. Specimens were then thawed on ice and placed in Qiazol lysis reagent (Qiagen). Tissue was homogenized using the Tissue Tearor (BioSpec Products) and mRNA was extracted using the miRNeasy Mini Kit with DNase digestion (Qiagen) to remove DNA contamination. RNA yield was determined using a NanoDrop 1000 spectrophotometer (Thermo Scientific). One µg of mRNA was reverse transcribed in 20 µL of cDNA using a High Capacity RNA-to-cDNA Kit (Applied Biosystems). Gene expression was quantified using a 7500 Fast Real-Time PCR system (Applied Biosystems) from a total of 10 µL of Master Mix per well, which included 1 × Fast SYBR Green (Applied Biosystems), forward and reverse primers (0.45 µM), and 0.5 µL of cDNA. For each gene of interest, samples were run in duplicate and control wells were run to rule out DNA contamination and primer dimer binding. Proper amplicon production was confirmed by melt curve analysis. Data were normalized to the housekeeping gene, β-actin, and presented as fold change expression to WT whole bone, calculated using the formula 2−ΔΔC(t). β-actin C(t) values were stable across treatment groups.
2.5. Micro-Computed Tomography (µCT)
Femurs were scanned using a Scanco vivaCT40 µCT system with the following parameters: 10.5 µmisotropic voxel size, 55kVp, 145 µA, 1000 projections per 180°, 200 ms integration time, forming 2-D transverse reconstructed 2,048 × 2,048 pixel images. Cortical bone parameters were measured by analyzing 50 slices (0.525 mm) in the mid-diaphysis. This defined region was the central portion between the proximal and distal ends of the femur. A semi-automated contouring method was used to determine the outer cortical bone perimeter. Briefly, a user-defined contour was drawn around the cortical bone perimeter of the first slice. This initial estimate was then subjected to automated edge detection. This contour then served as the initial estimate for the next slice, with the contouring process continued for all 50 slices. A fixed, global threshold of the maximum gray value was used to distinguish bone from soft tissue and marrow. Trabecular bone parameters were measured by analyzing 101 slices (1.06 mm) of the distal metaphysis. Briefly, the distal end of the analysis region was chosen to be 0.105 mm proximal to the end of the primary spongiosa in the marrow cavity. This assured that only trabecular bone was analyzed. Starting at this image, a user-defined contour was drawn to include trabecular bone within the marrow cavity and exclude cortical bone. User-defined contours were drawn every 10 slices (0.105 mm) and an automated morphing program was used to interpolate the contours for all images in between. A fixed, global threshold of 23% of the maximum gray value, which corresponds to 321.6 mg HA/cm3 was used to distinguish trabecular bone from soft tissue and marrow. A Gaussian low-pass filter (σ = 0.8, support= 1) was used for all analyses.
2.6. Biomechanical testing
Femurs were loaded to failure in four-point bending at 0.5 mm/s in the anterior-posterior direction using a servohydraulic testing machine (858 Minibiox II; MTS Systems Corporation) with the posterior side in tension between upper and lower supports that were 2.2 mm and 6.35 mm apart, respectively. All bones were tested at room temperature and kept moist with PBS. Crosshead displacement was recorded by using an external variable differential transducer (LVDT; Lucas Schavitts), and load data were collected with a 50-lb. load cell (Sensotec) at a sampling frequency of 2048 Hz. Load-displacement curves were analyzed for whole bone stiffness, yield load, ultimate load, elastic energy, plastic energy, total energy to failure, and displacement ratio (ratio of failure displacement to yield displacement) using custom computational code (MATLAB 7.11; Mathworks Inc.).
2.7. Cell culture
CFU-F assays were performed as described previously [39]. Briefly, whole marrow was flushed from both tibiae and femurs of mice. Cells were pelleted, resuspended in alpha-MEM with 10% serum and penicillin/ streptomycin and then single cell suspensions plated at 4 million cells per 60 mm dish in duplicate. Colonies were allowed to develop for 12 days and then stained with Alkaline phosphatase with Fast red as a counter stain. Colonies were enumerated in blinded fashion using a dissecting microscope. Mouse mesenchymal stromal/stem cell (mMSC) data presented in Supplemental Fig. 6 was run in accordance with previously published methods [40].
2.8. Statistical analysis
Homoscedastic Student's t-tests were used to compare each Jag1 knockout group to its respective WT control for all µCT and qPCR parameters (*p < 0.050, #p < 0.100). Biomechanical data were analyzed using 2-way ANOVA for each individual parameter with Bonferroni post hoc tests between sexes.
3. Results
3.1. Jag1 has minimal impact on skeletal development and spinal patterning
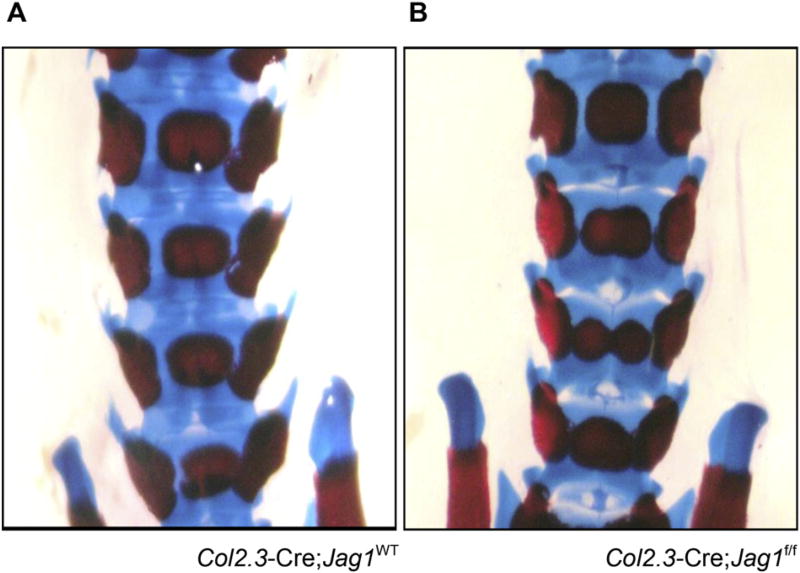
Neither Col2.3-Cre;Jag1f/f nor Prx1-Cre;Jag1f/f showed gross alterations in long bone development and growth, or body weights at harvest (data not shown). Qualitative analysis of growth plates similarly did not demonstrate any obvious abnormalities (data not shown). On the other hand, butterfly vertebrae, a phenotype associated with ALGS, developed in some percentage of the Col2.3-Cre;Jag1f/f mice (Fig. 1). This phenotype of butterfly vertebrae is well-recognized in mice with genetic mutations in Notch signaling since Notch genes govern vertebral segmentation [41]. Although Col2.3 is generally considered a reliable osteoblast specific promoter [33], off-target expression of the Cre recombinase and therefore knockout of Jag1 during embryonic spinal patterning likely caused this vertebral phenotype [34,42]. Consistent with the greater specificity of the Prx1 promoter, Prx1-Cre;Jag1f/f mice did not develop this vertebral defect.
Fig. 1.
Morphology of the embryonic skeleton. Butterfly vertebrae develop by E18.5 in Col2.3-Cre;Jag1f/f mice (frequency: 3/6) but not in WT littermates (frequency:0/9) or Prx1-Cre;Jag1f/f mice (frequency:0/5). Specimens are stained with Alcian blue and alizarin red.
3.2. Loss of Jag1 decreases Notch pathway and osteoblastic gene expression
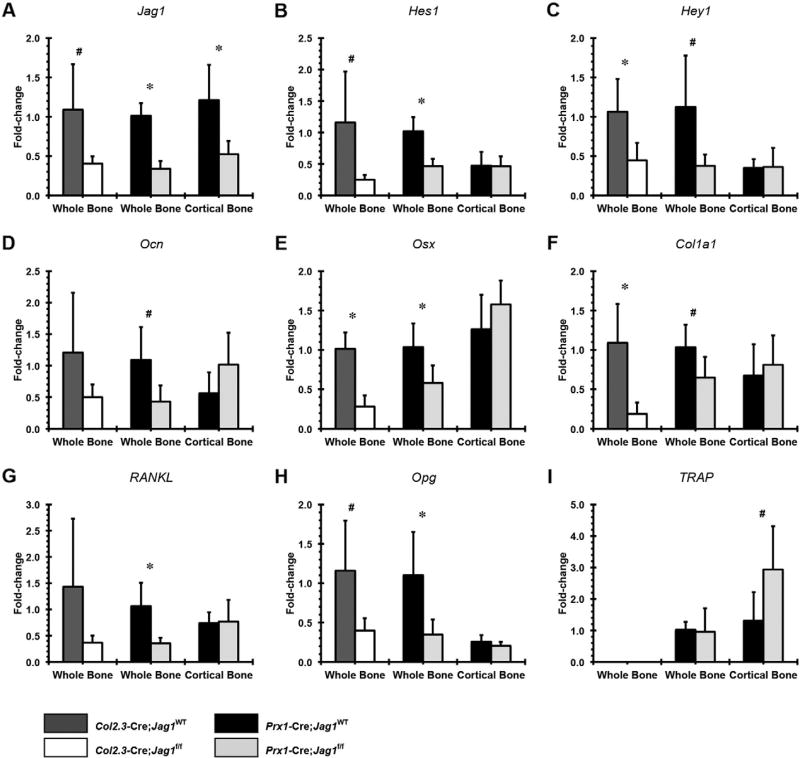
Loss of Jag1 in osteochondral progenitor cells (Prx1-Cre;Jag1f/f) resulted in reduced whole-bone expression of Jag1 and the Notch pathway genes, Hes1 and Hey1, osteoblast markers Ocn, Osx and Col1a1, and also decreased expression of the osteoclast regulators RANKL and Opg (Fig. 2). However, the Opg:RANKL ratios were not different between groups (Supplemental Fig. 2). Increased TRAP (pro-osteoclastogenesis) expression was only observed in cortical bone samples. Surprisingly, expression of osteoblast marker genes and the Notch targets Hes1 and Hey1 were unchanged in cortical bone. Differences in expression levels of Ocn (osteoblast marker) and RANKL (pro-osteoclastogenesis) lost statistical significance when Jag1 knockout was performed only in committed osteoblasts (Col2.3-Cre;Jag1f/f). On the other hand, the magnitudes of Osx and Col1a1 downregulation were greater in Col2.3-Cre;Jag1f/f mice, and CcnD1 gene expression was downregulated only in the Col2.3-Cre;Jag1f/f group (Supplemental Fig. 3). To summarize the gene expression data, loss of Jag1 signaling in osteoblast lineage cells results in broad reduction in Notch-pathway and osteoblastic marker gene expression in whole bone.
Fig. 2.
qPCR analysis of Jag1-null bones. Gene expression of Notch pathway components (A) Jag1, (B) Hes1 and (C) Hey1, osteogenic genes (D) osteocalcin (Ocn), (E) osterix (Osx) and (F) collagen type-I (Col1a1) and pro-osteoclastogenesis genes (G) receptor activator of nuclear factor kappa-B ligand (RANKL), (H) osteoprotegerin (Opg) and (I) tartrate-resistant acid phosphatase (TRAP). For all analyses, data are presented as fold change expression to each genotype's respective whole bone (Prx1-Cre;Jag1f/f or Col2.3-Cre;Jag1f/f) calculated using the formula 2−ΔΔC(t) (*p < 0.050, #p < 0.100).
3.3. Jag1 regulates bone metabolism in a bone compartment-specific manner
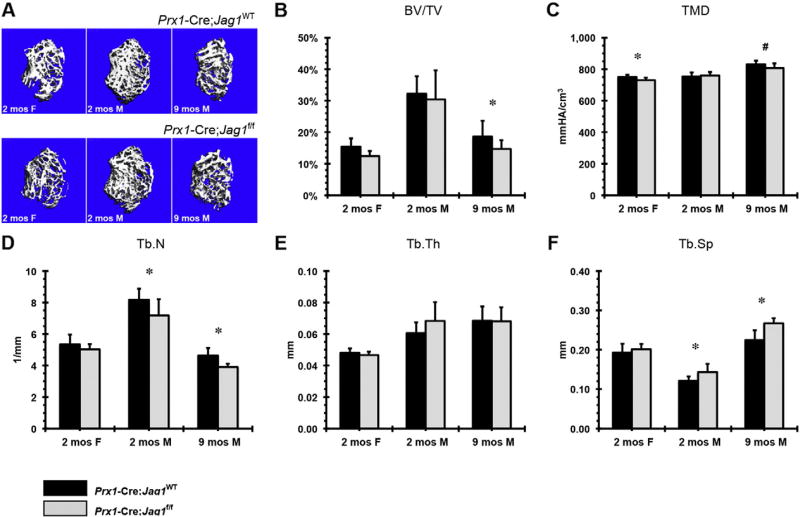
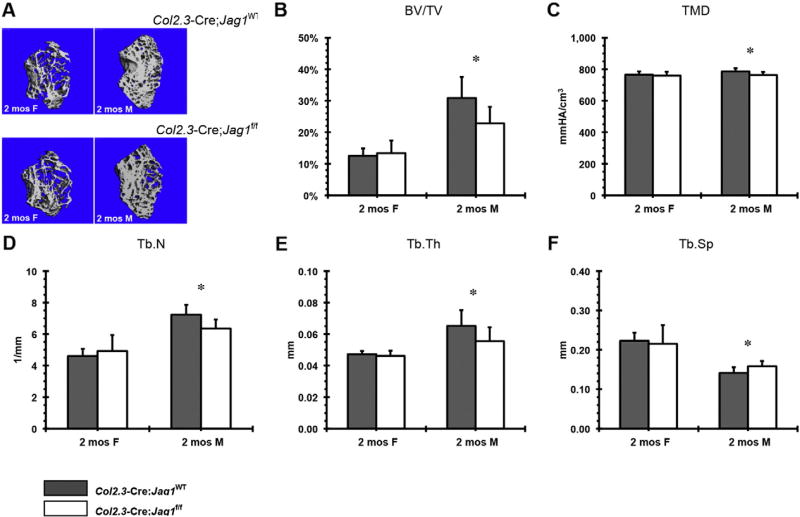
Jag1 positively regulates trabecular bone mass. Male mice in the Prx1-Cre;Jag1f/f group presented with decreased trabecular number and increased trabecular spacing at 2 months that persisted through 9 months, however, a loss of trabecular bone volume fraction was not evident until the later time point (Fig. 3). Accompanying these changes was reduction in tissue mineral density. Similarly, male mice in the Col2.3-Cre;Jag1f/f group demonstrated decreased trabecular number and thickness and increased trabecular spacing at 2 months of age (Fig. 4D–F). The particularly low expression of osteoblast marker genes in the Col2.3-Cre;Jag1f/f group relative to WT is consistent with the earlier onset of trabecular volume fraction loss and trabecular thickness in comparison to the Prx1-Cre;Jag1f/f group (Fig. 4).
Fig. 3.
µCT analysis of trabecular bone in Prx1-Cre;Jag1f/f mice at 2 months (females and males) and 9 months (males) of age: (A) representative images, (B) bone volume fraction (BV/TV), (C) tissue mineral density (TMD), (D) trabecular number (Tb.N), (E) trabecular thickness (Tb.Th) and (F) trabecular separation (Tb.Sp) (*p < 0.050, #p < 0.100).
Fig. 4.
µCT analysis of trabecular bone in Col2.3-Cre;Jag1f/f mice at 2 months (females and males) of age: (A) representative images, (B) bone volume fraction (BV/TV), (C) tissue mineral density (TMD), (D) trabecular number (Tb.N), (E) trabecular thickness (Tb.Th) and (F) trabecular separation (Tb.Sp) (*p < 0.050, #p < 0.100).
Next we evaluated the mesenchymal progenitor pool in Jag1 deficient mice to determine whether defects seen in bone mass could be associated with alterations in progenitor number. Prx1-Cre;Jag1f/f mice formed approximately twice as many CFU-F colonies as control bone cells in an in vitro CFU-F assay (Supplemental Fig. 4). This result suggests that the loss of Jag1-mediated Notch signaling increases the intramedullary mesenchymal progenitor cell population size, despite the apparent decrease in intramedullary bone formation.
3.4. Jag1 deletion promotes periosteal expansion of cortical bone
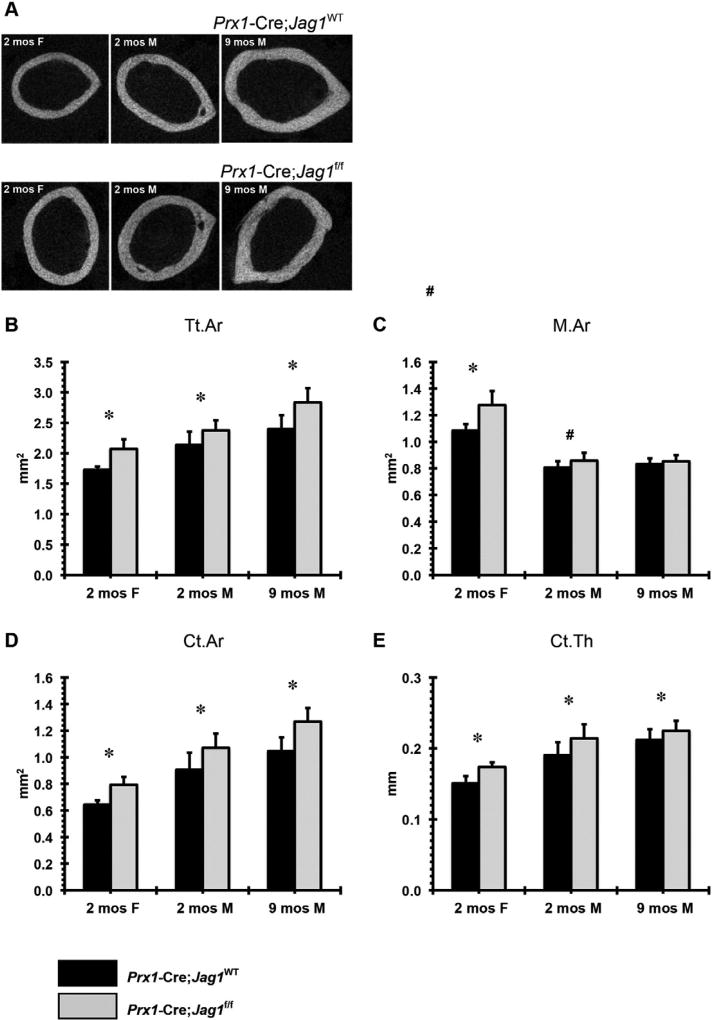
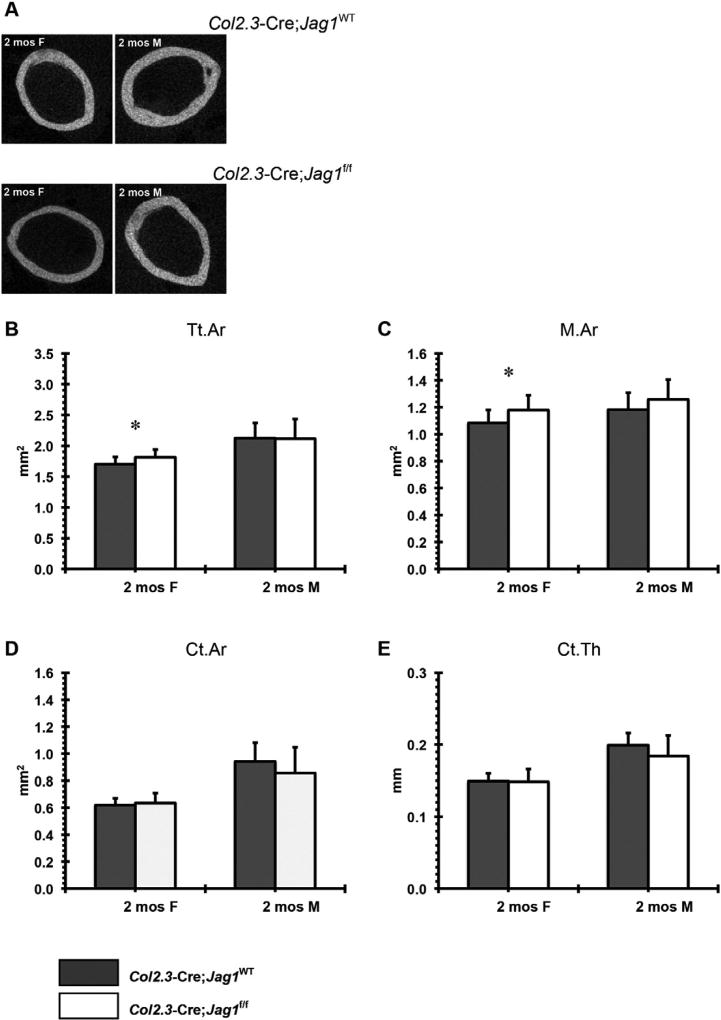
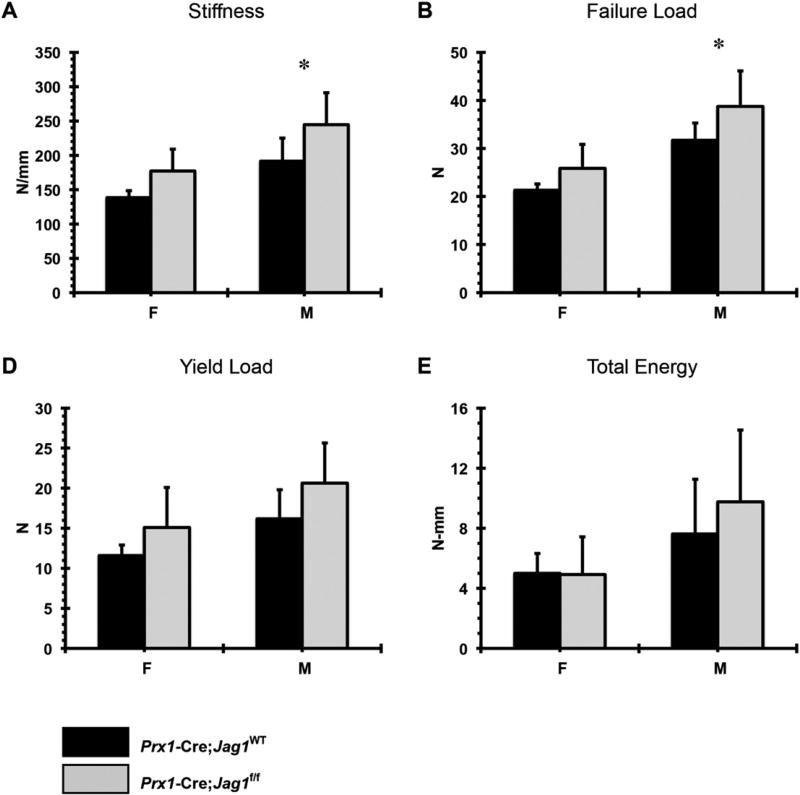
Increased total bone area, marrow area, cortical area, and cortical thickness were observed in Prx1-Cre;Jag1f/f mice of both sexes (Fig. 5). This phenotype was not present (males) or was present at a much lower magnitude (females) in the Col2.3-Cre;Jag1f/f group (Fig. 6). Consistent with the increased cortical bone mass, Prx1-Cre;Jag1f/f bones had greater stiffness and greater failure load during tensile testing (Fig. 7), concurrent with the increased moment of inertia resulting from high periosteal bone formation observed via µCT.
Fig. 5.
µCT analysis of cortical bone in Prx1-Cre;Jag1f/f mice at 2 months (females and males) and 9 months (males) of age: (A) representative 2-D images, (B) total area (Tt.Ar), (C) marrow area (M.Ar), (D) cortical bone area (Ct.Ar) and (E) cortical bone thickness (Ct.Th) (*p < 0.050, #p < 0.100).
Fig. 6.
µCT analysis of cortical bone in Col2.3-Cre;Jag1f/f mice at 2 months (females and males) of age: (A) representative 2-D images, (B) total area (Tt.Ar), (C) marrow area (M.Ar), (D) cortical bone area (Ct.Ar) and (E) cortical bone thickness (Ct.Th) (*p < 0.050, #p < 0.100).
Fig. 7.
Results of biomechanical testing: (A) stiffness, (B) failure load, (C) yield load and (D) total energy for Prx1-Cre;Jag1f/f bones versus their corresponding WT.
3.5. Disruption of canonical Notch signaling in mesenchymal progenitors increases cortical bone mass
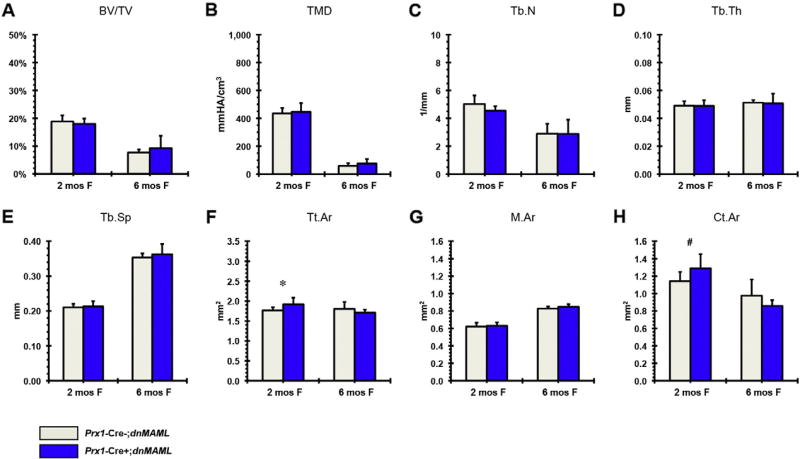
The influence of Jag1 in Prx1-Cre expressing cells could be through heterotypic signaling, i.e. Jag1 expressed on the mesenchymal progenitor cell binding to Notch receptor on an adjacent, non-mesenchymal cell or Jag1 could be signaling in a homotypic manner, within the mesenchymal lineage cells. To address this concern we blocked canonical Notch signaling using the Prx1-Cre;dnMAML+/− system [35]. Our previous results show that dnMAML expression during fracture healing decreases Hes/Hey target genes [37]. In 2-month-old dnMAML mice, similar to the observation in the Prx1-Cre;Jag1f/f mice, there is an increase in cortical bone mass due to periosteal expansion, but no apparent change in trabecular bone mass (Fig. 8).
Fig. 8.
µCT analysis of Prx1-Cre;dnMAML (A–E) trabecular and (F–H) cortical bone in females at 2 and 6 months (at 2 months: Prx1-Cre;dnMAML n = 10, control n = 6; at 6months: Prx1-Cre;dnMAML n = 3, control n = 3) (*p < 0.050, #p < 0.100).
4. Discussion
ALGS patients with Jag1 deficiency have reduced bone mass and a propensity for fracture [8]; however, since Jag1 deficiency also results in hepatobiliary dysfunction, this systemic pathology could be responsible for the skeletal abnormalities. Jag1 is the most highly expressed ligand in bone mesenchymal progenitor cells, and has variable effects on osteoblast differentiation in vitro [40]; thus, it is imperative to determine the direct, cell-autonomous effects of Jag1 on bone mass in vivo.
We disrupted Jag1 expression in osteoblast progenitors using the Prx1 and Col2.3 promoters and determined that Jag1 expression by mesenchymal lineage cells has bone compartment-specific effects. In cortical bone, the absence of Jag1 expression by (Prx1+) progenitor cells, but not osteoblasts (Col2.3+), enhances periosteal bone expansion and cortical bone mass. This phenotype is not observed following Jag1 knockout in (Col2.3+) osteoblasts. Taken together, these findings suggest that Jag1 negatively regulates differentiation of mesenchymal progenitor cells toward the osteoblast stage, but does not appear to influence the anabolic function of already-differentiated osteoblasts (Col2.3+) at the periosteal surface.
With respect to intramedullary trabecular bone, Jag1 disruption in either (Prx1+) progenitor cells or in (Col2.3+) osteoblasts decreases bone mass and osteoblast gene expression. This suggests that, in contrast to cortical bone, Jag1 positively regulates trabecular osteoblast function. Indeed, the expression of Jag1 and the target gene Hey1 are positively correlated with osteoblast gene expression (Supplemental Fig. 5).
We further conclude that the influence of Jag1 on the cortical bone phenotype is dependent upon Jag1-mediated canonical Notch signaling within the mesenchymal lineage. dnMAML mice, with canonical Notch signaling blocked in (Prx1+) progenitor cells, show cortical bone changes consistent with disruption of Jag1. On the other hand, blocking canonical Notch signaling in Prx1+ progenitor cells does not alter trabecular bone. This lack of an impact of dnMAML on trabecular bone mass could reflect the fact that dnMAML, as a dominant negative, only partially inhibits canonical signaling and its effectiveness is dependent upon the relative signal strength. Indeed, it is feasible that the dnMAML is not effectively suppressing Notch signaling within the mesenchymal lineage within the trabecular compartment. We have established that canonical Notch signaling in cortical bone is reduced relative to canonical Notch signaling in whole bone, and perhaps this accounts for the lack of an effect of the dnMAML on trabecular bone. Alternatively, the impact of trabecular Jag1 signaling on bone mass could occur through heterotypic signaling or through a non-canonical mediated pathway. For example, there is evidence that Jag1 could signal in a non-canonical manner within its own cell by reverse ligand cleavage of the intracellular domain independent of the Notch signaling pathway [43,44].
While the mechanism behind the change in cortical bone geometry in Prx1-Cre;Jag1f/f mice is unknown, there are a variety of potential explanations. Though derived from a common paraxial mesenchyme precursor during development, the osteoblasts that form trabecular bone and those that form periosteal bone are phenotypically distinct and under the control of differing regulatory pathways. Thus, it perhaps is not unexpected that the role of Jag1may be different in the periosteal bone relative to trabecular bone. Indeed, basal expression levels of Notch target genes in the cortical compartment are reduced relative to whole bone, suggesting that Notch signaling is already lower in normal mature cortical bone. Coincident with this lower basal level of Notch target gene expression, the disruption of Jag1 in cortical bone did not alter Notch target gene expression of Notch targets or osteoblastogenic markers. This is consistent with the absence of a cortical bone phenotype in the Col2.3-Cre;Jag1f/f mice. It should be noted that one limitation of the gene expression analysis is that the whole bone and cortical bone RNA samples represent heterogeneous cell populations. Future studies focusing on molecular regulation at the cellular level should focus on purifying RNA in a cell-specific manner, for instance using laser capture or ribosomal capture techniques.
One explanation for the cortical phenotype is that compensatory effects following the reduction in trabecular bone mass in knockout mice could trigger a mechanical adaptation response on the periosteal bone surface independent of the Notch pathway; however, one would then expect that the Col2.3-Cre;Jag1f/f mice would also have a more pronounced cortical phenotype. Alternatively, Jag1 disruption in cells outside of the cortical compartment may stimulate cortical bone at a distance [45,46]. We initially hypothesized that deletion of one Notch ligand may be functionally compensated via upregulation of other Notch ligands, but this does not appear to be the case. In vivo data from both knockout mice and in vitro data from a WT mMSC cell pool suggest that Jag1 participates in a positive feedback circuit: Jag1 knockout causes maintenance or downregulation of other Notch ligands, while Jag1-induced Notch activation results in upregulation of Jag1 gene expression (Supplemental Fig. 6). Finally, the expansion of the marrow osteoprogenitor pool (CFU-F) in Prx1-Cre;Jag1f/f mice may provide some insight into how the periosteum becomes thickened and expanded. Jag1 activity may not only increase the marrow osteoprogenitor pool but also increase periosteal osteoblast progenitor pool. More work is needed to fully elucidate the mechanisms underlying the observed phenotypes, and particularly to differentiate cortical and trabecular effects.
It is notable that while the cortical phenotype is present in the Prx1-Cre;Jag1f/f mice, but is limited in the Col2.3-Cre;Jag1f/f mice, the trabecular bone phenotype in the Prx1-Cre;Jag1f/f mice is less pronounced relative to the Col2.3-Cre;Jag1f/f mice. One explanation for this observation could be the expanded pool of marrow mesenchymal progenitor cells in the Prx1-Cre;Jag1f/f mice. Jag1 expression not only regulates osteoblast function, but also serves to regulate the mesenchymal progenitor pool. This is consistent with the findings of the Hilton group [15,31]. However, in those models there is essentially complete Notch signaling ablation, whereas with Jag1 disruption, signaling from other ligands can still occur within the targeted lineage. CcnD1 was significantly downregulated in Col2.3-Cre;Jag1f/f whole bone, perhaps due to direct activity of Notch on the CcnD1 promoter [47], potentially leading to cell cycle disruption and favoring progenitor cell differentiation over self-renewal [48].
Prx1-Cre;Jag1f/f trabecular and cortical bone phenotypes were present in both males and females, although the trabecular phenotype was more pronounced in the males. Similarly, trabecular phenotypes in Col2.3-Cre;Jag1f/f mice were more pronounced in males, but cortical bone phenotypes were more pronounced in the Col2.3-Cre;Jag1f/f females. It is notable that gender dimorphism in bone phenotypes has been documented in a variety of other settings [50]. Bone is particularly sensitive to sex-steroids and differences between Jag1 signaling intersecting with sex-steroid influences could account for the gender differences [51]. However, there are no known gender differences in the skeletal phenotype of ALGS.
In conclusion, we demonstrate that Notch signaling through Jag1 has highly contextual, bone compartment-specific effects. Jag1 represses cortical bone expansion by signaling in a homotypic manner in Prx1 + mesenchymal progenitors and their progeny. Conversely, Jag1 promotes increased bone mass in the trabecular compartment, and may not require homotypic signaling. Jag1 therefore represents an interesting therapeutic target for complex fracture healing, age-associated mineral loss and disorders of bone metabolism including ALGS. Furthermore these findings suggest that Jag1 dysfunction within bone directly contributes to the skeletal symptoms of ALGS, and may not be contingent on comorbid chronic liver disease. While there may not appear to be complete concordance between the findings in this mouse model and human Alagille syndrome patients, the bone phenotype of ALGS patients is not well described. Osteopenia based on radiography is described, but a thorough examination of trabecular and cortical morphometrics has not been completed. This will require a pQCT study, which is currently underway by the authors. Alternatively, it could be that the role of Jag1 in mouse bone and human bone are somewhat different, and that the imposition of liver abnormalities on the human bone further exacerbates Jag1 bone specific effects. Additional studies are required to dissect the spatiotemporal molecular dynamics of Notch-induced osteoblastogenesis.
Supplementary Material
Acknowledgments
Funding was provided by a pilot grant provided by the Center for Musculoskeletal Disorders at the University of Pennsylvania Perelman School of Medicine (NIH P30 AR050950). The authors acknowledge Joseph E. Perosky for his role in data acquisition at the University of Michigan. The authors would like to thank Drs. Warren Pear and Ivan Maillard for helpful discussions and sharing the dnMAML mice.
Footnotes
Supplementary data to this article can be found online at http://dx.doi.org/10.1016/j.bone.2016.07.006.
Disclosures
Dr. Hankenson is the co-founder of Skelegen LLC.
Authors' roles
Study design: CBB, HS, KDH, KML. Study conduct: MID, CBB, HS, EC, PLM. Data collection: DWY, MID, CBB, EC, KK, HS, PLM. Data analysis: DWY, MID, CBB, EC, HS, PLM. Data interpretation: DWY, MID, CBB, EC, KK, KDH, KML, HS. Drafting manuscript: DWY, MID, CBB, EC, KK, KDH, KML. Approving final version of manuscript. DWY, MID, CBB, EC, HS, PLM, KK, KDH, KML. KDH and KML take responsibility for the integrity of the data analysis.
References
- 1.Artavanis-Tsakonas S, Rand MD, Lake RJ. Notch signaling: cell fate control and signal integration in development. Science. 1999;284:770–776. doi: 10.1126/science.284.5415.770. [DOI] [PubMed] [Google Scholar]
- 2.Zanotti S, Canalis E. Notch and the skeleton. Mol. Cell. Biol. 2010;30:886–896. doi: 10.1128/MCB.01285-09. [DOI] [PMC free article] [PubMed] [Google Scholar]
- 3.Engin F, Lee B. NOTCHing the bone: insights into multi-functionality. Bone. 2010;46:274–280. doi: 10.1016/j.bone.2009.05.027. [DOI] [PMC free article] [PubMed] [Google Scholar]
- 4.Oda T, Elkahloun AG, Pike BL, Okajima K, Krantz ID, Genin A, Piccoli DA, Meltzer PS, Spinner NB, Collins FS, Chandrasekharappa SC. Mutations in the human Jagged1 gene are responsible for Alagille syndrome. Nat. Genet. 1997;16:235–242. doi: 10.1038/ng0797-235. [DOI] [PubMed] [Google Scholar]
- 5.Li L, Krantz ID, Deng Y, Genin A, Banta AB, Collins CC, Qi M, Trask BJ, Kuo WL, Cochran J, Costa T, Pierpont ME, Rand EB, Piccoli DA, Hood L, Spinner NB. Alagille syndrome is caused by mutations in human Jagged1, which encodes a ligand for Notch1. Nat. Genet. 1997;16:243–251. doi: 10.1038/ng0797-243. [DOI] [PubMed] [Google Scholar]
- 6.Krantz ID, Piccoli DA, Spinner NB. Clinical and molecular genetics of Alagille syndrome. Curr. Opin. Pediatr. 1999;11:558–564. doi: 10.1097/00008480-199912000-00015. [DOI] [PubMed] [Google Scholar]
- 7.Olsen IE, Ittenbach RF, Rovner AJ, Leonard MB, Mulberg AE, Stallings VA, Piccoli DA, Zemel BS. Deficits in size-adjusted bone mass in children with Alagille syndrome. J. Pediatr. Gastroenterol. Nutr. 2005;40:76–82. doi: 10.1097/00005176-200501000-00014. [DOI] [PubMed] [Google Scholar]
- 8.Bales CB, Kamath BM, Munoz PS, Nguyen A, Piccoli DA, Spinner NB, Horn D, Shults J, Leonard MB, Grimberg A, Loomes KM. Pathologic lower extremity fractures in children with Alagille syndrome. J. Pediatr. Gastroenterol. Nutr. 2010;51:66–70. doi: 10.1097/MPG.0b013e3181cb9629. [DOI] [PMC free article] [PubMed] [Google Scholar]
- 9.Loomes KM, Russo P, Ryan M, Nelson A, Underkoffler L, Glover C, Fu H, Gridley T, Kaestner KH, Oakey RJ. Bile duct proliferation in liver-specific Jag1 conditional knockout mice: effects of gene dosage. Hepatology. 2007;45:323–330. doi: 10.1002/hep.21460. [DOI] [PubMed] [Google Scholar]
- 10.Lu J, Zhou Y, Hu T, Zhang H, Shen M, Cheng P, Dai W, Wang F, Chen K, Zhang Y, Wang C, Li J, Zheng Y, Yang J, Zhu R, Wang J, Lu W, Zhang H, Wang J, Xia Y, De Assuncao TM, Jalan-Sakrikar N, Huebert RC, Bin Z, Guo C. Notch signaling coordinates progenitor cell-mediated biliary regeneration following partial hepatectomy. Sci. Rep. 2016;6:22754. doi: 10.1038/srep22754. [DOI] [PMC free article] [PubMed] [Google Scholar]
- 11.Hofmann JJ, Zovein AC, Koh H, Radtke F, Weinmaster G, Iruela-Arispe ML. Jagged1 in the portal vein mesenchyme regulates intrahepatic bile duct development: insights into Alagille syndrome. Development. 2010;137:4061–4072. doi: 10.1242/dev.052118. [DOI] [PMC free article] [PubMed] [Google Scholar]
- 12.Kung AW, Xiao SM, Cherny S, Li GH, Gao Y, Tso G, Lau KS, Luk KD, Liu JM, Cui B, Zhang MJ, Zhang ZL, He JW, Yue H, Xia WB, Luo LM, He SL, Kiel DP, Karasik D, Hsu YH, Cupples LA, Demissie S, Styrkarsdottir U, Halldorsson BV, Sigurdsson G, Thorsteinsdottir U, Stefansson K, Richards JB, Zhai G, Soranzo N, Valdes A, Spector TD, Sham PC. Association of JAG1 with bone mineral density and osteoporotic fractures: a genome-wide association study and follow-up replication studies. Am. J. Hum. Genet. 2010;86:229–239. doi: 10.1016/j.ajhg.2009.12.014. [DOI] [PMC free article] [PubMed] [Google Scholar]
- 13.Long F. Building strong bones: molecular regulation of the osteoblast lineage. Nat. Rev. Mol. Cell Biol. 2012;13:27–38. doi: 10.1038/nrm3254. [DOI] [PubMed] [Google Scholar]
- 14.Canalis E, Parker K, Feng JQ, Zanotti S. Osteoblast lineage-specific effects of notch activation in the skeleton. Endocrinology. 2013;154:623–634. doi: 10.1210/en.2012-1732. [DOI] [PMC free article] [PubMed] [Google Scholar]
- 15.Hilton MJ, Tu X, Wu X, Bai S, Zhao H, Kobayashi T, Kronenberg HM, Teitelbaum SL, Ross FP, Kopan R, Long F. Notch signaling maintains bone marrow mesenchymal progenitors by suppressing osteoblast differentiation. Nat. Med. 2008;14:306–314. doi: 10.1038/nm1716. [DOI] [PMC free article] [PubMed] [Google Scholar]
- 16.Engin F, Yao Z, Yang T, Zhou G, Bertin T, Jiang MM, Chen Y, Wang L, Zheng H, Sutton RE, Boyce BF, Lee B. Dimorphic effects of notch signaling in bone homeostasis. Nat. Med. 2008;14:299–305. doi: 10.1038/nm1712. [DOI] [PMC free article] [PubMed] [Google Scholar]
- 17.Zanotti S, Smerdel-Ramoya A, Stadmeyer L, Durant D, Radtke F, Canalis E. Notch inhibits osteoblast differentiation and causes osteopenia. Endocrinology. 2008;149:3890–3899. doi: 10.1210/en.2008-0140. [DOI] [PMC free article] [PubMed] [Google Scholar]
- 18.Ashley JW, Ahn J, Hankenson KD. Notch signaling promotes osteoclast maturation and resorptive activity. J. Cell. Biochem. 2015 doi: 10.1002/jcb.25205. [DOI] [PMC free article] [PubMed] [Google Scholar]
- 19.Jin WJ, Kim B, Kim JW, Kim HH, Ha H, Lee ZH. Notch2 signaling promotes osteoclast resorption via activation of PYK2. Cell. Signal. 2016;28:357–365. doi: 10.1016/j.cellsig.2016.01.016. [DOI] [PubMed] [Google Scholar]
- 20.Canalis E, Adams DJ, Boskey A, Parker K, Kranz L, Zanotti S. Notch signaling in osteocytes differentially regulates cancellous and cortical bone remodeling. J. Biol. Chem. 2013;288:25614–25625. doi: 10.1074/jbc.M113.470492. [DOI] [PMC free article] [PubMed] [Google Scholar]
- 21.Salie R, Kneissel M, Vukevic M, Zamurovic N, Kramer I, Evans G, Gerwin N, Mueller M, Kinzel B, Susa M. Ubiquitous overexpression of Hey1 transcription factor leads to osteopenia and chondrocyte hypertrophy in bone. Bone. 2010;46:680–694. doi: 10.1016/j.bone.2009.10.022. [DOI] [PubMed] [Google Scholar]
- 22.Dong Y, Jesse AM, Kohn A, Gunnell LM, Honjo T, Zuscik MJ, O'Keefe RJ, Hilton MJ. RBPjkappa-dependent notch signaling regulates mesenchymal progenitor cell proliferation and differentiation during skeletal development. Development. 2010;137:1461–1471. doi: 10.1242/dev.042911. [DOI] [PMC free article] [PubMed] [Google Scholar]
- 23.Dishowitz MI, Terkhorn SP, Bostic SA, Hankenson KD. Notch signaling components are upregulated during both endochondral and intramembranous bone regeneration. J. Orthop. Res. 2012;30:296–303. doi: 10.1002/jor.21518. [DOI] [PMC free article] [PubMed] [Google Scholar]
- 24.Mutyaba PL, Belkin NS, Lopas L, Gray CF, Dopkin D, Hankenson KD, Ahn J. Notch signaling inmesenchymal stem cells harvested from geriatric mice. J. Orthop. Trauma. 2014;28(Suppl. 1):S20–S23. doi: 10.1097/BOT.0000000000000064. [DOI] [PubMed] [Google Scholar]
- 25.Oldershaw RA, Tew SR, Russell AM, Meade K, Hawkins R, McKay TR, Brennan KR, Hardingham TE. Notch signaling through Jagged-1 is necessary to initiate chondrogenesis in human bone marrow stromal cells but must be switched off to complete chondrogenesis. Stem Cells. 2008;26:666–674. doi: 10.1634/stemcells.2007-0806. [DOI] [PubMed] [Google Scholar]
- 26.Calvi LM, Adams GB, Weibrecht KW, Weber JM, Olson DP, Knight MC, Martin RP, Schipani E, Divieti P, Bringhurst FR, Milner LA, Kronenberg HM, Scadden DT. Osteoblastic cells regulate the haematopoietic stem cell niche. Nature. 2003;425:841–846. doi: 10.1038/nature02040. [DOI] [PubMed] [Google Scholar]
- 27.Weber JM, Forsythe SR, Christianson CA, Frisch BJ, Gigliotti BJ, Jordan CT, Milner LA, Guzman ML, Calvi LM. Parathyroid hormone stimulates expression of the notch ligand Jagged1 in osteoblastic cells. Bone. 2006;39:485–493. doi: 10.1016/j.bone.2006.03.002. [DOI] [PubMed] [Google Scholar]
- 28.Bai S, Kopan R, Zou W, Hilton MJ, Ong CT, Long F, Ross FP, Teitelbaum SL. NOTCH1 regulates osteoclastogenesis directly in osteoclast precursors and indirectly via osteoblast lineage cells. J. Biol. Chem. 2008;283:6509–6518. doi: 10.1074/jbc.M707000200. [DOI] [PubMed] [Google Scholar]
- 29.Humphreys R, Zheng W, Prince LS, Qu X, Brown C, Loomes K, Huppert SS, Baldwin S, Goudy S. Cranial neural crest ablation of Jagged1 recapitulates the craniofacial phenotype of Alagille syndrome patients. Hum. Mol. Genet. 2012;21:1374–1383. doi: 10.1093/hmg/ddr575. [DOI] [PMC free article] [PubMed] [Google Scholar]
- 30.Hill CR, Yuasa M, Schoenecker J, Goudy SL. Jagged1 is essential for osteoblast development during maxillary ossification. Bone. 2014;62:10–21. doi: 10.1016/j.bone.2014.01.019. [DOI] [PMC free article] [PubMed] [Google Scholar]
- 31.Wang C, Inzana JA, Mirando AJ, Ren Y, Liu Z, Shen J, O'Keefe RJ, Awad HA, Hilton MJ. NOTCH signaling in skeletal progenitors is critical for fracture repair. J. Clin. Invest. 2016;126 doi: 10.1172/JCI80672. [DOI] [PMC free article] [PubMed] [Google Scholar]
- 32.Logan M, Martin JF, Nagy A, Lobe C, Olson EN, Tabin CJ. Expression of Cre recombinase in the developing mouse limb bud driven by a Prxl enhancer. Genesis. 2002;33:77–80. doi: 10.1002/gene.10092. [DOI] [PubMed] [Google Scholar]
- 33.Kalajzic I, Kalajzic Z, Kaliterna M, Gronowicz G, Clark SH, Lichtler AC, Rowe D. Use of type I collagen green fluorescent protein transgenes to identify subpopulations of cells at different stages of the osteoblast lineage. J. Bone Miner. Res. 2002;17:15–25. doi: 10.1359/jbmr.2002.17.1.15. [DOI] [PubMed] [Google Scholar]
- 34.Liu F, Woitge HW, Braut A, Kronenberg MS, Lichtler AC, Mina M, Kream BE. Expression and activity of osteoblast-targeted Cre recombinase transgenes in murine skeletal tissues. Int. J. Dev. Biol. 2004;48:645–653. doi: 10.1387/ijdb.041816fl. [DOI] [PubMed] [Google Scholar]
- 35.Maillard I, Weng AP, Carpenter AC, Rodriguez CG, Sai H, Xu L, Allman D, Aster JC, Pear WS. Mastermind critically regulates notch-mediated lymphoid cell fate decisions. Blood. 2004;104:1696–1702. doi: 10.1182/blood-2004-02-0514. [DOI] [PubMed] [Google Scholar]
- 36.Weng AP, Nam Y, Wolfe MS, Pear WS, Griffin JD, Blacklow SC, Aster JC. Growth suppression of pre-T acute lymphoblastic leukemia cells by inhibition of notch signaling. Mol. Cell. Biol. 2003;23:655–664. doi: 10.1128/MCB.23.2.655-664.2003. [DOI] [PMC free article] [PubMed] [Google Scholar]
- 37.Dishowitz MI, Mutyaba PL, Takacs JD, Barr AM, Engiles JB, Ahn J, Hankenson KD. Systemic inhibition of canonical notch signaling results in sustained callus inflammation and alters multiple phases of fracture healing. PLoS One. 2013;8:e68726. doi: 10.1371/journal.pone.0068726. [DOI] [PMC free article] [PubMed] [Google Scholar]
- 38.Wallin J, Wilting J, Koseki H, Fritsch R, Christ B, Balling R. The role of Pax-1 in axial skeleton development. Development. 1994;120:1109–1121. doi: 10.1242/dev.120.5.1109. [DOI] [PubMed] [Google Scholar]
- 39.Hankenson KD, Bain SD, Kyriakides TR, Smith EA, Goldstein SA, Bornstein P. Increased marrow-derived osteoprogenitor cells and endosteal bone formation in mice lacking thrombospondin 2. J. Bone Miner. Res. 2000;15:851–862. doi: 10.1359/jbmr.2000.15.5.851. [DOI] [PubMed] [Google Scholar]
- 40.Zhu F, Sweetwyne MT, Hankenson KD. PKCδ is required for jagged-1 induction of human mesenchymal stem cell osteogenic differentiation. Stem Cells. 2013;31:1181–1192. doi: 10.1002/stem.1353. [DOI] [PubMed] [Google Scholar]
- 41.Rida PC, Le Minh N, Jiang YJ. A notch feeling of somite segmentation and beyond. Dev. Biol. 2004;265:2–22. doi: 10.1016/j.ydbio.2003.07.003. [DOI] [PubMed] [Google Scholar]
- 42.Scheller EL, Leinninger GM, Hankenson KD, Myers MG, Jr, Krebsbach PH. Ectopic expression of Col2.3 and Col3.6 promoters in the brain and association with leptin signaling. Cells Tissues Organs. 2011;194:268–273. doi: 10.1159/000324745. [DOI] [PMC free article] [PubMed] [Google Scholar]
- 43.D'Souza B, Miyamoto A, Weinmaster G. The many facets of notch ligands. Oncogene. 2008;27:5148–5167. doi: 10.1038/onc.2008.229. [DOI] [PMC free article] [PubMed] [Google Scholar]
- 44.Bray SJ. Notch signalling: a simple pathway becomes complex. Nat. Rev. Mol. Cell Biol. 2006;7:678–689. doi: 10.1038/nrm2009. [DOI] [PubMed] [Google Scholar]
- 45.Kohn A, Dong Y, Mirando AJ, Jesse AM, Honjo T, Zuscik MJ, O'Keefe RJ, Hilton MJ. Cartilage-specific RBPjkappa-dependent and -independent notch signals regulate cartilage and bone development. Development. 2012;139:1198–1212. doi: 10.1242/dev.070649. [DOI] [PMC free article] [PubMed] [Google Scholar]
- 46.Ramasamy SK, Kusumbe AP, Wang L, Adams RH. Endothelial notch activity promotes angiogenesis and osteogenesis in bone. Nature. 2014;507:376–380. doi: 10.1038/nature13146. [DOI] [PMC free article] [PubMed] [Google Scholar]
- 47.Ronchini C, Capobianco AJ. Induction of cyclin D1 transcription and CDK2 activity by Notchic: Implication for cell cycle disruption in transformation by Notchic. Mol. Cell. Biol. 2001;21:5925–5934. doi: 10.1128/MCB.21.17.5925-5934.2001. [DOI] [PMC free article] [PubMed] [Google Scholar]
- 48.Pauklin S, Vallier L. The cell-cycle state of stem cells determines cell fate propensity. Cell. 2013;155:135–147. doi: 10.1016/j.cell.2013.08.031. [DOI] [PMC free article] [PubMed] [Google Scholar]
- 50.Melville KM, Kelly NH, Khan SA, Schimenti JC, Ross FP, Main RP, van der Meulen MCH. Female mice lacking estrogen receptor-alpha in osteoblasts have compromised bone mass and strength. J. Bone Miner. Res. 2014;29:370–379. doi: 10.1002/jbmr.2082. [DOI] [PubMed] [Google Scholar]
- 51.Vandewalle S, Taes Y, Fiers T, Toye K, Van Caenegem E, Roggen I, De Schepper J, Kaufman JM. Associations of sex steroids with bone maturation, bone mineral density, bone geometry, and body composition: a cross-sectional study in healthy male adolescents. J. Clin. Endocrinol. Metab. 2014;99:E1272–82. doi: 10.1210/jc.2013-3887. [DOI] [PubMed] [Google Scholar]
Associated Data
This section collects any data citations, data availability statements, or supplementary materials included in this article.


