


Abstract
In the microarray format of the minisequencing method multiple oligonucleotide primers immobilised on a glass surface are extended with fluorescent ddNTPs using a DNA polymerase. The method is a promising tool for large-scale single nucleotide polymorphism (SNP) detection. We have compared eight chemical methods for covalent immobilisation of the oligonucleotide primers on glass surfaces. We included both commercially available, activated slides and slides that were modified by ourselves. In the comparison the differently derivatised glass slides were evaluated with respect to background fluorescence, efficiency of attaching oligonucleotides and performance of the primer arrays in minisequencing reactions. We found that there are significant differences in background fluorescence levels among the different coatings, and that the attachment efficiency, which was measured indirectly using extension by terminal transferase, varied largely depending on which immobilisation strategy was used. We also found that the attachment chemistry affects the genotyping accuracy, when minisequencing on microarrays is used as the genotyping method. The best genotyping results were observed using mercaptosilane-coated slides attaching disulfide-modified oligonucleotides.
INTRODUCTION
Single nucleotide polymorphisms (SNPs), which represent the most abundant form of genomic sequence variation, occur at about one out of a thousand nucleotides in the human genome (1,2). Methods with high throughput are required to analyse the genomic sequence variation between individuals in more detail and on a large scale. Miniaturised assays in a microarray (DNA chip) format offer the potential for genotyping of large numbers of SNPs at low cost (3). For DNA polymerase-assisted ‘minisequencing’ in the microarray format, detection primers annealing immediately 5′ of each variable SNP in the sample DNA are immobilised through their 5′-end, followed by primer extension with single labelled nucleotide analogues that are complementary to the variable nucleotides using a DNA polymerase (4,5). Primer extension is currently gaining acceptance as the reaction principle of choice for genotyping SNPs in microarray assay (6–12).
Microarrays of oligonucleotides can be produced at very high density by combinatorial light-directed in situ synthesis on solid surfaces (13; Affymetrix GeneChips®). These arrays, originally intended for comparative DNA sequencing using hybridisation to allele-specific oligonucleotide probes, cannot be directly applied in DNA polymerase-assisted reactions, since the oligonucleotide synthesis proceeds in the 3′–5′ direction, and the 3′-ends of the oligonucleotides are not free to be extended. A recent microarray-based method utilises 3′–5′ in situ synthesised complementary ‘tag’ oligonucleotides as capturing probes for minisequencing primer extension products formed in solution with primers carrying 5′-‘tag’ sequences (6). Oligonucleotides can also be synthesised in situ in the 5′–3′ direction, but this approach seems to give a lower yield than the 3′–5′ synthesis (14). Using a refined chemical strategy, in situ synthesised 3′–5′ oligonucleotides can be inverted on a solid support to give the opposite polarity with a free 3′-end for DNA polymerase-mediated primer extension (15).
The most generally accessible approach for producing oligonucleotide microarrays is to synthesise the individual oligonucleotides separately prior to immobilisation on the solid surface. In this case the oligonucleotide is modified with a functional group that allows covalent attachment to a reactive group on the surface. Oligonucleotides modified with an NH2-group can be immobilised onto epoxy silane-derivatised (16) or isothiocyanate-coated glass slides (17). Succinylated oligonucleotides can be coupled to aminophenyl- or aminopropyl-derivatised glass slides by peptide bonds (18), and disulfide-modified oligonucleotides can be immobilised onto a mercaptosilanised glass support by a thiol/disulfide exchange reaction (19). Alternatively, unactivated microscope slides may be used with activated, silanised oligonucleotides (20). Many of the attachment strategies are based on heterobifunctional crosslinking molecules, giving many alternatives to the linking molecule and to the modification of the oligonucleotide (17,21,22). Recently, chemically pre-activated microscope slides have become commercially available, increasing the number of options for attaching oligonucleotides in practice. With a few exceptions (21,23), the available attachment strategies have not been systematically compared for their performance in assays on microarrays.
To improve the fluorescent signal intensities, and hence the genotyping power and throughput of our minisequencing assays, we tested different immobilisation procedures for the oligonucleotide primers. We compared six types of differently activated glass slides (Table 1) with respect to the background fluorescence, the efficiency of the attachment reaction measured indirectly using terminal transferase-mediated extension reaction, and most importantly, the signal to noise ratios after performing minisequencing reactions with fluorescence labelling on the microarrays. We found that the efficiency of attaching the oligonucleotides to the glass slides depends largely on which chemistry is used.
Table 1. Efficiences of the reaction between the functional 5′ groups on the oligonucleotide primers and the reactive groups on the microscope slides.
| Slide type |
5′-modification
on primer |
Functional group on slide |
Relative signal intensitya |
| Isothiocyanate | NH2-(CH2)6-O-(PO)2-oligonucleotide | -N=C=S | 1.0 |
| ‘SuperAldehyde’ | NH2-(CH2)6-O-(PO)2-oligonucleotide | -CHO | 0.090b, 0.20c |
| 3D-Link™ | NH2-(CH2)6-O-(PO)2-oligonucleotide | long-chain hydrophilic polymer containing amine-reactive groups | 7.7 |
| Mercaptosilane | HO-(CH2)6-S-S-(CH2)6-O-(PO)2-oligonucleotideH2C=CH-CO-NH-R-oligonucleotided | -SH | 1.9 |
| EZ-RAYS™ | HO-(CH2)6-S-S-(CH2)6-O-(PO)2-oligonucleotideH2C=CH-CO-NH-R-oligonucleotided | three-dimensional with -SH groups | 0.19 |
| Unmodified | (OCH3)3-Si-R-oligonucleotidee | none | 0.80 |
aRelative signal intensities after terminal deoxynucleotidyl transferase-mediated extension of immobilised oligonucleotides were calculated from the average value for the 16 or 24 oligonucleotide spots on each slide. The signal intensities on each slide were compared pairwise to the signal intensities on the isothiocyanate-coated slides, which were given the value 1 in each comparison reaction, and the signal intensities on the other slides are normalised with respect to this value.
bSignal intensity for ‘SuperAldehyde 1’, see Materials and Methods.
cSignal intensity for ‘SuperAldehyde 2’, see Materials and Methods.
dThe data were not available for the linker molecule.
e
MATERIALS AND METHODS
Samples and SNPs
DNA was extracted from blood samples of two volunteers by standard procedures. Six oligonucleotide primers defining the coding (co) and the non-coding (nc) DNA strands of three SNPs were used to analyse the DNA samples. Two of the SNPs were from the human angiotensin II type 1 receptor (AGTR1) gene (DDBJ/EMBL/GenBank accession no. AF245699; 24) and they are denoted AGTR1 1166co, AGTR1 1166nc, AGTR1 1062co and AGTR1 1062nc. The third SNP was from the human endothelial nitric oxide synthase (eNOS) gene (DDBJ/EMBL/GenBank accession no. X76307; 25) and is denoted eNOSco and eNOSnc. The samples were genotyped by solid-phase minisequencing in a microtitre plate format (26). The genotype of sample 1 was AGTR1 1166 CC, AGTR1 1062 AA, eNOS GG and that of sample 2 was AGTR1 1166 AA, AGTR1 1062 AG, eNOS GT. The alleles are denoted according to the variable nucleotide on the coding strand of the DNA.
Preparation of microarrays
The isothiocyanate surface activation was performed on standard microscope glass slides (Menzel-Gläser, Braunschweig, Germany). NH2-modified oligonucleotides (Tables 1 and 2) (Interactiva Biotechnologie GmbH, Ulm, Germany) were attached as described by Guo (17), except that 3-aminopropyltriethoxysilane (Sigma) was used for silanisation instead of the methoxy-derivative. The oligonucleotides were dissolved in 400 mM sodium carbonate buffer (pH 9.0) to a final concentration of 25 µM prior to spotting. Immediately after spotting, the slides were exposed to vaporised ammonia for 1 h, followed by three washes in distilled water. The arrays were stored at 10°C until use.
Table 2. PCR and minisequencing primers.
| Locus |
Primera |
Sequence, 5′ to
3′ |
Nucleotide variation |
| AGTR 1 1166 | 5′ PCR primer | GCG GTC CCA AAA GGG TCA GTC CCC AAA AGC CAA ATC CCA C | |
| 3′ PCR primer | TTC TAA TAC GAC TCA CTA TAG AGA AAA GTC GGT TCA GTC CAC | ||
| ms primer cob | CAC TTC ACT ACC AAA TGA GC | A/C | |
| ms primer ncc | CAA TTC TGA AAA GTA GCT AA | T/G | |
| ms primer nc* | CCTT CAA TTC TGA AAA GTA GCT AA | ||
| AGTR 1 1062 | 5′ PCR primer | GCG GTC CCA AAA GGG TCA GTC CCC AAA AGC CAA ATC CCA C | |
| 3′ PCR primer | TTC TAA TAC GAC TCA CTA TAG AGA AAA GTC GGT TCA GTC CAC | ||
| ms primer co | TCC ACC AAG AAG CCT GCA CC | A/G | |
| ms primer nc | TGT CAC TCA ACC TCA AAA CA | T/C | |
| eNOS | 5′ PCR primer | GCG GTC CCA AAA GGG TCA GTC ATT CAG CAC GGC TGG ACC | |
| 3′ PCR primer | TTC TAA TAC GAC TCA CTA TAG TGC TCC AGG GGC ACC TCA A | T/G | |
| ms primer co | CTG CTG CAG GCC CCA GAT GA | A/C | |
| ms primer nc | AGA AGG AAG AGT TCT GGG GG |
aThe minisequencing primers contained a spacer-sequence of 15 T-residues in their 5′-ends.
bco = detects coding strand of the DNA.
cnc = detects non-coding strand of the DNA.
NH2-modified oligonucleotides were attached to the aldehyde-modified ‘SuperAldehyde’-slides (Tables 1 and 2) (TeleChem International Inc., Sunnyvale, CA; lot numbers 000529 and 000831) according to the protocol given by the manufacturer. The oligonucleotide concentration was 25 µM in 0.5× ArrayIt Micro spotting solution (TeleChem International Inc., Sunnyvale, CA). To remove the unbound oligonucleotides after spotting and deactivate the excessive aldehyde groups, the slides were processed as described in the protocol: washed twice in 0.2% sodium dodecyl sulfate (SDS) for 5 min each, twice in dH2O for 5 min each and once in a solution containing 0.25 g Na2BH4 dissolved in 75 ml phosphate-buffered saline (PBS) and 25 ml EtOH for 5 min. Additionally the slides were washed three times in 0.2% SDS for 1 min each and twice in dH2O for 1 min each. These slides were denoted ‘SuperAldehyde 1’. We devised a modification of this protocol in which the slides were incubated in 0.1 M Tris–HCl pH 8.0 with 0.05 M NaCNBH3 and 0.01 M NaOH for 15 min. The slides were then washed three times in 0.2% SDS for 1 min each and once with dH2O. These slides were denoted ‘SuperAldehyde 2’. Both ‘SuperAldehyde’ slides were dried and stored at 20°C.
NH2-modified oligonucleotides were attached to the 3D-Link™-slides (Tables 1 and 2) (SurModics, Inc., Eden Prairie, MN) according to the protocol given by the manufacturer. The oligonucleotides were dissolved in 150 mM sodium phosphate buffer pH 8.5 at a 25 µM concentration. After printing the arrays were stored for 4–72 h in a chamber with 75% relative humidity (SurModics, Inc., Eden Prairie, MN). The excess amine-reactive groups were deactivated for 15 min at 50°C in a solution containing 50 mM ethanolamine, 0.1 M Tris–HCl pH 9.0 and 0.1% SDS. The slides were washed with dH2O, in a solution containing 4× SSC and 0.1% SDS at 50°C for 15–60 min and finally with dH2O. The slides were stored desiccated at 20°C until use.
The oligonucleotides attached to the mercaptosilane-derivatised slides (Orchid Bioscience, Inc., Princeton, NJ) were modified with 5′ disulfide groups (see Tables 1 and 2) (Operon Technologies, Inc., Alameda, CA) and diluted to a concentration of 25 µM in 0.5 M sodium carbonate buffer (pH 9.0) and 0.02% SDS. After spotting, the slides were kept in a chamber with 75% relative humidity for 5 min to overnight. The slides were then washed three times with a solution containing 10 mM Tris–HCl pH 7.5, 150 mM NaCl and 0.05% Tween-20. After washing with dH2O the slides were left to dry and stored at 20°C until use. For attaching acrylamide-modified oligonucleotides (Tables 1 and 2) (Sigma-Genosys Ltd, Cambridge, UK) to the mercaptosilane-surfaced slides the oligonucleotides were dissolved as for attachment to the EZ-RAYS™-slides (Mosaic Technologies, Waltham, MA), see below. The post-spotting procedures were the same as those described for the disulfide-modified oligonucleotides.
Acrylamide-modified oligonucleotides were attached to the EZ-RAYS™-slides (Tables 1 and 2) according to the December 01, 2000 version of the protocol given by the manufacturer. The oligonucleotides were dissolved in 100 mM sodium carbonate buffer (pH 10.0) containing 0.0008% N-lauroyl-sarcosine to a final concentration of 25 µM. The latent thiol groups on the slides were activated before spotting the oligonucleotides for 15–30 min in a solution containing 0.64 g of tris(carboxyethyl)phosphine hydrochloride in 45 ml of dH2O. The slides were briefly washed with dH2O and dried at 20°C, the oligonucleotides were spotted and the arrays were left at 20°C for at least 60 min after arraying. The post-array processing included soaking the arrays for 30 min in 40 ml quench buffer containing sodium acrylate (Mosaic Technologies, Waltham, MA) and washing the arrays twice for 5 min each in 10 mM Tris–HCl pH 8.0 with 1 mM Na2EDTA. Finally the arrays were rinsed briefly with dH2O. The slides were stored at 20°C until use. Disulfide-modified oligonucleotides were also attached to the EZ-RAYS™-slides. These oligonucleotides were diluted to a concentration of 25 µM, in a 0.5 M sodium carbonate buffer (pH 9.0) and 0.02% SDS. The post-spotting procedures were the same as those described for attaching the acrylamide-modified oligonucleotides to the EZ-RAYS™-slides.
Silanised oligonucleotides (Interactiva Biotechnologie GmbH, Ulm, Germany) were immobilised to the unmodified glass surface (Menzel-Gläser, Braunschweig, Germany) (Tables 1 and 2) as described by Kumar et al. (20) with a few modifications. The slides were not washed before spotting since that caused the spots to spread and mix with each other. Finally the slides were air-dried and stored at 20°C until use. The concentration of the oligonucleotides was 15 µM and they were dissolved in DMSO/H2O 2:1 (eNOS co) and 1:1 (eNOS nc).
Printing the oligonucleotides
A custom-built, modified industrial robot (Isel, Eiterfeld, Germany) with two TeleChem CMP2 (Sunnyvale, CA) printing pins controlled by an MCM-310 operating system and NUMO-6.0 software (Merval, Pietarsaari, Finland) was used to print the oligonucleotide detection primers onto the coated slides. The oligonucleotide spots were 125–150 µm in diameter and the centre to centre distance between two adjacent spots was 250 µm. The isothiocyanate-, aldehyde-, 3D-Link™- and mercaptosilane-arrays consisted of six oligonucleotide primers (AGTR1 1166co, nc, AGTR1 1062co, nc, eNOSco and nc), each of which was spotted as quadruplicates per well (Fig. 1). The EZ-RAYS™- and unmodified slides were prepared by spotting two oligonucleotides (eNOS co, eNOS nc) at eight positions per well, as were the acrylamide-modified oligonucleotides onto the mercaptosilane-surfaced slides.
Figure 1.
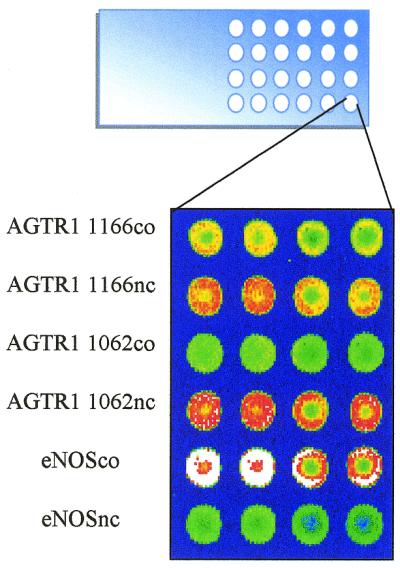
The microarray format with 24 subarrays of 4 mm in diameter on a microscope slide. The subarray in the figure with each oligonucleotide primer as quadruplicate was printed on a 3D-Link™-slide and scanned after terminal deoxynucleotidyl transferase extension of the primers using tetramethylrhodamine-labelled dATP.
Terminal deoxynucleotidyl transferase reactions
The arrays were pre-heated to 37°C in a custom-made aluminium reaction rack. A re-usable silicon rubber grid was applied on the arrays to form 80 separate reaction wells on each slide (10). Ten microlitres of a reaction mixture containing 0.5 µM tetramethylrhodamine (TAMRA)-labelled dATP (NEN™ Life Science Products, Brussels, Belgium), 0.3 µM unlabelled dATP, 0.5 U/µl terminal deoxynucleotidyl transferase (MBI Fermentas GMBH, St Leon-Rot, Germany) and 1 mM CoCl2 in 0.2 M potassium cacodylate pH 7.2, 0.1 mM DTT and 0.01% Triton X-100 was added to each reaction well. The extension reaction was allowed to proceed for 30 min at 37°C after which the slides were washed with dH2O, in a solution of 90 mM sodium citrate, 900 mM NaCl, 0.05% N-lauroyl-sarcosine and finally with dH2O.
PCR amplification of SNPs
The PCR primers were designed based on the sequences of the AGTR1 and eNOS genes and synthesised by Interactiva Biotechnologie GmbH (Ulm, Germany). Their sequences are listed in Table 2. DNA fragments spanning the SNP sites were amplified in a Programmable Thermal Controller (MJ Tetrad Research, Watertown, MA) using 20 ng of genomic DNA with 3.5 U AmpliTaq Gold DNA polymerase (Perkin-Elmer, Branchburg, NJ) and 200 µM dNTPs in 100 µl of DNA polymerase buffer supplied with the enzyme (N808-0244). The SNP markers AGTR1 1062 and 1166 were amplified within one PCR fragment with the PCR primers at 0.2 µM concentration and the SNP marker eNOS was amplified with primers at 0.5 µM concentration. The PCR parameters were: initial activation of the polymerase at 95°C for 10 min, then 35 cycles of 95°C for 1 min, 56°C for 1 min, 72°C for 1 min, followed by a final extension at 72°C for 7 min.
Minisequencing on oligonucleotide arrays
The PCR products from each sample were combined and precipitated by ethanol, followed by suspension into 40 µl of dH2O. The arrays were pre-heated to 37°C in the reaction rack and the PCR products were denatured for 1.5 min at 95°C and placed on ice. Ten microlitres of a buffer containing 50 mM Tris–HCl pH 8.0, 5 mM EDTA, 1 M NaCl was added. Ten microlitres of this mixture was applied to four reaction wells of 3 mm in diameter on the pre-heated arrays. The annealing reaction was allowed to proceed in a humid chamber at 37°C for 15 min. The arrays were washed briefly with a solution of 5 mM Tris–HCl pH 8.0, 0.5 mM EDTA, 100 mM NaCl, 0.1% Triton X-100.
Each minisequencing reaction mixture contained one of the four TAMRA-labelled ddATP, ddCTP, ddGTP, ddTTP analogues at a 0.75 µM concentration (NEN™ Life Science Products, Brussels, Belgium) together with the other three unlabelled ddNTPs at a concentration of 0.5 µM in 26 mM Tris–HCl pH 9.5, 6.5 mM MgCl2, 0.2% Triton X-100 buffer with 0.075 U/µl DynaSeq DNA polymerase (gift from Finnzymes OY, Helsinki, Finland) or ThermoSequenase (AP Biotech, Uppsala, Sweden). The arrays carrying the annealed templates were pre-heated to 68°C, and 20 µl of reaction mixture was added to four separate reaction wells. The reaction was allowed to proceed at 68°C for 5 min in a humid chamber, after which the slides were washed with dH2O, washed once with 50 mM NaOH for 2 min and washed with dH2O. The slides were further washed twice for 5 min at 65°C in a solution containing 3 mM sodium citrate, 30 mM NaCl and 0.1% SDS (pH 7.0) and finally with dH2O.
Signal detection and data analysis
Fluorescence signals were measured using an array scanner (ScanArray® 5000, GSI Lumonics, Watertown, MA) and the signal intensities were determined with the QuantArray® analysis software (GSI Lumonics). The excitation laser was Green HeNe, 543.5 nm. The laser power and photomultiplier tube (pmt) gain were adjusted according to the signal intensity. The isothiocyanate-coated slides served as reference slides to which the other slides were compared. The signal from each spot was corrected for the average background in each well, measured from six spots immediately below the array, by subtraction, giving the signal intensity value. The genotypes were determined by calculating the ratio between the signal intensities from the reaction for one of the alleles divided by the signal from the other allele.
RESULTS AND DISCUSSION
To improve the genotyping specificity of our microarray-based fluorescent minisequencing system, we evaluated six chemistries for covalent coupling of the oligonucleotide primers to glass microscope slides. The evaluation included isothiocyanate-coated slides (17), aldehyde-coated slides and 3D-link™-slides with a three-dimensional hydrophilic surface, all attaching amino-modified oligonucleotides, mercaptosilane-slides attaching disulfide-modified oligonucleotides (19), EZ-RAYS™-slides with three-dimensional coating and latent thiol groups attaching acrylamide-modified oligonucleotides, and unactivated slides attaching slianised oligonucleotides (20) (Table 1). For the aldehyde-coated ‘SuperAldehyde’-slides we tested two deactivation procedures, and to the EZ-RAYS™-slides and the mercaptosilane-slides we attached oligonucleotides modified both with acrylamide and disulfide residues.
Previously, at an early stage for microarray-based methods, when no commercially available slides or fluorescent scanners were available, we tested three possibilities for covalent attachment of oligonucleotides to microscope glass slides (16–18). These experiments were done using radioactive labelling in the minisequencing reaction, followed by phosphoimager scanning. We found that isothiocyanate coating for attaching NH2-oligonucleotides (17) gave the best signal to noise ratios in the assay and was the most reproducible of the three methods (K.Lindroos, M.Raitio and A.-C.Syvänen, unpublished results). Currently this attachment chemistry is used in our routine microarray-based genotyping assays (10,12). This method also served as the reference procedure in the study presented here.
Based on our previous experiments using isothiocyanate-coated and unmodified slides, oligonucleotide concentrations of 25 µM yielded a maximum attachment efficiency and the highest signal intensities in the minisequencing reaction (K.Lindroos, M.Raitio and A.-C.Syvänen, unpublished results). As this concentration was also recommended by the manufacturers of the commercial ‘SuperAldehyde’-, 3D-Link™- and EZ-RAYS™-slides, as well as for the mercaptosilane-coated slides (19) and the unmodified slides in the literature (20), 25 µM primers were used for spotting the primer arrays.
Background fluorescence
Initially, the background fluorescence of the six differently derivatised microscope slides was measured before attaching the oligonucleotides onto them. The unmodified slide and the mercaptosilane-coated slide gave the lowest background fluorescence. The background fluorescence of the slides after performing the minisequencing reaction was measured outside the oligonucleotide primer spots, to evaluate the unspecific binding of TAMRA-labelled ddNTPs to the surface. The unmodified slide showed lower background fluorescence than all the coated slides. The 3D-Link™- and EZ-RAYS™-slides gave significantly higher background than the other slides when the average signal from all four bases was calculated (Fig. 2).
Figure 2.

Comparison of background fluorescence for the different types of microscope glass slides after exposing the slides to minisequencing reaction mixtures containing TAMRA-labelled ddNTPs. The figure shows the average background from all four bases from two experiments after measurement under the Green HeNe laser. The laser power during the measurements was 95% and the pmt gain was 80%. The background fluorescence is given as arbitrary fluorescence units.
Attachment efficiency
The efficiency of coupling oligonucleotide primers to the slides coated with different functional groups was determined by immobilising sets of oligonucleotide primers modified in their 5′-ends with the appropriate reactive group (Table 1). The ends of the immobilised oligonucleotides were extended with TAMRA-labelled dATP using terminal deoxynucleotidyl transferase, followed by measurement in the fluorescence array scanner. The fluorescence signals from the oligonucleotides on each slide type were compared with the corresponding signals on the isothiocyanate-modified slide. For all the oligonucleotides included in the experiment, the 3D-Link™-slides gave higher signal intensities than the isothiocyanate slides, and a similar result was observed with the mercaptosilane-coated slides. The other surfaces appeared to attach less oligonucleotides than the isothiocyanate-coated slides (Table 1).
Both the activated EZ-RAYS™- and mercaptosilane-slides are based on thiol groups mediating the binding of the oligonucleotides to the surface. Thus both acrylamide- and disulfide-modified oligonucleotides may be attached to these slide types. We tested coupling acrylamide-modified oligonucleotides onto the mercaptosilane-slides, and disulfide-modified oligonucleotides onto the EZ-RAYS™-slides, as can be seen in Table 1. The mercaptosilane-surfaced slides gave a mean signal intensity for the acrylamide-modified oligonucleotides that was only 30% of that of the disulfide-modified oligonucleotides and the mean signal intensity for the disulfide-modified oligonucleotides was 90% of that of the acrylamide-modified oligonucleotides.
Minisequencing reactions
As the most relevant evaluation, the different slide types were tested for their performance as supports for minisequencing reactions. The signal intensities and signal ratios observed in the minisequencing reactions on each slide were compared with those on the isothiocyanate-slide using a sample that is homozygous at all variable sites as template. In this experiment the aldehyde-coated slides repeatedly gave signal intensities that were too low for reliable genotyping (data not shown). The 3D-Link™-slides gave signal intensities that were 6–40 times higher than those on the isothiocyanate-modified slides, but the genotyping was hampered by a high background from unspecifically bound fluorescent ddNTPs (Table 3). The mercaptosilane-modified slides gave two to five times higher signal intensities than the isothiocyanate-slides, and since the level of background fluorescence was low for these slides, the genotyping results were unequivocal (Table 3). As expected from the terminal deoxynucleotidyl transferase-mediated extension reaction, the other thiol-surfaced slides, the EZ-RAYS™-slides, did not give as high signal intensities as the mercaptosilane-slides, despite their three-dimensional coating. The signal intensities for the EZ-RAYS™-slides were at their best 50% of that of the isothiocyanate-slides. The unmodified slides gave similar signal intensities to the isothiocyanate-slides (Table 3).
Table 3. Minisequencing results on the 3D-Link™-slides, the mercaptosilane-coated slides, the EZ-RAYS™-slides and the unmodified slides compared with those on the isothiocyanate-coated slides.
| SNP | Signal intensitya (arbitrary fluorescence units) | Signal/noiseb | |||||||
| |
|
3D-Link™ |
Isothiocyanate |
Mercaptosilanec |
Isothiocyanate |
3D-Link™ |
Isothiocyanate |
Mercaptosilanec |
Isothiocyanate |
| AGTR1 1166co | C-allele | 31 000 | 2500 | 21 000 | 8300 | 100 | 50 | 47 | 208 |
| A-allele | 310 | 50 | 450 | 40 | |||||
| AGTR1 1166nc | G-allele | 12 000 | 280 | 9300 | 10 | 24 | 7.0 | 47 | 0.013 |
| T-allele | 500 | 40 | 200 | 780 | |||||
| AGTR1 1062co | A-allele | 19 000 | 1400 | 21 000 | 7000 | 5.1 | 11 | 12 | ∞ |
| G-allele | 3700 | 130 | 1800 | 0 | |||||
| AGTR1 1062nc | T-allele | 27 000 | 3000 | 21 000 | 6900 | 250 | 300 | 46 | 53 |
| C-allele | 110 | 10 | 460 | 130 | |||||
| eNOSco | G-allele | 62 000 | 3500 | 60 000 | 24 000 | 370 | 88 | 38 | 4.8 |
| T-allele | 170 | 40 | 1600 | 5000 | |||||
| eNOSnc | C-allele | 7300 | 1200 | 17 000 | 3600 | 12 | 7.1 | 21 | 17 |
| |
A-allele |
590 |
170 |
830 |
210 |
|
|
|
|
| |
|
EZ-RAYS™ |
Isothiocyanate |
Unmodifiedd |
Isothiocyanate |
EZ-RAYS™ |
Isothiocyanate |
Unmodifiedd |
Isothiocyanate |
| eNOSco | G-allele | 50 | 8500 | 6600 | 16 000 | 0.069 | 3.0 | 11 | 36 |
| T-allele | 720 | 2800 | 610 | 440 | |||||
| eNOSnc | C-allele | 4800 | 8400 | 16 000 | 4100 | 69 | 26 | 7.0 | 32 |
| A-allele | 70 | 320 | 2300 | 130 | |||||
aSignal intensity = signal intensity of oligonucleotide spot – average background fluorescence. The average values were calculated from two different reactions using sample 1 as DNA template, which was homozygous at all SNP sites. The laser power was 85% for the 3D-Link™/isothiocyanate comparison and for the mercaptosilane/isothiocyanate comparison. For the other two comparison reactions the laser power was 95%. The pmt gain was 75% for the 3D-Link™/isothiocyanate comparison and 85% for all the other comparison reactions.
bThe signal intensity ratio between the expected and the other possible allele.
cThe AGTR1 1166 nc* oligonucleotide was used for the mercaptosilane-array whereas the isothiocyanate-array had the AGTR1 1166 co oligonucleotide (see Table 22).
dThe oligonucleotide concentration was 15 µM for the unmodified oligonucleotides.
Finally, the 3D-Link™-slides and the mercaptosilane-surfaced slides, which gave higher signal intensities than the isothiocyanate-surface, were compared with each other in a minisequencing reaction using sample 2, which was heterozygous at four of the six variation sites, as template. The average signal intensities were approximately two times higher for the 3D-Link™-slides than for the mercaptosilane-slides, except for the oligonucleotides AGTR1 1166nc* and AGTR1 1062nc, where the situation was reversed (results not shown). This observation could be due to differences in the efficiency of the 5′-modification between the primers. However, a slightly better discrimination between heterozygous genotypes was observed on the mercaptosilane-coated slides than on the 3D-Link™-slides (Fig. 3). Comparison of signal intensity ratios from samples 1 and 2 demonstrates the high power of discrimination between homozygous and heterozygous genotypes.
Figure 3.

Signal intensity ratios from minisequencing reactions performed on the 3D-Link™-slides and mercaptosilane-coated slides from a sample that was homozygous at all sites and from a sample that was heterozygous at the AGTR1 1062 and eNOS SNPs and homozygous at the AGTR1 1166 SNP. The signal intensity ratios that were >10 are indicated with numbers.
CONCLUSIONS
We found that the amount of immobilised oligonucleotide gives a good estimate about how specifically the minisequencing reactions will function. We were able to determine that, in the minisequencing reactions, the two-dimensional mercaptosilane-derivatised glass slides gave the best genotyping ratios, although the 3D-Link™-slides with a three-dimensional coating gave higher signal intensities. However, we believe that further optimisation of both the attaching procedure and the reaction conditions itself would improve the results with the 3D-Link™-slides. Also, the unmodified slides attaching silanised oligonucleotides seemed to be a promising new alternative for attaching the oligonucleotides, mostly because of their very low background fluorescence.
Acknowledgments
ACKNOWLEDGEMENTS
Jonas Jarvius is thanked for the 3D-Link™-slides, Jakob Karén for spotting some of the slides and Zicai Liang for advice on spotting the silanised oligonucleotides onto the unmodified slides. Orchid Bioscience is acknowledged for providing the mercaptosilane-slides as well as the disulfide-modified oligonucleotides. Mosaic Technologies is thanked for giving us the EZ-RAYS™-slides. The study was supported by a grant from the Swedish Medical Research Council (MFR).
References
- 1.Sachidanandam R., Weissman,D., Schmidt,S.C., Kakol,J.M., Stein,L.D., Marth,G., Sherry,S., Mullikin,J.C., Mortimore,B.J., Willey,D.L. et al. (2001) A map of human genome sequence variation containing 1.42 million single nucleotide polymorphisms. Nature, 409, 928–933. [DOI] [PubMed] [Google Scholar]
- 2.Venter J.C., Adams,M.D., Myers,E.W., Li,P.W., Mural,R.J., Sutton,G.G., Smith,H.O., Yandell,M., Evans,C.A., Holt,R.A. et al. (2001) The sequence of the human genome. Science, 291, 1304–1351. [DOI] [PubMed] [Google Scholar]
- 3.Hacia J.G. (1999) Resequencing and mutational analysis using oligonucleotide microarrays. Nat. Genet., 21, 42–47. [DOI] [PubMed] [Google Scholar]
- 4.Pastinen T., Kurg,A., Metspalu,A., Peltonen,L. and Syvanen,A.C. (1997) Minisequencing: a specific tool for DNA analysis and diagnostics on oligonucleotide arrays. Genome Res., 7, 606–614. [DOI] [PubMed] [Google Scholar]
- 5.Pastinen T., Perola,M., Niini,P., Terwilliger,J., Salomaa,V., Vartiainen,E., Peltonen,L. and Syvanen,A. (1998) Array-based multiplex analysis of candidate genes reveals two independent and additive genetic risk factors for myocardial infarction in the Finnish population. Hum. Mol. Genet., 7, 1453–1462. [DOI] [PubMed] [Google Scholar]
- 6.Fan J.B., Chen,X., Halushka,M.K., Berno,A., Huang,X., Ryder,T., Lipshutz,R.J., Lockhart,D.J. and Chakravarti,A. (2000) Parallel genotyping of human SNPs using generic high-density oligonucleotide tag arrays. Genome Res., 10, 853–860. [DOI] [PMC free article] [PubMed] [Google Scholar]
- 7.Fortina P., Delgrosso,K., Sakazume,T., Santacroce,R., Moutereau,S., Su,H.J., Graves,D., McKenzie,S. and Surrey,S. (2000) Simple two-color array-based approach for mutation detection. Eur. J. Hum. Genet., 8, 884–894. [DOI] [PubMed] [Google Scholar]
- 8.Hirschhorn J.N., Sklar,P., Lindblad-Toh,K., Lim,Y.M., Ruiz-Gutierrez,M., Bolk,S., Langhorst,B., Schaffner,S., Winchester,E. and Lander,E.S. (2000) SBE-TAGS: An array-based method for efficient single-nucleotide polymorphism genotyping. Proc. Natl Acad. Sci. USA, 97, 12164–12169. [DOI] [PMC free article] [PubMed] [Google Scholar]
- 9.LaForge K.S., Shick,V., Spangler,R., Proudnikov,D., Yuferov,V., Lysov,Y., Mirzabekov,A. and Kreek,M.J. (2000) Detection of single nucleotide polymorphisms of the human mu opioid receptor gene by hybridization or single nucleotide extension on custom oligonucleotide gelpad microchips: potential in studies of addiction. Am. J. Med. Genet., 96, 604–615. [DOI] [PubMed] [Google Scholar]
- 10.Pastinen T., Raitio,M., Lindroos,K., Tainola,P., Peltonen,L. and Syvanen,A.C. (2000) A system for specific, high-throughput genotyping by allele-specific primer extension on microarrays. Genome Res., 10, 1031–1042. [DOI] [PMC free article] [PubMed] [Google Scholar]
- 11.Pirrung M.C., Davis,J.D. and Odenbaugh,A.L. (2000) Novel reagents and procedures for immobilization of DNA on glass microchips for primer extension. Langmuir, 16, 2185–2191. [Google Scholar]
- 12.Raitio M., Lindroos,K., Laukkanen,M., Pastinen,T., Sistonen,P., Sajantila,A. and Syvanen,A.C. (2001) Y-chromosomal snps in finno-ugric-speaking populations analyzed by minisequencing on microarrays. Genome Res., 11, 471–482. [DOI] [PMC free article] [PubMed] [Google Scholar]
- 13.Fodor S.P., Read,J.L., Pirrung,M.C., Stryer,L., Lu,A.T. and Solas,D. (1991) Light-directed, spatially addressable parallel chemical synthesis. Science, 251, 767–773. [DOI] [PubMed] [Google Scholar]
- 14.Shchepinov M.S., Case-Green,S.C. and Southern,E.M. (1997) Steric factors influencing hybridisation of nucleic acids to oligonucleotide arrays. Nucleic Acids Res., 25, 1155–1161. [DOI] [PMC free article] [PubMed] [Google Scholar]
- 15.Kwiatkowski M., Fredriksson,S., Isaksson,A., Nilsson,M. and Landegren,U. (1999) Inversion of in situ synthesized oligonucleotides: improved reagents for hybridization and primer extension in DNA microarrays. Nucleic Acids Res., 27, 4710–4714. [DOI] [PMC free article] [PubMed] [Google Scholar]
- 16.Lamture J.B., Beattie,K.L., Burke,B.E., Eggers,M.D., Ehrlich,D.J., Fowler,R., Hollis,M.A., Kosicki,B.B., Reich,R.K., Smith,S.R. et al. (1994) Direct detection of nucleic acid hybridization on the surface of a charge coupled device. Nucleic Acids Res., 22, 2121–2125. [DOI] [PMC free article] [PubMed] [Google Scholar]
- 17.Guo Z., Guilfoyle,R.A., Thiel,A.J., Wang,R. and Smith,L.M. (1994) Direct fluorescence analysis of genetic polymorphisms by hybridization with oligonucleotide arrays on glass supports. Nucleic Acids Res., 22, 5456–5465. [DOI] [PMC free article] [PubMed] [Google Scholar]
- 18.Joos B., Kuster,H. and Cone,R. (1997) Covalent attachment of hybridizable oligonucleotides to glass supports. Anal. Biochem., 247, 96–101. [DOI] [PubMed] [Google Scholar]
- 19.Rogers Y.H., Jiang-Baucom,P., Huang,Z.J., Bogdanov,V., Anderson,S. and Boyce-Jacino,M.T. (1999) Immobilization of oligonucleotides onto a glass support via disulfide bonds: A method for preparation of DNA microarrays. Anal. Biochem., 266, 23–30. [DOI] [PubMed] [Google Scholar]
- 20.Kumar A., Larsson,O., Parodi,D. and Liang,Z. (2000) Silanized nucleic acids: a general platform for DNA immobilization. Nucleic Acids Res., 28, E71. [DOI] [PMC free article] [PubMed] [Google Scholar]
- 21.Chrisey L.A., Lee,G.U. and O’Ferrall,C.E. (1996) Covalent attachment of synthetic DNA to self-assembled monolayer films. Nucleic Acids Res., 24, 3031–3039. [DOI] [PMC free article] [PubMed] [Google Scholar]
- 22.Beier M. and Hoheisel,J.D. (1999) Versatile derivatisation of solid support media for covalent bonding on DNA-microchips. Nucleic Acids Res., 27, 1970–1977. [DOI] [PMC free article] [PubMed] [Google Scholar]
- 23.Adessi C., Matton,G., Ayala,G., Turcatti,G., Mermod,J.J., Mayer,P. and Kawashima,E. (2000) Solid phase DNA amplification: characterisation of primer attachment and amplification mechanisms. Nucleic Acids Res., 28, E87. [DOI] [PMC free article] [PubMed] [Google Scholar]
- 24.Bonnardeaux A., Davies,E., Jeunemaitre,X., Fery,I., Charru,A., Clauser,E., Tiret,L., Cambien,F., Corvol,P. and Soubrier,F. (1994) Angiotensin II type 1 receptor gene polymorphisms in human essential hypertension. Hypertension, 24, 63–69. [DOI] [PubMed] [Google Scholar]
- 25.Marsden P.A., Heng,H.H., Scherer,S.W., Stewart,R.J., Hall,A.V., Shi,X.M., Tsui,L.C. and Schappert,K.T. (1993) Structure and chromosomal localization of the human constitutive endothelial nitric oxide synthase gene. J. Biol. Chem., 268, 17478–17488. [PubMed] [Google Scholar]
- 26.Syvänen A.-C. (1997) Solid phase minisequencing. In Graham,R. and Taylor,E. (eds), Laboratory Methods for the Detection of Mutations and Polymorphisms in DNA. CRC Press, London, UK, pp. 53–64.