Abstract
Tissue harmonic imaging has been widely used in abdominal imaging because of its significant reduction in acoustic noise compared with fundamental imaging. However, tissue harmonic imaging can be limited by both signal-to-noise ratio and penetration depth during clinical imaging, resulting in decreased diagnostic utility. A logical approach would be to increase the source pressure, but the in situ pressures used in diagnostic ultrasound are subject to a de facto upper limit based on the U.S. Food and Drug Administration guideline for the mechanical index (<1.9). A recent American Institute of Ultrasound in Medicine report concluded that an effective mechanical index ≤4.0 could be warranted without concern for increased risk of cavitation in non-fetal tissues without gas bodies, but would only be justified if there were a concurrent improvement in image quality and diagnostic utility. This work evaluates image quality differences between normal and elevated acoustic output hepatic harmonic imaging using a transmit frequency of 1.8 MHz. The results indicate that harmonic imaging using elevated acoustic output leads to modest improvements (3%–7%) in contrast-to-noise ratio of hypo-echoic hepatic vessels and increases in imaging penetration depth on the order of 4 mm per mechanical index increase of 0.1 for a given focal depth. Difficult-to-image patients who suffer from poor ultrasound image quality exhibited larger improvements than easy-to-image study participants.
Keywords: Elevated acoustic output, Harmonic imaging, Mechanical Index journal: Ultrasound in Medicine and Biology
INTRODUCTION
Ultrasound imaging is one of the most widely used abdominal imaging modalities in the United States; its advantages include its low cost and real-time nature, as well as a lack of ionizing radiation. Abdominal ultrasound is widely used for screening liver diseases (Miesner 2013; Mishra and Younossi 2007), and it is the recommended modality for 6-month screening in patients at risk for hepatocellular carcinoma (HCC) (Asham et al. 2013; Bruix and Sherman 2011). The major drawback of abdominal ultrasound is poor image quality insufficient for diagnosis, which is reported in 25% to 60% of patients (Asham et al. 2013; Joshi et al. 2014; Singal et al. 2013; Virmani et al. 2013), and is often correlated with obesity (Klysik et al. 2014; Schuh et al. 2011). In obese patients, poor image quality arises from decreased penetration depth and increased aberration, attenuation and reverberation clutter from the abdominal wall (Klysik et al. 2014; Pinton et al. 2011).
Tissue harmonic imaging (THI) has become the default imaging mode for most abdominal imaging examinations. THI is based on non-linear acoustic wave propagation, where images are made from the harmonics generated as the transmitted sound travels through biological tissues. THI is widely reported to be better than fundamental B-mode ultrasound with respect to lesion visibility and diagnostic confidence (Bradley 2006; Pinton et al. 2011; Thomas and Rubin 1998). Its success in creating higher-quality images is attributed to decreased side lobe energy (Christopher 1997, 1998) and decreased reverberation clutter in the abdominal wall (Bradley 2006; Pinton et al. 2011). However, second harmonic pressure amplitude is generally 15–20 dB lower than the corresponding fundamental pressure (Desser and Jeffrey 2001). Therefore, THI can be limited by both signal-to-noise ratio (SNR) and penetration depth (PD) during clinical imaging, resulting in decreased diagnostic utility (de Moura Almeida et al. 2008; Klysik et al. 2014; Schuh et al. 2011).
A logical approach to improvement of THI SNR is to increase the source pressure because the second harmonic pressure increases quadratically with source pressure (Christopher 1997). However, the acoustic output of diagnostic ultrasonic imaging systems in the United States has been subject to a de facto upper limit based on the Food and Drug Administration (FDA) guideline for the mechanical index (MI < 1.9) (Center for Devices and Radiological Health [CDRH] 1994). The MI is defined as
| (1) |
where pr:3(zMI) is the attenuated (derated) peak rarefactional acoustic pressure at depth zMI (assuming an attenuation coefficient [α] of 0.3 dB/cm/MHz); zMI is depth on the beam axis from the transducer to the lateral-elevational plane of the maximum attenuated pulse-intensity integral (PII.3, which generally occurs near the focal depth) (CDRH 1994); and fc is the center frequency of the transmitted acoustic wave (International Electrotechnical Commission [IEC] 2010). The MI guideline is intended to minimize the potential risk of inertial cavitation induced by diagnostic ultrasound examinations. Inertial cavitation is a bubble motion characterized by a large expansion followed by a violent collapse, which can generate damaging shock waves and raise local temperatures as high as 5000 K (Church et al. 2012). The original MI formulation was based on the assumption of pre-existing optimally sized bubbles in water, and the ultrasound pulse has a negative leading edge (Apfel and Holland 1991). The guideline of 1.9 was based on the maximum MI computed for the products commercially available prior to 1976, rather than on reported evidence of bio-effects (Nightingale et al. 2015). The MI is commonly further limited by commercial ultrasound vendors when a 20%–30% safety buffer is applied to reduce the number of production transducers requiring quality assurance testing (American Institute of Ultrasound in Medicine/National Electrical Manufacturers Association [AIUM/NEMA] 1998; Ziskin 2003), which results in most current commercial scanners using a maximum MI of 1.6. If bubbles are not present, the pressures (MI) required to induce cavitation are much higher (Church et al. 2015). A recent report from the American Institute of Ultrasound in Medicine (AIUM) concluded that an in situ MI or effective MI (MIE) value up to 4.0 could be warranted without concern for increased risk of cavitation in non-fetal tissues without gas bodies if there were concurrent improvement in diagnostic utility (Nightingale et al. 2015).
The work described in this article represents a clinical study that evaluated THI data quality for hepatic imaging sequences using MI values typical in commercial ultrasound scanners (MI = 1.6) and elevated MI values (MI ≤ 2.6). We hypothesized that increasing acoustic output would result in higher SNRs of the image data, which would increase imaging penetration depth and increase the contrast-no-noise ratio (CNR) of hypo-echoic hepatic structures by decreasing the relative signal variance in the structures.
METHODS
Two types of imaging sequences, B-mode and M-mode sequences, were implemented in this study. B-Mode data were acquired from hypo-echoic vascular structures in participants’ livers, and CNRs were calculated to assess the image quality for low- and elevated-MI matched fundamental and harmonic images. M-Mode data were also acquired from homogeneous regions of livers, and the imaging penetration depth (PD) was estimated from M-mode data and evaluated as a function of MI.
Imaging pulse parameters
Pulse-inversion harmonic data were acquired using a modified Siemens S2000 scanner (Siemens Healthcare, Ultrasound Business Unit, Mountain View, CA, USA) with a 4C1 curvilinear array typical for abdominal imaging. Four custom imaging configurations (two B-mode, two M-mode) were developed and calibrated (AIUM/NEMA 1998) with various transmit foci to target hepatic structures at different depths. Table 1 lists the transmit frequency and focal depths, as well as the MI and MIE values. Beamformed radiofrequency (RF) data of each transmit–receive event were collected, and pulse-inversion harmonic data were created by summing the RF data from two consecutive transmit events with positive and negative leading-edge pulses and filtering the data around harmonic frequencies (Desser and Jeffrey 2001).
Table 1.
Transmit frequency, focal depth, and MI configurations
| Imaging configuration
|
||
|---|---|---|
| 1 | 2 | |
| Transmission frequency | 1.8 MHz | 1.8 MHz |
| Focal depth | 6 cm | 8 cm |
| B-Mode MI values | 1.6, 2.6 | 1.6, 2.0 |
| B-Mode MIE values | 1.5, 2.6 | 1.7, 2.0 |
| M-Mode MI values | 1.6, 2.0, 2.3, 2.6 | 1.6, 1.7, 1.8, 2.0 |
| M-Mode MIE values | 1.5, 1.9, 2.3, 2.6 | 1.7, 1.8, 1.9, 2.0 |
MI = mechanical index; MIE = effective mechanical index.
B-Mode sequence and contrast-to-noise ratio
B-Mode data acquisitions were targeted at hypo-echoic vascular structures such as the portal veins in the livers of each participant. For each participant, the liver was scanned with real-time THI at standard MI values <1.9, and image planes containing target hypo-echoic structures were identified. The focal depth from Table 1 closest to that structure was selected and the receive-gain settings were adjusted to obtain the best image quality. Once the image was optimized, the scanner was triggered to acquire three pairs of harmonic images with alternating low MI (1.6) and high MI (2.0–2.6) values using real-time frame rates (≥7 frames/s) in a random order. The use of real-time frame rates was crucial to minimize the motion between image frames for accurate matched CNR calculations. We aimed to image eight different hypo-echoic structures for each participant.
Hypo-echoic structures were identified from the acquired images offline after the data acquisition, and the CNR of each structure was calculated from both fundamental and harmonic images. The CNR was calculated using the equation
| (2) |
where Si and So are the mean signal magnitudes of the regions inside and outside of the structures, respectively, and and are corresponding signal variances. The regions of interest (ROIs) for CNR computation inside and outside the structures were determined offline after the data acquisition. The ROIs outside the structures were selected in a uniform speckle region at the same depth compared with the structure. The ROI sizes were determined based on the size of the structures, which differed between participants. All ROIs were selected to be greater than 20 mm2 to provide sufficient area to accurately represent mean brightness. In addition, surrounding margins within the ROI were required to be at least 3 mm to ensure the boundaries of structures were clearly delineated in the images. The CNR results were averaged across each of the three images obtained at low and high MI values, respectively, for each target. A CNR measurement was rejected when the standard deviation of the CNR across the three matched MI images was greater than 0.1, which indicates that there was significant motion artifact during the acquisition.
For each target, a CNR increase was defined when the difference between the mean CNR going from low- to high-MI images was positive and larger than the CNR standard deviation between the three repeated measurements at either MI. A CNR decrease was defined in a similar way, with a negative CNR difference going from low- to high-MI images. No change in CNR was defined when the mean CNR difference between the low- and high-MI images was less than the standard deviation of the three measurements at either MI.
M-Mode sequence and penetration depth
M-Mode sequences that consisted of repeated firings of ultrasound beams at the same spatial location were performed using a pulse repetition frequency (PRF) ≥2 kHz. The high PRF was used to minimize motion between the repeated firings. Pulse-inversion harmonic data were acquired for each beam, where alternating positive and negative leading edge pulses were repeated 10 times. Each acquisition contained eight different beam locations. For each participant, the sonographer scanned the liver to target homogeneous liver regions devoid of vessels or other structures using standard B-mode imaging. The scanner was then triggered to acquire M-mode data for four MI values between 1.6 and 2.6.
Normalized cross-correlation (NX-corr) (Pinton et al. 2006) was performed between the received harmonic data from repeated firings of each beam using a 1.7-mm kernel with 97% overlap. The correlation coefficient (CC) was averaged across the 10 repeated firings at each spatial location as a function of depth. Imaging PD was quantified as the depth when the CC dropped below 0.8. For a given transducer and a transmit focal depth, we expect that PD would increase with increasing MI.
MI and MIE measurements
Acoustic output measurements were conducted according to AIUM/NEMA (1998) using a calibrated polyvinyl difluoride membrane hydrophone with a 0.6-mm spot size (Sonic Technologies, Wyndmoor, PA, USA). The pressure was estimated from the recorded voltage waveform using deconvolution based on the frequency-dependent magnitude of the sensitivity of the hydrophone (Wear et al. 2014). After voltage-to-pressure conversion, the MI was obtained by derating the peak rarefactional pressure by 0.3 dB/cm/MHz at the center frequency of the transmit waveform, and then dividing by the square root of the center frequency. MIE measurements were conducted in a lossy medium (a solution of evaporated milk and water with α = 0.5 dB/cm/MHz) that more closely matches the attenuation of tissue (Nightingale et al. 2015).
The maximum MI values as listed in Table 1 were dictated by scanner hardware. The commercial ultrasound scanner used in this study was designed to operate at an MI ≤ 1.6. System non-linearities could degrade harmonic image quality when the scanner operates at elevated acoustic output levels. The positive and negative leading edge pulses were measured with the hydrophone at the transducer surface at a range of MI values. Lower correlation coefficients were observed between the positive and negative leading edge pulses at higher MI values. A lower correlation coefficient results in imperfect cancellation of the transmitted signals during pulse inversion, which introduces undesirable harmonic content in the received signal and degrades harmonic image quality. We imposed a minimum correlation coefficient magnitude threshold of 0.98 to maintain high levels of cancellation. This correlation coefficient threshold dictated the maximum MI for each sequence used in this study.
Clinical study design and population
Twelve patients scheduled for general abdominal ultrasound examinations at Duke University Medical Center and 13 healthy volunteers were enrolled in this study. This clinical study was approved by the institutional review board at Duke University and Duke University Medical Center, and each study participant provided written informed consent prior to enrollment. The body mass index (BMI) of each participant was recorded. All data acquisitions were performed subcostally. Study participants were asked to stop breathing during data acquisition, which lasted approximately 5 s for B-mode sequences and 8 s for M-mode sequences. The participant was instructed to resume breathing after each acquisition. B-Mode image quality was subjectively scored on a scale of 1–3 by the study team radiologist (1 = easy, 2 = medium, 3 = difficult). Table 2 summarizes the demographics of the participants.
Table 2.
Demographics of participants (n = 25)
| Sex | |
| Male | 13 |
| Female | 12 |
| Body mass index (kg/m2) | |
| ≤24.9 | 8 |
| 25.0–29.9 | 8 |
| 30.0–39.9 | 6 |
| ≥40.0 | 3 |
| Image quality | |
| 1 (easy) | 9 |
| 2 (medium) | 9 |
| 3 (difficult) | 7 |
RESULTS
Mechanical index
The MI was measured for a range of scanner excitation voltages at each focal depth. In Figure 1 are example pressure waveforms measured at a focal depth of 6 cm using the 4C1 transducer. In Figure 1 (a, b), the pressure waveforms corresponding to MI values of 1.4 and 2.8 are plotted. As is typical in water measurements, both waveforms appear non-linear, with the peak positive pressure significantly higher than the peak negative pressure. The corresponding MI values were calculated from peak negative pressures using eqn (1).
Fig. 1.
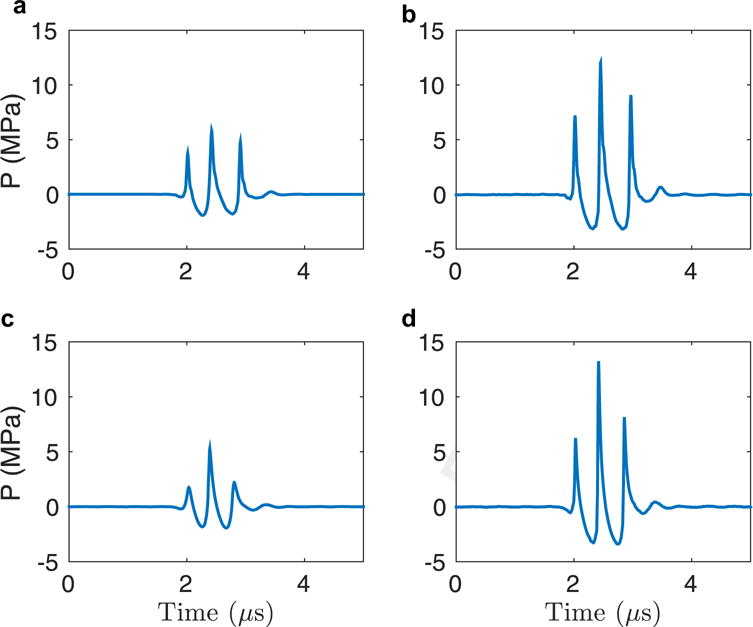
Hydrophone measurement results for the 4C1 transducer with a lateral focus at 6 cm. (a) Pressure waveform corresponding to a mechanical index of 1.4. (b) Pressure waveform corresponding to a mechanical index of 2.8.
Contrast-to-noise ratio
Hepatic hypo-echoic structures were identified from each B-mode image after data acquisition, and their CNRs were computed. Given the rejection criteria described under Methods, there were 129 hypo-echoic structures identified in total from the B-mode images of the 25 participants.
The two images in the top row of Figure 2 are an example pair of hepatic harmonic images of an average-weight volunteer (BMI = 20.9 kg/m2). The arrows in the images point to three hypo-echoic vessels in which the CNR was computed. The CNR values of the three vessels at the two MI values are plotted in the bottom panel of Figure 2. The variability among the three pairs of measurements at each MI is reflected in the error bars. The vessels had CNR increases of 7% (red), 12% (cyan) and 20% (pink) going from low- to high-MI imaging. In Figure 3 are a pair of hepatic harmonic images from an overweight patient (BMI = 26.0 kg/m2) who consistently exhibited significant CNR increase (>30%) going from low- to high-MI imaging. The CNR of the highlighted structure increased by 38%, and the boundary of the structure is more clearly delineated in the high-MI image on the right.
Fig. 2.
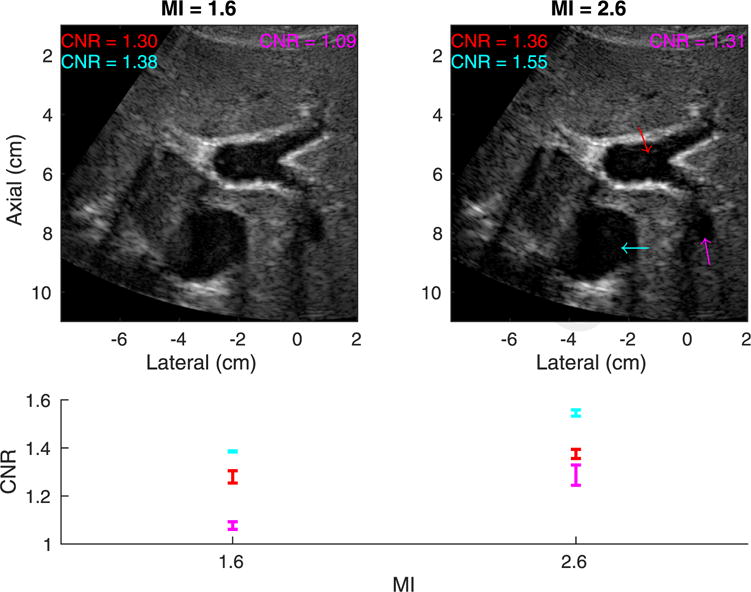
Top: Matched tissue harmonic images using mechanical index (MI) values of 1.6 (left) and 2.6 (right) in an easy-to-image (category 1) volunteer with a body mass index of 20.9 kg/m2. The arrows indicate structures in which the contrast-to-noise ratio (CNR) was computed. Both images are shown with a dynamic range of 60 dB. Bottom: CNR versus MI for each structure. The error bars reflect the variability of CNR among the three pairs of measurements at each MI.
Fig. 3.
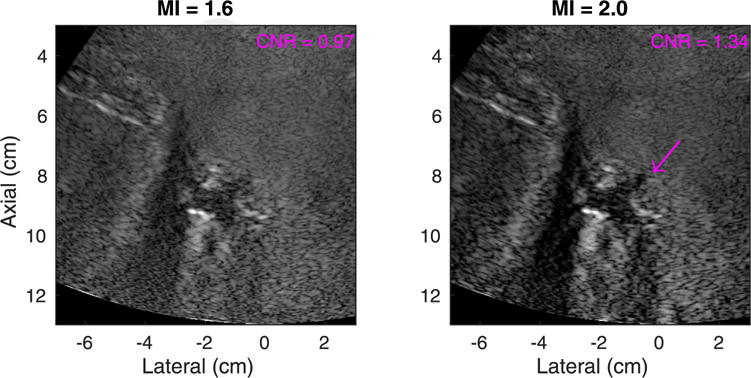
Matched tissue harmonic images using mechanical index (MI) values of 1.6 (left) and 2.0 (right) in a medium-image-quality (category 2) participant with a body mass index of 26.0 kg/m2. The arrow indicates the structure in which the contrast-to-noise ratio (CNR) was computed. Both images are shown with a dynamic range of 60 dB.
Figure 4 illustrates the number of structures that exhibited a CNR increase, no change or a decrease going from low- to high-MI B-mode imaging across all focal depths and all study participants in both fundamental and harmonic imaging modes. Of the 129 identified structures, 54% exhibited a CNR increase in harmonic images, whereas only 14% exhibited a CNR increase in fundamental images.
Fig. 4.
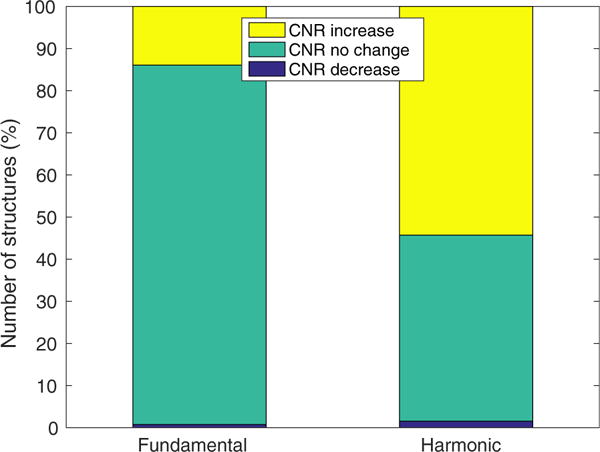
Number of hepatic hypo-echoic structures that exhibited a contrast-to-noise ratio (CNR) increase between matched low-and high-mechanical index B-mode imaging across all 25 participants. Of the 129 identified structures, 54% had a CNR increase in harmonic images, whereas only 14% of had a CNR increase in fundamental imaging.
The CNR results of harmonic images were then normalized to the CNR values at an MI of 1.6 to estimate percentage CNR increase. Figure 5 illustrates the percentage CNR increase with respect to image quality evaluated by the radiologist. The median CNR increase was positive for all levels of image quality, with median values of 3.0%, 7.2% and 6.9% for easy, medium and difficult-to-image participants. With use of a Wilcoxon rank sum test, the CNR increase in images with quality level 1 was found to be significantly lower than the CNR increase for image quality levels 2 and 3 (p ≤ 0.005).
Fig. 5.
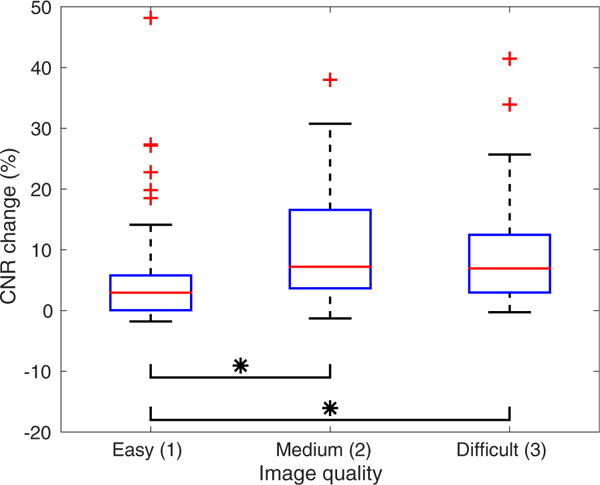
Percentage contrast-to-noise ratio (CNR) change as a function of subjective assessment of overall image quality for hepatic harmonic images. The mean CNR change is positive for all levels of image quality. The CNR increase for image quality level 1 is significantly lower than the CNR increase for image quality levels 2 and 3 (p ≤ 0.005).
In Figure 6 are scatterplots of the percentage CNR increase from all participants with respect to focal depth between low- and high-MI harmonic imaging. The focal depth was generally close to the depth of the hypo-echoic structures. The dashed line indicates the linear regression between percentage CNR change and focal depth. There is no significant trend between focal depth and CNR increase (ρ = 0.13, p > 0.05).
Fig. 6.
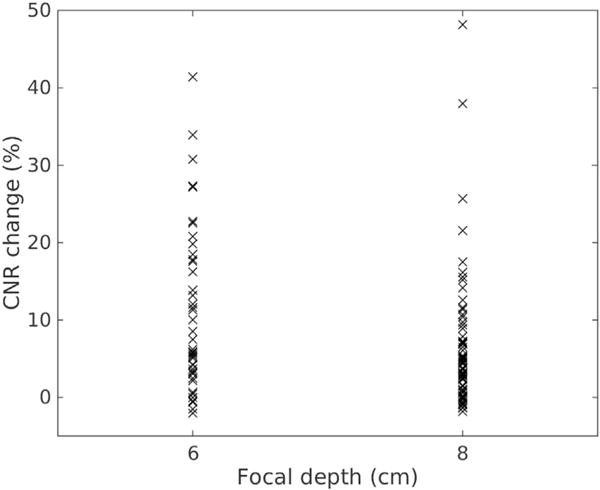
Percentage contrast-to-noise ratio (CNR) change versus focal depth between and low- and high-MI harmonic imaging.
Penetration depth
M-Mode data were obtained from 23 of 25 participants. The two failed participants had trouble holding their breath during the M-mode data acquisition, which took 8 s. Figure 7(a) is an example harmonic image using a focal depth of 6 cm and an MI value of 1.6 from an overweight participant (BMI = 25.7 kg/m2). The deepest 50% of this image is dominated by electronic noise and a lack of signal. Correlation coefficients were calculated using 1.7-mm kernels along the center beam of the image (blue line), which is one of the eight different spatial locations where PD was evaluated. Figure 7(b) plots the corresponding correlation coefficient results over depth. The correlation coefficients were close to 1.0 for shallow depths <7 cm, and decreased with increasing depth as the harmonic signal amplitude dropped because of attenuation, and the electronic noise became more apparent. At an arbitrarily selected correlation coefficient cutoff of 0.8 to quantify penetration depth, the penetration depth for this case is 10.4 cm.
Fig. 7.
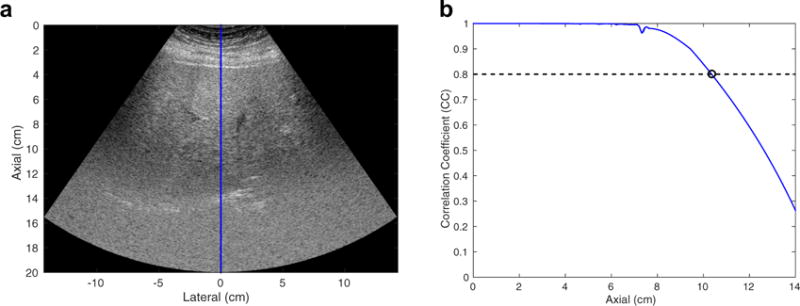
(a) Example harmonic image using a focal depth of 6 cm and a mechanical index value of 1.6 from an overweight participant (body mass index = 25.7 kg/m2). The image is shown with a dynamic range of 60 dB. The correlation coefficient (CC) was calculated from the M-mode data of the center beam of the image as highlighted by the blue line. (b) CC as a function of depth. With use of a CC cutoff of 0.8, the penetration depth of this image was determined to be 10.4 cm.
Imaging PD was estimated from the M-mode data for all focal depths from the 23 participants. Figure 8(a) plots PD as a function of MI at different focal depths in the same participant, as in Figure 7. The error- bars reflect the standard deviations of PD computed from eight different spatial locations. PD is always higher than the focal depth, and increases with increasing MI. The mean PD follows a linear relationship with MI as illustrated by the dashed lines in Figure 8(a). Similar trends between MI and mean PD were observed in the data from all participants. Figure 8(b), which combines data from all 23 participants, illustrates the slope of the increase in PD with respect to MI increase. The error bars represent inter-participant variability. The results indicate that PD increases by 4 cm per MI increase of 0.1.
Fig. 8.
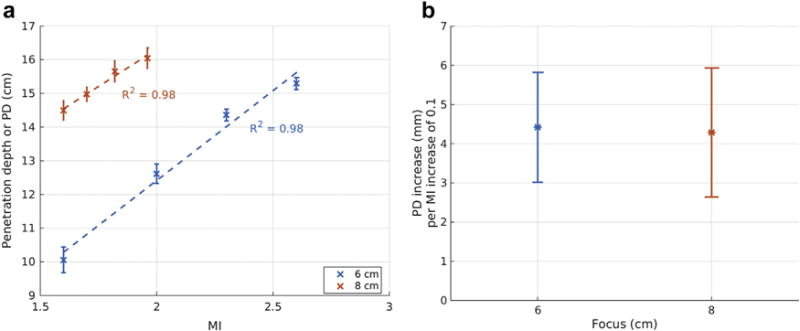
(a) Penetration depth (PD) as a function of mechanical index (MI) computed from harmonic images in an overweight patient (body mass index of 25.7 kg/m2). An increase in MI results in an increase in penetration depth for all focal depths. The dashed lines represent the linear fit between MI and mean PD. The error bars reflect the standard deviation from eight different spatial locations. (b) Slope of the linear fit between MI and PD as illustrated in (a) combining data from all the study subjects (R2 ≥ 0.95) as a function of focal depth. The error bars represent inter-participant variability.
DISCUSSION
We have evaluated the in vivo image quality improvement achieved when using elevated acoustic output in hepatic harmonic B-mode imaging. The MI was originally developed to gauge the likelihood of inertial cavitation associated with diagnostic ultrasound (Apfel and Holland 1991). The FDA guideline of MI < 1.9 was derived from historic values from diagnostic ultrasound devices on the market prior to 1976. In biological tissues that are generally free of gas bubbles such as healthy livers, the cavitation pressure threshold is relatively high, with one theoretical analysis concluding that the likelihood of cavitation using an MI of 4.0 in such tissues is 1 in 110 (Church et al. 2008). The Technical Standards Committee of the AIUM has formed a subcommittee to examine the benefits and risks of elevated acoustic output under clinical imaging scenarios where there are potentially high benefit-to-risk ratios (Nightingale et al. 2015). Liver imaging is one such scenario, and this study evaluated the image quality of hepatic harmonic imaging using an MI ≤ 2.6.
This study evaluated the impact of using elevated acoustic output at two focal depths (6 and 8 cm). We were unable to achieve an MI > 1.9 using deeper focal depths given the finite transducer aperture and limited scanner hardware. Water-based pressure measurements are subject to a maximum pressure amplitude (saturation pressure) for a given focal configuration caused by pre-focal saturation losses in water, which results in a maximum MI that can be measured for each focal depth (Duck 1999). The saturation pressure increases with increasing aperture size, and decreases with increasing imaging focal depth and frequency. For typical curvilinear array transducers such as the 4C1 transducer for abdominal imaging, it is difficult to achieve an MI > 1.9 for focal depths >10 cm.
Elevated acoustic output results in improved CNR for a larger number of structures in harmonic imaging than in fundamental imaging, as illustrated in Figure 4. Of the 129 identified structures, 54% had a CNR increase in harmonic images, whereas only 14% had a CNR increase in fundamental images with increased MI. This is likely because harmonic imaging suffers from a lower SNR compared with fundamental imaging (Bradley 2006). Second harmonic pressure increases with the square of source pressure, whereas fundamental pressure increases linearly with source pressure (Christopher 1997). Therefore, an MI increase leads to a quadratic increase in harmonic signal compared with a linear increase at the fundamental signal, resulting in a higher CNR increase in harmonic images.
As illustrated in Figure 6, a CNR increase with respect to MI was observed at all focal depths, and there was no correlation between focal depth and CNR increase. The CNR increases observed in this study were fairly modest (median values of 3%–7%), although there was one participant whose CNR increase consistently exceeded 30% with increased MI (going from 1.6 to 2.0), as illustrated in Figure 3.
Figure 5 examines the percentage CNR increase with respect to image quality as subjectively assessed by the radiologist. The mean CNR increase is positive for all levels of image quality, suggesting that elevated acoustic output could lead to higher lesion visibility in participants regardless of body habitus. On the other hand, the CNR improvement is significantly higher in medium- and difficult-to-image participants than in easy-to-image participants, indicating that difficult-to-image participants could preferably benefit from use of elevated acoustic output imaging.
Figure 8 indicates that increasing MI results in an increase in imaging penetration depth for a given focal depth in THI images. An MI increase leads to higher harmonic signal amplitude, which in turn increases the SNR of the harmonic image and the imaging penetration depth. In cases in which the radiologist struggles to see the anatomy deep in an ultrasound image for a given focal configuration, we expect that increasing MI would increase the imaging penetration depth and enable the image to cover a larger axial extent, as illustrated in Figure 9. On the other hand, this study investigated a limited range of focal depths, 6 and 8 cm, and PD was compared for matched focal depths. We did not compare, for example, high MI focused at 8 cm with lower MI focused at 24 cm. Future work will be directed at exploring imaging penetration depth with varying focal depths to evaluate the optimal focal configuration and acoustic output level for deep abdominal imaging.
Fig. 9.
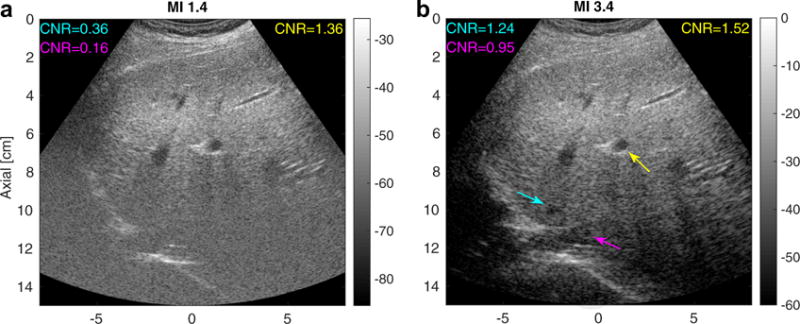
Matched tissue harmonic images using a typical mechanical index (MI) value (MI = 1.4, left) and an elevated MI value (MI = 3.4, right) focusing at 5 cm in an obese volunteer (BMI = 30.4 kg/m2) with a fatty liver. The image intensities are in decibels. The arrows point to vessels in which the contrast-to-noise ratio (CNR) was computed. The cyan and magenta arrows in the right image indicate structures deep to the focus that are visible only in the elevated-MI configuration.
A limitation of this study is that targets were identified while scanning with the lower-MI sequence. Each participant was first scanned with conventional THI to identify targets in the liver. After the target was located, the scanner was then triggered into data acquisition using low and high MI values. This meant that all structures were visualized at both low and high MI. In addition, all the hypo-echoic structures were close to the transmit focus and well within the imaging penetration depth, where we have the best SNR, so that in general only modest increases in CNR were observed in these structures. In one participant, we observed some lower-contrast structures deep to the focus at higher MI that were not visualized at the lower MI. Figure 9 provides a pair of harmonic hepatic images acquired at MI values of 1.4 and 3.4 in an obese volunteer (BMI = 30.4 kg/m2) with a fatty liver focused at 5 cm. The cyan and purple arrows in the right panel highlight structures that were not seen in the low-MI imaging. In this case, elevated acoustic output imaging increased the SNR of the harmonic signal at depths beyond the focus, and enabled visualization of low-contrast structures that were not apparent at the lower MI.
Another limitation of this study was the use of only two MI values for each focal depth in the B-mode sequences and CNR computation. This limits the ability to draw conclusions about MI thresholds and minimum CNR increases. For M-mode sequences, the imaging penetration depth was quantified based on an arbitrary correlation coefficient threshold of 0.8. We hypothesize that using a different correlation coefficient threshold would result in different absolute penetration depth, but the trend between PD and MI would still hold. Future work will be directed at validating this hypothesis. In addition, a single transmit frequency at 1.8 MHz was used in this study. Future work will involve investigating the transmit frequency dependency on image quality improvement, as well as the bio-effects of high-MI imaging.
In addition to the FDA guideline on the mechanical index that minimizes the risk of non-thermal bio-effects, diagnostic ultrasound systems are also subject to thermal safety limits such as the spatial peak temporal average intensity (ISPTA) and transducer face heating. ISPTA is related to expected thermal bio-effects and is limited to 720 mW/cm2 in non-fetal tissue (CDRH 1994). The temperature rise at the transducer surface is limited to 27°C when transmitting into still air and 10°C when the probe is in contact with a phantom during scanning (Jensen et al. 2016). In this initial study, we adopted a very conservative scanning protocol with a low duty cycle (<1%) during high-MI data acquisition to minimize temperature increase. There was no report of patient discomfort caused by transducer face heating during the study. Future work will involve developing high-MI scanning sequences to assess detectability differences of low-contrast hepatic lesions.
CONCLUSIONS
This study investigated image quality improvement using elevated acoustic output in hepatic B-mode harmonic imaging at a transmit frequency of 1.8 MHz. Custom B-mode and M-mode sequences were developed with fixed focal configurations, and CNR and imaging PD were computed to assess image quality. We observed modest increases in CNR in the majority of hepatic hypo-echoic vascular structures using harmonic imaging with elevated acoustic output. The CNR improvement with elevated MI was apparent in all participants, and was higher in medium and difficult-to-image participants. We also observed that harmonic imaging PD increased linearly with increasing MI for all focal depths. The results indicate that using elevated acoustic output exceeding the current FDA guideline of MI 1.9 moderately improves the image quality of B-mode hepatic harmonic imaging in terms of increasing vessel CNR and axial imaging depth.
Acknowledgments
The authors thank Laura Street and Dr. Rendon Nelson for their help on patient recruitment and data collection during the study, as well as Siemens Healthcare USA, Ultrasound Division, for their in-kind technical support.—This work was supported by National Institutes of Health Grant R01EB022106.
References
- American Institute of Ultrasound in Medicine/National Electrical Manufacturers Association (AIUM/NEMA) Acoustic output measurement standard for diagnostic ultrasound equipment. Laurel, MD: Author; 1998. [Google Scholar]
- Apfel RE, Holland CK. Gauging the likelihood of cavitation from short-pulse, low-duty cycle diagnostic ultrasound. Ultrasound Med Biol. 1991;17:179–185. doi: 10.1016/0301-5629(91)90125-g. [DOI] [PubMed] [Google Scholar]
- Asham EH, Kaseb A, Ghobrial RM. Management of hepatocellular carcinoma. Surg Clin North Am. 2013;93:1423–1450. doi: 10.1016/j.suc.2013.08.008. [DOI] [PubMed] [Google Scholar]
- Bradley C. Mechanisms of image quality improvement in tissue harmonic imaging. AIP Conf Proc. 2006;838:247–254. [Google Scholar]
- Bruix J, Sherman M. Management of hepatocellular carcinoma: An update. J Hepatol. 2011;53:1020–1022. doi: 10.1002/hep.24199. [DOI] [PMC free article] [PubMed] [Google Scholar]
- Center for Devices and Radiological Health (CDRH) 510(k) Guide for measuring and reporting acoustic output of diagnostic ultrasound medical devices. Silver Spring, MD: Food and Drug Administration; 1994. p. 1985. rev. 1993. [Google Scholar]
- Christopher T. Finite amplitude distortion-based inhomogeneous pulse echo ultrasonic imaging. IEEE Trans Ultrason Ferroelectr Freq Control. 1997;44:125–139. doi: 10.1109/58.585208. [DOI] [PubMed] [Google Scholar]
- Christopher T. Experimental investigation of finite amplitude distortion-based, second harmonic pulse echo ultrasonic imaging. IEEE Trans Ultrason Ferroelectr Freq Control. 1998;45:158–162. doi: 10.1109/58.646920. [DOI] [PubMed] [Google Scholar]
- Church CC, Carstensen EL, Nyborg WL, Carson PL, Frizzell LA, Bailey MR. The risk of exposure to diagnostic ultrasound in postnatal subjects: nonthermal mechanisms. J Ultrasound Med. 2008;27:565–592. doi: 10.7863/jum.2008.27.4.565. [DOI] [PubMed] [Google Scholar]
- Church CC, Labuda C, Nightingale KR. Should the mechanical index be revised for ARFI imaging? Proc IEEE Int Ultrason Symp. 2012;2012:17–20. doi: 10.1109/ULTSYM.2012.0005. [DOI] [PMC free article] [PubMed] [Google Scholar]
- Church CC, Labuda C, Nightingale K. A theoretical study of inertial cavitation from acoustic radiation force impulse imaging and implications for the mechanical index. Ultrasound Med Biol. 2015;41:472–485. doi: 10.1016/j.ultrasmedbio.2014.09.012. [DOI] [PMC free article] [PubMed] [Google Scholar]
- de Moura Almeida A, Cotrim HP, Barbosa DBV, de Athayde LGM, Santos AS, Bitencourt AGaV, de Freitas LAR, Rios A, Alves E. Fatty liver disease in severe obese patients: diagnostic value of abdominal ultrasound. Technical Rep. 9, Faculdade de Medicina da Bahia, Universidade Federal da Bahia, Avenida Tancredo Neves. World J Gastroenterol. 2008;14:1415–1418. doi: 10.3748/wjg.14.1415. [DOI] [PMC free article] [PubMed] [Google Scholar]
- Desser TS, Jeffrey RB. Tissue harmonic imaging techniques: Physical principles and clinical applications. Seminars Ultrasound CT MR. 2001;22:1–10. doi: 10.1016/s0887-2171(01)90014-9. [DOI] [PubMed] [Google Scholar]
- Duck FA. Acoustic saturation and output regulation. Ultrasound Med Biol. 1999;25:1009–1018. doi: 10.1016/s0301-5629(99)00038-1. [DOI] [PubMed] [Google Scholar]
- International Electrotechnical Commission (IEC) IEC 62359: Ultrasonics—Field characterization—Test methods for the determination of thermal and mechanical indices related to medical diagnostic ultrasonic fields. 2nd. Geneva: Author; 2010. [Google Scholar]
- Jensen JA, Rasmussen MF, Pihl MJ, Holbek S, Villagomez Hoyos CA, Bradway DP, Stuart MB, Tomov BG. Safety assessment of advanced imaging sequences: I. Measurements. IEEE Trans Ultrason Ferroelectr Freq Control. 2016;63:110–119. doi: 10.1109/TUFFC.2015.2502987. [DOI] [PubMed] [Google Scholar]
- Joshi K, Mendler M, Gish R, Loomba R, Kuo A, Patton H, Kono Y. Hepatocellular carcinoma surveillance: A national survey of current practices in the USA. Dig Dis Sci. 2014;59:3073–3077. doi: 10.1007/s10620-014-3256-6. [DOI] [PubMed] [Google Scholar]
- Klysik M, Garg S, Pokharel S, Meier J, Patel N, Garg K. Challenges of imaging for cancer in patients with diabetes and obesity. Diabetes Technol Therapeutics. 2014;16:266–274. doi: 10.1089/dia.2014.0026. [DOI] [PubMed] [Google Scholar]
- Miesner MD. Abdominal ultrasound. In: Anderson DE, Jones M, Miesner MD, editors. Veterinary techniques for llamas and alpacas. New York: Wiley–Blackwell; 2013. pp. 161–165. [Google Scholar]
- Mishra P, Younossi ZM. Abdominal ultrasound for diagnosis of nonalcoholic fatty liver disease (NAFLD) Am J Gastroenterol. 2007;102:2716–2717. doi: 10.1111/j.1572-0241.2007.01520.x. [DOI] [PubMed] [Google Scholar]
- Nightingale KR, Church CC, Harris G, Wear KA, Bailey MR, Carson PL, Jiang H, Sandstorms KL, Szabo TL, Ziskin MC. Conditionally increased acoustic pressures in nonfetal diagnostic ultrasound examinations without contrast agents: A preliminary assessment. J Ultrasound Med. 2015;34:1–41. doi: 10.7863/ultra.34.7.15.13.0001. [DOI] [PMC free article] [PubMed] [Google Scholar]
- Pinton GF, Dahl JJ, Trahey GE. Rapid tracking of small displacements with ultrasound. IEEE Trans Ultrason Ferroelectr Freq Control. 2006;53:1103–1117. doi: 10.1109/tuffc.2006.1642509. [DOI] [PubMed] [Google Scholar]
- Pinton GF, Trahey GE, Dahl JJ. Sources of image degradation in fundamental and harmonic ultrasound imaging using nonlinear, full-wave simulations. IEEE Trans Ultrason Ferroelectr Freq Control. 2011;58:754–765. doi: 10.1109/TUFFC.2011.1868. [DOI] [PMC free article] [PubMed] [Google Scholar]
- Schuh S, Man C, Cheng A, Murphy A, Mohanta A, Moineddin R, Tomlinson G, Langer JC, Doria AS. Predictors of non-diagnostic ultrasound scanning in children with suspected appendicitis. J Pediatr. 2011;158:123–129. doi: 10.1016/j.jpeds.2010.07.035. [DOI] [PubMed] [Google Scholar]
- Singal AG, Nehra M, Adams-Huet B, Yopp AC, Tiro JA, Marrero JA, Lok AS, Lee WM. Detection of hepatocellular carcinoma at advanced stages among patients in the HALT-C trial: Where did surveillance fail? Am J Gastroenterol. 2013;108:425–432. doi: 10.1038/ajg.2012.449. [DOI] [PMC free article] [PubMed] [Google Scholar]
- Thomas JD, Rubin DN. Tissue harmonic imaging: Why does it work? J Am Soc Echocardiogr. 1998;11:803–808. doi: 10.1016/s0894-7317(98)70055-0. [DOI] [PubMed] [Google Scholar]
- Virmani J, Kumar V, Kalra N, Khandelwal N. Characterization of primary and secondary malignant liver lesions from B-mode ultrasound. J Digit Imaging. 2013;26:1358–1370. doi: 10.1007/s10278-013-9578-7. [DOI] [PMC free article] [PubMed] [Google Scholar]
- Wear KA, Gammell PM, Maruvada S, Liu Y, Harris GR. Improved measurement of acoustic output using complex deconvolution of hydrophone sensitivity. IEEE Trans Ultrason Ferroelectr Freq Control. 2014;61:62–75. doi: 10.1109/TUFFC.2014.6689776. [DOI] [PMC free article] [PubMed] [Google Scholar]
- Ziskin MC. Specification of acoustic output level and measurement uncertainty in ultrasonic exposimetry. IEEE Trans Ultrason Ferroelectr Freq Control. 2003;50:1023–1034. doi: 10.1109/tuffc.2003.1226546. [DOI] [PubMed] [Google Scholar]


