

Abstract
Spinocerebellar ataxia type 2 (SCA2) and type 3 (SCA3) are two common autosomal-dominant inherited ataxia syndromes, both of which are related to the unstable expansion of tri-nucleotide CAG repeats in the coding region of the related ATXN2 and ATXN3 genes, respectively. The poly-glutamine (poly-Q) tract encoded by the CAG repeats has long been recognized as an important factor in disease pathogenesis and progress. In this study, using the I-TASSER method for 3D structure prediction, we investigated the effect of poly-Q tract enlargement on the structure and folding of ataxin-2 and ataxin-3 proteins. Our results show good agreement with the known experimental structures of the Josephin and UIM domains providing credence to the simulation results presented here, which show that the enlargement of the poly-Q region not only affects the local structure of these regions but also affects the structures of functional domains as well as the whole protein. The changes observed in the predicted models of the UIM domains in ataxin-3 when the poly-Q track is enlarged provide new insights on possible pathogenic mechanisms.
Keywords: SCA2, SCA3, ATXN2, ATXN3, poly-glutamine diseases, protein 3D structure prediction
Introduction
Spinocerebellar ataxia type 2 (SCA2) and type 3 (SCA3) are common autosomal-dominant inherited ataxias which are related to unstable expansions of CAG repeats in the coding region of the ATXN2 gene (Pulst et al. 1996) and ATXN3 gene (Kawaguchi et al. 1994), respectively. The CAG sequence, which encodes glutamine, is translated into a consecutive polyglutmaine (poly-Q) tract in the related proteins. Apart from SCA2 and SCA3, eight other neurodegenerative diseases, including Huntington’s disease and called polyglutamine diseases, are also associated with CAG repeats (MacDonald 1993; Orr et al. 1993; Kawaguchi et al. 1994; Yazawa et al. 1995; David et al. 1997).
The expansion of the poly-Q region has long been recognized as an important factor in polyglutamine diseases progression and pathogenesis (Matilla-Dueñas et al. 2014), but apart from the poly-Q tract, the proteins responsible for these disorders share little homology in sequence and/or function (Margulis, Vigont, Lazarev, Kaznacheyeva & Guzhova 2013). Individuals with poly-Q repeat numbers above certain threshold would show disease symptoms in their life spans, with individuals presenting longer repeat tracks being associated with an earlier age onset of the disease (Tang et al. 2000). For example, individuals with 33 repeats tend to first experience signs of SCA2 symptoms in their late adulthood (Fernandez et al. 2000), whereas individuals with more than 45 repeats usually have the signs in their teens (Matilla-Dueñas, Corral-Juan, Volpini & Sanchez 2012). Up to now, the mechanisms of how the expansion of the poly-Q regions trigger pathogenesis are not well understood (Matilla-Dueñas et al. 2014).
The structures of poly-Q segments have long been an active research area. It has been reported that poly-Q tracts with glutamine repeat numbers above certain threshold could form ‘misfoled’ structures (Perutz 1999), which could lead to the aggregation of the poly-Q proteins or their segments causing protein dysfunction (DiFiglia et al. 1997). Based on the X-ray diagrams, Perutz and colleges provided the hypothesis that poly-Q segment could form water-filled nano-tubes, which has been influential among the proposed structural models for poly-Q aggregation. This model hypothesis, that single helix-turns with 20 glutamines are not stable, can partly explain the ‘repeat threshold’ for poly-Q diseases (Perutz, Finch, Berriman & Lesk 2002), but Sikorski and Atkins suggested an alternative model in which the poly-Q peptide formed a cross-beta structure within the amyloid fibrils (Sikorski & Atkins 2005). The cross-beta structure was confirmed by solid state-NMR on exactly the same D2Q15K2 peptides (Schneider et al. 2011) and both cross-beta and the characteristic steric zipper of the side chains in poly-Q amyloid fibers have been shown by simulations (Man, Roland & Sagui 2015). Other studies have shown that the structures of the poly-Q segments, which depend on the length of the repeat track, temperature and other experiment parameters (Vitalis, Wang & Pappu 2008; Deng, Wang & Ou-Yang 2012; Buchanan et al. 2014), can exist in α-helical configuration (Kim, Chelliah, Kim, Otwinowski & Bezprozvanny 2009), loop (Kim et al. 2009), β-hairpin (Kim 2013) and β-sheet (Miettinen, Knecht, Monticelli & Ignatova 2012; Buchanan et al. 2014).
Structural studies of poly-Q regions can shed light on the chemiphysical properties of poly-Q segments, which may be useful to understand poly-Q diseases, but most of these studies have been done on the isolated poly-Q tracts with no context of the poly-Q protein overall sequences or even the limited flanking regions (Thakur et al. 2009; Lakhani, Ding & Dokholyan 2010). Amino acid sequences flanking the poly-Q tract can influence the aggregation of the poly-Q region, a hypothesis that has been tested in several poly-Q proteins (Nozaki, Onodera, Takano & Tsuji 2001), such as ataxin-2, ataxin-3, huntingtin (protein responsible for Huntington’s disease), and dentatroubral-pallidoluysian atrophy protein (responsible for dentatorubral-pallidoluysian atrophy, DRPLA). These results show that it is critical to include flanking sequences when studying the structures of poly-Q regions and its changes upon enlargement. In the other hand, it should be considered that the enlargement of the poly-Q region might also affect the structure of the protein functional domains and even the entire protein (Tobelmann & Murphy 2011). For instance it has been shown that when inserting an additional poly-Q segment into the helix region of Myglobin, its structure shows increased proportions of β-structures (Tobelmann & Murphy 2011). Therefore, structural studies of the full-length poly-Q proteins could shed light on the pathogenic mechanisms of poly-Q diseases from molecular structural point of view.
Ataxin-2 and ataxin-3 proteins are two of the best characterized poly-Q proteins (Invernizzi, Lambrughi, Regonesi, Tortora & Papaleo 2013) and good candidates to perform studies on the effects of poly-Q segment enlargement on 3D protein structure. They are also quite different and this diversity may provide generalizable hypotheses to explain the pathogenicity of poly-Q enlargements. The poly-Q tract of ataxin-2 lies in the N-terminus of the protein, whereas for ataxin-3 the poly-Q tract lies in the C-terminus (Figure 1). The threshold of glutamine repeats to trigger disease varies between these two proteins, for SCA3 there is a large range between normal and abnormal number of repeats with full penetrance, while this range for SCA2 is non-existent (Magana, Velazquez-Perez & Cisneros 2013), as the normal number of repeats can be up to 31 and individuals with 32 or more repeats manifest the disease (Shao & Diamond 2007). These differences in the two systems studied here have the potential to provide some general observations on the effect of poly-Q enlargement on full 3D protein structure.
Figure 1.
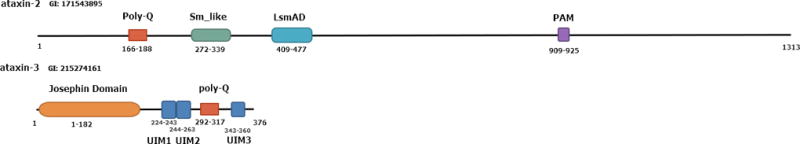
Protein architectures of ataxin-2 and ataxin-3. The poly-Q region and functional domains are illustrated as squares. Location of functional domains are listed as residue index in the reference sequences, NCBI GI: 171543895 and NCBI GI: 215274161, respectively.
Ataxin-2 and ataxin-3 are large proteins with extensive disordered regions, which makes it difficult to get high-resolution experimental structures of the whole proteins (Nicastro et al. 2005; Wang & Voth 2010). The experimental information available for the 3D structure of ataxin-2 is limited to the PAM2 domain in a complex with poly-A (Kozlov, Safaee, Rosenauer & Gehring 2010). The known 3D structures of active domains in ataxin-3 are the structures of the isolated Josephin domain in the N-terminus of ataxin-3 (Mao et al. 2005; Nicastro et al. 2005; Satoh et al. 2014) and those of the Ubiquitin Interacting Motif (UIM) domains located between the Josephin domain and the poly-Q segment (Song et al. 2010). Computational studies have also been limited to small segments of ataxin-2 and ataxin-3 (Albrecht, Golatta, Wullner & Lengauer 2004; Invernizzi et al. 2013).
In this paper we used these experimental references as guideposts to check the reliability of 3D structure prediction methods, which have also been validated by our previous study showing that protein 3D structure prediction programs, like I-TASSER (Roy, Kucukural & Zhang 2010), can successfully predict 3D structures of poly-Q proteins (Wen, Scoles & Facelli 2014). We also demonstrated that 3D protein structure prediction is a reasonable approach to study the effect of poly-Q expansion on the structure of full-length poly-Q proteins like ataxin-2 and ataxin-3.
Using the I-TASSER approach in this paper we report a systematic analysis of how poly-Q expansion affects the 3D predicted structures of ataxin-2 and ataxin-3. Our results show that the expansion of the poly-Q tracts affect not only the local structures but also the global structure of the whole ataxin-2 and ataxin-3 proteins.
Methods
Reference sequences and functional domains
Both ataxin-2 and ataxin-3 have different natural variances and splice variants. The reference sequences used in this study are the longest transcription existing in the available references (Albrecht et al. 2004). The reference sequence of ataxin-2 (NCBI GI: 171543895) corresponds to a large protein with 1313 residues. The poly-Q tract is located in the N-terminus (Figure 1). Sequence annotations for ataxin-2 indicates that ataxin-2 have three functional domain/motif(s): the Sm_like motif and LsmAD domain that are located in the N-terminus, and the PAM2 domain that is located in the C-terminus. Ataxin-3 (Figure 1) is a smaller protein with 376 residues (NCBI GI: 215274161). The poly-Q tract lies in the C-terminus with a Lysine (K) in between the third and fourth glutamine. In this study the Lysine is accounted as part of the poly-Q tract (Kawaguchi et al. 1994), so the poly-Q tract starts at residue 292 in the reference sequence. The Josephin domain, one of the important functional domains in ataxin-3, is located in the N-terminus, which corresponds to the first 182 residues in the reference sequence (Figure 1). The longest transcription of ataxin-3 has three UIM domains. Two of them, UIM1 and UIM2, lie between Josephin domain and poly-Q tract, and the third one, UIM3, lies in the C-terminal after the poly-Q tract (Figure 1). UIM1 expands between residues 224 to 243 (sequence: EDEEDLQRALALSRQEIDME), UIM2 between residues 244 to 263 (sequence: DEEADLRRAIQLSMQGSSRN), and UIM3 between residues 343 to 360 (sequence: GKACSPFIMFATFTLYLT). There are four records in the PDB database for the structure of the Josephin domain, 1YZB, 2AGA, 2DOS, and 2JRI. The structures are all from NMR experiments, PDB records 1YZB, 2AGA, and 2DOS are the native structures of the Josephin domain while 2JRI corresponds to the complexed structure of the Josephin domain with ubiquitin. The NMR structures of the ataxin-3 UIM1 and UIM2 domains complexed with ubiquitin correspond to the PDB ID: 2KLZ.
In order to study the structural changes as function of the length of poly-Q tract, different numbers of glutamines were added to or subtracted from the end of poly-Q tract of the reference sequences to construct ataxin-2 and ataxin-3 sequences with different number of glutamine repeats. Sequences with a given number of repeats are named X-nQ, where X is either ataxin-2 or ataxin-3 and n is the number of repeats. For ataxin-2, sequences with repeats of 14Q, 22Q, and 31Q are normal, whereas repeats of 32Q, 37Q and 79Q are pathological. Repeats of length 14Q for ATXN2 are exceedingly rare but have been observed in the normal population (Figueroa et al. 2009). ATXN2 with 31 repeats is considered moderately expanded, and moderate expansions in the ATXN2 gene are associated with increased risk of ALS (Elden et al. 2010). For ataxin-3, structures with 27Q and 36Q are normal, whereas structures with 64Q and 75Q are pathological, and those with 48Q and 56Q were considered intermediate.
3D structure prediction
The I-TASSER suite was used for 3D structure prediction. Because I-TASSER is a template-based prediction program, structures in the PDB database related to ataxin-2 and ataxin-3 were excluded from the template database to reduce prediction biases. The excluded structures included four PDB records of the ataxin-3 Josephin domain (PDB: 1YZB, PDB: 2AGA, PDB: 2DOS, and PDB: 2JRI), one PDB record of Josephin domain in ataxin-3-like protein (PDB: 3O65) and one record of the UIM domain (PDB: 2KLZ) of ataxin-3. The only PDB record related to ataxin-2, a crystal structure of the PAM2 domain in a complex with the Mlle domain of Poly-A binding protein (PDB: 3KTR), was not in the I-TASSER template database. The I-TASSER code was modified to make it capable to generate random seeds under user control, making it possible to generate a large ensemble of representative structures (Wen et al. 2014). For each sequence with a given number of repeats, I-TASSER structure predictions were obtained for ten different random seeds for ataxin-3, but considering the much higher computational cost, only five runs were done for each sequence with a given number of repeats of ataxin-2. The best five 3D models of each run were retained, leading to a total ensemble of 50 structural models for each sequence with a given number of repeats of ataxin-3 and 25 structural models for each sequence with a given number of repeats of ataxin-2.
Secondary structure
Secondary structures of each predicted model were calculated using the Dictionary of Protein Secondary Structure (DSSP) program (Kabsch & Sander 1983). Secondary structures calculated by the DSSP program are classified in an 8-state secondary structure description, including α-helix (H), β-bridge (B), strand (E), 3-helix (G), 5-helix (I), turn (T), bend (S), and coil (C). The 8-state secondary structure elements were mapped to a 3-state secondary structure description using the following rules: 1) H, G and I were mapped to helix (H); E and B were mapped to strand (E); S, T, and C were mapped to coil (C). For better visualization of the secondary structure patterns, WebLogo 3.0 (Crooks, Hon, Chandonia & Brenner 2004) was used to plot secondary structure logos for models/structures with the same sequence. In these plots the overall height of the stack indicates the degree of conservation of the secondary structure at that position, and the height of the symbols within the stack indicates the relative frequency of each secondary structure type at that position.
3D structure visualization
The 3D structures and the 3D structure superpositions were visualized using the UCSF Chimera software, which is free program for visualization of biomolecules (Pettersen et al. 2004).
3D structure comparison
TM-align (Zhang & Skolnick 2005), a 3D structure comparison software, was used for 3D structure alignment, and TM-scores were calculated to compare the structure similarity (Zhang & Skolnick 2004). A TM-score between the two compared structures greater than 0.5 was used to infer that the two structures belong to the same structure folding class (Zhang & Skolnick 2004).
Statistical analysis
All the results presented here refer to the averages over the structural ensembles described above. This is very important because such ensemble calculations should be considered much more representative of the structures of these proteins, which are known for their configurational heterogeneity, than the results of a single 3D structure prediction calculation. To assess significance, the Student’s t test was applied to data with normal distributions. The significant level was set at 0.05. All the statistical work was done using the R environment, which is a free software environment for statistical computing and graphics (R Development Core Team 2011).
Results
Structures of ataxin-2
Ataxin-2 models exhibit a mix of β-structures (~15%) and coils (~75%), with only a very small proportion of helical structures (Figure 2). However, the models of ataxin-2-79Q show a significant increase of helical structures and decrease of coil structures which is statistically significant (p < 0.05). It is also noteworthy that the model structures for ataxin-2-79Q show a much larger diversity, as indicated by the larger standard deviation in their secondary structure. Most of the models predicted for ataxin-2 did not fold into globular structures, a trend that was observed for all sequences studied here regardless of the number of poly-Q repeats. This is consistent with the hypothesis that proteins with sequences of low complexity are associated with intrinsically unstructured proteins (Tompa 2002).
Figure 2.
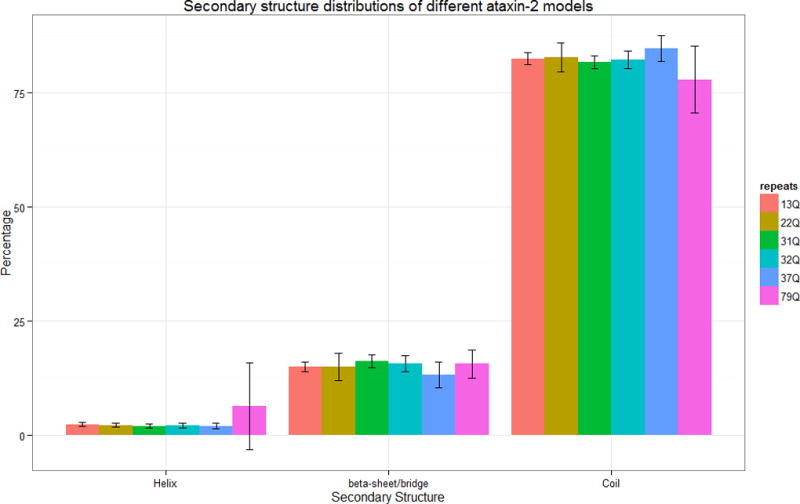
Secondary structure distributions of ataxin-2 models. The error bars indicate the standard deviations of the percentage value observed in the overall ensemble of structures studied here.
Structures of poly-Q and flanking regions in ataxin-2
The secondary structure distributions of the poly-Q region in ataxin-2 for models with different number of poly-Q repeats are depicted in Figure 3. The poly-Q regions show a similar secondary structure pattern than the entire protein, but it is observed a small decrease in the proportion of helical structures. In general, it appears that there is a greater diversity of secondary structures (larger standard deviations) in the poly-Q region than in the entire protein. Poly-Q regions in ataxin-2-31Q and ataxin-2-32Q do not have any helical structures but a slight increase of helical structures is observed in the structures corresponding to proteins with larger number of poly-Q repeats (Figure 3).
Figure 3.
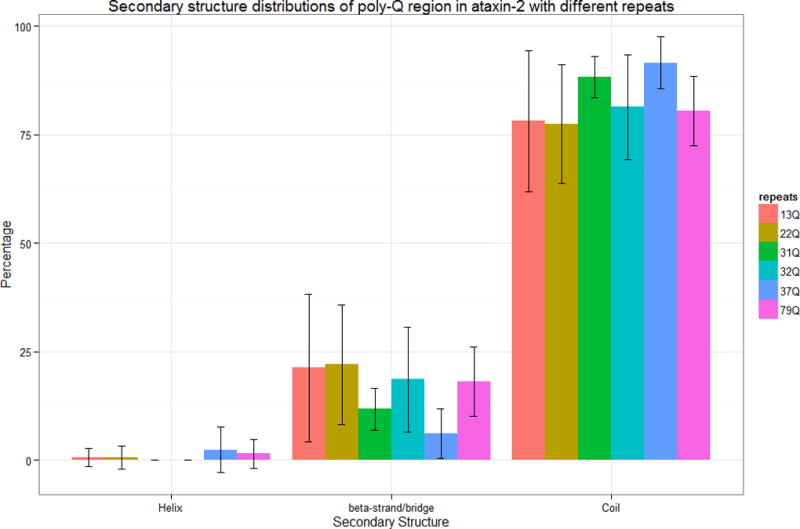
Secondary structure distributions of poly-Q region in ataxin-2 models. The error bars indicate the standard deviations of the percentage value observed in the overall ensemble of structures studied here.
All the models studied here show β-hairpins within the poly-Q regions except ataxin-2-13Q. Some of the β-structures in the proximity of the poly-Q region formed β-sheet conformations either inside or including outside residues of the poly-Q region. β-sheet conformations completely inside of the poly-Q regions were observed only for models corresponding to pathological number of repeats, ataxin-2-32Q and ataxin-2-79Q.
The secondary structure of 25 residues before and after the poly-Q regions were extracted from the full-length models for further analysis. The secondary structure logo analysis is depicted in Figure 4. Compared with the full-length models, the flanking regions tend to show less helical structures (with statistical significance, p smaller than 0.01 in all cases) in ataxin-2-13Q, ataxin-2-22Q, ataxin-2-31Q and ataxin-3-32Q and marginal significance in ataxin-2-37Q and ataxin-2-79Q (p = 0.073 and p = 0.078, respectively). The flanking regions tend also to show less β-structures for all poly-Q track lengths considered here. While the secondary structure logo from Figure 4 does not provide any clean cut difference between the structures corresponding to normal and pathological number of repeats, it is apparent that there is marked increase of the diversity of structures in the ensembles as the number of poly-Q repeats increases.
Figure 4.
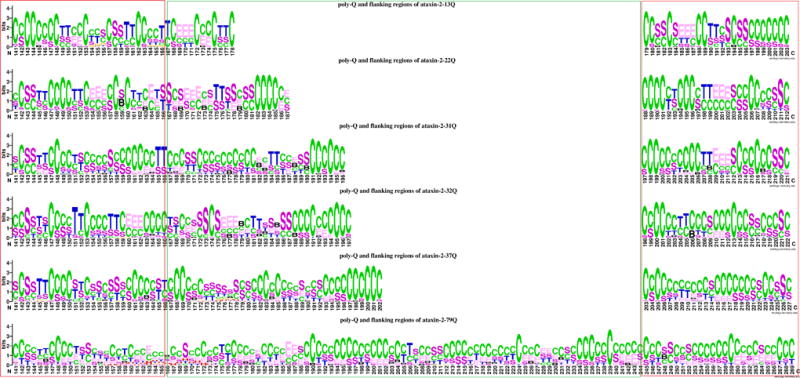
Secondary structure logo of poly-Q tract and 25-residue flanking regions of ataxin-2 with different number of poly-Q repeats. H = alpha helix; B = residue in isolated beta-bridge; E = extended strand, participates in beta ladder; G = 3-helix (3/10 helix); I = 5 helix (pi helix); T = hydrogen bonded turn; S = bend; C = coil.
Structures of functional domains of ataxin-2
The effect of the enlargement of the poly-Q segment on the structures of the known functional domains, Sm_like, LsmAD and PAM2, of ataxin-2 were also studied. From Figure 5, it is apparent that the secondary structure of these domains show some common patterns, but substantial changes can be observed as the length of the poly-Q repeat segment changes.
Figure 5.
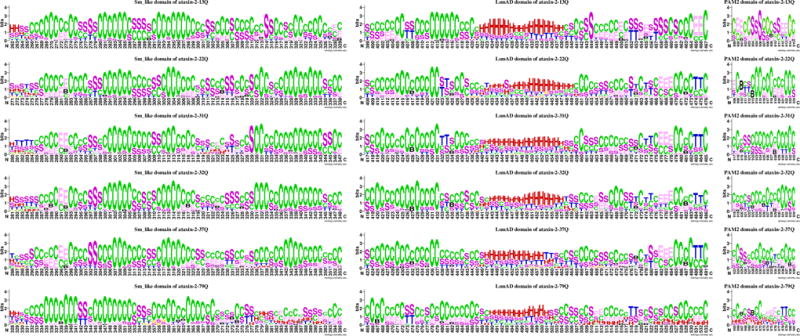
Secondary structure logo depiction of the active domain of ataxin-2, Sm_like, LsmAD, and PAM2, for models with different poly-Q segment lengths. H = alpha helix; B = residue in isolated beta-bridge; E = extended strand, participates in beta ladder; G = 3-helix (3/10 helix); I = 5 helix (pi helix); T = hydrogen bonded turn; S = bend; C = coil.
Sm_like domain
The models predicted for the Sm_like domain are dominated by loops with a few strands (Figure 5). Compared with the secondary structure proportions of the full-length ataxin-2, the Sm_like domain tends to have less β-structures and more loops. Very few helical structures appear in the Sm_like domain and the helix structures are concentrated in the N-terminus of the Sm_like domain, a trend that is the same among all the models with different number of repeats. The Sm_like domain in the ataxin-2-79Q models has more helical structures, in average, than the models corresponding to structures with less number of repeats. The Sm_like domain in ataxin-2-31Q has the largest proportion of helical structures for models with a normal number of repeats, but the structure patterns of Sm_like domain in ataxin-2-31Q and ataxin-2-79Q were different (Figure 5). Several models of ataxin-2-31Q have a small helical region near middle of the Sm_like domain, whereas for ataxin-79Q, several models show long a helical region in the C-terminus. The ataxin-2-37Q results also show some models for which helical structures in the C-terminus of Sm_like domain are present.
LsmAD domain
For all the models considered here the LsmAD domain of ataxin-2 is dominated by loops independent of the length of the poly-Q segment, but compared with the full-length protein the LsmAD domain has more helix structures, with an average of 13.92% among all models considered here. The helical structures are predominately in the middle of the LsmAD domain and the relative frequency of helical structures in the middle of the LsmAD domain decreases as the number of repeats increases. Helical regions are more conserved in ataxin-2-13Q and ataxin-2-22Q than those in ataxin-2-37Q and ataxin-2-79Q. The LsmAD domain of several ataxin-2-79Q models has helical regions in the C-terminus of the domain, the pattern of which is not shown in models with other number of repeats.
PAM2 domain
The PAM2 domain lies in the C-terminal of ataxin-2 protein, and it is farther from the poly-Q region than any of the other two functional domains in the protein. Almost all of the PAM2 domains in the predicted models present only structures of β-strands and helices, except for five ataxin-2-79Q models in which the PAM2 domain is dominated by helical structures. For the PAM2 domain models the proportion of β-strand/bridge decreases significantly as the number of repeats increases, whereas the proportion of loops increases. The differences in the proportion of loops between ataxin-2-13Q and ataxin-2-22Q models is marginally significant (p=0.09), but the ataxin-2-31Q models have significantly more coils than those of ataxin-2-13Q and ataxin-2-22Q. The proportion of loops in the models corresponding to pathological lengths of the poly-Q track decreased as the number of repeat increased. Although the proportion of β-strand/bridge and coils among ataxin-2-22Q, ataxin-2-32Q and ataxin-2-37Q are similar, the structural patterns among them are different. Most positions in the PAM2 domain of the ataxin-2-32Q and ataxin-2-37Q models can form β-bridges whereas only three positions in ataxin-2-22Q formed a β-bridge (Figure 5).
Overall structures of ataxin-3
The structures of the ataxin-3 models are more compact than those of ataxin-2 (Figure 6). The ataxin-3 models are dominated by helices and coils and only a small proportion of the residues form β-structures (Figure 7). There were some significant differences among the models with normal number of repeats (ataxin-3-27Q and ataxin-3-36Q) and those with pathological number of repeats (ataxin-3-64Q and ataxin-3-75Q). In average, models with a pathological number of repeats have more helical conformations and less β-structures and coils than the models corresponding to a normal number of repeats. Moreover, the diversity of the model structures increase with increasing the number of repeats as measured by the increase in the standard deviation (Figure 7). All these differences are statistically significant.
Figure 6.
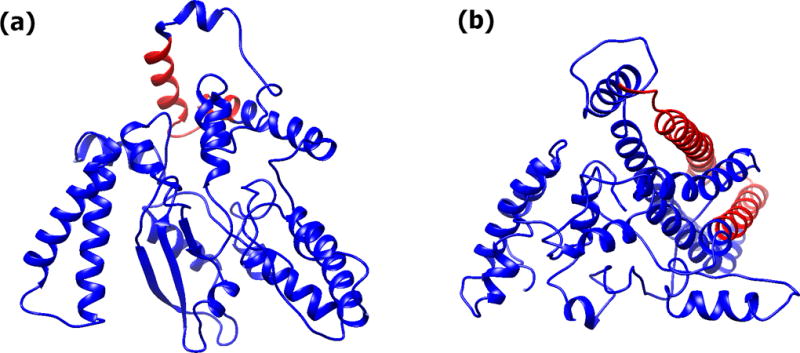
Exemplar structures of ataixn-3. (a) ataxin-3-27Q, and (b) ataixn-3-75Q. The Poly-Q region is depicted in red.
Figure 7.
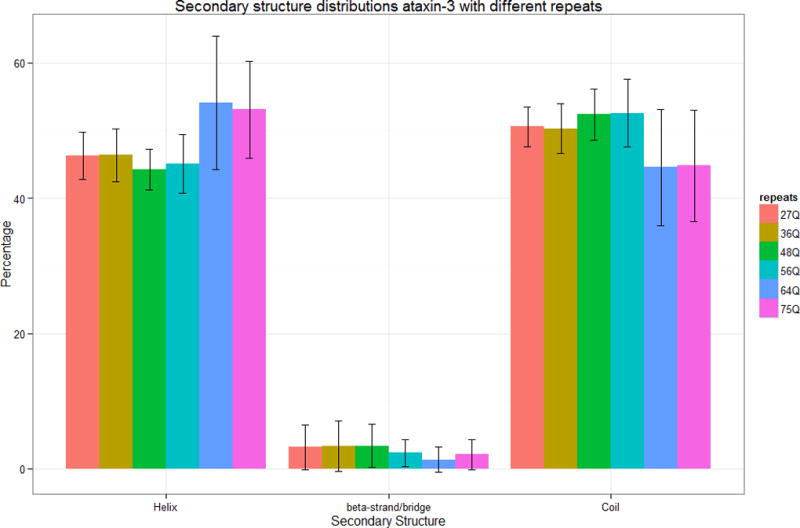
Secondary structure distributions of ataxin-3 models. The error bars indicate the standard deviations of the percentage value observed in the overall ensemble of structures studied here.
Structures of poly-Q and flanking regions in ataxin-3
The poly-Q regions of the ataxin-3 models studied here have similar features independent of the number of repeats (Figure 8). All ataxin-3 poly-Q regions are dominated by helices in a proportion much higher than for the full-length models (p < 0.05). There are very few residues forming β-structures and their numbers are in average much lower than for the full-length models. The poly-Q flanking regions of ataxin-3 are also dominated by helices, but the flanking regions with a pathological number of repeats have more helices than those with normal repeats in average (p < 0.05). When compared with the full-length models, the flanking regions of the ataxin-3-27Q, ataxin-3-36Q, ataxin-3-48Q, and ataxin-3-56Q models have less helices, less β-structure, and more loops whereas flanking regions of the models of ataxin-3-64Q and ataxin-3-75Q have different patterns. Ataxin-3-64Q have more helix, less β-structure and less loops and ataxin-3-75Q have less helix, more β-structure and less loops.
Figure 8.
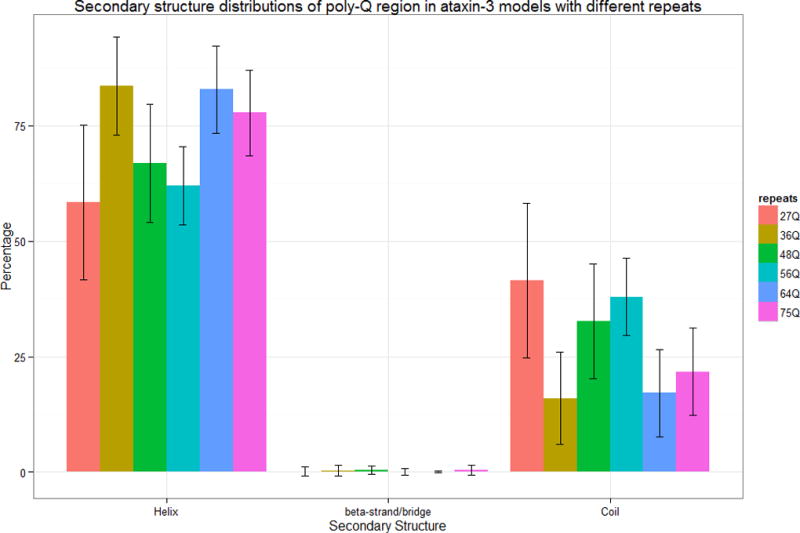
Secondary structure distributions of poly-Q region of ataxin-3 models. The error bars indicate the standard deviations of the percentage value observed in the overall ensemble of structures studied here.
Comparison of the experimental and predicted structures of the isolated Josephin domain
The secondary structure patterns of the different PDB structures of this domain are highly conserved (Figure 9 (a), (b), (c) and (f)) with seven helical regions and six β-structure regions, but also in some regions some noticeable secondary structure diversity is observed among different PDB structures. Comparison of these 3D structures, show that the PDB structures are very similar with TM-scores ranging from 0.9895 to 0.6155, for every possible pairwise comparison. The structure of the Josephin domain is noticeable changed when complexed with ubiquitin (Figure 9 (f)), with the 2JRI complexed structure showing more hydrogen bonded turns (T) than the native models. Changes can also be observed in the first and second helical regions, as some hydrogen bonded turns (T) shown in these two regions whereas in the native structure these residues are conserved as helix.
Figure 9.
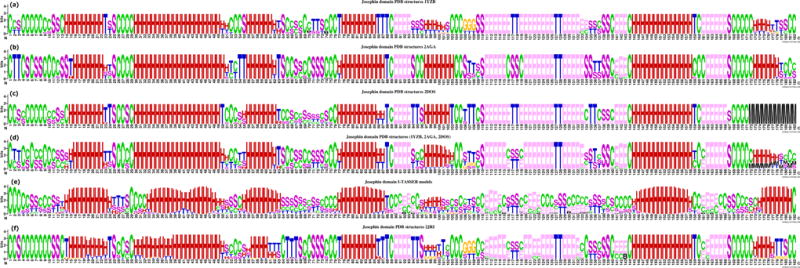
Secondary structure elements patterns of different Josephin domain models. (a) PDB structures: 1YZB; (b) PDB structures: 2AGA; (c) PDB structures: 2DOS; (d) PDB structures of 1YZB, 2AGA, and 2DOS; (e) I-TASSER models; (f) PDB structures: 2RJI. H = alpha helix; B = residue in isolated beta-bridge; E = extended strand, participates in beta ladder; G = 3-helix (3/10 helix); I = 5 helix (pi helix); T = hydrogen bonded turn; S = bend; C = coil; M = missing values.
The structure of the isolated Josephin domain, the first 182 residues in ataxin-3, was predicted by I-TASSER using the procedures discussed above. The secondary structure of the I-TASSER models show good agreement with the secondary structure patterns of the PDB structures (Figure 9 (e)), showing also the seven helical regions and some of the β-structure regions observed in the experimental structures. The I-TASSER models also reproduce well the experimental 3D structure of the Josephin domain, of the 3,000 superimposed structure pairs between experimental and predicted structures, the TM-scores of 2,757 of these pairs are greater than 0.5, with the highest TM-score being 0.638 (Figure 10). Only 35 pairs have TM-score smaller than 0.3, and this corresponds to only one of the I-TASSER models. This provides a strong justification for using the proposed simulation method, I-TASSER, to study the structure of poly-Q proteins.
Figure 10.
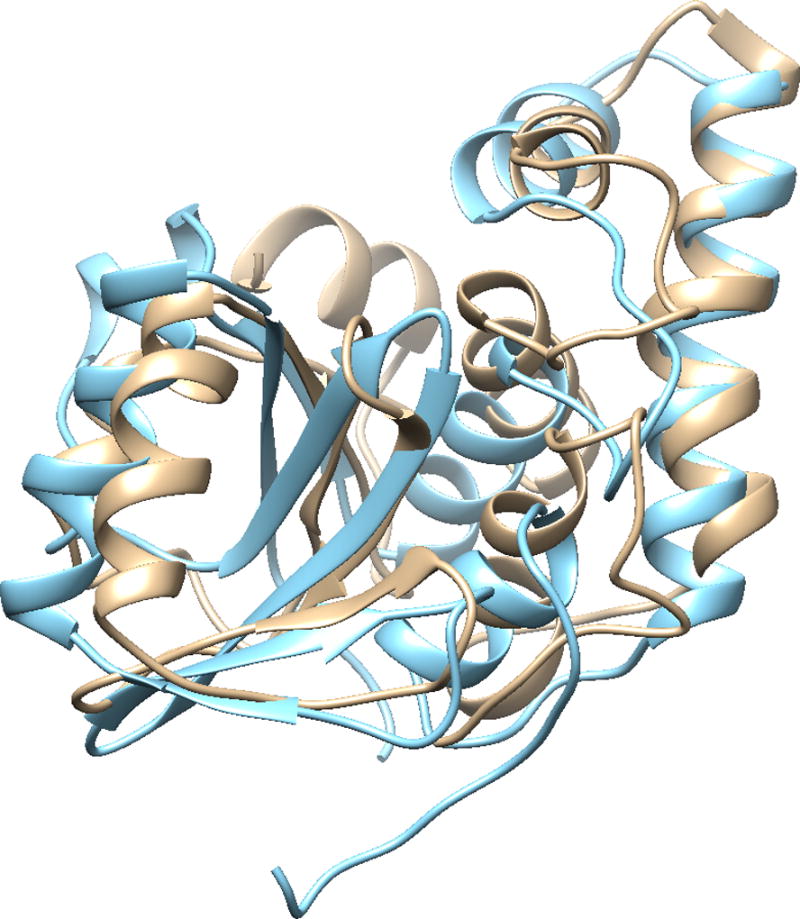
Structure superimposition of the best I-TASSER – PDB structure comparison of isolated Josephin domain with the highest TM-score. Tan: I-TASSER mode, sky blue: PDB: 2DOS model 2. Structure alignment and visualization are from UCFS Chimera.
Josephin domain in ataxin-3 with different poly-Q repeats
The secondary structure of ataxin-3 Jospehin domain, embedded in the full protein structure and predicted by the I-TASSER models for different number of poly-Q repeats are compared in Figure 11. While these structures show similarities to the predicted isolated structure of the domain (Fig 9 (e)) it is apparent that inclusion of the domain in the overall protein produces observable changes and therefore different distribution of secondary structures can be expected between an isolated and embedded functional domain. The predicted structures present conserved regions, with seven helix regions which is the same as in the isolated Josephin domain PDB native isolated structures and the corresponding predicted models. The locations of each of the helical regions are almost the same as in the PDB structures among all the ataxin-3 models with different number of repeats, but the length of the helical regions are different than in the PDB structures and the models of the isolated domain. The extended strand structures (E) are less prominent in the ataxin-3 Josephin I-TASSER models than those of PDB structures and ataxin-3-75Q and ataxin-3-64Q models have much less extended strands than the structures with less number of repeats. It is also observed that the N-terminal region is much less conserved, with less coil structures and less β-strands in the structures corresponding to a pathological number of repeats.
Figure 11.
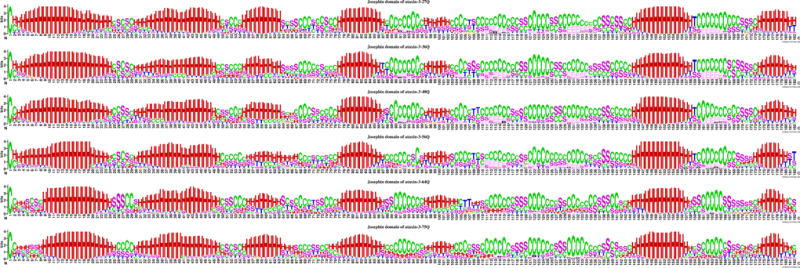
Secondary structure patterns of ataxin-3 Josephin I-TASSER models. From the top to the bottom, they are Josephin domain from ataxin-3 with 27Q, Josephin domain from ataxin-3 with 36Q, Josephin domain from ataxin-3 with 48Q, Josephin domain from ataxin-3 with 56Q, Josephin domain from ataxin-3 with 64Q, and Josephin domain from ataxin-3 with 75Q. H = alpha helix; B = residue in isolated beta-bridge; E = extended strand, participates in beta ladder; G = 3-helix (3/10 helix); I = 5 helix (pi helix); T = hydrogen bonded turn; S = bend; C = coil; M = missing values.
UIM domains in ataxin-3 with different poly-Q repeats
The secondary structure of the UIM1, UIM2 and UIM3, I-TASSER models with different number of repeats are depicted in Figure 12. Both UIM1 and UIM2 domains are dominated by α-helix structures, and these two UIM domains tend to form tandem helical structures, with two helical regions connected by a flexible region with loops and bends in most of the models (Figure 13 (a)–(f)), which is consistent with the solution structures in the work of Song and coworkers (Song et al. 2010) (Figure 13 (g)). The linking region makes the helix-coil-helix flexible conformation with the two helix regions forming diverse angles. The agreement between the experimental and predicted structures is depicted in Figure 14.
Figure 12.
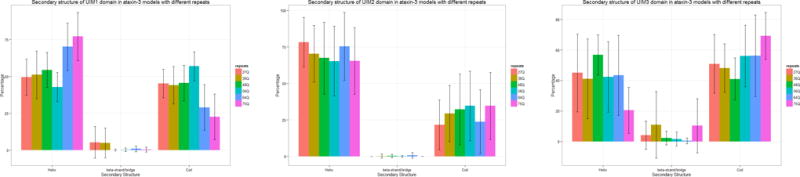
Secondary structure percentage of UIM domains. (a) UIM1, (b) UIM2, and (c) UIM3 for different poly-Q lengths. The error bars indicate the standard deviations of the percentage value observed in the overall ensemble of structures studied here.
Figure 13.
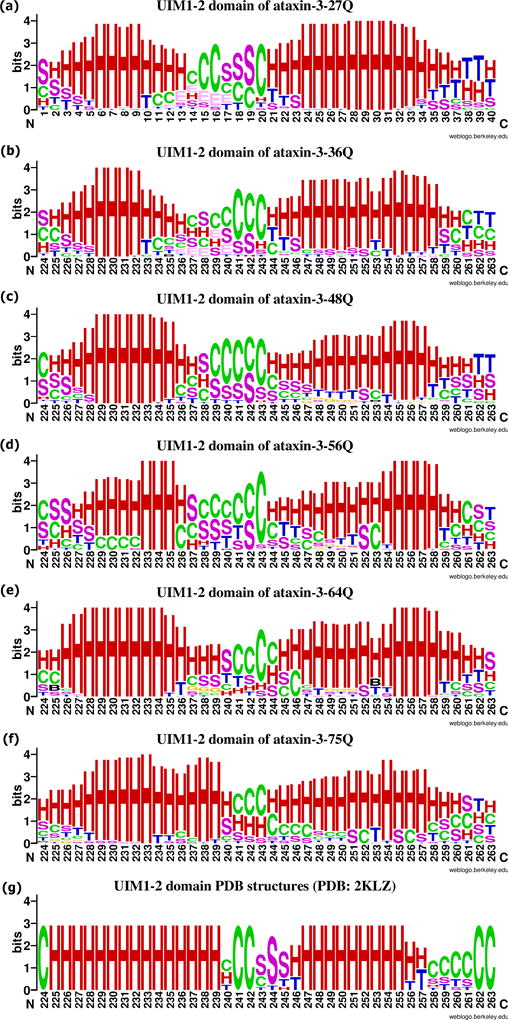
Secondary structures of the UIM1-2 domains from ataxin-3 with different poly-Q repeat and the PDB: 2KLZ records. (a) UIM1-2 domain from ataxin-3-27Q; (b) UIM1-2 domain from ataxin-3-36Q; (c) UIM1-2 domain from ataxin-3-48Q; (d) UIM1-2 domain from ataxin-3-56Q; (e) UIM1-2 domain from ataxin-3-64Q; (f) UIM1-2 domain from ataxin-3-75Q; (g) UIM1-2 domain from the PDB: 2KLZ records. H = alpha helix; B = residue in isolated beta-bridge; E = extended strand, participates in beta ladder; G = 3-helix (3/10 helix); I = 5 helix (pi helix); T = hydrogen bonded turn; S = bend; C = coil.
Figure 14.
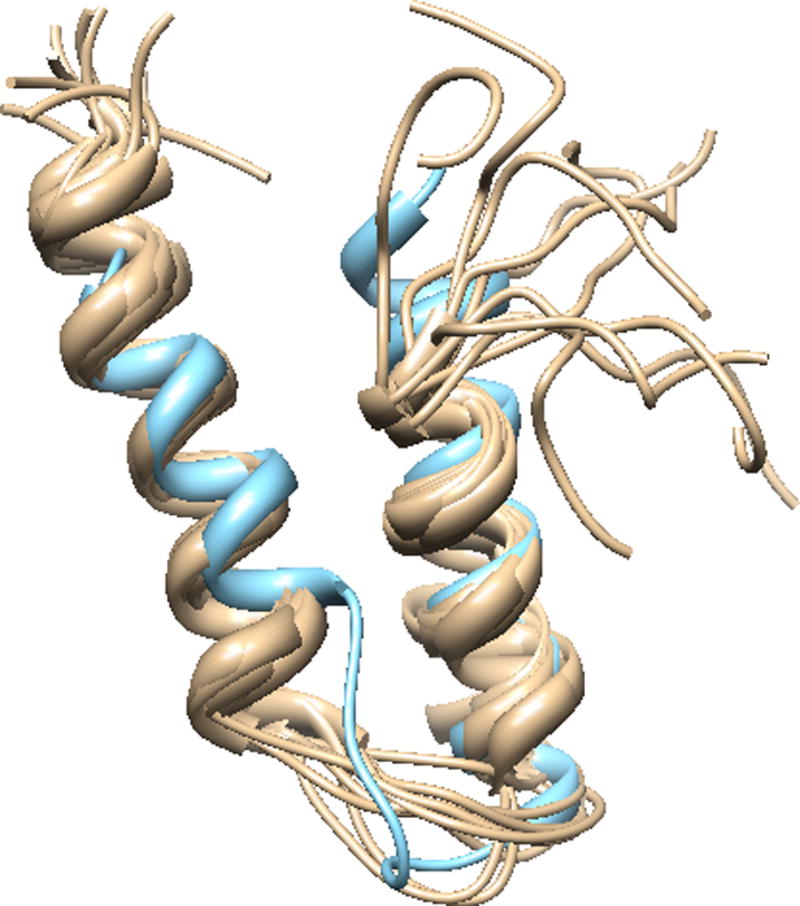
Structure comparison of rigid helix-coil-helix UIM1-2 predicted structures with PDB ID: 2KLZ. Tan: PDB record, PDB ID: 2KLZ, ensemble of UIM domain complexed with Ubiquitin the. C-terminal of this record is capped with poly-Q which shows random coil here. Sky blue: the best matched predicted model from ataxin3-27Q.
The UIM1 models with pathological repeats have more helix and less loops than those with normal repeats (Figure 12 (a)). For the UIM2 domain, the secondary structure distribution of all models is similar (Figure 12(b)) and does not follow recognizable trend with the enlargement of the poly-Q segment.
The flexible connection region linking the UIM1-2 domains get shorter as the number of repeats reaches the pathological range. For residue 240 to residue 243, few helices are observed for models with repeat numbers of 27Q (Figure 13 (a)), 36Q (Figure 13 (b)) and even for the intermediate values of 48Q (Figure 13 (c)) and 56Q (Figure 13 (d)). However, for models with a number of repeats in the pathological range, these four residues show the ability to form helical structures with their neighbor residues, and make the two UIM1-2 domains to form one long helical structure (Figure 13 (e), (f)).
Secondary structures of UIM3 domains are more flexible with half of the residues forming loop structures in almost all models independently of the number of repeats (Figure 12 (c)). Models with 75Q have the highest percentage of loops with the lowest percentage of helical structures in the regions than models with other repeats. Although they show similar proportions of each secondary structure types, the patterns of secondary structures can be different among the UIM3 domains in ataxin-3 with different number of poly-Q repeats. For example, the UIM3 domain form a helical structure in the middle of the domain except for ataxin-3-75Q, and the helical regions in some ataxin-3-64Q models are shorter than in the models corresponding to a normal and intermediate number of repeats. Only the UIM3 domains in ataxin-3-64Q and ataxin-3-75Q can form helical structures in the N-terminus with the flanking regions.
Although the proportion of β-structures in UIM3 of ataxin-3-36Q and ataxin-3-75Q are similar, the whole structures in which the β-structures are embedded are different (Figure 15). For ataxin-3-36Q, the structures are compact (Figure 15(a)–(c)), whereas for ataxin-3-75Q the structures form into helical bundle structures (Figure 15 (d) and (e)) which are not found in normal and intermediate repeats.
Figure 15.

Full-length protein structure of ataxin3-36Q and ataxin-3-75Q. (a) ataxin-3-36Q UIM3 with β-sheet in the N-terminal. (b): ataxin3-36Q UIM3 with β-sheet in the C-terminal. (c): ataxin-3-36Q UIM3 domain with loop. (d) and (f): 3-75Q models with UIM3 form into hairpin. Orange: Josephin domain; Green: poly-Q; Red: UIM12 domain; Blue: UIM3 domain.
Discussion
Our results show that both ataxin-2 and ataxin-3 have the ability to fold into diverse 3D structures, but they have very different structural properties and fold into different 3D structures. Ataxin-2 is a large proteins with low sequence complexity and our results are consistent with previous observations that indicate that structures of low sequence complexity tend to be unstructured (Tompa 2002). Most of ataxin-2 models are non-globular, with the only exception being the helical structures of ataxin-2-79Q. Ataxin-3 forms helical structures that dominate the globular structures found here for the any of the lengths of the poly-Q tracts. The models with longer repeats (ataxin-3-64Q and ataxin-3-75Q) tend to have more helical structures in the whole structures than those with a normal number of repeats (ataxin-3-27Q and ataxin-3-36Q). This is also true for ataxin-2 models with the largest number of repeats, ataxin-2-79Q, for which we also found a higher number of helical structures. We can conclude that this tendency is not dependent on the location of the poly-Q segment, because for ataxin-2 the poly-Q is located in the N-terminus whereas it is in the C-terminal ataxin-3. Our results are also consistent with the experimental results (Tobelmann & Murphy 2011) that show that inserting a poly-Q tract into the N-terminal of myglobin increases the number of helix in the experimental structures of myglobin. It is also apparent that the folding of the poly-Q regions of ataxin-2 and ataxin-3 are quite different. In the first, these regions are dominated by coils, where in ataxin-3 are dominated by helical structures. These results provide evidence that the folding of the poly-Q track is highly dependent of the protein context, which may indicate that structural studies of isolated poly-Q segments may not be informative on its properties when incorporated into a larger protein structure. For both ataxin-2 and ataxin-3 the length of the poly-Q regions not only affects the structures of this region and corresponding flanking regions, but also affects significantly the structures of protein regions far away from the poly-Q tract. There are also substantial conformation changes observed in the functional domains of the proteins studied here, when the length of the poly-Q track changes.
The results presented here show that the predicted structures agree well with the limited structural information available for ataxin-3, supporting the use of protein structure prediction methods to study molecular mechanisms of poly-Q diseases. Moreover, as discussed above the enlargement of the poly-Q segment produces both local and remote structural changes in ataxin-3. In particular, significant changes are observed for all the active domains of ataxin-3, the Josephin and UIM1,2 domains, but because the functional mechanisms of the UIM1,2 are better established it is possible for us to relate our computational findings to possible mechanistic changes in the function of the UIM1,2 domains that could lead to pathogenesis.
The ubiquitin binding properties of ataxin-3 are associated with its normal function into the protein surveillance pathway (Gomez-Sicilia, Sikora, Cieplak & Carrion-Vazquez 2015; Sun et al. 2015). The solution structures of isolated ataxin-3 UIM1 and UIM2 show that they are dominated by helical structures with the two UIM domains linked by unstructured linker regions (Song et al. 2010). Our predicted structures show a similar secondary structure pattern for the ataxin-3 wild type. Different from other ubiquitin binding domains, the ataxin-3 UIM tandem have very short linkers between the UIM1 and UIM2 domains and the two UIM domains cooperate in the ubiquitin binding (Song et al. 2010), for which the flexible linker regions play an essential role. However, predicted structures with a pathological number of repeats, ataxin-3-64Q and ataxin-3-75Q, show that this unstructured flexible region is changed to a more structured helix, making in practice the UIM1–2 domains an extended helical structure. This structural change could affect the normal ubiquitin binding function by losing the essential secondary structure features needed for effective binding. It has been proposed that ataxin-3 is cleaved by proteolytic enzymes, in particular by caspases and calpain, and several cleavage sites have been discovered both in vitro and in vivo (Berke, Schmied, Brunt, Ellerby & Paulson 2004; Darnell, Orgel, Pahl & Meredith 2007; Simoes et al. 2012; Hubener et al. 2013; Kim 2014). Some of these possible cleavage positions lie within the UIM domains, residues 241, 244 (Berke et al. 2004), and 260 (Hubener et al. 2013). Our prediction results show a great deal of structural change in the region between residue 240 and residue 243, in which most of the structures in the proteins with normal (27Q and 36Q) and intermediate (48Q and 56Q) number of repeats show coils and bends, flexible structures that provide a convenient space for the incision of a caspase to cut the proteins. However, structures with longer poly-Q segments have a tendency to form helical structures for these proteolysis sites (residues 241 and 244), which might impede the approach of the caspase therefore precluding the subsequent cleavage of the protein. This is consistent with results showing that ataxin-3 with a pathological poly-Q tract (ataxin-3-72Q) was proteolyzed to a much lesser extent than the ones with normal repeats (ataxin-3-6Q and ataxin-3-26Q) (Kim 2014). In their in vitro experiments, ataxin-3-72Q was cleaved into longer fragments by caspase indicating that ataxin-3 with pathological poly-Q repeat might lost the caspase cleavage sites in the UIM1-2 domain. The conformational changes in the UIM domains induced by the enlargement of the poly-Q segment found here are consistent with the experimental findings and support the argument that the structural modification changes the binding affinity of the proteolytic enzymes, and results in different cleavage fragments of ataxin-3 with pathological repeats. The cause of the structural modification of the functional domains, especially at the molecular level, is a very important question but our current calculation do not provide sufficient information for a defensible discussion. Future studies using ab initio 3D structure prediction methods in atxin-2, ataxin-3 and other proteins related to polyQ diseases may be able to provide a greater insight on this matter.
Conclusions
Poly-Q regions can fold into diverse structures in ataxin-2 and ataxin-3 and their structures depend on the context sequences in which poly-Q are located. This may be an indication that studies on the structure of isolated poly-Q tracks are not informative on their properties when incorporated into larger proteins. The enlargement of the poly-Q regions can affect not only the local structures, like the poly-Q flanking regions, but also regions far away from it, such as the functional domains and even the global structures of the protein. So in future studies it is important to consider the entire protein structures and not fragments amenable to experimentation, as results in small fragments may not be informative of the structural and functional changes induced by the enlargement of the poly-Q segment. While our studies did not find a clearly identifiable cause of pathogenesis due to structural changes upon enlargement of the poly-Q track, there is evidence that structural ensembles corresponding to the models with the larger number of repeats are more diverse with less structural conservation. This observation is consistent with the hypothesis of a pathogenic mechanism associated with increase propensity to protein aggregation. The structural changes, upon poly-Q segment enlargement, predicted for the UIM1–UIM2 tandem are consistent with existent experimental evidence and argue for a possible mechanism for pathogenesis due to inhibition of proteolysis due to a drastic structural changes in known cleavage sites.
Acknowledgments
Molecular graphics used the UCSF Chimera package developed by the Resource for Biocomputing, Visualization, and Informatics at the University of California, San Francisco (supported by NIGMS P41-GM103311). Computer time was provided by an allocation to JCF at the CHPC of the University of Utah. JCF has been partially supported by the University of Utah Center for Clinical and Translational Science under NCATS Grant 1ULTR001067. JW was partially supported by the Richard A. Fay and Carole M. Fay Endowed Graduate Fellowship for the Department of Biomedical Informatics in honor of Homer R. Warner, MD, PhD. We thank Professor Stefan Pulst for reading the manuscript.
References
- Albrecht M, Golatta M, Wullner U, Lengauer T. Structural and functional analysis of ataxin-2 and ataxin-3. Eur J Biochem. 2004;271:3155–3170. doi: 10.1111/j.1432-1033.2004.04245.x. [DOI] [PubMed] [Google Scholar]
- Berke SJ, Schmied FA, Brunt ER, Ellerby LM, Paulson HL. Caspase-mediated proteolysis of the polyglutamine disease protein ataxin-3. J Neurochem. 2004;89:908–918. doi: 10.1111/j.1471-4159.2004.02369.x. [DOI] [PubMed] [Google Scholar]
- Buchanan LE, Carr JK, Fluitt AM, Hoganson AJ, Moran SD, de Pablo JJ, Skinner JL, Zanni MT. Structural motif of polyglutamine amyloid fibrils discerned with mixed-isotope infrared spectroscopy. Proceedings of the National Academy of Sciences. 2014;111:5796–5801. doi: 10.1073/pnas.1401587111. [DOI] [PMC free article] [PubMed] [Google Scholar]
- Crooks GE, Hon G, Chandonia JM, Brenner SE. WebLogo: a sequence logo generator. Genome Res. 2004;14:1188–1190. doi: 10.1101/gr.849004. [DOI] [PMC free article] [PubMed] [Google Scholar]
- Darnell G, Orgel JP, Pahl R, Meredith SC. Flanking polyproline sequences inhibit beta-sheet structure in polyglutamine segments by inducing PPII-like helix structure. J Mol Biol. 2007;374:688–704. doi: 10.1016/j.jmb.2007.09.023. [DOI] [PubMed] [Google Scholar]
- David G, Abbas N, Stevanin G, Durr A, Yvert G, Cancel G, Weber C, Imbert G, Saudou F, Antoniou E, Drabkin H, Gemmill R, Giunti P, Benomar A, Wood N, Ruberg M, Agid Y, Mandel JL, Brice A. Cloning of the SCA7 gene reveals a highly unstable CAG repeat expansion. Nat Genet. 1997;17:65–70. doi: 10.1038/ng0997-65. [DOI] [PubMed] [Google Scholar]
- Deng L, Wang Y, Ou-Yang ZC. Concentration and Temperature Dependences of Polyglutamine Aggregation by Multiscale Coarse-Graining Molecular Dynamics Simulations. J Phys Chem B. 2012:10135–10144. doi: 10.1021/jp210683n. [DOI] [PubMed] [Google Scholar]
- DiFiglia M, Sapp E, Chase KO, Davies SW, Bates GP, Vonsattel JP, Aronin N. Aggregation of huntingtin in neuronal intranuclear inclusions and dystrophic neurites in brain. Science. 1997;277:1990–1993. doi: 10.1126/science.277.5334.1990. [DOI] [PubMed] [Google Scholar]
- Elden AC, Kim H-J, Hart MP, Chen-Plotkin AS, Johnson BS, Fang X, Armakola M, Geser F, Greene R, Lu MM, Padmanabhan A, Clay D, McCluskey L, Elman L, Juhr D, Gruber PJ, Rüb U, Auburger G, Trojanowski JQ, Lee VMY, Van Deerlin VM, Bonini NM, Gitler AD. Ataxin-2 intermediate-length polyglutamine expansions are associated with increased risk for ALS. Nature. 2010;466:1069–1075. doi: 10.1038/nature09320. [DOI] [PMC free article] [PubMed] [Google Scholar]
- Fernandez M, McClain ME, Martinez RA, Snow K, Lipe H, Ravits J, Bird TD, La Spada AR. Late-onset SCA2: 33 CAG repeats are sufficient to cause disease. Neurology. 2000;55:569–572. doi: 10.1212/wnl.55.4.569. [DOI] [PubMed] [Google Scholar]
- Figueroa KP, Farooqi S, Harrup K, Frank J, O'Rahilly S, Pulst SM. Genetic Variance in the Spinocerebellar Ataxia Type 2 (ATXN2) Gene in Children with Severe Early Onset Obesity. PLoS ONE. 2009;4:e8280. doi: 10.1371/journal.pone.0008280. [DOI] [PMC free article] [PubMed] [Google Scholar]
- Gomez-Sicilia A, Sikora M, Cieplak M, Carrion-Vazquez M. An Exploration of the Universe of Polyglutamine Structures. PLoS Comput Biol. 2015;11:e1004541. doi: 10.1371/journal.pcbi.1004541. [DOI] [PMC free article] [PubMed] [Google Scholar]
- Hubener J, Weber JJ, Richter C, Honold L, Weiss A, Murad F, Breuer P, Wullner U, Bellstedt P, Paquet-Durand F, Takano J, Saido TC, Riess O, Nguyen HP. Calpain-mediated ataxin-3 cleavage in the molecular pathogenesis of spinocerebellar ataxia type 3 (SCA3) Hum Mol Genet. 2013;22:508–518. doi: 10.1093/hmg/dds449. [DOI] [PubMed] [Google Scholar]
- Invernizzi G, Lambrughi M, Regonesi ME, Tortora P, Papaleo E. The conformational ensemble of the disordered and aggregation-protective 182–291 region of ataxin-3. Biochimica et Biophysica Acta - General Subjects. 2013;1830:5236–5247. doi: 10.1016/j.bbagen.2013.07.007. [DOI] [PubMed] [Google Scholar]
- Kabsch W, Sander C. Dictionary of protein secondary structure: pattern recognition of hydrogen-bonded and geometrical features. Biopolymers. 1983;22:2577–2637. doi: 10.1002/bip.360221211. [DOI] [PubMed] [Google Scholar]
- Kawaguchi Y, Okamoto T, Taniwaki M, Aizawa M, Inoue M, Katayama S, Kawakami H, Nakamura S, Nishimura M, Akiguchi I, et al. CAG expansions in a novel gene for Machado-Joseph disease at chromosome 14q32.1. Nat Genet. 1994;8:221–228. doi: 10.1038/ng1194-221. [DOI] [PubMed] [Google Scholar]
- Kim M. Beta conformation of polyglutamine track revealed by a crystal structure of Huntingtin N-terminal region with insertion of three histidine residues. Prion. 2013;7 doi: 10.4161/pri.23807. [DOI] [PMC free article] [PubMed] [Google Scholar]
- Kim M. Pathogenic polyglutamine expansion length correlates with polarity of the flanking sequences. Mol Neurodegener. 2014;9:45. doi: 10.1186/1750-1326-9-45. [DOI] [PMC free article] [PubMed] [Google Scholar]
- Kim MW, Chelliah Y, Kim SW, Otwinowski Z, Bezprozvanny I. Secondary structure of Huntingtin amino-terminal region. Structure. 2009;17:1205–1212. doi: 10.1016/j.str.2009.08.002. [DOI] [PMC free article] [PubMed] [Google Scholar]
- Kozlov G, Safaee N, Rosenauer A, Gehring K. Structural basis of binding of P-body-associated proteins GW182 and ataxin-2 by the Mlle domain of poly(A)-binding protein. J Biol Chem. 2010;285:13599–13606. doi: 10.1074/jbc.M109.089540. [DOI] [PMC free article] [PubMed] [Google Scholar]
- Lakhani VV, Ding F, Dokholyan NV. Polyglutamine induced misfolding of huntingtin exon1 is modulated by the flanking sequences. PLoS Comput Biol. 2010;6:e1000772. doi: 10.1371/journal.pcbi.1000772. [DOI] [PMC free article] [PubMed] [Google Scholar]
- MacDonald ME. The Huntington's Disease collaborative Research Group. A novel gene containing a trinucleotide repeat that is expanded and unstable on Huntington's disease chromosomes. The Huntington's Disease Collaborative Research Group. Cell. 1993;72:971–983. doi: 10.1016/0092-8674(93)90585-e. [DOI] [PubMed] [Google Scholar]
- Magana JJ, Velazquez-Perez L, Cisneros B. Spinocerebellar ataxia type 2: clinical presentation, molecular mechanisms, and therapeutic perspectives. Mol Neurobiol. 2013;47:90–104. doi: 10.1007/s12035-012-8348-8. [DOI] [PubMed] [Google Scholar]
- Man VH, Roland C, Sagui C. Structural Determinants of Polyglutamine Protofibrils and Crystallites. ACS Chem Neurosci. 2015;6:632–645. doi: 10.1021/cn500358g. [DOI] [PubMed] [Google Scholar]
- Mao Y, Senic-Matuglia F, Di Fiore PP, Polo S, Hodsdon ME, De Camilli P. Deubiquitinating function of ataxin-3: insights from the solution structure of the Josephin domain. Proc Natl Acad Sci U S A. 2005;102:12700–12705. doi: 10.1073/pnas.0506344102. [DOI] [PMC free article] [PubMed] [Google Scholar]
- Margulis BA, Vigont V, Lazarev VF, Kaznacheyeva EV, Guzhova IV. Pharmacological protein targets in polyglutamine diseases: Mutant polypeptides and their interactors. FEBS Letters. 2013;587:1997–2007. doi: 10.1016/j.febslet.2013.05.022. [DOI] [PubMed] [Google Scholar]
- Matilla-Dueñas A, Ashizawa T, Brice A, Magri S, McFarland KN, Pandolfo M, Pulst SM, Riess O, Rubinsztein DC, Schmidt J, Schmidt T, Scoles DR, Stevanin G, Taroni F, Underwood BR, Sanchez I. Consensus paper: pathological mechanisms underlying neurodegeneration in spinocerebellar ataxias. Cerebellum. 2014;13:269–302. doi: 10.1007/s12311-013-0539-y. [DOI] [PMC free article] [PubMed] [Google Scholar]
- Matilla-Dueñas A, Corral-Juan M, Volpini V, Sanchez I. The spinocerebellar ataxias: clinical aspects and molecular genetics. Adv Exp Med Biol. 2012;724:351–374. doi: 10.1007/978-1-4614-0653-2_27. [DOI] [PubMed] [Google Scholar]
- Miettinen M, Knecht V, Monticelli L, Ignatova Z. Assessing polyglutamine conformation in the nucleating event by molecular dynamics simulations. J Phys Chem B. 2012;116:10259–10265. doi: 10.1021/jp305065c. [DOI] [PubMed] [Google Scholar]
- Nicastro G, Menon RP, Masino L, Knowles PP, McDonald NQ, Pastore A. The solution structure of the Josephin domain of ataxin-3: structural determinants for molecular recognition. Proc Natl Acad Sci U S A. 2005;102:10493–10498. doi: 10.1073/pnas.0501732102. [DOI] [PMC free article] [PubMed] [Google Scholar]
- Nozaki K, Onodera O, Takano H, Tsuji S. Amino acid sequences flanking polyglutamine stretches influence their potential for aggregate formation. Neuroreport. 2001;12:3357–3364. doi: 10.1097/00001756-200110290-00042. [DOI] [PubMed] [Google Scholar]
- Orr HT, Chung MY, Banfi S, Kwiatkowski TJ, Jr, Servadio A, Beaudet AL, McCall AE, Duvick LA, Ranum LP, Zoghbi HY. Expansion of an unstable trinucleotide CAG repeat in spinocerebellar ataxia type 1. Nat Genet. 1993;4:221–226. doi: 10.1038/ng0793-221. [DOI] [PubMed] [Google Scholar]
- Perutz MF. Glutamine repeats and neurodegenerative diseases: molecular aspects. Trends Biochem Sci. 1999;24:58–63. doi: 10.1016/s0968-0004(98)01350-4. [DOI] [PubMed] [Google Scholar]
- Perutz MF, Finch JT, Berriman J, Lesk A. Amyloid fibers are water-filled nanotubes. Proc Natl Acad Sci U S A. 2002;99:5591–5595. doi: 10.1073/pnas.042681399. [DOI] [PMC free article] [PubMed] [Google Scholar]
- Pettersen EF, Goddard TD, Huang CC, Couch GS, Greenblatt DM, Meng EC, Ferrin TE. UCSF Chimera--a visualization system for exploratory research and analysis. J Comput Chem. 2004;25:1605–1612. doi: 10.1002/jcc.20084. [DOI] [PubMed] [Google Scholar]
- Pulst SM, Nechiporuk A, Nechiporuk T, Gispert S, Chen XN, Lopes-Cendes I, Pearlman S, Starkman S, Orozco-Diaz G, Lunkes A, Dejong P, Rouleau GA, Auburger G, Korenberg JR, Figueroa C, Sahba S. Moderate expansion of a normally biallelic trinucleotide repeat in spinooerebellar ataxia type. Nature Genetics. 1996;14:269–276. doi: 10.1038/ng1196-269. [DOI] [PubMed] [Google Scholar]
- R Development Core Team. R: A language and environment for statistical computing. Vienna, Austria: R Foundation for Statistical Computing; 2011. [Google Scholar]
- Roy A, Kucukural A, Zhang Y. I-TASSER: a unified platform for automated protein structure and function prediction. Nat. Protocols. 2010;5:725–738. doi: 10.1038/nprot.2010.5. [DOI] [PMC free article] [PubMed] [Google Scholar]
- Satoh T, Sumiyoshi A, Yagi-Utsumi M, Sakata E, Sasakawa H, Kurimoto E, Yamaguchi Y, Li W, Joazeiro CA, Hirokawa T, Kato K. Mode of substrate recognition by the Josephin domain of ataxin-3, which has an endo-type deubiquitinase activity. FEBS Lett. 2014;588:4422–4430. doi: 10.1016/j.febslet.2014.10.013. [DOI] [PubMed] [Google Scholar]
- Schneider R, Schumacher MC, Mueller H, Nand D, Klaukien V, Heise H, Riedel D, Wolf G, Behrmann E, Raunser S. Structural characterization of polyglutamine fibrils by solid-state NMR spectroscopy. Journal of Molecular Biology. 2011;412:121–136. doi: 10.1016/j.jmb.2011.06.045. [DOI] [PubMed] [Google Scholar]
- Shao J, Diamond MI. Polyglutamine diseases: emerging concepts in pathogenesis and therapy. Hum Mol Genet. 2007;16:R115–R123. doi: 10.1093/hmg/ddm213. [DOI] [PubMed] [Google Scholar]
- Sikorski P, Atkins E. New Model for Crystalline Polyglutamine Assemblies and Their Connection with Amyloid Fibrils. Biomacromolecules. 2005;6:425–432. doi: 10.1021/bm0494388. [DOI] [PubMed] [Google Scholar]
- Simoes AT, Goncalves N, Koeppen A, Deglon N, Kugler S, Duarte CB, Pereira de Almeida L. Calpastatin-mediated inhibition of calpains in the mouse brain prevents mutant ataxin 3 proteolysis, nuclear localization and aggregation, relieving Machado-Joseph disease. Brain. 2012;135:2428–2439. doi: 10.1093/brain/aws177. [DOI] [PubMed] [Google Scholar]
- Song A-X, Zhou C-J, Peng Y, Gao X-C, Zhou Z-R, Fu Q-S, Hong J, Lin D-H, Hu H-Y. Structural Transformation of the Tandem Ubiquitin-Interacting Motifs in Ataxin-3 and Their Cooperative Interactions with Ubiquitin Chains. PLoS ONE. 2010;5:e13202. doi: 10.1371/journal.pone.0013202. [DOI] [PMC free article] [PubMed] [Google Scholar]
- Sun CS, Lee CC, Li YN, Yao-Chen Yang S, Lin CH, Chang YC, Liu PF, He RY, Wang CH, Chen W, Chern Y, Jen-Tse Huang J. Conformational switch of polyglutamine-expanded huntingtin into benign aggregates leads to neuroprotective effect. Sci Rep. 2015;5:14992. doi: 10.1038/srep14992. [DOI] [PMC free article] [PubMed] [Google Scholar]
- Tang B, Liu C, Shen L, Dai H, Pan Q, Jing L, Ouyang S, Xia J. Frequency of SCA1, SCA2, SCA3/MJD, SCA6, SCA7, and DRPLA CAG trinucleotide repeat expansion in patients with hereditary spinocerebellar ataxia from Chinese kindreds. Arch Neurol. 2000;57:540–544. doi: 10.1001/archneur.57.4.540. [DOI] [PubMed] [Google Scholar]
- Thakur AK, Jayaraman M, Mishra R, Thakur M, Chellgren VM, Byeon IJ, Anjum DH, Kodali R, Creamer TP, Conway JF, Gronenborn AM, Wetzel R. Polyglutamine disruption of the huntingtin exon 1 N terminus triggers a complex aggregation mechanism. Nat Struct Mol Biol. 2009;16:380–389. doi: 10.1038/nsmb.1570. [DOI] [PMC free article] [PubMed] [Google Scholar]
- Tobelmann MD, Murphy RM. Location trumps length: polyglutamine-mediated changes in folding and aggregation of a host protein. Biophys J. 2011;100:2773–2782. doi: 10.1016/j.bpj.2011.04.028. [DOI] [PMC free article] [PubMed] [Google Scholar]
- Tompa P. Intrinsically unstructured proteins. Trends Biochem Sci. 2002;27:527–533. doi: 10.1016/s0968-0004(02)02169-2. [DOI] [PubMed] [Google Scholar]
- Vitalis A, Wang X, Pappu RV. Atomistic simulations of the effects of polyglutamine chain length and solvent quality on conformational equilibria and spontaneous homodimerization. J Mol Biol. 2008;384:279–297. doi: 10.1016/j.jmb.2008.09.026. [DOI] [PMC free article] [PubMed] [Google Scholar]
- Wang Y, Voth GA. Molecular dynamics simulations of polyglutamine aggregation using solvent-free multiscale coarse-grained models. J Phys Chem B. 2010;114:8735–8743. doi: 10.1021/jp1007768. [DOI] [PubMed] [Google Scholar]
- Wen J, Scoles D, Facelli J. Structure prediction of polyglutamine disease proteins: comparison of methods. BMC bioinformatics. 2014;15:S11. doi: 10.1186/1471-2105-15-S7-S11. [DOI] [PMC free article] [PubMed] [Google Scholar]
- Yazawa I, Nukina N, Hashida H, Goto J, Yamada M, Kanazawa I. Abnormal gene product identified in hereditary dentatorubral-pallidoluysian atrophy (DRPLA) brain. Nat Genet. 1995;10:99–103. doi: 10.1038/ng0595-99. [DOI] [PubMed] [Google Scholar]
- Zhang Y, Skolnick J. Scoring function for automated assessment of protein structure template quality. Proteins. 2004;57:702–710. doi: 10.1002/prot.20264. [DOI] [PubMed] [Google Scholar]
- Zhang Y, Skolnick J. TM-align: a protein structure alignment algorithm based on the TM-score. Nucleic Acids Res. 2005;33:2302–2309. doi: 10.1093/nar/gki524. [DOI] [PMC free article] [PubMed] [Google Scholar]