

Abstract
Introduction
While adherence to medication in smoking cessation clinical trials is strongly associated with clinical outcome, very few studies have evaluated the validity of pill count as a measure of adherence relative to a biological assay, and evaluated a broad range of correlates of adherence.
Methods
In a smoking cessation clinical trial of varenicline, we compared pill counts collected over 4 different time periods to varenicline salivary levels taken after 2 weeks of treatment, as well as evaluated predictors of adherence to varenicline.
Results
Using a binary measure of adherence based on salivary varenicline levels, adherence was higher among older, white, and more educated participants. Relative to 3, 7, and 14-day pill count, 12-week pill count was the only significant measure able to discriminate adherence as defined by salivary varenicline levels (assessed by area under the receiver operating characteristic curve; AUC = .59, p =.004). Seventy-two percent of participants who indicated adherence on 12-week pill count were classified as adherent based on varenicline saliva levels (sensitivity=.80; specificity=.40). There was modest variability in the relationship between 12-week pill count and varenicline levels across race and rate of nicotine metabolism. Lastly, General Estimating Equation models demonstrated that longitudinal changes in withdrawal, craving, negative and positive affect, and side effect count and severity were not related to adherence based on salivary varenicline levels.
Conclusions
These results indicate that 12-week pill count was the best, albeit a relatively weak, measure of varenicline adherence; additional factors associated with treatment adherence need to be identified.
Keywords: Adherence, Varenicline, Smoking Cessation, Nicotine Dependence
1. Introduction
Cigarette smoking remains the largest preventable cause of morbidity and mortality in the United States (“Vital signs: current cigarette smoking among adults aged >/=18 years—United States, 2005–2010,” 2011). Despite substantial reductions in the national rate of adult smoking since the release of the 1964 Surgeon General’s report, the current smoking prevalence rate has remained at around 15.1% over the last decade and the need to improve smoking cessation treatments is a public health priority (Jamal et al., 2016). Of the currently approved smoking cessation medications, varenicline is the most efficacious monotherapy (Cahill, Stevens, Perera, & Lancaster, 2013). Varenicline acts as a partial agonist at the α4β2 nAChR subtype and aids in cessation by reducing the reinforcing effects of nicotine and by ameliorating the severity of nicotine craving and withdrawal symptoms (Ebbert, Wyatt, Hays, Klee, & Hurt, 2010). An important predictor of treatment success is medication adherence, or the extent to which individuals use the prescribed amount of varenicline. Greater adherence to smoking cessation pharmacotherapy has been associated with better cessation outcomes in several studies (Killen et al., 2004; Liberman et al., 2013; Schmitz, Stotts, Mooney, Delaune, & Moeller, 2007; Shiffman, 2007; Swan, Javitz, Jack, Curry, & McAfee, 2004). Yet, few studies have examined biological measures of adherence in smoking cessation trials or assessed factors that influence adherence.
In many cases, pill count through daily diaries, or assessment of used blister packs, is widely used as a reference standard of adherence in smoking cessation trials as it is both convenient and easy to assess. In a 2015 Cochrane review summarizing interventions to increase adherence to smoking cessation medication, 5 out of 8 included studies used pill count to assess adherence while the remaining studies used self-report or electronic monitoring systems (Hollands et al., 2015). However, pill count may not be accurate in estimating adherence; it tends to overestimate medication adherence and yield an imprecise metric of the total dose taken (Farmer, 1999; Haynes, Ackloo, Sahota, McDonald, & Yao, 2008; McDonald, Garg, & Haynes, 2002; Pullar, Kumar, Tindall, & Feely, 1989). A biological measure, derived from blood, saliva, or urine concentrations of medication, is generally considered to be the most accurate measure of adherence and is commonly used in other research fields such as epilepsy (Dutta & Reed, 2006; Herkes & Eadie, 1990; Landmark, Rytter, & Johannessen, 2007; Malone, Eadie, Addison, Wright, & Dickinson, 2006; Mitchell, Scheier, & Baker, 2000; Specht, Elsner, May, Schimichowski, & Thorbecke, 2003; Vermeire, Hearnshaw, Van Royen, & Denekens, 2001; Williams et al., 2001). Given varenicline’s pharmacokinetic attributes such as minimal metabolism and long half-life (approximately 24 hours) (Faessel et al., 2010), assessment of varenicline is a valid method for biologically assessing varenicline adherence. However, biological measures are not routinely used as part of drug monitoring in smoking cessation trials due to challenges of collection, analysis, and cost, resulting in a lack of information regarding the use of biological measures to determine adherence. As such, remarkably few studies have examined the validity of pill count compared to a biological assay (Buchanan et al., 2012). There is a need to validate pill count measures of varenicline use against biological measures of adherence in treatment-seeking smokers, as well as in subgroups of smokers (e.g. different gender, race and rate of nicotine metabolism).
In addition, given that adherence rates are often sub-optimal (Catz et al., 2011; Shelley et al., 2015), another priority in this area is the development of interventions designed to enhance adherence. Examining longitudinal predictors of adherence to varenicline could help inform such intervention development. In the present study, we expand the investigation of correlates of adherence by examining how psychological variables (e.g., positive and negative affect), cessation-related variables (e.g., craving and withdrawal), and medication side effects may be associated with a biological measure of adherence. By designing interventions that specifically target these variables during the early stages of a quit attempt, there may be an opportunity to improve adherence to varenicline and ultimately increase smoking cessation rates.
Thus, the present study was designed to: 1) evaluate pill count measures of medication use against varenicline levels, 2) assess the relationship between pill count measures of adherence and varenicline levels across subgroups of smokers (e.g., gender, race, and rate of nicotine metabolism), and 3) examine changes over time in withdrawal, affect, craving and side effects between adherent and non-adherent participants.
2. Methods
2.1 Participants
This study is a secondary analysis of data from a placebo-controlled, randomized clinical trial that compared the efficacy of varenicline and transdermal nicotine for treating nicotine dependence among slow and fast metabolizers of nicotine (ClinicalTrials.gov Identifier: NCT01314001). A full list of the inclusion and exclusion criteria can be found in Lerman et al (Lerman et al., 2015).
Given our interest in assessing the validity of pill count measures of adherence compared to a biological measure of varenicline use, only the 421 participants randomized to the varenicline arm of this trial were included. Further, the present analyses were restricted to 376 of the 421 participants who provided saliva samples for varenicline level testing.
2.2 Procedures
Detailed clinical trial procedures are published elsewhere (Chenoweth et al., 2014; Lerman et al., 2015; Schnoll et al., 2014). Subjects randomized to varenicline remained on medication for a total of 12 weeks at the following doses: 0.5mg once daily for Days 1–3, 0.5 mg twice daily for Days 4–7, and 1.0 mg twice daily for Days 8–84. Assessments, described below, occurred on weeks 0, 1, 4, 8, and 12 (end of treatment, EOT).
2.3 Measures
2.3.1 Covariates
Basic demographic and smoking-related data were collected during the intake visit. To assess subjects’ levels of nicotine dependence, the Fagerström Test for Nicotine Dependence was administered (Heatherton, Kozlowski, Frecker, & Fagerstrom, 1991). Blood samples for NMR assessment were evaluated using liquid chromatography-tandem mass spectrometry (LC-MS) with a limit of quantification of ≤1 ng/ml for both compounds (St. Helen et al., 2012).
2.3.2 Pill count adherence measures
Medication adherence was assessed using a timeline follow-back measure (Brown, 1998), with participants reporting the number of pills taken each day since the previous visit. To calculate pill count adherence measures (3-day, 7-day, 14-day, and 12-week pill count), the reported number of pills taken was divided by the total number of prescribed pills for that time period. The 3-, 7-, and 14-day pill count refers to the number of prescribed pills taken during the respective time-frames prior to saliva sample acquisition for varenicline testing (week 1; 2 weeks after treatment initiation), while 12-week pill count refers to the total number of pills taken during the study.
2.3.3 Salivary varenicline concentration levels
Participant saliva samples were collected two weeks following the initiation of treatment (week 1). Varenicline levels were analyzed by atmospheric pressure chemical ionization LC-MS using previously described methods (Dempsey et al., 2004; Jacob III et al., 2011; St. Helen et al., 2012; Tanner et al., 2015) that were expanded to include varenicline. Analyses used deuterated varenicline as internal standards. Saliva (100 μL) was diluted with 900 μL of high performance liquid chromatography (HPLC)-grade water and 100 μL of 30% perchloric acid was added to precipitate proteins. After vortexing and centrifuging, the supernatant was decanted and 2 mL of tripotassium phosphate (50% w/v in water, pH ~14) and 5 mL methylene chloride were added. The resulting solution was mixed and centrifuged. The lower (organic) layer was transferred to a new tube, 100 μL of 10% HCl in methanol was added, and the sample evaporated to dryness under nitrogen. The residue was reconstituted in 100 μL of buffer, composed of 100 mM ammonium acetate in 80/20 water/methanol and 1% acetic acid. Analysis was conducted using an Agilent 1260 HPLC and an Agilent 6430 Triple Quadrupole LC/MS system. The analytes were resolved on a Synergi Polar RP column, 4 micron particle size, 150 × 4.6 mm. A gradient elution was used: mobile phase A was 10 mM ammonium acetate/0.1% acetic acid in water; and mobile phase B was 10 mM ammonium acetate/0.1% acetic acid in methanol. The flow rate was 0.7 mL per minute, and the initial ratio of mobile phase A and B is 80% A and 20% B. The gradient was changed to 100% mobile phase B over 6.5 minutes, maintained at 100% solvent B until 8.0 minutes, changing to 20% solvent B at 8.1 minutes and maintained at 20% B until the end of the run at 13.0 minutes. The mass spectrometer was operated in the positive ion mode using atmospheric pressure chemical ionization. Limits of quantification were 1 ng/mL. The mass transitions monitored were 212 ➔ 169 for varenicline and 216 ➔ 169 for varenicline-d4. The retention time was 6.6 minutes for varenicline. Intraday coefficients of variation were assessed at three different concentrations to determine intrarun assay precision. The coefficient of variation values were 1.7%–5.8%.
2.3.4 Longitudinal correlates of adherence
Self-report withdrawal symptoms were assessed using The Minnesota Nicotine Withdrawal Scale (MNWS) (Hughes & Hatsukami, 1986). Changes in participant mood were monitored using the Positive and Negative Affect Schedule (PANAS) (Watson, Clark, & Tellegen, 1988). To assess craving for cigarettes, participants completed the 10-item brief Questionnaire of Smoking Urges (QSU) (Cox, Tiffany, & Christen, 2001). Participants also completed a checklist of common side effects associated with smoking cessation medications (e.g., trouble sleeping, nausea) (McClure et al., 2009; Patterson et al., 2009; Schnoll et al., 2009) and rated each by severity (from none [0] to severe [3]). The sum of side effect severity and count of side effect symptoms were derived from this checklist. All measures were collected at baseline (pre-quit), week 4, week 8, and EOT by research technicians at the University of Pennsylvania and summary scores were calculated.
2.4 Data Analysis
First, we determined the appropriate cut-point for salivary varenicline levels that differentiated adherent and non-adherent participants using the correlation between plasma and salivary varenicline concentrations, pharmacokinetic data, and a previously established measure of adherence based on varenicline plasma concentrations of 2 ng/ml (Buchanan et al., 2012) using linear regression. Next, we evaluated differences in demographic and smoking-related characteristics between adherent and non-adherent participants using chi-square (for dichotomous variables) or Mann-Whitney U test (for continuous variables). Correlations were computed to examine the association between each pill count adherence measure and salivary varenicline levels. A series of Receiver Operating Characteristic (ROC) curve analyses were conducted with adherence and non-adherence (as determined by the salivary varenicline cut-point) as the binary response and the four pill count measures as the continuous predictors. The ROC analysis was used to identify the optimal cut-point (in terms of pills taken) that would maximize area under the curve (AUC), and the sensitivity and specificity of the pill-count measure against the varenicline level measure. ROC analyses were then conducted separately for men and women, white and non-white participants, and slow and normal nicotine metabolizers to examine variability in AUC values across these groups. Chi-square tests were used to evaluate differences between AUC values for the respective groups.
Lastly, longitudinal logistic regression (General Estimating Equations, GEE) was used to assess the relationship between adherence and changes in withdrawal, positive and negative affect, craving, and side effects over the course of the 12-week treatment. Main and interaction effects for the repeated measures independent variable (i.e., time: baseline, week 4, week 8, EOT) and the between-group independent variable (i.e., varenicline adherence: adherent vs. non-adherent) were assessed. Separate models were conducted for each variable and covariates were included. Analyses were completed using SPSS (Version 13, IBM Corp., Armonk, New York) or STATA (Version 13, StataCorp, College Station, Texas).
3. Results
3.1 Identification of the cut-point based on salivary varenicline levels
Buchanan et al., using ROC curves, identified 2.0 ng/ml as the cut-point for determining varenicline adherence from plasma (Buchanan et al., 2012). To determine the salivary equivalent to this cut-point, we identified a regression slope of 2.2 (forced through the origin) based on correlation data from Nollen (personal communication), known pharmacokinetics of varenicline (Faessel et al., 2010), and the 2.0 ng/ml cut-point for plasma varenicline (Buchanan et al., 2012) within a regression model. This model identified 4.7 ng/ml (CI 95%: 4.06–5.36) as a plausible cut-point for adherence using salivary varenicline levels.
3.2 Sample description
Table 1 shows characteristics of participants who provided saliva for varenicline level testing (N = 376). There were no significant baseline differences in variables in Table 1 between participants who provided a saliva sample (N = 376) and those who did not (N = 45). Using the cut-point of 4.7 ng/ml to determine adherence, 66.2% (N = 249) of the sample was classified as adherent. The study sample was racially diverse, with 46% (N=173) of participants identifying as non-white, and 44.9% (N=169) of the sample were female. The mean age of participants was 45.3 years. Participants smoked on average 17.5 cigarettes per day and their mean Fagerström Test for Nicotine Dependence (FTND) score was 5.1. As Table 1 shows, there were significant differences in age, race, and education between adherent and non-adherent participants. These variables were included as covariates in the subsequent GEE analyses.
Table 1.
Characteristics of sample
| Characteristic | Adherenta (N = 249) N (%) or M (SD) |
Non-Adherent (N = 127) N (%) or M (SD) |
Overall (N = 376) N (%) or M (SD) |
p-Valueb |
|---|---|---|---|---|
| Sex | ||||
| Female | 113 (45.4) | 56 (44.1) | 169 (44.9) | .898 |
| Male | 136 (54.6) | 71 (55.9) | 207 (55.1) | |
| Age (years) | 46.5 (11.6) | 42.9 (11.2) | 45.3 (11.5) | .002 |
| Race | ||||
| White/Caucasian | 148 (59.4) | 55 (43.3) | 203 (54.0) | .004 |
| Non-White | 101 (40.6) | 72 (56.7) | 173 (46.0) | |
| Incomec | ||||
| ≤50,000/year | 152 (61.5) | 90 (71.4) | 242 (64.9) | .075 |
| >50,000/year | 95 (38.5) | 36 (28.6) | 131 (35.1) | |
| Education | ||||
| High school or less | 68 (27.3) | 51 (40.2) | 119 (31.6) | .016 |
| More than high school | 181 (72.7) | 76 (59.8) | 257 (68.4) | |
| Employment Status | ||||
| Employed | 152 (61.0) | 74 (58.3) | 226 (60.1) | .683 |
| Not employed | 97 (39.0) | 53 (41.7) | 150 (39.9) | |
| Marital Status | ||||
| Married | 109 (43.8) | 48 (37.8) | 157 (41.8) | .317 |
| Other | 140 (56.2) | 79 (62.2) | 219 (58.2) | |
| Alcoholic Drinks per Week | 3.39 (5.53) | 2.65 (4.44) | 3.14 (5.19) | .141 |
| Baseline Cigarettes per Day | 17.4 (5.60) | 17.6 (6.63) | 17.5 (5.96) | .743 |
| Baseline FTNDd | 4.97 (1.99) | 5.34 (2.08) | 5.09 (2.03) | .146 |
| BMI | 28.8 (6.3) | 29.6 (6.5) | 29.0 (6.3) | .237 |
| NMRe | .351 (.208) | .315 (.175) | .339 (.198) | .212 |
| Study Sitet | ||||
| UPenn | 81 (64.8) | 44 (35.2) | 125 (33.2) | .157 |
| CAMH | 60 (71.4) | 24 (28.6) | 84 (22.3) | |
| MD Anderson | 61 (71.8) | 24 (28.3) | 85 (22.6) | |
| Buffalo SUNY | 47 (57.3) | 35 (42.7) | 82 (21.8) | |
| 3-day Pill Countg | 5.6 (1.0) | 5.3 (1.5) | 5.5 (1.2) | .277 |
| 7-day Pill Countg | 13.3 (1.8) | 12.7 (3.0) | 13.1 (2.3) | .253 |
| 14-day Pill Countg | 24.0 (2.2) | 23.1 (4.0) | 23.7 (2.9) | .086 |
| 12-Week Pill Countg | 135.3 (40.8) | 111.9 (57.4) | 127.4 (48.3) | .004 |
Adherence defined as saliva varenicline concentration > 4.7 ng/mL;
p-values derived from Mann-Whitney U tests, or Chi-Square Test for Independence comparing Adherent and Non-Adherent group;
N = 373; missing data from 3 participants
FTND = Fagerström Test for Nicotine Dependence;
NMR = Nicotine Metabolite Ratio;
UPenn = University of Pennsylvania; CAMH = Centre for Addiction and Mental Health; SUNY = State University of New York;
Possible ranges are: 0–6, 0–14, 0–25, and 0–165, respectively.
3.3 The relationship between pill count and varenicline levels
Correlations between pill count measures of adherence taken over 4 different time periods (3-day, 7-day, 14-day, and 12-week) and salivary varenicline levels were calculated (Table 2). Correlations among the pill count measures ranged from .32 to .86 (p’s < .001). Although none of the adherence measures showed a strong positive association with salivary varenicline, 12-week pill count was the strongest (r = .18, p < .001). The correlations between saliva varenicline levels and 3-day, 7-day, and 14-day pill-count were weak ranging from .10 to .15 (p’s < .05). Compared to the 3, 7 and 14-day pill count measures, 12-week pill count improved correctly classifying adherence. Nearly 72% of the 242 participants who reported taking at least 80% of doses throughout the 12-week trial had salivary varenicline levels that indicated adherence. The corresponding rates of correct classification for the other adherence measures were: 69% for 3-day pill count, 68% for 7-day pill count, and 67% for 14-day pill count. Interestingly, 17.9 to 19.3% of those that reported taking 100% of pills in the last 3, 7 and 14 days had undetectable varenicline levels.
Table 2.
Spearman correlation coefficients of different measures of adherence
| Measures of Adherence |
Salivary Varenicline (ng/ml) |
3-Day Pill Count |
7-Day Pill Count |
14-Day Pill Count |
12-Week Pill Count |
|---|---|---|---|---|---|
| Salivary Varenicline (ng/ml) |
1 | – | – | – | – |
| 3-Day Pill Count | 0.12 (.02) | 1 | – | – | – |
| 7-Day Pill Count | 0.10 (.05) | 0.86 (<.001) | 1 | – | – |
| 14-Day Pill Count | 0.15 (.003) | 0.75 (<.001) | 0.85 (<.001) | 1 | – |
| 12-Week Pill Count | 0.18 (<.001) | 0.32 (<.001) | 0.33 (<.001) | 0.35 (<.001) | 1 |
P-values (2-tailed) are indicated in brackets.
An ROC curve analysis was performed to assess the validity of each pill count measure in comparison to salivary varenicline concentration; 12-week pill count had the only statistically significant area under the curve (AUC = .59, p = .004); values for 3-day, 7-day, and 14-day pill count are shown in Figure 1. The ROC curve for 12-week pill count was used to identify an optimal cut-point (in terms of pills taken) to maximize sensitivity and specificity when discriminating between adherence and non-adherence. The cut-point was 98/165 pills (~60% of pills), which had the associated sensitivity and specificity of .80 and .40, respectively.
Figure 1.
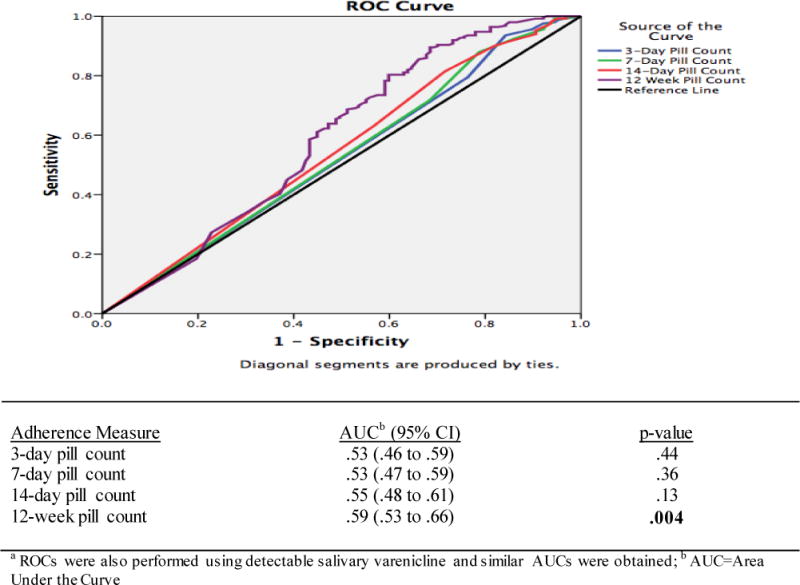
Receiver operating characteristic (ROC) curve of pill counts in discriminating adherence as defined by a biological measure (4.7 ng/ml salivary varenicline cut point a).
3.4 Pill count and varenicline levels by gender, race, and nicotine metabolite ratio (NMR)
A series of ROC analyses were performed separately to explore variability in the relationship between 12-week pill count and salivary varenicline levels based on select sample characteristics. The ROC analysis indicated very little difference between men and women in terms of the relationship between 12-week pill count and salivary varenicline levels (men: AUC = .59, p = .03, N = 207; women: AUC = .58, p = .08, N = 169). Comparison of the AUC values was not significant (χ2 [1] = 2.02, p = .16). There was some difference in the relationship between 12-week pill count and salivary varenicline levels across race; 12-week pill count yielded an AUC of .67 for Caucasian participants (p < .01, N = 203) and an AUC of .54 for non-white participants (p = .43, N = 173); this comparison of the AUC values was not significant (χ2 [1] = 0.08, p = .77). Lastly, 12-week pill count yielded a higher AUC for normal metabolizers of nicotine (AUC = .68, p < .01, N = 174), vs. slow nicotine metabolizers (AUC = .52, p = .73, N = 202) but the comparison of AUC values was not significant (χ2 [1] = 2.71, p = .10).
3.5 Longitudinal changes in withdrawal, craving, affect, and side effect across adherence groups
Longitudinal logistic regression (General Estimating Equations, GEE) was used to examine the relationship between adherence and prospective changes from baseline to end-of-treatment (EOT) (Table 3). All analyses included age, race, and education level as covariates due to significant differences by adherence status (Table 1). For withdrawal, the overall model was not significant (χ2[3] = .77, p = 0.9) and there were no significant interaction effects. There was a significant main effect for time from baseline to week 1 (β = 1.38, 95% CI: 0.35 to 2.40, p = .009), indicating that all participants experienced a significant increase in symptoms of withdrawal from baseline to week 1.
Table 3.
Separate GEE Analyses of Withdrawal, Positive Affect, Negative Affect, Craving, Sum of Side Effect Severity, and Count of Side Effect Symptoms, by Adherence, over Time
| Dependent Variable: Withdrawal | β | 95% CI | p |
|---|---|---|---|
| Constant | 5.99 | 4.05 to 7.94 | <.001 |
| Time (Baseline to Week 1) | 1.38 | 0.35 to 2.40 | .009 |
| Time (Baseline to Week 4) | −0.11 | −1.23 to 1.01 | .85 |
| Time (Baseline to EOT) | −0.54 | −1.65 to 0.56 | .33 |
| Adherence Group | −0.55 | −1.74 to 0.63 | .36 |
| Time (Baseline to Week 1) × Adherence Group | −0.30 | −1.56 to 0.96 | .64 |
| Time (Baseline to Week 4) × Adherence Group | 0.30 | −1.04 to 1.65 | .66 |
| Time (Baseline to EOT) × Adherence Group | 0.02 | −1.32 to 1.36 | .98 |
| Dependent Variable: Positive Affect | β | 95% CI | p |
| Constant | 31.57 | 27.68 to 35.46 | <.001 |
| Time (Baseline to Week 1) | 0.99 | −0.60 to 2.58 | .22 |
| Time (Baseline to Week 4) | 3.04 | 1.30 to 4.78 | .001 |
| Time (Baseline to EOT) | 2.58 | 0.86 to 4.29 | .003 |
| Adherence Group | 0.22 | −1.97 to 2.42 | .84 |
| Time (Baseline to Week 1) × Adherence Group | −0.19 | −2.15 to 1.77 | .85 |
| Time (Baseline to Week 4) × Adherence Group | −2.31 | −4.41 to −0.23 | .03 |
| Time (Baseline to EOT) × Adherence Group | −1.33 | −3.42 to 0.75 | .21 |
| Dependent Variable: Negative Affect | β | 95% CI | p |
| Constant | 11.91 | 10.35 to 13.48 | <.001 |
| Time (Baseline to Week 1) | 1.00 | 0.10 to 1.90 | .03 |
| Time (Baseline to Week 4) | 0.73 | −0.25 to 1.71 | .15 |
| Time (Baseline to EOT) | 0.65 | −0.32 to 1.62 | .19 |
| Adherence Group | −0.11 | −1.10 to 0.87 | .82 |
| Time (Baseline to Week 1) × Adherence Group | −0.57 | −1.68 to 0.54 | .31 |
| Time (Baseline to Week 4) × Adherence Group | −0.77 | −1.95 to 0.41 | .20 |
| Time (Baseline to EOT) × Adherence Group | −0.44 | −1.62 to 0.74 | .47 |
| Dependent Variable: Craving | β | 95% CI | p |
| Constant | 30.19 | 25.96 to 34.43 | <.001 |
| Time (Baseline to Week 1) | −10.89 | −13.34 to −8.44 | <.001 |
| Time (Baseline to Week 4) | −13.50 | −16.17 to −10.83 | <.001 |
| Time (Baseline to EOT) | −14.55 | −17.18 to −11.91 | <.001 |
| Adherence Group | −3.17 | −5.83 to −0.50 | .02 |
| Time (Baseline to Week 1) × Adherence Group | 0.44 | −2.57 to 3.46 | .77 |
| Time (Baseline to Week 4) × Adherence Group | 1.25 | −1.96 to 4.46 | .45 |
| Time (Baseline to EOT) × Adherence Group | 1.80 | −1.40 to 5.00 | .27 |
| Dependent Variable: Sum of Side Effect Severity | β | 95% CI | P |
| Constant | 1.40 | −0.10 to 2.91 | .07 |
| Time (Baseline to Week 1) | 2.63 | 1.77 to 3.49 | <.001 |
| Time (Baseline to Week 4) | 0.65 | −0.28 to 1.58 | .17 |
| Time (Baseline to EOT) | −0.39 | −1.31 to 0.53 | .40 |
| Adherence Group | −0.22 | −1.16 to 0.72 | .65 |
| Time (Baseline to Week 1) × Adherence Group | −0.15 | −1.20 to 0.91 | .79 |
| Time (Baseline to Week 4) × Adherence Group | 1.17 | 0.05 to 2.29 | .04 |
| Time (Baseline to EOT) × Adherence Group | 0.83 | −0.28 to 1.95 | .14 |
| Dependent Variable: Count of Side Effect Symptoms | β | 95% CI | p |
| Constant | 1.39 | 0.09 to 2.69 | .04 |
| Time (Baseline to Week 1) | 2.17 | 1.46 to 2.89 | <.001 |
| Time (Baseline to Week 4) | 0.82 | 0.04 to 1.60 | .04 |
| Time (Baseline to EOT) | −0.25 | −1.02 to 0.53 | .53 |
| Adherence Group | −0.06 | −0.86 to 0.74 | .89 |
| Time (Baseline to Week 1) × Adherence Group | −0.04 | −0.93 to 0.84 | .92 |
| Time (Baseline to Week 4) × Adherence Group | 0.78 | −0.16 to 1.72 | .10 |
| Time (Baseline to EOT) × Adherence Group | 0.73 | −0.21 to 1.67 | .13 |
Note: Constant coefficient provides reference value for each individual model. All analyses included age, race, and education level as covariates as determined from Table 1.
For positive affect, the overall model was not significant (χ2[3] = 6.02, p = 0.11). There were significant longitudinal changes in positive affect for the sample as a whole (baseline to week 4; β = 3.04, 95% CI: 1.30 to 4.78, p = .001; and baseline to EOT; β = 2.58, 95% CI: 0.86 to 4.29, p = .003). Participants treated with varenicline, regardless of adherence status, reported greater positive affect at week 4 and at the end of treatment compared to baseline.
For negative affect, the overall model was not significant (χ2[3] = 1.83, p = 0.6). Within the model, there was a significant main effect for time (baseline to week 1; β = 1, 95% CI: 0.10 to 1.90, p = .03), with all participants experiencing an increase in negative affect over the first 2 weeks.
For craving, the overall model was not significant (χ2[3] = 1.44, p = 0.7) and there were no interaction effects. But, there was a main effect for adherence (β = −3.17, 95% CI: −5.83 to −0.50, p = .02), indicating that craving was significantly lower for those who were adherent. There were also significant longitudinal changes in craving for the entire sample (baseline to week 1; β = −10.89, 95% CI: −13.34 to −8.44, p < .001; baseline to week 4; β = −13.50, 95% CI: −16.17 to −10.83, p < .001; and baseline to EOT; β = −14.55, 95% CI: −17.18 to −11.92, p < .001), indicating that for all participants, craving decreased over time.
For side effect severity, the overall model approached significance (χ2[3] = 7.37, p = 0.06). There was a significant main effect for time (baseline to week 1; β = 2.63, 95% CI: 1.77 to 3.49, p <.001) and a significant interaction effect from baseline to week 4 (β = 1.17, 95% CI: 0.05 to 2.29, p = .04). These results indicate that all participants experienced an increase in side effect severity from baseline to week 1 but side effect severity levels decreased significantly by week 4 for those who were non-adherent.† The model for side effect count was not significant (χ2[3] = 5.27, p = 0.15). There were no significant interaction effects as well (see Table 3). There were significant main effects for time (baseline to week 1; β = 2.17, 95% CI: 1.46 to 2.89, p < .001; and baseline to week 4; β = 0.82, 95% CI: 0.04 to 1.60, p = .04), indicating that the entire sample experienced increases in side effect count from baseline to week 1 and week 4.
4. Discussion
Pill count is widely used as a measure of adherence in smoking cessation trials, yet little is known about the validity of this adherence measure and the impact of adherence on longitudinal changes during a quit attempt. Our study examined pill count as a measure of adherence taken over 4 different time periods (3-day, 7-day, 14-day, and 12-week) relative to a biological measure of adherence. We used salivary varenicline level as the reference standard since previous data has shown that a biological measure may be more accurate than pill count as varenicline’s pharmacokinetics are particularly suited for drug monitoring (Lam & Fresco, 2015; Vermeire et al., 2001). We also examined longitudinal changes in withdrawal, craving, affect, and side effects over the course of treatment among adherent and non-adherent participants. We discuss the main findings and implications of the results below.
First, out of the 4 pill count measures assessed, 12-week pill count had the strongest correlation to varenicline levels, the best rate of correct classification when compared with salivary varenicline, and the only significant AUC value, with a sensitivity of .80 and specificity of .40. The number of pills taken in the 3-, 7-, and 14-days prior to the saliva assay were not effective at discriminating adherence when salivary concentrations were considered the gold standard using a cut-off of 4.7 ng/ml. Similar findings were obtained when we conducted ROC analyses using detectable salivary varenicline (i.e. 1 ng/ml) as the adherence cut-off These results diverge from those of Buchanan et al., who found that 3-day pill count was the measure most strongly associated with plasma varenicline levels (Buchanan et al., 2012). Buchanan et al. did not examine 12-week pill count as a measure of adherence and their sample was much smaller (N=55) and composed entirely of African American smokers. The poor association observed in our study between pill count and varenicline levels (see Table 2) and the fact that 17.9 to 19.3% of those that reported taking 100% of pills in the last 3, 7 and 14 days had undetectable varenicline levels, indicate the lack of accuracy and the overestimation of adherence by pill counts. This suggests that pill count may be a poor measure of adherence within smoking cessation trials – a conclusion that has been suggested in the existing literature of substance use treatment trials (McRae-Clark et al., 2015). In a treatment trial for cannabis dependence, McRae-Clark et al found that pill count overestimated adherence, and agreement between pill count and busipirone levels ranged from poor to moderate across 6 different time points (Kappa ranging from .24 to .55) (McRae-Clark et al., 2015). In addition, it was also unexpected for 12-week pill count to better approximate salivary varenicline levels than the 3-, 7-, and 14-day measures, since the latter measures are more proximate to the actual biological assay. Perhaps this suggests a different direction of effect where adherent individuals as defined by a biological measure (i.e., salivary varenicline) early in the trial were more likely to take the prescribed pills throughout the 12-week trial. Alternatively, this may be attributed to the increased variation and/or increase in the accuracy of pill count in capturing adherence over the time of the trial due to increased doctor-patient contact as well as changes to patient perception regarding his or her own health (Vermeire et al., 2001). More longitudinal research into patient factors that alter adherence over the course of a smoking cessation trial is needed and may shed further light on the associations between pill count and a biological measure of adherence. As such, in future smoking cessation clinical trials where biological measures of adherence are unavailable, researchers should record pill use across the entire treatment phase. It should be noted, however, that due to the low specificity of the 12-week pill count (specificity = .40), a biological measure may provide a more accurate picture of non-adherence. Further, while most adherence based on pill count data is defined as taking 80% of the prescribed medication, the cut-point for 12-week pill count that best approximated varenicline levels corresponded to 60% of the medication taken. This could relate to the assessment of varenicline levels at a single point in time or that 80% is too stringent of a cut-point.
Second, the association between 12-week pill count and a biological measure of varenicline adherence varied little across sub-groups of smokers. The ROC analysis showed that 12-week pill count yielded a higher AUC for Caucasian participants and for normal metabolizers of nicotine, though not statistically significant. Any variability in AUC values across racial groups could be associated with lower overall rates of adherence among non-white participants noted here and elsewhere (Shelley et al., 2015). Likewise, any effect of the rate of nicotine metabolism on the validity of 12-week pill count could relate to the increased therapeutic effects of varenicline for faster metabolizers of nicotine (Lerman et al., 2015). These results, however, are exploratory, particularly given the need to divide the sample into sub-groups which reduces statistical power for these analyses.
Finally, our study found that longitudinal changes in withdrawal, craving, affect, and side effects over the course of the quit attempt were not related to adherence (Table 3). Each of the GEE models, contrary to our expectations, were not significant, suggesting that these psychological, smoking-related, and medication-related variables may not be drivers of non-adherence to varenicline in the context of a smoking cessation clinical trial. Moving forward, complexities surrounding the potential confound and reciprocal relationships between the longitudinal changes, relapse, and adherence should be addressed. When we examined our sample of treatment-seeking smokers, those that are younger smokers, less educated, and non-white showed significantly lower varenicline adherence, indicating the potential need for targeted interventions to these sub-groups of smokers to ensure consistent taking of varenicline as prescribed to maximize their chance of success in quitting smoking. Future research is needed to explore the nature of non-adherence among participants in smoking cessation clinical trials so that the content of adherence interventions could be developed and evaluated.
This study is the first to our knowledge to evaluate pill counts against a biological measure of adherence in a large and racially diverse smoking cessation clinical trial. Biological measures of adherence are considered to be more accurate than self-report measures (Vermeire et al., 2001); varenicline is a good candidate for adherence monitoring as it does not undergo significant metabolism and has long elimination half-life. However, biological measures are limited to a specific point in time and can be relatively more expensive to obtain than pill count data. Ideally, a multi- measure approach would be used. Electronic medication packaging devices can be complementary to biological measures as they identify medication-taking patterns as well as providing some indication of adherence. Self-report questionnaires, such as the 8-item Morisky Medication Adherence Scale (MMAS-8), in combination with biological measures, may be able to identify patients’ medication taking behaviors as well as barriers to adherence (Lam & Fresco, 2015).
In terms of study limitations, our approach was based on translating the cut-point for varenicline concentrations identified with plasma to saliva and should not be interpreted to represent therapeutic levels of medication use. Second, the results may not be generalizable to all smokers since they are based on treatment-seeking smokers recruited for a clinical trial, which excluded smokers with co-morbid serious mental illness and other substance use disorders, and those smoking less than 10 cigarettes per day. Third, the findings may not be applicable to all forms of treatment, including bupropion and nicotine replacement therapies. Lastly, the analyses that explored variability in the relationship between 12-week pill count and varenicline levels based on select sample characteristics may have been under-powered to detect significant effects.
5. Conclusions
This study presents novel findings on the validity of pill count in predicting adherence as defined by a biological measure. We translated a cut-point for adherence from plasma to salivary varenicline, showed the degree to which it is associated with pill-count measures of varenicline adherence, explored variability in the use of 12-week pill count to approximate adherence based on salivary varenicline concentrations across subsets of smokers, and found that longitudinal changes in withdrawal and craving, negative and positive affect, and side effect count and severity were not related to varenicline adherence. These results can help guide assessment of adherence to varenicline within smoking cessation clinical trials by supporting the use of 12-week pill count as a measure of adherence and suggest the need to examine novel factors associated with treatment adherence.
Study Highlights.
This study compared a biological measure of adherence to a self-report measure.
Association between drug levels and pill counts was very poor.
Association between drug levels and pill counts varied little across sub-groups.
Compared to varenicline levels, pill counts substantially overestimate adherence.
Use of pill counts in smoking cessation may not be a useful measure of adherence.
Acknowledgments
We also acknowledge the analytical support of Bin Zhao, Maria Novalen, and Ning Chen.
Role of Funding Source
The data for this study were from a parent trial supported by grant U01 DA20830 from the National Institute on Drug Abuse, the National Cancer Institute, the National Human Genome Research Institute, and the National Institute on General Medical Sciences to Drs. Lerman and Tyndale. Additional support for this study was provided by grants from the National Institute on Drug Abuse (R01 DA033681) and from the National Cancer Institute (R01 CA165001 and R01 CA202699) to Dr. Schnoll and from a GRAND award to Dr. Tyndale. Pfizer provided varenicline and placebo free of charge for the parent trial.
Footnotes
Publisher's Disclaimer: This is a PDF file of an unedited manuscript that has been accepted for publication. As a service to our customers we are providing this early version of the manuscript. The manuscript will undergo copyediting, typesetting, and review of the resulting proof before it is published in its final citable form. Please note that during the production process errors may be discovered which could affect the content, and all legal disclaimers that apply to the journal pertain.
Contributors
Annie R. Peng and Mark Morales assisted with the conceptualization of this study, led the analyses, and oversaw the preparation of the manuscript. Larry W Hawk Jr, Paul Cinciripini, and Tony P George served as site Principal Investigators and oversaw data collection. E Paul Wileyto assisted with data analysis. Neal L Benowitz and Nicole L Nollen provided access to unpublished data and offered guidance on the analyses. Caryn Lerman and Rachel F Tyndale ascertained the funding for the parent trial and assisted with data analysis and manuscript preparation. Robert Schnoll served as one of the site Principal Investigators, helped to conceptualize this study, and assisted with data analysis and manuscript preparation. All authors have approved the article.
Conflict of Interest
Dr. Schnoll receives medication and placebo free of charge from Pfizer for other clinical trials and has provided consultation to Pfizer and GlaxoSmithKline. Dr. Tyndale has consulted for Apotex. Drs. George and Cinciripini have had investigator and industry sponsored research funding from Pfizer, and Dr. George is a consultant to Novartis. These companies had no involvement in this study.
Side effect severity analyses were run for just the nausea side effect given its prominence as a side effect of varenicline but the models were not statistically significant.
References
- Brown RBE, Sales S, Whiteley J, Evans D, Miller I. Reliability and Validity of a Smoking Timeline Follow-Back Interview. Psychology of Addictive Behaviors. 1998;12(2):101–112. [Google Scholar]
- Buchanan TS, Berg CJ, Cox LS, Nazir N, Benowitz NL, Yu L, Nollen NL. Adherence to varenicline among African American smokers: an exploratory analysis comparing plasma concentration, pill count, and self-report. Nicotine Tob Res. 2012;14(9):1083–1091. doi: 10.1093/ntr/ntr333. [DOI] [PMC free article] [PubMed] [Google Scholar]
- Cahill K, Stevens S, Perera R, Lancaster T. Pharmacological interventions for smoking cessation: an overview and network meta-analysis. Cochrane Database Syst Rev. 2013;5:Cd009329. doi: 10.1002/14651858.CD009329.pub2. [DOI] [PMC free article] [PubMed] [Google Scholar]
- Catz SL, Jack LM, McClure JB, Javitz HS, Deprey M, Zbikowski SM, Swan GE. Adherence to varenicline in the COMPASS smoking cessation intervention trial. Nicotine Tob Res. 2011;13(5):361–368. doi: 10.1093/ntr/ntr003. [DOI] [PMC free article] [PubMed] [Google Scholar]
- Chenoweth MJ, Novalen M, Hawk LW, Jr, Schnoll RA, George TP, Cinciripini PM, Tyndale RF. Known and novel sources of variability in the nicotine metabolite ratio in a large sample of treatment-seeking smokers. Cancer Epidemiol Biomarkers Prev. 2014;23(9):1773–1782. doi: 10.1158/1055-9965.EPI-14-0427. [DOI] [PMC free article] [PubMed] [Google Scholar]
- Cox LS, Tiffany ST, Christen AG. Evaluation of the brief questionnaire of smoking urges (QSU-brief) in laboratory and clinical settings. Nicotine Tob Res. 2001;3(1):7–16. doi: 10.1080/14622200020032051. [DOI] [PubMed] [Google Scholar]
- Dempsey D, Tutka P, Jacob P, 3rd, Allen F, Schoedel K, Tyndale RF, Benowitz NL. Nicotine metabolite ratio as an index of cytochrome P450 2A6 metabolic activity. Clin Pharmacol Ther. 2004;76(1):64–72. doi: 10.1016/j.clpt.2004.02.011. [DOI] [PubMed] [Google Scholar]
- Dutta S, Reed RC. Effect of delayed and/or missed enteric-coated divalproex doses on valproic acid concentrations: simulation and dose replacement recommendations for the clinician. J Clin Pharm Ther. 2006;31(4):321–329. doi: 10.1111/j.1365-2710.2006.00739.x. [DOI] [PubMed] [Google Scholar]
- Ebbert JO, Wyatt KD, Hays JT, Klee EW, Hurt RD. Varenicline for smoking cessation: efficacy, safety, and treatment recommendations. Patient Prefer Adherence. 2010;4:355–362. doi: 10.2147/ppa.s10620. [DOI] [PMC free article] [PubMed] [Google Scholar]
- Faessel HM, Obach RS, Rollema H, Ravva P, Williams KE, Burstein AH. A review of the clinical pharmacokinetics and pharmacodynamics of varenicline for smoking cessation. Clin Pharmacokinet. 2010;49(12):799–816. doi: 10.2165/11537850-000000000-00000. [DOI] [PubMed] [Google Scholar]
- Farmer KC. Methods for measuring and monitoring medication regimen adherence in clinical trials and clinical practice. Clin Ther. 1999;21(6):1074–1090. doi: 10.1016/S0149-2918(99)80026-5. discussion 1073. [DOI] [PubMed] [Google Scholar]
- Haynes RB, Ackloo E, Sahota N, McDonald HP, Yao X. Interventions for enhancing medication adherence. Cochrane Database Syst Rev. 2008;(2):Cd000011. doi: 10.1002/14651858.CD000011.pub3. [DOI] [PubMed] [Google Scholar]
- Heatherton TF, Kozlowski LT, Frecker RC, Fagerstrom KO. The Fagerstrom Test for Nicotine Dependence: a revision of the Fagerstrom Tolerance Questionnaire. Br J Addict. 1991;86(9):1119–1127. doi: 10.1111/j.1360-0443.1991.tb01879.x. [DOI] [PubMed] [Google Scholar]
- Herkes GK, Eadie MJ. Possible roles for frequent salivary antiepileptic drug monitoring in the management of epilepsy. Epilepsy Res. 1990;6(2):146–154. doi: 10.1016/0920-1211(90)90090-i. [DOI] [PubMed] [Google Scholar]
- Hollands GJ, McDermott MS, Lindson-Hawley N, Vogt F, Farley A, Aveyard P. Interventions to increase adherence to medications for tobacco dependence. Cochrane Database Syst Rev. 2015;(2):Cd009164. doi: 10.1002/14651858.CD009164.pub2. [DOI] [PubMed] [Google Scholar]
- Hughes JR, Hatsukami D. Signs and symptoms of tobacco withdrawal. Arch Gen Psychiatry. 1986;43(3):289–294. doi: 10.1001/archpsyc.1986.01800030107013. [DOI] [PubMed] [Google Scholar]
- Jacob P, III, Yu L, Duan M, Ramos L, Yturralde O, Benowitz NL. Determination of the nicotine metabolites cotinine and trans-3′-hydroxycotinine in biologic fluids of smokers and non-smokers using liquid chromatography–tandem mass spectrometry: Biomarkers for tobacco smoke exposure and for phenotyping cytochrome P450 2A6 activity. Journal of Chromatography B. 2011;879(3–4):267–276. doi: 10.1016/j.jchromb.2010.12.012. [DOI] [PMC free article] [PubMed] [Google Scholar]
- Jamal A, King BA, Neff LJ, Whitmill J, Babb SD, Grafunder CM. Current Cigarette Smoking Among Adults - United States, 2005–2015. MMWR Morb Mortal Wkly Rep. 2016;65(44):1205–1211. doi: 10.15585/mmwr.mm6544a2. [DOI] [PubMed] [Google Scholar]
- Killen JD, Robinson TN, Ammerman S, Hayward C, Rogers J, Stone C, Schatzberg AF. Randomized clinical trial of the efficacy of bupropion combined with nicotine patch in the treatment of adolescent smokers. J Consult Clin Psychol. 2004;72(4):729–735. doi: 10.1037/0022-006X.72.4.729. [DOI] [PubMed] [Google Scholar]
- Lam WY, Fresco P. Medication Adherence Measures: An Overview. Biomed Res Int. 2015;2015:217047. doi: 10.1155/2015/217047. [DOI] [PMC free article] [PubMed] [Google Scholar]
- Landmark CJ, Rytter E, Johannessen SI. Clinical use of antiepileptic drugs at a referral centre for epilepsy. Seizure. 2007;16(4):356–364. doi: 10.1016/j.seizure.2007.02.006. [DOI] [PubMed] [Google Scholar]
- Lerman C, Schnoll RA, Hawk LW, Jr, Cinciripini P, George TP, Wileyto EP, Tyndale RF. Use of the nicotine metabolite ratio as a genetically informed biomarker of response to nicotine patch or varenicline for smoking cessation: a randomised, double-blind placebo-controlled trial. Lancet Respir Med. 2015;3(2):131–138. doi: 10.1016/S2213-2600(14)70294-2. [DOI] [PMC free article] [PubMed] [Google Scholar]
- Liberman JN, Lichtenfeld MJ, Galaznik A, Mastey V, Harnett J, Zou KH, Kirchner HL. Adherence to varenicline and associated smoking cessation in a community-based patient setting. J Manag Care Pharm. 2013;19(2):125–131. doi: 10.18553/jmcp.2013.19.2.125. [DOI] [PMC free article] [PubMed] [Google Scholar]
- Malone SA, Eadie MJ, Addison RS, Wright AW, Dickinson RG. Monitoring salivary lamotrigine concentrations. J Clin Neurosci. 2006;13(9):902–907. doi: 10.1016/j.jocn.2005.12.037. [DOI] [PubMed] [Google Scholar]
- McClure JB, Swan GE, Jack L, Catz SL, Zbikowski SM, McAfee TA, Javitz H. Mood, side-effects and smoking outcomes among persons with and without probable lifetime depression taking varenicline. J Gen Intern Med. 2009;24(5):563–569. doi: 10.1007/s11606-009-0926-8. [DOI] [PMC free article] [PubMed] [Google Scholar]
- McDonald HP, Garg AX, Haynes RB. Interventions to enhance patient adherence to medication prescriptions: scientific review. Jama. 2002;288(22):2868–2879. doi: 10.1001/jama.288.22.2868. [DOI] [PubMed] [Google Scholar]
- McRae-Clark AL, Baker NL, Sonne SC, DeVane CL, Wagner A, Norton J. Concordance of Direct and Indirect Measures of Medication Adherence in A Treatment Trial for Cannabis Dependence. J Subst Abuse Treat. 2015;57:70–74. doi: 10.1016/j.jsat.2015.05.002. [DOI] [PMC free article] [PubMed] [Google Scholar]
- Mitchell WG, Scheier LM, Baker SA. Adherence to treatment in children with epilepsy: who follows “doctor’s orders”? Epilepsia. 2000;41(12):1616–1625. doi: 10.1111/j.1499-1654.2000.001616.x. [DOI] [PubMed] [Google Scholar]
- Patterson F, Jepson C, Strasser AA, Loughead J, Perkins KA, Gur RC, Lerman C. Varenicline improves mood and cognition during smoking abstinence. Biol Psychiatry. 2009;65(2):144–149. doi: 10.1016/j.biopsych.2008.08.028. [DOI] [PMC free article] [PubMed] [Google Scholar]
- Pullar T, Kumar S, Tindall H, Feely M. Time to stop counting the tablets? Clin Pharmacol Ther. 1989;46(2):163–168. doi: 10.1038/clpt.1989.121. [DOI] [PubMed] [Google Scholar]
- Schmitz JM, Stotts AL, Mooney ME, Delaune KA, Moeller GF. Bupropion and cognitive-behavioral therapy for smoking cessation in women. Nicotine Tob Res. 2007;9(6):699–709. doi: 10.1080/14622200701365335. [DOI] [PubMed] [Google Scholar]
- Schnoll RA, George TP, Hawk L, Cinciripini P, Wileyto P, Tyndale RF. The relationship between the nicotine metabolite ratio and three self-report measures of nicotine dependence across sex and race. Psychopharmacology (Berl) 2014;231(12):2515–2523. doi: 10.1007/s00213-013-3421-1. [DOI] [PMC free article] [PubMed] [Google Scholar]
- Schnoll RA, Patterson F, Wileyto EP, Tyndale RF, Benowitz N, Lerman C. Nicotine metabolic rate predicts successful smoking cessation with transdermal nicotine: a validation study. Pharmacol Biochem Behav. 2009;92(1):6–11. doi: 10.1016/j.pbb.2008.10.016. [DOI] [PMC free article] [PubMed] [Google Scholar]
- Shelley D, Tseng TY, Gonzalez M, Krebs P, Wong S, Furberg R, Cleland CM. Correlates of Adherence to Varenicline Among HIV+ Smokers. Nicotine Tob Res. 2015;17(8):968–974. doi: 10.1093/ntr/ntv068. [DOI] [PMC free article] [PubMed] [Google Scholar]
- Shiffman S. Use of more nicotine lozenges leads to better success in quitting smoking. Addiction. 2007;102(5):809–814. doi: 10.1111/j.1360-0443.2007.01791.x. [DOI] [PubMed] [Google Scholar]
- Specht U, Elsner H, May TW, Schimichowski B, Thorbecke R. Postictal serum levels of antiepileptic drugs for detection of noncompliance. Epilepsy Behav. 2003;4(5):487–95. doi: 10.1016/s1525-5050(03)00151-3. [DOI] [PubMed] [Google Scholar]
- Helen G, Novalen M, Heitjan DF, Dempsey D, Jacob P, Aziziyeh A, Benowitz NL. Reproducibility of the Nicotine Metabolite Ratio in Cigarette Smokers. Cancer epidemiology, biomarkers & prevention: a publication of the American Association for Cancer Research, cosponsored by the American Society of Preventive Oncology. 2012;21(7):1105–1114. doi: 10.1158/1055-9965.EPI-12-0236. [DOI] [PMC free article] [PubMed] [Google Scholar]
- Swan GE, Javitz HS, Jack LM, Curry SJ, McAfee T. Heterogeneity in 12-month outcome among female and male smokers. Addiction. 2004;99(2):237–250. doi: 10.1111/j.1360-0443.2003.00629.x. [DOI] [PubMed] [Google Scholar]
- Tanner JA, Novalen M, Jatlow P, Huestis MA, Murphy SE, Kaprio J, Tyndale RF. Nicotine metabolite ratio (3-hydroxycotinine/cotinine) in plasma and urine by different analytical methods and laboratories: implications for clinical implementation. Cancer Epidemiology, Biomarkers and Prevention. 2015;24(8):1239–1246. doi: 10.1158/1055-9965.EPI-14-1381. [DOI] [PMC free article] [PubMed] [Google Scholar]
- Vermeire E, Hearnshaw H, Van Royen P, Denekens J. Patient adherence to treatment: three decades of research. A comprehensive review. J Clin Pharm Ther. 2001;26(5):331–342. doi: 10.1046/j.1365-2710.2001.00363.x. [DOI] [PubMed] [Google Scholar]
- Vital signs: current cigarette smoking among adults aged >/=18 years—United States 2005–2010. MMWR Morb Mortal Wkly Rep. 2011;60(35):1207–1212. [PubMed] [Google Scholar]
- Watson D, Clark LA, Tellegen A. Development and validation of brief measures of positive and negative affect: the PANAS scales. J Pers Soc Psychol. 1988;54(6):1063–1070. doi: 10.1037//0022-3514.54.6.1063. [DOI] [PubMed] [Google Scholar]
- Williams J, Patsalos PN, Mei Z, Schapel G, Wilson JF, Richens A. Relation between dosage of carbamazepine and concentration in hair and plasma samples from a compliant inpatient epileptic population. Ther Drug Monit. 2001;23(1):15–20. doi: 10.1097/00007691-200102000-00004. [DOI] [PubMed] [Google Scholar]