

Abstract
A study of the literature indicates that chloroplasts synthesise a range of molecules, many of which have nutritional value for humans, but the nutritional credentials of chloroplasts recovered from plant cells are not established. Chloroplast-rich-fractions (CRFs) were prepared from green plant species and the macro- and micro-nutrient composition compared with the whole leaf materials (WLMs). The results indicated that, on a dry weight basis, CRF material from a range of green biomass was enriched in lipids and proteins, and in a range of micronutrients compared with the WLM. Vitamins E, pro-vitamin A, and lutein were all greater in CRF preparations. Of the minerals, iron was most notably concentrated in CRF. Spinach CRFs possessed the highest α-tocopherol [62 mg 100 g−1, dry weight (DW)], β-carotene (336 mg 100 g−1 DW) and lutein (341 mg 100 g−1 DW) contents, whilst grass CRFs had the highest concentration of alpha-linolenic acid (ALA) (69.5 mg g−1). The higher concentrations of α-tocopherol, β-carotene, lutein, ALA and trace minerals (Fe and Mn) in CRFs suggested their potential use as concentrated ingredients in food formulations deficient in these nutrients.
Electronic supplementary material
The online version of this article (doi:10.1007/s13197-017-2711-8) contains supplementary material, which is available to authorized users.
Keywords: Chloroplasts, Beta-carotene, Lutein, Alpha-tocopherol, Alpha-linolenic acid, Iron
Introduction
It is well established that the global population is continually increasing, thereby creating increasing pressure on finite food resources. In the year 2050, the world’s fast growing population is anticipated to reach 9.1 billion, with a shrinking food supply, particularly impacting developing countries (FAO 2009_ENREF_2). This will exacerbate the already limited access to healthy plant-based foods by those on low incomes.
Epidemiological studies suggest that high dietary intakes of fruits and vegetables is associated with reduced risks of developing a range of chronic diseases, including cancer and cardiovascular diseases (Dauchet et al. 2006; Mirmiran et al. 2009_ENREF_25). Antioxidant vitamins such as tocopherols (vitamin E), β-carotene (pro-vitamin A) and ascorbic acid (vitamin C) are found in high concentrations in fruits and vegetables (Bergquist et al. 2006; Singh et al. 2016). It is suggested that these antioxidant-rich compounds are involved in the protection against these chronic diseases (Abuajah et al. 2015).
Chloroplasts are a type of semi-autonomous organelle found in leaves which are responsible for photosynthesis, the process where sunlight energy is converted into chemical energy. By structure, chloroplasts are lens-shaped bodies with a diameter of approximately 5–10 μm (Gross 1991). Although photosynthesis has been studied extensively in chloroplasts, and it is recognised that this organelle is responsible for the biosynthesis of a range of molecules, such as; amino acids, fatty acids, tocopherols, carotenoids, plant hormones etc. (Gross 1991; Walker and Barber 1976), no one has recovered chloroplasts to evaluate their credentials as particulates rich in a range of nutrients that can be recovered from green biomass using a physical process without the need for solvents.
Green leafy biomass (vegetables, underutilised plants, and field waste) represents a potentially valuable source of a range of micro and macro (lipids, proteins and carbohydrates) nutrients. They consist largely of water (80–90%) and fibre; chloroplasts make up about 10–20% of the total solids, so isolating the chloroplasts should lead to increased nutritional content per unit mass compared with the fresh leaf. Consumption of liberated chloroplasts may deliver a further benefit over eating whole leaves: recent research has shown that the bioavailability of micronutrients from plant material, such as carotenoids, is inhibited due to the need to liberate them from the cellulosic food matrix (Eriksen et al. 2017), and that the plant cell wall is a limiting factor for nutrient bioaccessibility (Grundy et al. 2015; Palmero et al. 2013). The intake of liberated chloroplasts should therefore boost micronutrient release during digestion (bioaccessibility) and hence increase bioavailability (uptake into the body).
Therefore we hypothesise that the liberation of intact, chloroplasts from plant cells of abundant green biomass (which could be food waste or biomass not currently used in the food chain), is a simple way to concentrate nutrients without the need of using solvents. Furthermore, due to their concentration of nutrients, liberated and stabilised chloroplasts (even a non-pure/crude preparation) could be used as a functional food ingredient/fortifying agent at relatively low levels of addition to food/feed formulations.
Recovering nutritionally-rich fractions of chloroplasts from unconventional plants which have a composition comparable to those of well-known sources, such as spinach and kale, could create new, sustainable, functional food ingredients from green plants, provided that any toxicity issues of non-conventional plants are resolved. This approach may provide a way to ensure that poorer societies have access to food rich in valuable micronutrients. There are also a range of commercial opportunities to use isolated chloroplasts in food and feed formulations. But despite the apparent nutritional credentials of chloroplasts, no reports appear to have been published on their potential as functional food ingredients. Therefore, the aim of this study was to recover and concentrate a range of vital nutrients in the form of chloroplasts [more precisely chloroplast-rich fractions (CRFs)] and comparing their nutritional potential to their equivalent whole leaf material (WLM). Four green leafy plant species were selected as a model for conventional (spinach and kale) and unconventional (nettles and grass) materials for functional food ingredients.
Materials and methods
Sample (green materials) preparation
Spinach (Spinacia oleracea) and kale (Brassica oleracea var acephala) were obtained from local supermarkets. Whereas, nettles (Urtica dioica) and grass (Paspalum notatum) were freshly harvested from the grounds of the School of Biosciences Campus. When samples were brought to the laboratory, they were washed with tap water, cut into smaller pieces and split into two portions; one designated to make chloroplast-rich fractions (CRFs) and the other for whole leaf materials (WLMs).
Whole leaf material (WLM)
WLMs (100 g) were frozen at −80 °C for a couple of hours prior to freeze drying (Edwards Freeze Dryer, Super Modulyo) for 48 h at −60 °C. During the freeze drying process samples were protected from light exposure. Samples were then ground to homogeneous powder (1 mm) using mortar and pestle under dim light and stored in a tightly closed plastic containers at room temperature.
Chloroplast-rich fraction (CRF)
Green leaf tissues (100 g) were homogenised in a kitchen blender for 30 s with 0.3 M sucrose solution in the ratio of 1:6 (w/v). The homogenate was then filtered by pressing through a double-layered cheese cloth. The filtrate was centrifuged (Thermo Jouan CR3i multifunction centrifuge) at 1300 RCF for 10 min at 4 °C. The supernatant was decanted off from the chloroplast pellet and centrifuged again under the same conditions. The resulting supernatant was discarded and the chloroplast pellets were weighed. Chloroplast pellets were frozen at −80 °C prior to freeze drying and stored same conditions as those of WLMs.
Moisture content
Three samples of each of the materials were weighed in trays and then placed in an oven at 105 °C and reweighed after 24 h. The moisture content was measured as % weight loss.
Sucrose (for CRFs) content
A 0.1 g sample was diluted with 10 mL distilled water and centrifuged (Thermo Jouan CR3i multifunction centrifuge) at 2400 RCF for 5 min at 4 °C. The samples were then filtered through 0.45 µm syringe filters into amber HPLC tubes. A set of sucrose standards was prepared (7.5–0.5 mg mL−1). The sucrose was analysed using HPLC (Jasco AS2055 sample + Pu-980 pump, Japan) coupled with a refractive index detector (Jasco RI-2031 Plus Intelligent RI Detector, Japan), and resolved using a Phenomenex Luna 5 µm NH2 (100A 2 mm id × 25 cm) column with 80% acetonitrile in water (HPLC grade) as the mobile phase. The injection volume was 10 μL and the mobile phase flow rate was set at 0.7 mL min−1. When sucrose was quantified, residual sucrose in CRFs was adjusted for i.e. the values were normalized and all values presented in the subsequent results of CRFs are non-sucrose.
Ash content
Ash content of CRFs and WLMs was determined according to ISO (2002).
Protein Content
Protein content of freeze dried CRFs and WLMs was determined using a N2 based protocol. Samples were placed in a tared tin capsule and precisely weighed using a 4 digit balance. Samples ranged in weight from 2 to 3 mg. Two standards (Sulphanilamide STD) were also weighed. All samples, along with the standards, were run on an Organic Elemental Analysis Eager Experience (Flash 200, Fisher Scientific). The N2 values converted to protein using factor of 6.25.
Amino acid analysis
Amino acid concentrations in CRF and WLM were determined by oxidising samples with a hydrogen peroxide/formic acid/phenol mixture. Excess oxidation reagent was decomposed with sodium metabisulphite. The oxidised samples were then hydrolysed with 6 M HCl acid for 18 h at 110 °C under nitrogen. The pH of the hydrolysate was then adjusted to 2.2 with 7.5 M NaOH. Aliquots of these samples were transferred to 20 mL centrifuge tubes and centrifuged (Biofuge stratos) at 2917 RCF for 2 min; this was then syringe filtered through 0.22 μm filters into glass vials. The amino acids were separated by ion exchange chromatography (Pharmacia Biochrom, Cambridge) using sodium citrate buffers and determined by reaction with ninhydrin using photometric detection at 570 nm (440 nm for proline).
Lipid extraction
Lipids were extracted from the freeze-dried materials (CRFs or WLMs) using a modified Folch et al. (1957) technique. Samples (0.1 g freeze dried) were dissolved with 1.2 mL (Chloroform: methanol 2:1) and vortexed (1 min). To this 0.5 mL of a 0.9% NaCl solution was added, and the mixture was vortexed again before being centrifuged, using a Thermo Jouan CR3i multifunction centrifuge (1300 RCF for 10 min at 4 °C). The lower phase, containing the lipids and chloroform, was transferred to a clean vessel. A further 1.2 mL of chloroform: methanol (2:1) was added to the residue, vortexed and centrifuged again. The lipid phase was removed and pooled with the original lipid layer before a third sequence was completed. Pooled lipids were centrifuged again to separate the lipids from any residual contents, and then dried under a flow of N2. The combined lipid extracts were then weighed and quantified gravimetrically.
Chlorophyll and total carotenoid analysis
The pigment content (Chlorophylls a and b, as well as total carotenoids) of the lipid extracts was analysed using a spectrophotometer (CARY 50 Probe UV–visible). Total lipids (from section entitled Lipid Extraction) were dried and dissolved in 1 mL acetone (HPLC grade) and further diluted by a factor of 1:1000. An aliquot of this solution was added to a glass cuvette. Samples were exposed to selected wavelengths (661.6 nm for chlorophyll (a), 644.8 nm for chlorophyll (b) and 470 nm for total carotenoids) and the absorbance recorded using acetone as the blank. Pigment concentrations (µg mL−1) were calculated using equations by Lichtenthaler and Buschmann (2001).
Analysis of fatty acid composition
Fatty acid profile of the CRFs and WLMs was determined by esterification of total lipid extracts, from section entitled Lipid Extraction, to fatty acid methyl esters (FAMEs) and analysed using gas chromatography-mass spectrometry (GC–MS). The dried lipid extracts were dissolved in 2 mL of chloroform; 100 µL (10 mg mL−1) of methyl pentadecanoate (internal standard) was then added to 1 mL of the lipid extract in chloroform. Esterification was achieved through the addition of 200 µL of trimethylsulfonium hydroxide. The solution was then left, to ensure complete conversion, for 10 min before injection onto the GC–MS (Thermo Scientific, DSQII). GC conditions and column were based on standard protocol developed in our laboratory (Bahrami et al. 2014).
Vitamin E (tocopherols) analysis
Vitamin E content of freeze dried CRFs and WLMs was determined by measuring the concentration of α, β, ϒ and δ-tocopherols by HPLC (using an Agilent 1100 series) with Fluorescence detector using a modification of the method of Rogers et al. (1993). Samples were prepared through the addition of 800 µL of methanol [containing 1% butylated hydroxytoluene (BHT)] to 0.1 g freeze dried CRFs or WLMs. The material was physically broken up to assist in the solvent extraction using a mini bead beater (MBB-607EUR) at maximum speed (3450 rpm) for 1 min. The tube was then transferred to a centrifuge (Thermo Heraeus Fresco 21) and spun at 16200 RCF for 5 min at 4 °C; 400 µL of the supernatant was transferred into a clean vessel. A further 800 µL of methanol was added to the MBB tube, and the process repeated to ensure quantitative recovery of tocopherols. The pooled supernatants (2 mL total) were dried under a flow of nitrogen gas, and methanol (containing 1% BHT) (2 mL) was added and vortexed before being syringe filtered (0.45 μm) into an Eppendorf tube. This was centrifuged at 16200 RCF for 5 min at 4 °C, and the supernatant was transferred to an amber HPLC vial.
Samples (10 µL) were injected through a security guard-column (C18, 4 μm, 3.9 × 20 mm) and separated on a Zorbax RX-C8 5 µm (250 × 4.6 mm) column with the oven set at 20 °C. A gradient system of two mobile phases was employed; the first solvent (A) contained 45:45:5:5 Acetonitrile: Methanol: Isopropanol: 1% Acetic Acid solution and the second solvent (B) contained 25:70:5 Acetonitrile: Methanol: Isopropanol. The flow rate of the mobile phase was set at 0.8 mL min−1 starting with 100% solvent A. After 6 min of solvent A running isocratically, the mobile phase changed linearly to 100% solvent B over 10 min. This was held for 12 min before being returned to the initial conditions. Detection of tocopherols, was achieved at excitation and emission wavelengths of 298 and 328 nm and quantitation achieved using the linear formula produced from a calibration curve of external standards (4–100 µg mL−1) in methanol containing 1% BHT.
Pro-vitamin A (β-carotene) and lutein analysis
The β-carotene content of the freeze dried CRFs and WLMs was analysed using HPLC (Agilent 1100) with Photo Diode Array (PDA) detection using a method slightly modified from Kimura and Rodriguez-Amaya (2002). Material (0.1 g) was mixed with cold acetone containing 0.1% BHT (2 mL) to which 0.4 g of anhydrous sodium sulphate was added. The mixture was gently shaken for 30 s, and then centrifuged, (Thermo Jouan CR3i multifunction centrifuge) at 4 °C for 5 min at 1350 RCF. The supernatant was then syringe filtered (0.45 µm) into a clean vessel. A further 2 mL of the acetone solution was added to the remaining salt pellet and centrifuged again, which were pooled together with the original fraction. This step was repeated until the supernatant became colourless or pale green. The collected extracts were dried under N2. The dried lipid extract was then dissolved in 10 mL of the acetone solution and syringe filtered (0.45 µm) into an amber HPLC vial.
The flow rate of the mobile phase (Acetonitrile: Methanol: Ethyl Acetate) was set at 0.5 mL min−1. Two gradient mobile phases were used from 95:5:0 to 60:20:20 in 20 min, maintaining this proportion until the end of the run. Re-equilibration took 15 min. Samples were injected at a volume of 10 µL through a Sentry guard-column (Waters, Nova-Pak C18, 4 μm, 3.9 × 20 mm), and separated using Waters Spherisorb S3ODS (3 μm, 4.6 × 15 cm) column, with the temperature set at 22 °C; carotenoids were detected at 454 nm. The concentration of β-carotene and lutein was determined using a linear equation created using a calibration curve produced from a range of external (β-carotene/lutein) standards (10–100 µg mL−1).
Mineral analysis
In preparation for mineral analysis, an acid digestion was conducted by adding 20 mL concentrated HNO3 to 0.2 g of CRFs or ground WLMs. This was heated gently whilst stirring occasionally. After approximately 30–60 min when the sample had been reduced to approximately 5 mL, the flask was removed and left to cool (in the fume cupboard) for several minutes. Small quantities of deionised water were then added to each flask and the solution was filtered through a Whatman No 42 (equivalent) filter paper and diluted up to 50 mL using deionised water.
Multi-element analysis of the diluted solutions was undertaken by inductively coupled plasma mass spectrometry (ICP-MS) (Thermo-Fisher Scientific iCAP-Q; Thermo Fisher Scientific) using appropriate standards.
Statistical analysis
Experiments were performed in triplicate. i.e. three separate samples for each experiment and the statistical analysis was carried out using the Minitab V. 17 statistical package (Minitab Inc., PA, USA) using post hoc analysis of variance (ANOVA) and according to Fishers’ test with statistical significance at p ≤ 0.05.
Results and discussions
Sucrose and moisture content
The percentage of residual moisture and sucrose in the freeze dried CRFs and WLMs samples were determined. The moisture contents of the raw materials (i.e. WLMs) before the CRFs preparation were 94 ± 0.2, 82 ± 0.5, 77 ± 0.8, and 80 ± 1.2%, whereas, that for the CRFs were 79 ± 0.3, 82 ± 0.4, 70 ± 0.7 and 72 ± 0.5%, respectively for spinach, kale, stinging nettles and grass. The concentration of sucrose used for the improvement of CRFs recovery was also calculated from the HPLC data. The sucrose content of the CRFs ranged between 30% (kale) and 37% (stinging nettles).
Moisture and sucrose values were taken into account when expressing nutrient concentration values relative to total leaf dry solids (non-sucrose CRF DW.) to accurately calculate the contents of the nutrients analysed.
Protein, lipid, carbohydrate and ash content
Protein, lipid, carbohydrate (CHO) (determined by difference) and ash contents from freeze dried CRFs and their parent WLMs from a range of green tissues were measured and are presented in Table (1). The results show that CRFs contained more lipid and protein than the WLMs with lower CHO content except for CRF of stinging nettles, which did not follow the trend of the other three plant species and, in turn, showed lower protein and high CHO content. Lower ash content in CRFs compared to WLMs was also observed.
Table 1.
Proximate composition of CRFs and WLMs from selected green leaves
| CRF (% DW) | WLM (% DW) | |||||||
|---|---|---|---|---|---|---|---|---|
| Spinach | Kale | Nettles | Grass | Spinach | Kale | Nettles | Grass | |
| Protein | 42.6 ± 0.1AB | 44.1 ± 2.7A | 18.3 ± 1.1G | 30.2 ± 0.2DE | 35.3 ± 4.5CD | 36.6 ± 4.8BC | 28.0 ± 0.3EF | 23.1 ± 1.2FG |
| Lipid | 36.9 ± 1.3A | 36.1 ± 1.7A | 29.8 ± 1.5B | 30.4 ± 2.7B | 19.3 ± 1.6C | 17.0 ± 0.6C | 13.4 ± 0.4D | 12.5 ± 0.3D |
| Ash | 4.1 ± 0.0D | 2.4 ± 0.0DE | 2.1 ± 0.0E | 1.8 ± 0.0E | 18.8 ± 0.2A | 14.5 ± 0.1B | 16.4 ± 0.0B | 8.8 ± 2.5C |
| CHO | 16.4 | 17.4 | 49.8 | 37.6 | 26.6 | 31.9 | 42.2 | 55.6 |
Carbohydrates were calculated by difference (100 − [protein + lipid + ash]). Data was analysed by one-way ANOVA according to Fishers’ test with statistical significance at p ≤ 0.05 to assess differences of the samples. Values with the same superscripts for each row are not significantly different at p > 0.05
CRF Chloroplast rich fractions, WLM whole leaf material DW dry weight, CHO carbohydrates
Among the selected green materials spinach and kale showed similar values in terms of lipid and protein content (Table 1). Although protein content for CRFs of nettles (18.3%) was lower than grass CRFs, nettles and grass results were roughly similar for the rest of the parameters shown in Table 1. There is a scarcity of published data in the literature for the proximate composition of total leaves and chloroplasts from these selected green vegetables, except for spinach, which, as a result, was used as reference for analytical purposes. Care must be taken on making these comparisons since our material is not pure chloroplasts, hence the term ‘CRF’. A previous study (Kahlon et al. 2007) reported a spinach protein content of 38.2% D.W, showing closer agreement with this study (Table 1). In addition, protein content in the WLMs of grass (23%) is similar to that of Jancik et al. (2008) (21.1%).
Lipid (including lipid soluble pigments such chlorophylls, carotenoids, tocopherols etc.) content in the green materials of this study (DW), ranged between 29.8–36.9%, and 12.5–19.3% respectively for CRFs and WLMs (Table 1). Around 10% of the dry weight of green leaves of higher plants is represented by lipids, where they are found concentrated in the membranous organelles, particularly in the plastids, such as chloroplasts (Walker and Barber 1976). Lipids also have been noted to make up 35% of chloroplast dry weight, and 50% of the photosynthetic thylakoid membranes (Myers and Graham 1956).
Although quite high CHO content was found for certain CRFs and WLMs (Table 1), in most cases CHO contents was reduced after the chloroplast recovery process. This is due to the separation of cell wall material from liberated chloroplasts. However, CRFs are a crude preparation of chloroplasts; some of these fractions (derived from nettles and grass) were found to contain a white layer that looks like starch under polarised light (data not given). The estimated CHO value (42%) for WLFs of nettles (for example) in Table (1) is slightly higher than that reported by Adhikari et al. (2015) (37.4%), with very similar ash content (16.2%) as found in this study (16.4%). Further, our spinach WLM CHO content (26.6%) is in agreement with that of Kahlon et al. (2007) who found a value of 29% on a DW basis, suggesting that these estimations are roughly within the normal range of CHO content in nettles and spinach.
Chlorophyll and total carotenoid content
Total chlorophyll and carotenoid concentrations of freeze dried CRFs and WLMs are shown in Table 2. Spinach WLM chlorophyll content was 7.8 mg g−1 DW, which was in line with the literature value of 6.5 mg g−1 DW (Kidmose et al. 2005). The total carotenoid content (xanthophylls and carotenes) for CRFs presented in Table 2 is about 15 mg g−1. Of this, β-carotene, a pro-vitamin A carotenoid, accounted for 22%.
Table 2.
Chlorophyll and carotenoid levels and pigment ratios of CRFs and WLMs
| Plant | CRF (mg g−1 DW) | WLM (mg g−1 DW) | ||||||
|---|---|---|---|---|---|---|---|---|
| a + b | c | a/b | a + b/c | a + b | c | a/b | a + b/c | |
| Spinach | 73.8 ± 27.0 | 14.7 ± 4.6 | 2.2 | 5.02 | 7.8 ± 1.6 | 2.2 ± 0.2 | 3.2 | 3.5 |
| Kale | 54.0 ± 7.1 | 7.3 ± 1.2 | 3.0 | 7.39 | 8.2 ± 1.0 | 1.7 ± 0.3 | 3.0 | 4.8 |
| Nettles | 57.2 ± 13.0 | 9.3 ± 0.3 | 2.2 | 4.22 | 10.0 ± 1.4 | 2.0 ± 0.2 | 3.2 | 5.0 |
| Grass | 48.1 ± 12.0 | 7.4 ± 1.4 | 2.1 | 6.5 | 10.9 ± 3.1 | 1.1 ± 0.1 | 1.1 | 9.9 |
a + b total chlorophylls a and b, c total carotenoids, CRF Chloroplast rich fractions, WLM whole leaf material, DW dry weight
The chlorophyll concentration provides an indirect indication of the concentration of chloroplasts. In addition, nutrient concentration could be measured as a function of chlorophyll content which indicates the concentration of candidate nutrients relative to the actual chloroplast material instead of the total dry matter.
Amino acid composition
The amino acid profiles after hydrolysis of freeze dried CRFs and WLMs are shown in Fig. 1. In general, CRFs showed broader amino acid profiles compared to WLMs. Among the amino acids, glycine and leucine levels were higher in CRFs, but glutamate and glycine were the dominant amino acids in WLMs (Fig. 1) and tryptophan showed the lowest level (traces) in both cases. Freeze-dried spinach leaves could be used as a representative example of amino acid distribution in these materials for analytical purpose. Amino acid profile in freeze dried spinach WLMs was in good agreement with that of Eppendorfer and Bille (1996). For instance, the values of glutamate and glycine (238 and 199 μmol g−1) in this study and those values reported by Eppendorfer and Bille (1996) for glutamate and glycine (292 and 195 μmol g−1) were similar and both of the amino acids were the dominant ones in both findings.
Fig. 1.
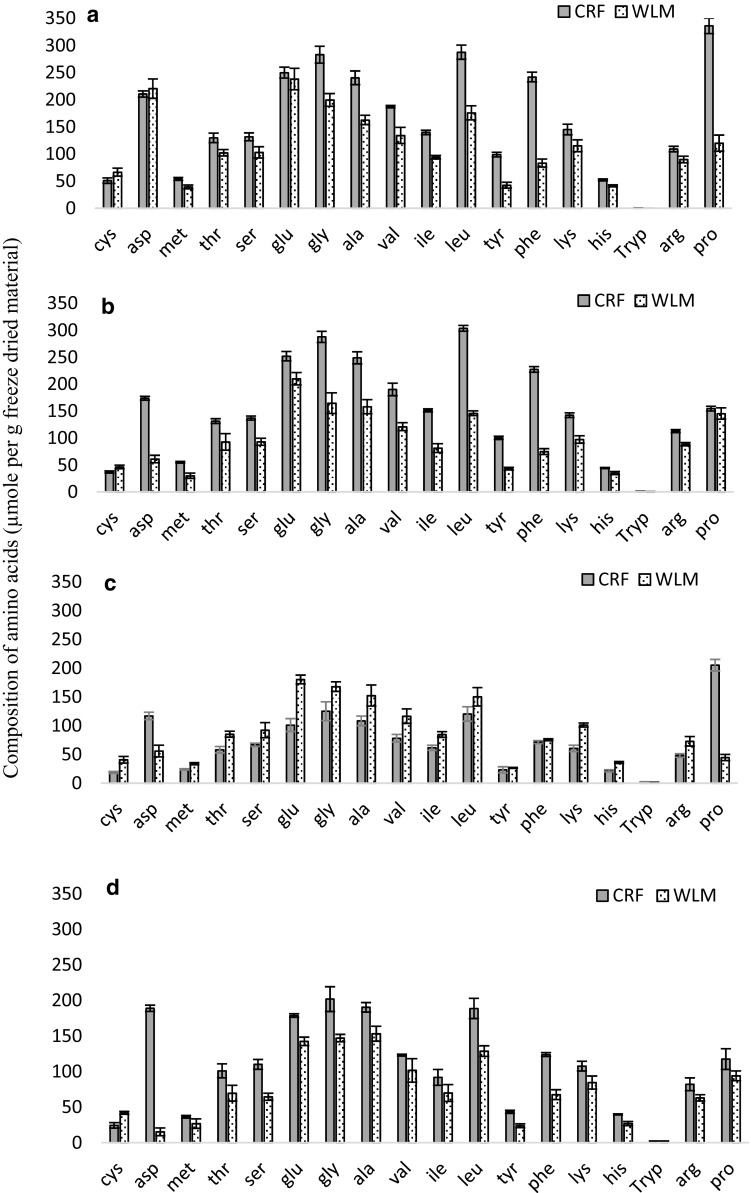
Amino acid profile of non-sucrose freeze dried CRFs and WLM from a spinach, b kale, c stinging nettles and d grass. Data were the mean ± SD of 3 separate experiments and was analysed by one-way ANOVA according to Fishers’ test with statistical significance at p ≤ 0.05 to assess differences of the samples; Cys Cysteine, Asp aspartic acid (aspartate), Met Methionine, Thr Threonine, Ser Serine, Glu, Glutamic acid (glutamate), Gly Glycine, Ala Alanine, Val Valine, Ile Isoleucine, Leu Leucine, Tyr Tyrosine, Phe Phenyalanine, Lys lysine, His Histidine, Try Tryptophan, Arg Arginine, Pro Proline
Human beings are dependent on external sources for some amino acids known as “essential’’ amino acids. This is because humans lack the enzymes required for the biosynthesis of these amino acids. In addition, some non-essential amino acids like tyrosine become essential if its precursor (phenylalanine) is deficient in the diet. The essentiality itself is dependent on the age group, for instance, arginine is essential for young but not for adults. The failure to obtain an adequate amount of even a single amino acid out of the 10 essential amino acids has serious health implications and could lead to the degradation of the body’s proteins. Unlike carbohydrates and fats, excess amino acids are not stored by the body for later use, consequently the amino acids must be in the food every day.
Fatty acid composition
Fatty acid composition of the CRFs and WLMs are presented in Fig. 2. Of the selected green materials, grass showed the highest α-linolenic (ALA) acid content (69.5 and 44.4 mg g−1 DW, respectively for CRFs and WLMs), followed by spinach (57.8 and 32.5 mg g−1 DW), kale (50.2 and 23.6 mg g−1 DW) and nettles (33.7 and 31.8 mg g−1 DW).
Fig. 2.

Fatty acid composition of CRFs and WLMs from four green plants. Data were the mean ± SD of 3 separate experiments and was analysed by one-way ANOVA according to Fishers’ test with statistical significance at p ≤ 0.05 to assess differences of the samples; CRFs chloroplasts rich fractions, WLMs whole leaf materials, SP spinach, KA Kale, NT nettles (stinging), GR grass
As a result of the lower amounts of ALA in nettles and kale, they displayed higher proportions of linoleic (C18:2) (12.6 and 19.2 mg g−1 DW) and palmitic acids (C16:0) (13.6 and 21.9 mg g−1 DW) compared to linoleic acid of spinach CRF (5.8 mg g−1 DW) and grass CRF (13.7 mg g−1 DW) both showing lower linoleic acid than nettles and kale.
Fatty acid biosynthesis in higher plants proceeds from de novo production of palmitate followed by addition of C2 units in conjunction with monenoic and polyenoic desaturation, particularly when the plant is very young (Poincelot 1976). On a dry mass basis, CRFs were significantly higher in fatty acids (mainly ALA) compared with WLMs except for nettles (see Fig. 2).
Interestingly, CRFs from grass exhibited high and comparable values of ALA to those of conventional green leaves (spinach and kale). Ingredients with potential nutritional value could therefore be obtained in the form of chloroplasts from unconventional sources such as grass and nettles. ALA is an essential fatty acid (omega-3) that mammals, humans included, cannot produce de novo and is precursor of eicosapentaenoic acid (EPA) and docosahexaenoic acid (DHA). Studies suggested that an increase of ALA consumption elevates tissue EPA and, in some cases, DHA content (Barceló-Coblijn and Murphy 2009).
Vitamin E (α-tocopherol)
Vitamin E, expressed as α-tocopherol from freeze dried CRFs and WLFs is presented in Fig. 3. Out of four different standards analysed for vitamin E (α, β, ϒ and δ-tocopherols), α-tocopherol was the only component detected in quantifiable amounts; others were either trace or not detected at all. Since α-tocopherol is the major form of vitamin E existing in nature, and the most biologically active (Bjorneboe et al. 1990), only α-tocopherol data was considered in this study. Among the analysed material, spinach CRFs (Fig. 3) exhibited the highest α-tocopherol [62 mg 100 g−1 dry weight (DW)], followed by nettles; with kale and grass showing the lowest α-tocopherol content. In contrast, for the WLM, nettles exhibited higher α-tocopherol values than spinach (Fig. 3). It should be noted, though, that α-tocopherol content in spinach CRFs and nettles was not significantly different (p ≥ 0.05). Previous studies on vitamin E content of various vegetables and fruits reported slightly higher values of α-tocopherol in nettles than in spinach (Piironen et al. 1986). Overall all CRFs contained significantly higher α-tocopherol concentrations than the parent WLMs (Fig. 3).
Fig. 3.

Alpha-tocopherol, β-carotene and lutein content of freeze dried CRFs and WLMs from selected leaf tissues. Data were the mean ± SD of 3 separate experiments and was analysed by one-way ANOVA according to Fishers’ test with statistical significance at p ≤ 0.05 to assess differences of the samples. CRF chloroplast rich fractions, WLM whole leaf material, SP spinach, KA Kale, NT nettles (stinging), GR grass; α-Toc α-Tocopherol, β-car β-carotene, Lut lutein
Pro-vitamin A (β-carotene) and lutein
The content of β-carotene and lutein in different CRFs and their WLMs is presented in Fig. 3. The data showed that both β-carotene and lutein were highly concentrated in the CRFs compared with the WLMs, and β-carotene ranged from 247–336 to 67–87 mg 100 g−1 DW, for the CRF and WLM, respectively, whilst lutein concentration ranged from 214–341 to 75–100 mg 100 g−1 DW in the CRF and WLM material, respectively. The highest β-carotene and lutein contents was recorded in spinach CRFs (336 and 341 mg 100 g−1 DW), whilst nettles had the highest β-carotene and lutein in the WLMs (87 and 100 mg 100 g−1 DW). As with α-tocopherol data, no significant difference (p > 0.05), between spinach and nettles CRFs for β-carotene content, was apparent (Fig. 3). CRFs of kale and grass, with significantly lower (p < 0.05) β-carotene content than spinach and nettles, exhibited comparable (p > 0.05) β-carotene values as shown in Fig. 3.
The β-carotene values in spinach (WLMs) when calculated in terms of FW was 4.59 mg 100 g−1; this is in agreement with the value of 4.65 mg 100 g−1 (FW) reported by Huck et al. (2000).
The lutein content of spinach WLM in this study (87 mg 100 g−1 (DW) corresponds to 5.2 mg 100 g−1 FW; this compares with 9.1 and 5.8 mg 100 g−1 of fresh spinach leaf reported by the following authors respectively: Bergquist et al. (2006) and Hart and Scott (1995). It should be noted, though that Bergquist et al. (2006) found this value from spinach obtained from the farm right before the analysis and, hence, fresh compared to the rest of the literature or this study, which used spinach from the supermarket.
During the entire procedure, namely isolation of CRFs and preparation of WLMs, carotenoid extraction, and chromatographic analysis, precautions were taken to minimise the exposure of samples to light and air to preserve the pigments (the carotenoids) which are highly degradable compounds if exposed to light and oxygen.
Besides β-carotene and lutein, other unidentified carotenoids supposed (according to the literature) to be mainly violaxanthin and neoxanthin were detected. Bergquist et al. (2006) reported that baby spinach leaves contained four carotenoids namely, lutein, violaxanthin, β-carotene and neoxanthin; lutein being the major (39%) among the four. Since carotenoids and tocopherols are both lipid-soluble molecules synthesised in chloroplasts (DellaPenna and Pogson 2006), it is reasonable that CRFs showed higher α-tocopherol, β-carotene and lutein values than WLMs (Fig. 3).
A remarkable reference nutrient intake (RNI) contribution of vitamin A by CRFs that is three times greater than WLMs was found in this study. The RNI contributions per g freeze dried CRFs and WLMs of β-carotene expressed as retinol equivalents (RE) ranged between 63–86% and 19–25%, respectively. Intakes of vitamin A are normally expressed in terms of retinol equivalents (RE), the biological activity associated with one µg of all-trans retinol. Despite ongoing discussions in the literature for carotene conversion rates, 6 µg of all-trans β-carotene or 12 µg of other pro-vitamin A carotenoids, have been retained as the conversion values equivalent to 1 RE (FAO and WHO 2005).
Lutein does not possess pro-vitamin A activity, but lutein and its coexisting isomer, zeaxanthin are reported to be very important for eye health. Studies suggest that lutein and zeaxanthin play a vital role in the reduction of risk of macular degeneration and cataracts; their concentration in the macula lutea is believed to protect from blue light to reach the under lying structures in the retina and their antioxidant potential is well recognized (Abdel-Aal et al. 2013).
Mineral composition
The mineral content of CRFs and WLMs (Table 3) of four green leafy tissues was examined. The mineral matrix of these materials is predominantly comprised of K, Ca, P, Na and Mg. The materials also consisted of substantial amounts of iron (Fe), associated with trace occurrence of Mn and Zn. Mg is generally significant in all green vegetables as a result of its association with chlorophylls, however, the abundance of K, Ca, P and Na indicate the mineral-rich nature of these materials. Similar findings of the abundance of these minerals in spinach leaves and stems were previously reported by Bhattacharjee et al. (1998). The data of spinach total leaf minerals presented in Table 3 is consistent with that of Lisiewska et al. (2009). For instance, spinach WLMs values (mg 100 g−1 DW) of K (1195.6), Ca (676.8), P (298.2), Fe (31.4) and Cu (2.0) in Table 3 corresponding to 802.8, 146.5, 54.1, 1.0 and 0.1 mg 100 g−1 (FW), respectively, was comparable to the raw spinach values (596.0, 163.3, 66.8, 1.58 and 0.1 mg 100 g−1 (FW), respectively for K, Ca, P, Fe and Cu) reported by Lisiewska et al. (2009).
Table 3.
Major and trace mineral composition (mg 100 g−1) of freeze dried WLMs and CRFs from selected leaf tissues
| Na | Mg | P | K | Ca | Mn | Fe | Cu | Zn | |
|---|---|---|---|---|---|---|---|---|---|
| CRFs | |||||||||
| Spinach | 21 ± 5C | 337 ± 24CD | 298 ± 42D | 1196 ± 68D | 677 ± 15DE | 7.7 ± 0.6BC | 31.4 ± 3.1AB | 2.0 ± 0.1A | 3.6 ± 0.5B |
| Kale | 39 ± 11BC | 322 ± 17DE | 628 ± 111BC | 518 ± 95E | 920 ± 30D | 6.5 ± 0.7C | 25.7 ± 9.1AB | 0.5 ± 0.1C | 3.6 ± 0.2B |
| Nettles | 63 ± 2BC | 396 ± 19BC | 370 ± 54D | 872 ± 64DE | 1736 ± 11C | 7.9 ± 0.6BC | 42.1 ± 12A | 1.0B ± 0.1BC | 3.6 ± 0.2B |
| Grass | 44 ± 2BC | 232 ± 28F | 436 ± 94CD | 1195 ± 234D | 354 ± 4F | 12.0 ± 3.4BC | 37.0 ± 0.6AB | 1.1 ± 0.4C | 4.0 ± 0.7B |
| WLFs | |||||||||
| Spinach | 644 ± 11A | 398 ± 3B | 874 ± 49A | 12,949 ± 403A | 2364 ± 86B | 5.1 ± 0.1C | 16.0 ± 0.4B | 1.7 ± 0.0AB | 14.9 ± 0.6A |
| Kale | 9 ± 37B | 372 ± 11BCD | 756 ± 63AB | 4169 ± 95B | 2601 ± 63B | 2.5 ± 0.0C | 12.2 ± 0.1B | 0.5 ± 0.0C | 2.4 ± 0.0B |
| Nettles | 21 ± 11C | 737 ± 30A | 416 ± 47AB | 2947 ± 73C | 6249 ± 188A | 14.1 ± 0.5B | 21.1 ± 0.5AB | 1.0 ± 0.0BC | 3.1 ± 0.2B |
| Grass | 32 ± 25BC | 244 ± 31EF | 615 ± 22BC | 4383 ± 417B | 523 ± 90EF | 32.8 ± 2.9A | 12.1 ± 3.1B | 1.2 ± 0.1BC | 3.8 ± 0.5B |
Data were the mean ± SD of 3 separate experiments. Element data displayed is in mg per 100 g DW. Data was analysed by one-way ANOVA according to Fishers’ test with statistical significance at p ≤ 0.05 to assess mineral differences of the samples. Values with the same superscripts for each column are not significantly different at p > 0.05; DW: dry weight; for CRFs and WLM: refer to Table 1
Major minerals such as K, Ca, P and Mg mostly showed decreased values in CRFs compared to their corresponding WLMs (Table 3). This could be further supported by the higher ash content in WLMs compared to CRFs (Table 1) as major minerals account for the highest proportion in the studied green tissues, which in turn, contributed to their masses gravimetrically after ashing. Interestingly, Na concentration in WLM of spinach 644 mg 100 mg−1 was reduced to around 21 mg 100 mg−1 (30 times reduction) after CRF recovery from spinach. In contrast to this, values of trace minerals such as Fe and Mn increased in almost all samples of CRFs (e.g. 31.4 and 7.7 mg 100 g−1 DW, respectively for Fe and Mn of spinach CRF) as compared to those of WLMs (e.g. 16.0 and 5.1 mg 100 g−1 DW, respectively for Fe and Mn).
Conclusion
This study accomplished the characterisation of certain macro and micro-nutrients in isolated chloroplast rich fractions and their parent whole leaf materials. Prior to this, there had been very limited data on nutritional composition, notably of vitamins and minerals, from chloroplasts. Total proteins and lipids were significantly greater in CRFs compared to WLMs. Compounds such as, α-tocopherol, β-carotene, lutein and iron, as well as total carotenoids were all present in greater concentrations in CRFs than they were in the WLMs. CRFs with high nutritional value were also recovered from unconventional green plants (stinging nettles and grass). Excessive amounts of other green materials rich in those nutrients pea vine, for instance, are also routinely produced as a waste globally. The high values of fatty acids (mainly the ω-3 α-linolenic acid), pro-vitamin A, lutein and minerals in these green tissues have the potential to be used as functional food ingredients which could benefit those with a sub-optimal intake of these nutrients i.e. the poor in developing countries, provided that safety concerns of the unconventional ingredients are resolved. The bioaccessibility and in vitro/in vivo digestibility of specific compounds in these materials are being further studied in other undergoing projects.
Electronic supplementary material
Below is the link to the electronic supplementary material.
Acknowledgements
This project was partly supported by Islamic Development Bank (IDB), Jeddah 21432, KSA.
Footnotes
Electronic supplementary material
The online version of this article (doi:10.1007/s13197-017-2711-8) contains supplementary material, which is available to authorized users.
References
- Abdel-Aal ESM, Akhtar H, Zaheer K, Ali R. Dietary sources of lutein and zeaxanthin carotenoids and their role in eye health. Nutrients. 2013;5:1169–1185. doi: 10.3390/nu5041169. [DOI] [PMC free article] [PubMed] [Google Scholar]
- Abuajah CI, Ogbonna AC, Osuji CM. Functional components and medicinal properties of food: a review. J Food Sci Technol. 2015;52:2522–2529. doi: 10.1007/s13197-014-1396-5. [DOI] [PMC free article] [PubMed] [Google Scholar]
- Adhikari BM, Bajracharya A, Shrestha AK. Comparison of nutritional properties of Stinging nettle (Urtica dioica) flour with wheat and barley flours. Food Sci Nutr. 2015;4(1):119–124. doi: 10.1002/fsn3.259. [DOI] [PMC free article] [PubMed] [Google Scholar]
- Bahrami N, Yonekura L, Linforth R, Carvalho da Silva M, Hill S, Penson S, Chope G, Fisk ID. Comparison of ambient solvent extraction methods for the analysis of fatty acids in non-starch lipids of flour and starch. J Sci Food Agric. 2014;94:415–423. doi: 10.1002/jsfa.6449. [DOI] [PMC free article] [PubMed] [Google Scholar]
- Barceló-Coblijn G, Murphy EJ. Alpha-linolenic acid and its conversion to longer chain n − 3 fatty acids: benefits for human health and a role in maintaining tissue n − 3 fatty acid levels. Prog Lipid Res. 2009;48:355–374. doi: 10.1016/j.plipres.2009.07.002. [DOI] [PubMed] [Google Scholar]
- Bergquist SÅ, Gertsson UE, Olsson ME. Influence of growth stage and postharvest storage on ascorbic acid and carotenoid content and visual quality of baby spinach (Spinacia oleracea L.) J Sci Food Agric. 2006;86:346–355. doi: 10.1002/jsfa.2373. [DOI] [Google Scholar]
- Bhattacharjee S, Dasgupta P, Paul AR, Ghosal S, Padhi KK, Pandey LP. Mineral element composition of spinach. J Sci Food Agric. 1998;77:456–458. doi: 10.1002/(SICI)1097-0010(199808)77:4<456::AID-JSFA55>3.0.CO;2-M. [DOI] [Google Scholar]
- Bjorneboe A, Bjorneboe G, Drevon C. Absorption, transport and distribution of vitamin E. J Nutr. 1990;120:233–242. doi: 10.1093/jn/120.3.233. [DOI] [PubMed] [Google Scholar]
- Dauchet L, Amouyel P, Hercberg S, Dallongeville J. Fruit and vegetable consumption and risk of coronary heart disease: a meta-analysis of cohort studies. J Nutr. 2006;136:2588–2593. doi: 10.1093/jn/136.10.2588. [DOI] [PubMed] [Google Scholar]
- Dellapenna D, Pogson BJ. Vitamin synthesis in plants: tocopherols and carotenoids. Annu Rev Plant Biol. 2006;57:711–738. doi: 10.1146/annurev.arplant.56.032604.144301. [DOI] [PubMed] [Google Scholar]
- Eppendorfer WH, Bille SW. Free and total amino acid composition of edible parts of beans, kale, spinach, cauliflower and potatoes as influenced by nitrogen fertilisation and phosphorus and potassium deficiency. J Sci Food Agric. 1996;71:449–458. doi: 10.1002/(SICI)1097-0010(199608)71:4<449::AID-JSFA601>3.0.CO;2-N. [DOI] [Google Scholar]
- Eriksen JN, Luu AY, Dragsted LO, Arrigoni E. Adaption of an in vitro digestion method to screen carotenoid liberation and in vitro accessibility from differently processed spinach preparations. Food Chem. 2017;224:407–413. doi: 10.1016/j.foodchem.2016.11.146. [DOI] [PubMed] [Google Scholar]
- FAO . How to feed the world in 2015. Italy: FAO; 2009. [Google Scholar]
- FAO & WHO (2005) Vitamin and mineral requirements in human nutrition, Bangkok, Thailand
- Folch J, Lees M, Sloane-Stanley G. A simple method for the isolation and purification of total lipids from animal tissues. J Biol Chem. 1957;226:497–509. [PubMed] [Google Scholar]
- Gross J. Pigments in vegetables: chlorophylls and carotenoids. New York: Springer; 1991. [Google Scholar]
- Grundy MML, Wilde PJ, Butterworth PJ, Gray DA, Ellis PR. Impact of cell wall encapsulation of almonds on in vitro duodenal lipolysis. Food Chem. 2015;185:405–412. doi: 10.1016/j.foodchem.2015.04.013. [DOI] [PMC free article] [PubMed] [Google Scholar]
- Hart DJ, Scott KJ. Development and evaluation of an HPLC method for the analysis of carotenoids in foods, and the measurement of the carotenoid content of vegetables and fruits commonly consumed in the UK. Food Chem. 1995;54:101–111. doi: 10.1016/0308-8146(95)92669-B. [DOI] [Google Scholar]
- Huck CW, Popp M, Scherz H, Bonn G. Development and evaluation of a new method for the determination of the carotenoid content in selected vegetables by HPLC and HPLC—MS—MS. J Chromatogr Sci. 2000;38:441–449. doi: 10.1093/chromsci/38.10.441. [DOI] [PubMed] [Google Scholar]
- ISO Animal feeding stuffs—Determination of crude ash. ISO. 2002;5984:2002. [Google Scholar]
- Jancik F, Homolka P, Cermak B, Lád F. Determination of indigestible neutral detergent fibre contents of grasses and its prediction from chemical composition. Czech J Anim Sci. 2008;53(3):128–135. [Google Scholar]
- Kahlon T, Chapman M, Smith G. In vitro binding of bile acids by spinach, kale, brussels sprouts, broccoli, mustard greens, green bell pepper, cabbage and collards. Food Chem. 2007;100:1531–1536. doi: 10.1016/j.foodchem.2005.12.020. [DOI] [Google Scholar]
- Kidmose U, Edelenbos M, Christensen LP, Hegelund E. Chromatographic determination of changes in pigments in spinach (Spinacia oleracea L.) during processing. J Chromatogr Sci. 2005;43:466–472. doi: 10.1093/chromsci/43.9.466. [DOI] [PubMed] [Google Scholar]
- Kimura M, Rodriguez-Amaya DB. A scheme for obtaining standards and HPLC quantification of leafy vegetable carotenoids. Food Chem. 2002;78:389–398. doi: 10.1016/S0308-8146(02)00203-0. [DOI] [Google Scholar]
- Lichtenthaler HK, Buschmann C (2001) Chlorophylls and Carotenoids: measurement and characterization by UV‐VIS spectroscopy. Current protocols in Food Analytical Chemistry (Supplement 1). Wiley, New York
- Lisiewska Z, Gębczyński P, Bernaś E, Kmiecik W. Retention of mineral constituents in frozen leafy vegetables prepared for consumption. J Food Compos Anal. 2009;22:218–223. doi: 10.1016/j.jfca.2008.11.015. [DOI] [Google Scholar]
- Mirmiran P, Noori N, Zavareh MB, Azizi F. Fruit and vegetable consumption and risk factors for cardiovascular disease. Metabolism. 2009;58:460–468. doi: 10.1016/j.metabol.2008.11.002. [DOI] [PubMed] [Google Scholar]
- Myers J, Graham JR. The role of photosynthesis in the physiology of Ochromonas. J Cell Comp Physiol. 1956;47:397–414. doi: 10.1002/jcp.1030470307. [DOI] [PubMed] [Google Scholar]
- Palmero P, Lemmens L, Ribas-agusti A, Sosa C, Met K, Umutoni JD, Hendricks M, Van Loey A. Novel targeted approach to better understand how natural structural barriers govern carotenoid in vitro bioaccessibility in vegetable-based systems. Food Chem. 2013;141:2036–2043. doi: 10.1016/j.foodchem.2013.05.064. [DOI] [PubMed] [Google Scholar]
- Piironen V, Syvaoja EL, Varo P, Salminen K, Koivistoinen P. Tocopherols and tocotrienols in Finnish foods: vegetables, fruits, and berries. J Agric Food Chem. 1986;34:742–746. doi: 10.1021/jf00070a038. [DOI] [Google Scholar]
- Poincelot RP. Lipid and fatty acid composition of chloroplast envelope membranes from species with differing net photosynthesis. Plant Physiol. 1976;58:595–598. doi: 10.1104/pp.58.4.595. [DOI] [PMC free article] [PubMed] [Google Scholar]
- Rogers E, Rice S, Nicolosi R, Carpenter D, McClelland C, Romanczyk LJ. Identification and quantitation of γ-oryzanol components and simultaneous assessment of tocols in rice bran oil. J Am Oil Chem Soc. 1993;70:301–307. doi: 10.1007/BF02545312. [DOI] [Google Scholar]
- Singh JP, Kaur A, Shevkani K, Singh N. Composition, bioactive compounds and antioxidant activity of common Indian fruits and vegetables. J Food Sci Technol. 2016;53:4056–4066. doi: 10.1007/s13197-016-2412-8. [DOI] [PMC free article] [PubMed] [Google Scholar]
- Walker D, Barber J. The intact chloroplast. Amsterdam: Elsevier; 1976. pp. 235–278. [Google Scholar]
Associated Data
This section collects any data citations, data availability statements, or supplementary materials included in this article.