Significance
In 1910 F. A. Lindemann introduced a practical criterion to predict the melting of crystals on the basis of the relative magnitude of thermal atomic fluctuations and the crystal lattice constant. The idea of a critical threshold for the local motions that would trigger melting also in disordered media like proteins has inspired important subsequent investigations. Here, a common scaling toward a constant value for the local fluctuations of a model protein in different environments is proved when approaching the unfolding temperature. This landmark result not only sheds unique light on the relationship between protein flexibility and stability, but also opens the possibility to predict protein unfolding in special environments (e.g., the cell interior) by following thermal local fluctuations.
Keywords: neutron scattering, molecular dynamics simulation, protein dynamics, Lindemann criterion, cell thermal stability
Abstract
Internal subnanosecond timescale motions are key for the function of proteins, and are coupled to the surrounding solvent environment. These fast fluctuations guide protein conformational changes, yet their role for protein stability, and for unfolding, remains elusive. Here, in analogy with the Lindemann criterion for the melting of solids, we demonstrate a common scaling of structural fluctuations of lysozyme protein embedded in different environments as the thermal unfolding transition is approached. By combining elastic incoherent neutron scattering and advanced molecular simulations, we show that, although different solvents modify the protein melting temperature, a unique dynamical regime is attained in proximity of thermal unfolding in all solvents that we tested. This solvation shell-independent dynamical regime arises from an equivalent sampling of the energy landscape at the respective melting temperatures. Thus, we propose that a threshold for the conformational entropy provided by structural fluctuations of proteins exists, beyond which thermal unfolding is triggered.
Local subnanosecond timescale structural fluctuations are needed for proteins to function (1). A prototypical case is myoglobin, where correlated sidechain motions take place while carbon monoxide moves from its primary docking site into secondary pockets (2). Without fast structural dynamics, proteins could not even fold in their native structure. In fact, inherent rearrangements of protein backbone and sidechains allow, in the earliest phase of folding, for searching of small local metastable structures and eventually the lowest-energy native conformation in a local-to-global process (3, 4) as interpreted in terms of the conformational substate theory (5). Within this framework, subnanosecond timescale motions correspond to jumps among nearly equal minima in the multidimensional free energy landscape (EL) that defines the hierarchical dynamics of proteins. Such motions are extremely sensitive to the amount and the nature of solvent surrounding the protein surface (6–8). At room temperature, both the amplitude and the rate of these dynamics are dramatically reduced when proteins are embedded in sugar–glass matrices (1). In these conditions, proteins also show much larger melting temperatures, , than in physiological aqueous media. This suggests that the external confinement restricts both local and global dynamical processes, eventually leading to unfolding (9). To some extent, such a picture is consistent with the hypothesis that the structural rigidity of thermophilic proteins grants their stability at extreme temperatures (10). Fast internal dynamics are also important in the modulation of the stability of proteins because they are a major component of the conformational entropy (11–13).
Since subnanosecond protein internal motions are strongly driven by the temperature, it is relevant to follow the changes of their amplitude along the pathway toward the thermal unfolding. Proposed several years ago, borrowing the Lindemann criterion for crystal melting (14), an oversimplified but insightful view is that thermal unfolding of proteins corresponds to the crossover from a solid-like to a liquid-like character of native proteins’ core (15). Considerable experimental and theoretical efforts have been made to characterize the microscopic details of protein melting events (16–18), yet the atomic traits of the dynamic mechanisms leading to protein structural destabilization are still elusive.
Precise information on the fast structural dynamics in proteins can be effectively obtained by incoherent neutron scattering (NS). This experimental technique is highly sensitive to motions of hydrogen atoms that are in turn distributed almost homogeneously within the biomolecules and can be contrasted with respect to perdeuterated solvent (19). Elastic incoherent NS (EINS), which we exploited in this work, provides a quantitative measure of the amplitude of protein internal motions in the experimentally accessible timescale (from pico- to nanosecond) in terms of the hydrogen mean-square displacements (MSD). The MSD measured on approaching the protein melting temperature result from the average over all of the possible conformations acquired by the proteins, with contribution from folded and unfolded states. Molecular dynamics (MD) based on atomistic models is a unique tool to dissect these separate contributions, provided that the temperature-dependent conformational landscape is effectively sampled. To this purpose we deployed an enhanced sampling method to assess protein thermal response and melting in silico, i.e., replica exchange with solute tempering (REST2) (20, 21), and support the EINS results.
Here, we studied the amplitude of fast structural fluctuations for a model globular protein, chicken egg-white lysozyme (CEWL), in the presence of different solvent matrices, from water to glassy networks, to sample increasingly stable systems in a wide temperature range up to the melting. We show that, even if the fast internal dynamics of the biomolecule are largely tuned by its molecular environment, when the solvent-dependent melting temperature is approached, the protein MSD converge to a common value. This trend indicates that the solvation environment preserves proteins from melting by controlling the amplitude of their local fluctuations, until a certain critical value of conformational entropy is reached, at high enough temperature, and unfolding events become predominant.
Results
MSD of CEWL in Different Environments Up to Their Melting Temperatures.
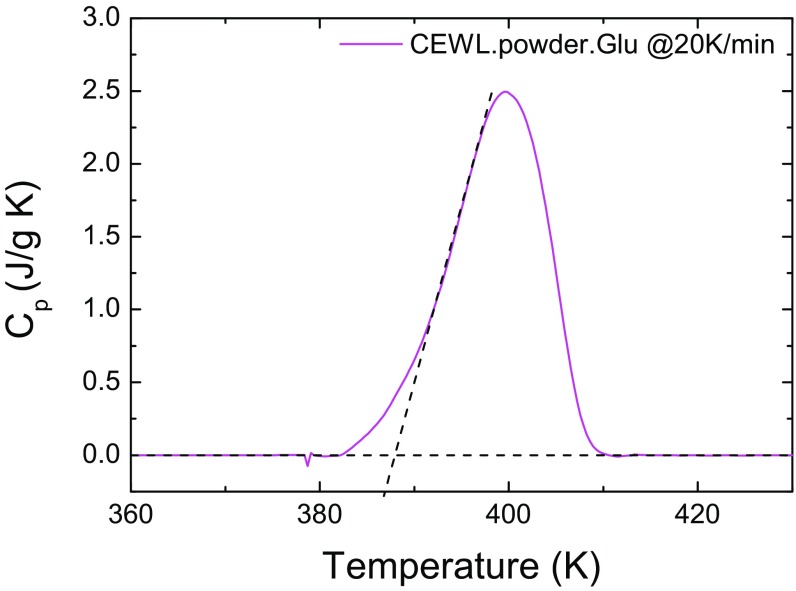
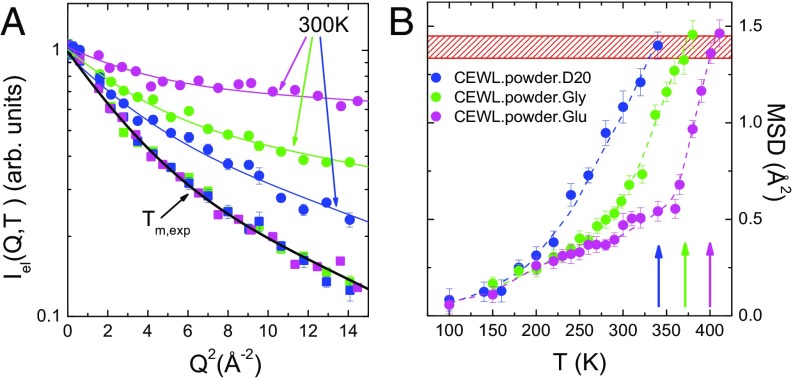
EINS experiments have been performed on CEWL in the presence of the different perdeuterated matrices D2O, glycerol, and glucose, at the backscattering spectrometer IN13 [Institut Laue-Langevin (ILL), Grenoble, France]. This instrument is suitable to explore protein motions faster than ps. Differential scanning calorimetry (DSC) measurements have shown that the melting temperature of CEWL is strongly affected by the surrounding shell, passing from K for CEWL hydrated with 0.4 g water per gram of dry protein (22) to K and K for CEWL embedded in 1:1 (gram protein per gram solvent) matrices of glycerol (9) and glucose (Fig. S1), respectively. In Fig. 1A we show the NS elastic intensity of the different samples as a function of the wavevector transfer at 300 K and at the melting temperatures. In the incoherent approximation, the decay of vs. comes from vibrational and diffusive reorientational motions of protein hydrogen atoms, occurring within the experimentally accessible timescale and thus not contributing to the elastic part of the signal. The trend of at room temperature is indicative of thermal fluctuations whose extent increases more and more when the protein is surrounded by progressively less viscous matrices, i.e., going from glucose to glycerol and from glycerol to water. Very interestingly, the elastic intensities of CEWL in the different matrices collapse into a single curve at their respective . This is clear model-independent evidence of very similar protein dynamics approaching the thermal unfolding in the different environments. The quantitative assessment of the amplitude of protein thermal fluctuations is reported in Fig. 1B in terms of MSD extracted from in a wide temperature range from 20 K up to the melting temperature (Materials and Methods and Double-Well Model). The derived MSD account for the heterogeneous dynamics of protein hydrogen atoms within the timescale defined by the energy resolution of the spectrometer (23). It is commonly accepted that above 100 K, various protein local relaxations give rise to anharmonic onsets (24). The most evident of these contributions is the protein dynamic transition (PDT), due to the so-called relaxation of the solvation shell entering the experimentally accessible time window and triggering the reorientational dynamics of protein sidechains (24–26). The solvent-driven character of the PDT is clear, as we can qualitatively identify that it takes place at quite different temperatures in the investigated systems, namely at about 230 K, 280 K, and 360 K for, respectively, CEWL plus D2O, glycerol, and glucose (Fig. 1B) (7, 24, 27). After this transition, the MSD increase with an environment-dependent rate, up to a certain environment-dependent melting point. However, as expected from the surprising behavior of , the protein MSD approach a common value in proximity to its specific .
Fig. S1.
DSC thermograms of CEWL in glucose. The scan was done with a Pyris Diamond by Perkin-Elmer with a heating rate of 20 K/min, starting from 303 K up to 620 K, on a sample without previous thermal treatments. The size of sample in the pan was 5.56 mg. Indium was used for calibration. The onset of the melting peak is located at about 388 K, while the maximum, that we have taken as an estimate of , is at 399 K.
Fig. 1.
Protein fast structural fluctuations from EINS. (A) Elastic intensity of CEWL+D2O (blue), CEWL+glycerol (green), and CEWL+glucose (pink) at 300 K and at the respective melting temperatures. The curves are fits to the data with the double-well model. (B) MSD of CEWL and melting temperatures (arrows) in the presence of different environments (colors as in A). The red hatched area highlights the region of critical MSD, corresponding to the melting of CEWL in the different environments. Dashed lines are guides to the eye.
A Lindemann-Like Criterion for the Melting of Proteins.
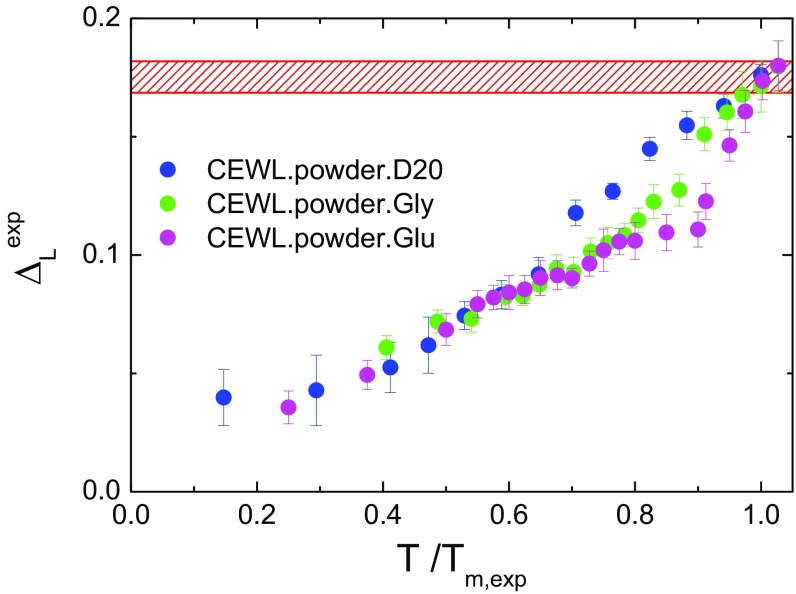
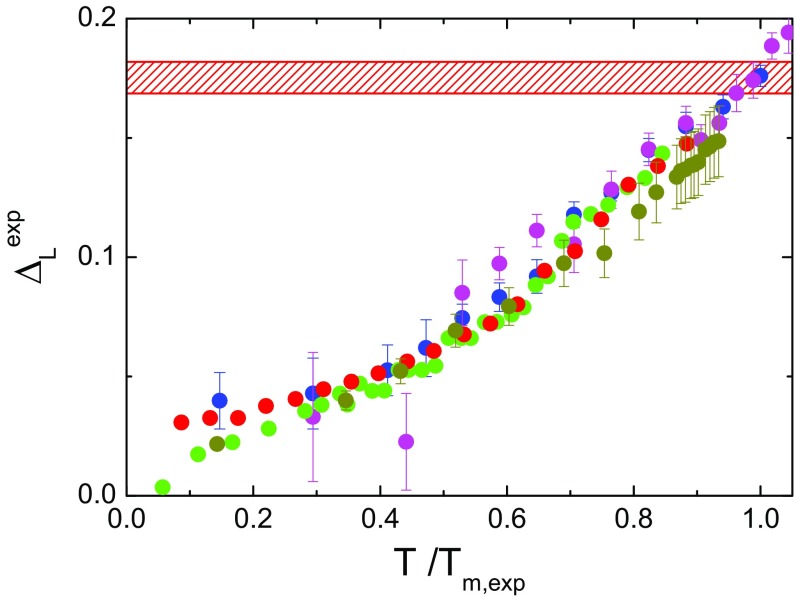
In the case of solids, the Lindemann criterion states that crystals liquefy when the amplitude of atomic thermal vibrations exceeds a fraction of the interatomic spacing, typically in the range around 0.15 (14). This venerable and old, but very useful, idea has been generalized to be applied to inhomogeneous systems (28) and proteins (15), where the Lindemann parameter has been redefined as the ratio between the root of the mean-squared fluctuations (MSF) and the most-probable nonbonded near-neighbor distance in the system; i.e., . Here, in analogy with that generalization, we estimate the Lindemann parameter from the hydrogen MSD, by using the relationship , taking into account the fact that in the harmonic approximation . In CEWL, the most-probable nonbonded near-neighbor distance, calculated from the simulated structures, is Å. In Fig. 2 we show that the experimental Lindemann parameter approaches a common value of 0.17 at , regardless of whether the protein surface is surrounded by water or by glassy matrices.
Fig. 2.
Scaling law of protein fast fluctuations by EINS. Shown is the experimental Lindemann parameter for CEWL in the presence of different environments as a function of the reduced temperature . The red hatched area highlights the region of critical MSD, corresponding to the protein melting in the different environments.
This value results from the combined amplitudes of fluctuations from folded and unfolded states, with the contribution from the latter becoming predominant as the melting temperature is crossed. To dissect the separate contributions from native and unfolded states we exploit an in silico approach based on MD simulations.
Probing the Melting Temperature in Silico.
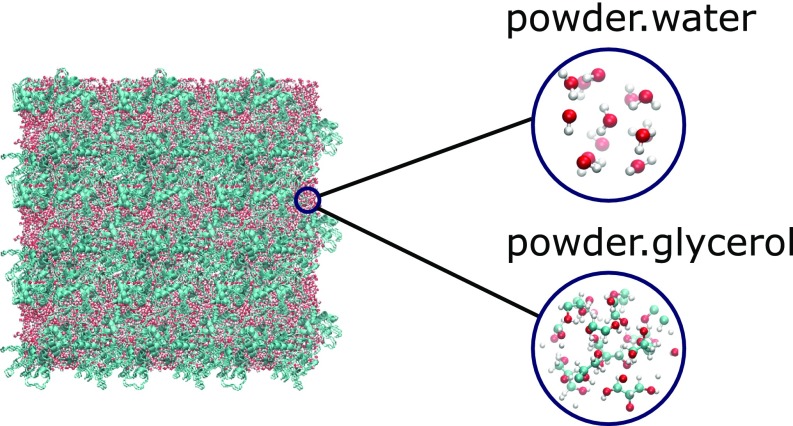
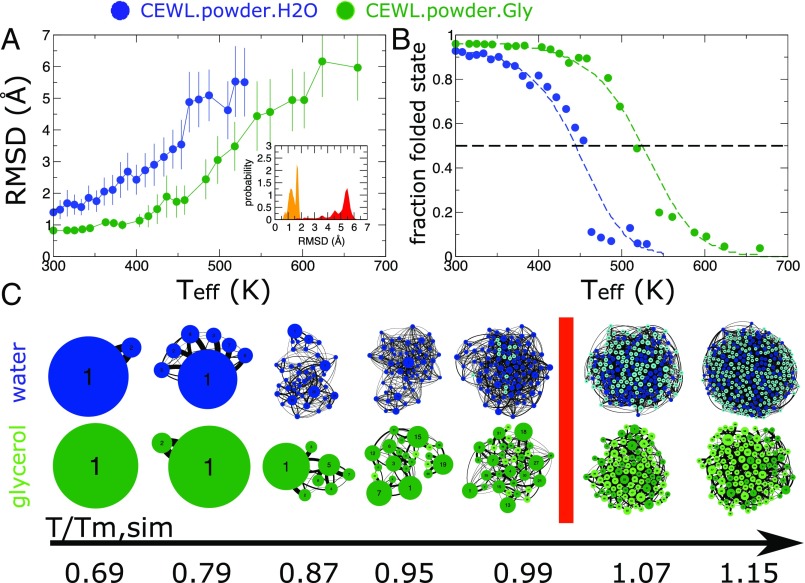
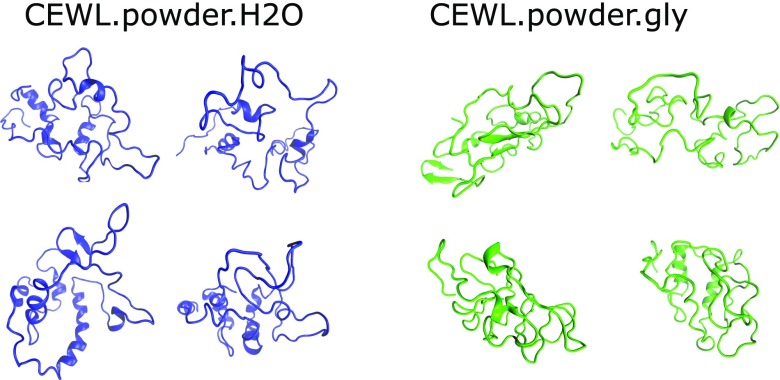
To study the melting process for two of the investigated systems, i.e., CEWL in powder in the presence of water and glycerol solvents (Fig. S2), we performed enhanced sampling via the REST2 method. To distinguish the folded and the unfolded states, we used the root-mean-square distance (-RMSD) computed for backbone atoms as a reaction coordinate, benchmarking the temperature-dependent protein structure trajectories against an equilibrated structure at K. As shown in Fig. 3A, -RMSD is an appropriate choice, since it provides a measure of the biomolecule deformation in response to thermal excitation. Based on the distribution of the -RMSD in the trajectories (Fig. 3A, Inset), we chose the threshold -RMSD = 4.0 Å as the surface separating the folded and the unfolded states and determined the fraction of the folded state as a function of temperature by applying a smoothing function to the -RMSD values (Fig. 3B). From the stability curves we inferred the melting temperatures for the two systems, with K and K. As expected, the in silico melting temperatures are much higher than the experimental ones, due to two concomitant factors. First, besides convergence issues that are always difficult to assess, we should recall that atomistic force fields generally overestimate the melting temperature (30). In addition, and probably more important, in our enhanced sampling calculations only one protein in the system is thermally excited to explore folding/unfolding events, while the remaining proteins act as stable crowders. This is a necessary strategy to make the calculation feasible. Conversely, in the experimental samples all of the proteins are destabilized in proximity to melting, thus making the effective confinement felt by a single protein softer than in simulations. However, despite the intrinsic limits of the current numerical methods, the recovered for CEWL embedded in glycerol is considerably higher than that of the hydrated protein, in qualitative agreement with DSC (9, 22).
Fig. S2.
Molecular representation of the simulated systems. For the sake of clarity the simulation box is replicated using two periodic images along the x and y directions. The powder CEWL systems solvated in water and glycerol were set up similarly, using crystallographic information to create the molecular packing.
Fig. 3.
Definition of folded and unfolded states in silico. (A) Average -RMSD values obtained from REST2 simulations at different effective temperatures for CEWL+water (blue circles) and CEWL+glycerol (green circles). Inset shows probability distribution of the -RMSD values at room (orange) and high (red) temperatures. (B) Stability curves of CEWL in silico. Data shown in circles are derived from RMSD distributions and the two-state model, while the dashed lines represent fits to the data (29). (C) The conformational states sampled by the CEWL protein are represented as networks of states with the size of the nodes proportional to the state occupancy and with darker colors for the native-like conformations and lighter colors for unfolded-like conformations. The data correspond to selected temperatures and are represented in the scale.
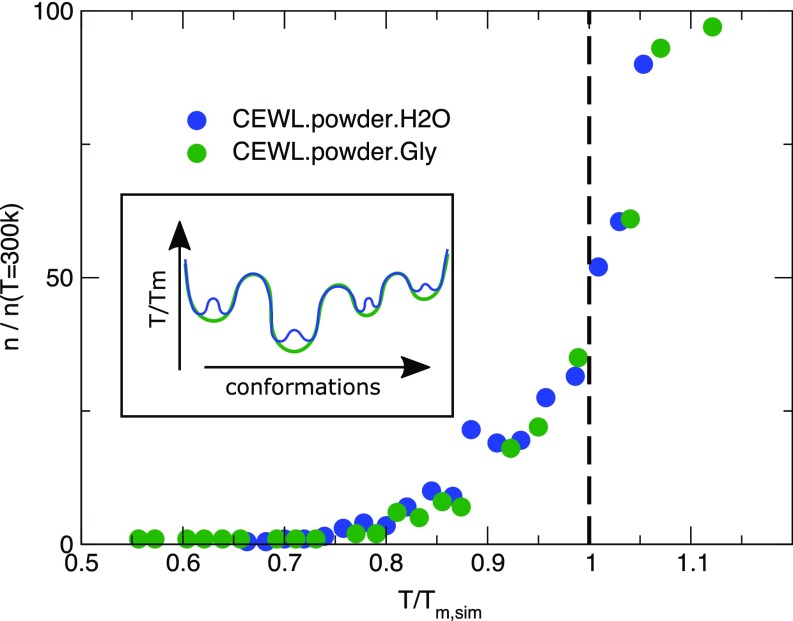
On approaching the melting, the number of conformational states visited by the proteins suddenly increases, due to the activated mobility of specific unfolded fragments. In Fig. 3C the expansion of the visited conformational space is represented by the network of configurations clustered according to -RMSD. At any temperature the number of backbone substates visited by the protein is smaller in glycerol than in water. This is probably due to the distinct steric hindrance and to the different number of hydrogen bonds the solvents can form with the protein. Both these effects influence directly or through the sidechains dynamics the backbone rearrangements. However, a common rescaling for the visited conformational substates, similar to the MSD trend, is recovered on approaching when they are normalized with respect to the number of substates sampled at ambient conditions (Fig. S3).
Fig. S3.
Number of backbone states. Shown is the number of conformational substates visited by the proteins approaching the melting and individuated by clustering the conformations of backbone atoms (cutoff 2.5 Å). The data are normalized with respect to the number of states at ambient conditions [ K)]. Inset shows pictorial representation of the potential EL of CEWL in the presence of water (blue line) and glycerol (green line), describing the finer structure of the former with respect to the latter.
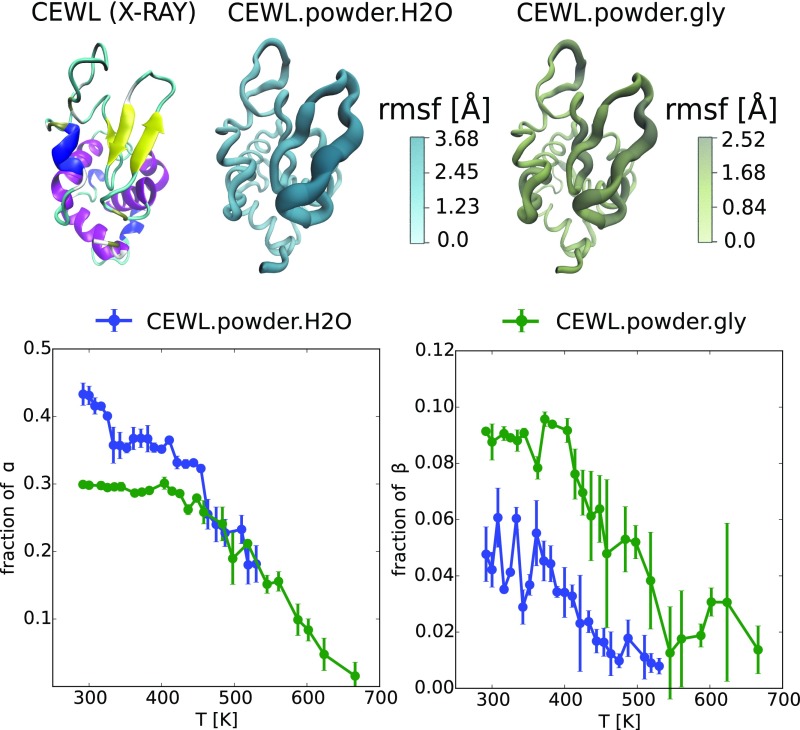
According to secondary structure calculations, in both systems the unfolded state is mainly characterized by the systematic disruption of the native -strand [Thr40-Gly54] and unwinding of helices [Trp108-Gly117] and [Asp119-Arg125] at the C terminus (Fig. S4). Although the fine molecular details of unfolding depend on the solvation and on the crowding condition, we find weak spots consistent with those revealed in wide-angle X-ray diffraction (31) and circular dichroism, FTIR, and NMR (32) experiments. The disruption of the structure anticipates the complete melting of the protein, and in agreement with experimental data (32), at , the system has lost half of its helical content.
Fig. S4.
Pictorial representation of CEWL structural fluctuations and relation to unfolded secondary structure. (Top Left) The secondary structure motifs of the native state (X-ray); (Top Center and Right) the region (magnified in size and color) where the thermal excitation is mostly localized and contributes to local unfolding as it is sampled at the melting temperatures by REST2 calculations. (Bottom) Thermal denaturation of the secondary structures as followed by the change in the fraction of -helix and -strand contents in the protein.
MD Simulations Provide Insight into Protein Fluctuations in Folded and Unfolded States.
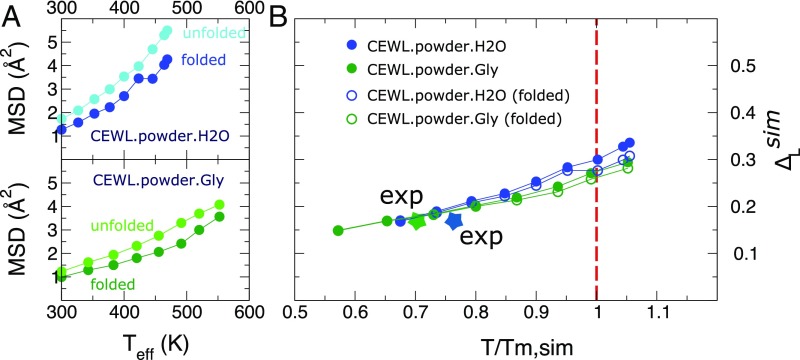
From REST2 simulations, representative unfolded configurations were extracted for the two systems and used to reconstruct the thermal scaling of the MSD for both folded and unfolded states; see Fig. 4A and Fig. S5 for details. The MSD for the unfolded state are slightly larger than for the folded state, and the difference increases with temperature. This is a signature of a comparable packing of the folded and the unfolded conformations under the strong confinement in the powder environment. In fact, in the present systems, the fraction of volume occupied by the biomolecules is , an extreme crowding condition even compared with the typical value of the intracellular space () (33).
Fig. 4.
Scaling law of protein fast fluctuations by simulations. (A) MSD from MD trajectories started from folded and unfolded configurations of CEWL in the presence of water and glycerol. The data for the unfolded state are obtained as the average over four independent runs initiated from different configurations of the unfolded CEWL extracted from the REST2 enhanced sampling. (B) Lindemann parameter obtained by combining the folded and unfolded states MSD, , with the fraction of folded states. In the same graph we report the folded-state contributions. The colored stars indicate the experimental points for the two systems.
Fig. S5.
Selected configurations of the CEWL unfolded state. CEWL is in the presence of water and glycerol environments. For each solvent, four independent structures were extracted from the REST2 simulations and used to perform MD simulations to extract the atomic MSD at different temperatures.
From the numerical amplitude of protein structural fluctuations we provide an estimate of the protein conformational entropy difference between the folded and unfolded states, arising from the protein dynamics in the 150-ps timescale. We apply a simplified model where the protein sidechains behave as identical noninteracting classical moving particles (34). The entropy difference per residue between the unfolded and the folded states is estimated from the simulated MSD to be . At ambient conditions J(mol K)−1 and 2.5 J(mol K)−1, for CEWL in the presence of water and glycerol, respectively. Similar values are determined at the melting temperatures. A tentative experimental assessment of for powder-like systems can be done by exploiting data reported by Weik and coworkers, where the MSD of the intrinsically disordered protein are compared with those of well-known globular proteins (35). Considering the intrinsically disordered protein as a model system for the unfolded state, at 300 K the ratio between the MSD of the protein and those of globular proteins gives a common per residue value of J(mol K)−1, in good agreement with our estimates. This estimated entropy change is three to four times smaller than the value of J(mol K)−1 found in aqueous solution for -amylase protein using the same model (34). Again, this gap is not surprising considering that crowding conditions in powders restrict the conformational space accessible to disordered chains, thus biasing unfolded conformations toward more compact states. For the sake of comparison, from MD simulations of folded and unfolded CEWL in aqueous solution we obtain J(mol K)−1 in much better agreement with the experimental value. All these data confirm that the performed sampling of the unfolded states in the powder condition is reasonable and that the decomposition of the experimental MSD via a two-state model is well grounded.
The Lindemann Criterion in Silico.
According to the two-state model, the ensemble combination of the MSD allows us to derive the in silico Lindemann parameter , to be compared with the one measured by EINS. As shown in Fig. 4B, converges at melting for both systems to about 0.28. This value is larger than , owing to the shift of the in silico melting point with respect to the experimental one. This situation, due to a more rigid confinement performed by the unperturbed surrounding proteins in the simulations, mimics what is observed in solid superheating (36), where by suppressing surface melting by external coating, the crystal can be heated to much higher temperatures. At the new higher melting point the Lindemann parameter for bulk atoms is about 80% in excess of the equilibrium melting point, i.e., 0.22. vs 0.12, and approaches the value reported for the superficial atoms in standard surface-driven melting.
If we assume that the thermal scaling of the MSD is well reproduced by the molecular force field for a given protein conformational state, we can determine the Lindemann parameter from simulation data also at temperatures lower than , namely at the experimental melting. At we find a value of for CEWL in the presence of water and glycerol, in excellent agreement with the EINS experimental assessments (star symbols in Fig. 4B) and previous estimates from simulations (15).
Fig. 4B shows that the Lindemann parameter calculated for the folded state alone is only slightly lower than the one resulting from the combination of folded and unfolded states. This is because the difference among the MSD in folded and unfolded conformations is small.
Discussion and Conclusions
We inquired into the amplitude of fast structural fluctuations in the high-temperature region up to the protein unfolding for the model protein CEWL, in different molecular environments. We found that, while the unfolding temperature changes significantly on changing the molecular solvation shell, a common value for the protein MSD is attained at the melting temperature. This determines for all systems an experimental Lindemann parameter close to the value found for superficial melting in crystals (36).
In its original definition, the Lindemann criterion is based solely on the behavior of the lattice constant and the atomistic fluctuations of the crystal phase (14). When transposed to the case of proteins, this criterion would correspond to the prediction of the biomolecule unfolding starting from the knowledge of thermal fluctuations in the folded state only. However, the common rescaling we experimentally found results from mixed contributions from the MSD in both folded and unfolded states. At , where these states are equally populated, the relationship between the structural fluctuation amplitudes of proteins in the presence of different solvation shells can be summarized as follows: . To single out the contributions from the folded and unfolded states, we exploited MD simulations. Notably, for both the water and glycerol environments, the MSD of the folded and unfolded states are close in value and scale similarly with temperature (Fig. 4).
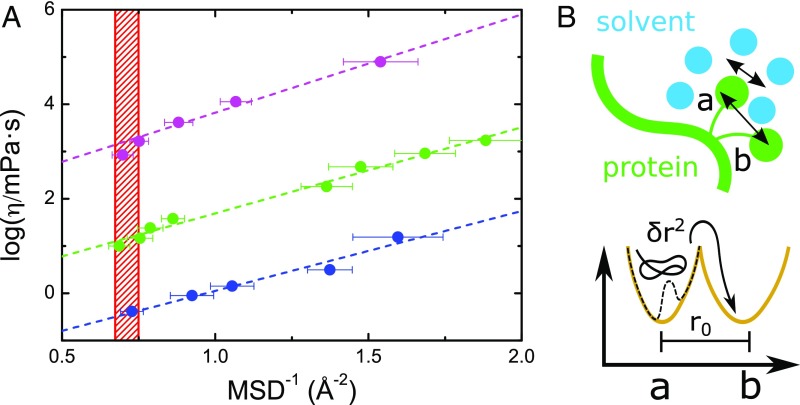
The roughness of the protein EL plays a key role in controlling protein fast fluctuations. Our results supports a picture where, close to the protein melting, the average landscapes of the combined free energy surfaces of the folded and unfolded states in the presence of different environments are very similar. In terms of simplified models of the local EL, this suggests that, at the respective s, protein fast motions arise from an effective quadratic potential with very similar curvature. On the other hand, the trend of the protein dynamics on approaching the thermal unfolding also depends on the environment local viscosity, a quantity that cannot be accessed by experiments. Here we approximate the local viscosity at the protein–solvent interface with the bulk value of the solvent viscosity at the same thermodynamic conditions (37) in the temperature range between the PDT and . In Fig. 5 we show that there is a linear relationship between the logarithm of the bulk viscosity of the environment surrounding the CEWL surface and the reciprocal of the protein MSD. The slopes of the curves for the different environments are very similar, thus indicating a common dependence of protein MSD on the viscous flow rearrangements of the surrounding shells. This behavior is reminiscent of the Hall–Wolynes (HW) model for glassy systems, relating viscosity and particle local fluctuations (38).
Fig. 5.
HW model applied to protein dynamics close to melting. (A) Logarithm of bulk viscosity of the environments surrounding CEWL vs. reciprocal of MSD for CEWL in the different environments: CEWL+D2O (blue), CEWL+glycerol (green), and CEWL+glucose (pink). Values of viscosities for water and glycerol have been taken from ref. 41, while the data for glucose come from ref. 42. The red hatched area highlights the region of critical MSD, corresponding to the melting of CEWL in the different environments. (B) Schematic representation of protein sidechains caged by the solvation shell. The average local rattling of hydrogen atoms in a conformational substate is sampled by NS and quantified by MSD. The magnitude of the displacement from a localized substate a toward a substate b can be accessed by fitting the HW model (38), relating MSD and the solvent viscosity .
The HW model describes the molecular diffusion in a liquid as a series of local jumps between distinct minima in the EL (38–40). The macroscopic viscosity thus depends on the magnitude of these elementary displacements and the fluctuations in the local minima: , where is a reference viscosity (e.g., at the glass transition), is the displacement to overcome the barrier, and is the fluctuation in the localized state that matches the MSD at the timescale sampled in the EINS experiment (scheme in Fig. 5). In the present case, the observed correlation allows us to link the local protein conformational jumps to the bulk viscosity of the environment. In the HW model, the height of the barrier between protein conformational substates is proportional to , and thus the similar slopes we obtain for the different environments indicate that, on approaching the respective melting, both the magnitude of local displacements and the rate-limiting barriers are similar in the studied systems. The average distance covered along the elementary jumps in the high-temperature range is Å. This value, which is twice as large as the protein MSD at the melting, is likely related to the large-amplitude sidechain torsional fluctuations. By exploiting the MSDu and the MSDf estimated from the REST2 simulations, we could show that the fast dynamics provide a significant contribution to the conformational entropy, thus affecting the protein thermal stability. The fact that, at the melting, this protein subnanosecond dynamical regime is environment independent strongly suggests that a certain critical value of the structural fluctuation amplitude is needed for triggering protein thermal unfolding.
One may wonder whether this behavior can be generalized to proteins other than CEWL. Actually, in Fig. S6 we show that the same value of the Lindemann parameter holds for hydrated myoglobin that we measured in an extended temperature range up to the melting, and it is reasonable also for other model proteins when the trend of the MSD is extrapolated in the range 0.8. Particularly, it seems that does not depend significantly on the protein size, as crambin and BSA proteins, with quite different masses of about 5 kDa vs. 66 kDa, respectively, show the same trend. The similar behavior of hemoglobin suggests that is also independent of the presence of a quaternary structure. However, investigations still need to be made to verify this common behavior for other case studies, such as proteins from moderately thermophilic to hyperthermophilic organisms and their mesophilic homologs.
Fig. S6.
Scaling law of fast fluctuations of hydrated protein powders by EINS. The experimental Lindemann parameter for several proteins in the state of hydrated powders (data from the present work or extracted from literature as indicated) is reported as a function of the reduced temperature : CEWL (blue circles), Mb (pink circles), BSA (light green circles) (49), crambin (red circles) (50), and Hb (dark green circles) (51). We show only the error bars for CEWL, Mb, and Hb that are comparable to those of the other systems. The red hatched area highlights the region where critical MSD are attained, corresponding to the melting of the different proteins.
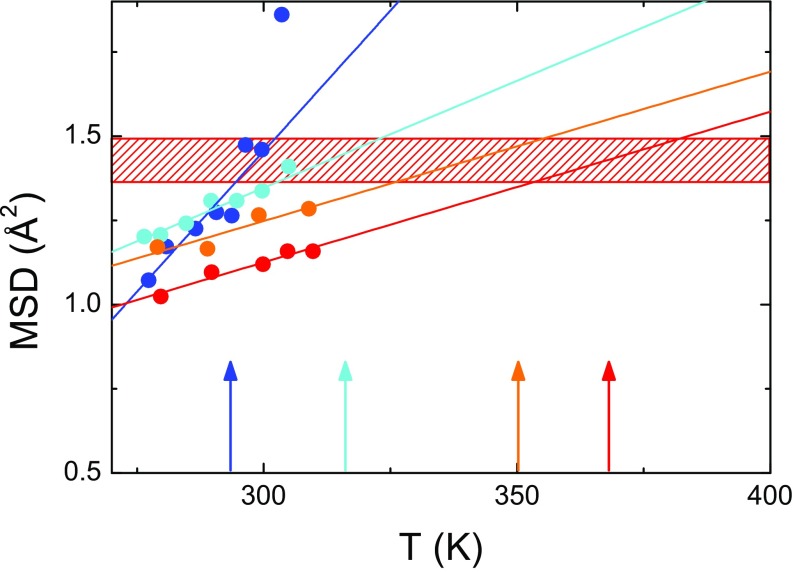
Additionally, the proposed Lindemann criterion for proteins could be used to predict the thermal stability of cells under the hypothesis that the cell’s death temperature corresponds to the denaturation catastrophe of its proteome (43). This intriguing scenario is supported by the trend of the MSD from the proteome of psychrophile, mesophile, thermophile, and hyperthermophile bacteria, measured by EINS experiments similar to the ones of the present work (44). In Fig. S7 we show that, if we set the critical threshold to the MSD value we found for the unfolding of CEWL, i.e., , then the amplitude of the thermal fluctuations of the bacterial proteome extrapolates to temperatures that quantitatively match the relevant temperatures where the organisms can no longer sustain growth, i.e., the maximum growth temperature. The similar macromolecular flexibility of organisms with largely different thermal stability at both their respective optimum growth (44) and maximum growth temperature marks a clear correlation of the protein stability/function trade-off at the cellular level. In this context, the universal scaling of the fast protein fluctuations at the melting is tantamount to a corresponding state principle, similar to what is conceptually used to explain the universal scaling of local hydrogen/deuterium exchange dynamics at proteins’ functional temperatures (45).
Fig. S7.
MSD of bacterial proteosomes with different thermal stability. Shown are psychrophile bacterium A. arcticum (blue circles), mesophile bacterium P. mirabilis (cyan circles), thermophile bacterium T. thermophilus (orange circles), and hyperthermophile bacterium A. pyrofilus (red circles). MSD data are from ref. 44. The arrows indicate the maximum growth temperatures for each bacterium (same color as relevant MSD symbols). The red hatched area highlights the region where critical MSD are attained, corresponding to the melting of the different proteins.
In conclusion, the joined EINS and MD efforts allowed us to disclose the molecular mechanism underlying the thermal scaling of atomistic fluctuations at the unfolding temperature and provided a renewed picture of the Lindemann criterion for melting when applied to the soft disordered medium of proteins. The common value of MSD at the melting defines the critical value of the protein conformational entropy before the unfolded state becomes predominant. This principle might have practical applications in biotechnological and biomedical fields, since the knowledge of the thermal scaling of the protein atomistic fluctuations above the PDT would allow one to predict the melting temperatures in different environments, for instance in cell-like conditions. For this purpose forefront NS experiments could be designed to assess the stability of labeled cellular components by measuring their fast dynamics in a small temperature window.
Materials and Methods
Preparation of Samples and NS Experiments.
Dialyzed salt-free CEWL and deuterated solvents were purchased from Sigma-Aldrich. The EINS measurements were performed on the backscattering spectrometer IN13 (ILL). The elastic intensity (energy resolution with a half-width at half-maximum of ) has been described in terms of the double-well model (25). For other details see Preparation of Samples for Neutron Scattering Experiments.
MD Simulations.
MD simulations were performed on two lysozyme powder systems, one solvated in water and one in glycerol. The system setups match exactly the experimental samples described above. The simulations were performed with the CHARMM22/CMAP force field for proteins (46), CHARMM36 for the glycerol (47), and TIP3-CHARMM for water. We exploited the REST2 method (20, 21) to enhance the sampling of unfolding. For additional details see In Silico System Preparation, REST2, and MD Simulations.
Preparation of Samples for Neutron Scattering Experiments.
Dialyzed salt-free CEWL, horse heart myoglobin (Mb), and solvents were purchased from Sigma-Aldrich. To single out the incoherent signal from protein hydrogen atoms, all of the samples were prepared with heavy water and perdeuterated glycerol and glucose. CEWL and Mb was previously dissolved in D2O to allow the substitution of all of the exchangeable hydrogen atoms. After 7 d each solution was freeze-dried into a powder that was, in turn, exsiccated under vacuum in the presence of P2O5 to achieve a water content as low as possible. The residual water content was estimated to be less than 5% by thermogravimetric analysis. After lyophilization, two aliquots of dry CEWL were dissolved in D2O plus perdeuterated glycerol and perdeuterated glucose, respectively, and lyophilized again to obtain a mixture with CEWL and glycerol or glucose in proportion in a weight of 1:1 and a hydration degree of 0 h. Finally, two aliquots of dry CEWL and Mb were hydrated in the presence of D2O to obtain hydrated powders with level content = 0.4 ( = g D2O/g dry protein).
Double-Well Model.
In the incoherent approximation, the elastic NS intensity can be used to estimate the MSD of protein hydrogen atoms, whose motions have characteristic timescales faster than the limit imposed by the experimental energy resolution function half-width at full-maximum (23). This limit for the accessible timescale is 150 ps in the case of the IN13 spectrometer. The departure from the Gaussian dependence of the NS elastic intensity, arising from the heterogeneous dynamics of protein hydrogen atoms (23), can be described in terms of the double-well model, where hydrogens may jump between two distinct sites of different free energy (19, 25),
| [S1] |
where and are the probabilities of finding the hydrogen atom, respectively, in the ground and the excited state, corresponds to the vibrational MSD of protons rattling in the bottom of the wells, and is the distance between the two sites. In this model, where a transition between the two states represents in a simplified way the jumps between conformational substates in the protein free energy surface, the amplitude of the 3D structural fluctuations in the isotropic approximation is given by the relationship
| [S2] |
Note that , where , and and denote the position vector of the average protein hydrogen atom at and , respectively. If is long enough compared with the characteristic timescale of the confined motions of hydrogen atoms, one can make the approximation , where the atomic MSF are defined as (23). In general the relation holds rigorously for harmonic oscillators.
In Silico System Preparation.
Two setups of the CEWL protein were simulated, CEWL in the hydrated powder form and the powder form solvated with glycerol, to match exactly the experimental samples in the EINS experiments described in Materials and Methods. The powder system was built with eight proteins arranged within a cubic box and by using symmetry transformations of the crystal space group of the Protein Data Bank (PDB) structure 2LYM. In the hydrated powder, TIP3P water and counterions were added to create a system of 22,467 atoms in total. This system matches the experimental system where the mass ratio of protein and D2O was 0.4. For the CEWL in the presence of glycerol, this latter environment replaced water during the setup, to obtain a system of 30,654 particles in total, corresponding to the experimental system where the mass ratio of protein and glycerol was 1. A pictorial view is provided in Fig. S2.
REST2.
As our main aim was to determine fluctuations when approaching melting, an enhanced sampling technique is used to achieve the unfolding in a reasonable simulation time. Here we exploit REST2 (20, 21), a Hamiltonian replica exchange technique that allows us to reduce the number of replicas necessary for the simulation of large systems. In REST2 the idea is to exploit the principle of the corresponding states to simulate the behavior at different temperatures by rescaling the potential energy controlling the dynamics of the system. The peculiarity is that, in the REST2 scheme, only a subset of the degrees of freedom, the essential ones for describing the unfolding/folding process, is rescaled and therefore thermally excited. With a smaller number of degrees of freedom affected, the good overlap among the replica potential energies that controls the Markovian exchange between replica configurations is attained with a smaller number of system copies compared with the standard replica exchange molecular dynamics scheme. In the latter, for each replica, the entire system is simulated at different temperatures. In both of our setups, only one protein is subjected to Hamiltonian rescaling and targeted for unfolding, while the other proteins, along with the solvent, are subjected to an unscaled Hamiltonian. The entire simulation setup is run at the reference temperature 300 K. A mean-field rescaling scheme has been introduced (21) to map the Hamiltonian scaling toward an effective temperature scale to compare the REST2 results with experiments and deduce the thermal response of the system. In our case the temperature range explored in the simulations is T = [292, 528] K for CEWL in the hydrated powder and T = [291, 720] K for CEWL embedded in glycerol. Each system was simulated using 24 replicas, simultaneously allowing the protein to unfold and achieving good energy replica overlap, finally yielding a 40% exchange efficiency with exchanges attempted every 10 ps. Each replica was simulated for 200 ns. The simulations were performed with the CHARMM22/CMAP force field for proteins (46), CHARMM36 for the glycerol (47), and TIP3-CHARMM for water and were run in the NpT ensemble. The nonbonded and short-range electrostatic interactions are calculated for atoms within a 9.0-Å cutoff, while PME with a grid spacing of is used for long-range electrostatics. The equations of motion were integrated using the multiple time-step integration scheme, with the shortest integration time of 2 fs. Simulation snapshots were saved every 20 ps. The calculations were performed using an in-house implementation of the REST2 scheme for the NAMD software (48).
MD Simulations.
All-atom MD simulations were performed for the CEWL with the goal of calculating the MSD of hydrogen atoms at temperatures approaching melting. After determining the in silico melting temperature we selected representative configurations for the folded and unfolded states. For each system, four configurations corresponding to the unfolded state and one configuration corresponding to the folded state were chosen, and separate MD runs were performed at different effective temperatures (21) according to the Hamiltonian rescaling procedure used in REST2. The temperature ranges were T = [300, 469] K for CEWL in powder with water and T = [300, 586] K for CEWL in powder with glycerol. The simulation protocol is equivalent to the one described in the previous section for REST2 MD, with the difference that the snapshots were saved every 2 ps and the production run was 20 ns. From the trajectories the hydrogen MSD were computed using a time window of 150 ps to mimic the energy resolution in the experiments. All MD simulations were performed using NAMD (48). The cluster analysis was performed using the leader–follower algorithm based on the -RMSD and using a cutoff of 2.5 Å.
For the sake of comparison the CEWL in water solution was simulated using the same protocol at T = [300,400] K to estimate for this dilute condition the Lindemann parameter at the experimental melting, = 340 K (22). Namely, for the folded state at we get , and the obtained most-probable nonbonded near-neighbor distance from the equilibrated structure at 300 K is , and . Thus, for folded proteins the scaling of fluctuations with temperature seems to be quite similar in confined and in dilute conditions while approaching the melting. Targeted experiments could confirm this prediction. Some representative unfolded configurations were generated at high temperature (>400 K) and subsequently simulated at ambient conditions to estimate the entropy change upon unfolding for the dilute case.
DSC.
DSC was performed on a freeze-dried sample of CEWL and glucose (1:1 wt/wt), using Pyris Diamond DSC by Perkin-Elmer. The scan was done at 20 K/min, starting from 303 K up to 620 K, on a sample without previous thermal treatments. The amount of sample in the pan was 5.56 mg. Indium and lead were used for calibration. The specific heat of unfolding is reported in Fig. S1.
Rescaling Law for Proteins in Powder State.
One may wonder whether the rescaling behavior existing for the Lindemann parameter of CEWL at melting can be generalized to other proteins. In Fig. S6 we show that this seems to be the case. The same value of the Lindemann parameter holds for hydrated myoglobin that we measured in an extended temperature range up to the melting, and it is reasonable also for other model proteins when the trend of the MSD is extrapolated in the range 0.8. Particularly, it seems that does not depend significantly on the protein size, as crambin and BSA proteins, with the quite different masses of about 5 kDa vs. 66 kDa, respectively, show the same trend. The fact that a similar behavior is shared also by hemoglobin suggests that the value of the Lindemann parameter at melting is independent of the presence of a quaternary structure. The threshold value of at the melting temperature could be a general property for a variety of proteins, in the presence of different molecular environments. However, investigations still need to be made to verify this common behavior for other study cases, such as proteins from moderately thermophilic to hyperthermophilic organisms and their mesophilic homologs. Data concerning several proteins in powder state have been taken from the literature: CEWL and Mb hydrated powders from our measurements, BSA powder with hydration degree = 0.2 from ref. 49, crambin powder with hydration degree = 0.5 from ref. 50, and human hemoglobin (Hb) with hydration degree = 0.4 from ref. 51. All of the systems have been measured at the IN13 spectrometer, and their MSD have been calculated in a similar range, so that they can be safely compared with each other. The most-probable nonbonded near-neighbor distances that have been estimated from the PDB structures of the different proteins (1MBN for Mb, 4F5S for BSA, 1CBN for crambin, and 1HCO from Hb) are all consistent with the value Å that we used for CEWL in the different environments. As for the melting temperatures, we have = 340 K (measured by DSC in our laboratory; Fig. S1) and = 349 K (estimated by DSC from hydrated Mb powder with = 0.8 in ref. 52); = 358 K [estimated by DSC from the solution value with BSA concentration 5 mM/L from ref. 53. Note that about 10 K should be probably added to this value to account for the = 0.2 low-hydration condition, in analogy with denaturation trends vs. water content of other globular proteins, such as lysozyme (22).]; = 345 K [estimated by NMR (54) and by analogy with other globular proteins (22)]; and = 344 K (estimated by DSC from very hydrated Hb powder with = 2 in ref. 55).
Lindemann Criterion and Thermal Stability of Cells.
Recently, the cell’s death temperature has been proposed to correspond to the denaturation catastrophe of its proteome (43). Here the Lindemann criterion for protein melting is exploited to predict the thermal stability of cells. In Fig. S7 we show the MSD from the proteome of the psychrophile bacterium Aquaspirillum arcticum, the mesophile bacterium Proteus mirabilis, the thermophile bacterium Thermus thermophilus, and the hyperthermophile bacterium Aquifex pyrophilus, measured by EINS experiments similar to the ones of the present work (44). For these systems the macromolecular flexibility has been proposed to be similar for each organism at its physiological temperature (44). In Fig. S7 we show that, if we set the critical threshold to the MSD value we found for the unfolding of CEWL, i.e., , the linearly extrapolated MSD of bacteria approach this threshold at temperatures that match the maximum growth temperatures of the investigated organisms. denotes the temperature above which growth does not take place. The estimates for are as follows: K for A. arcticum (44), K for P. mirabilis (56), K for T. thermophilus (43), and K for A. pyrofilus (57).
Acknowledgments
F.S. acknowledges funding from the European Research Council (FP7/2007–2013) Grant 258748, from the “Initiative d’Excellence” program from the French State (Grant “DYNAMO,” ANR-11-LABX-0011-01), and high-performance computing resources from Grand Equipement National de Calcul Intensif (x2016076818). We thank the ILL for the allocation of beamtime.
Footnotes
The authors declare no conflict of interest.
This article is a PNAS Direct Submission.
This article contains supporting information online at www.pnas.org/lookup/suppl/doi:10.1073/pnas.1707357114/-/DCSupplemental.
References
- 1.Fenimore PW, Frauenfelder H, Mcmahon BH, Young RD. Bulk-solvent and hydration-shell fluctuations, similar to - and -fluctuations in glasses, control protein motions and functions. Proc Natl Acad Sci USA. 2004;101:14408–14413. doi: 10.1073/pnas.0405573101. [DOI] [PMC free article] [PubMed] [Google Scholar]
- 2.Schotte F, Soman J, Olson JS, Wulff M, Anfinrud PA. Picosecond time-resolved x-ray crystallography: Probing protein function in real time. J Struct Biol. 2004;147:235–246. doi: 10.1016/j.jsb.2004.06.009. [DOI] [PubMed] [Google Scholar]
- 3.Dill KA, MacCallum JL. The protein-folding problem, 50 years on. Science. 2012;338:1042–1046. doi: 10.1126/science.1219021. [DOI] [PubMed] [Google Scholar]
- 4.Karplus M, Weaver DL. Protein-folding dynamics. Nature. 1976;260:404–406. doi: 10.1038/260404a0. [DOI] [PubMed] [Google Scholar]
- 5.Frauenfelder H, Petsko GA, Tsernoglou D. Temperature-dependent X-ray diffraction as a probe of protein structural dynamics. Nature. 1979;280:558–563. doi: 10.1038/280558a0. [DOI] [PubMed] [Google Scholar]
- 6.Zaccai G. How soft is a protein? A protein dynamics force constant measured by neutron scattering. Science. 2000;288:1604–1607. doi: 10.1126/science.288.5471.1604. [DOI] [PubMed] [Google Scholar]
- 7.Paciaroni A, Cinelli S, Onori G. Effect of the environment on the protein dynamical transition: A neutron scattering study. Biophys J. 2002;83:1157–1164. doi: 10.1016/S0006-3495(02)75239-9. [DOI] [PMC free article] [PubMed] [Google Scholar]
- 8.Schiró G, et al. Translational diffusion of hydration water correlates with functional motions in folded and intrinsically disordered proteins. Nat Commun. 2015;6:6490. doi: 10.1038/ncomms7490. [DOI] [PMC free article] [PubMed] [Google Scholar]
- 9.Bell LN, Hageman MJ, Muraoka LM. Thermally induced denaturation of lyophilized bovine somatotropin and lysozyme as impacted by moisture and excipients. J Pharm Sci. 1995;84:707–712. doi: 10.1002/jps.2600840608. [DOI] [PubMed] [Google Scholar]
- 10.Sterpone F, Melchionna S. Thermophilic proteins: Insight and perspective from in silico experiments. Chem Soc Rev. 2012;41:1665–1676. doi: 10.1039/c1cs15199a. [DOI] [PMC free article] [PubMed] [Google Scholar]
- 11.Lee AL, Wand J. Microscopic origins of entropy, heat capacity and the glass transition in proteins. Nature. 2003;424:501–504. doi: 10.1038/35078119. [DOI] [PubMed] [Google Scholar]
- 12.Jarymowycz VA, Stone MJ. Fast time scale dynamics of protein backbones: NMR relaxation methods, applications, and functional consequences. Chem Rev. 2006;106:1624–1671. doi: 10.1021/cr040421p. [DOI] [PubMed] [Google Scholar]
- 13.Doig AJ, Sternberg MJ. Side-chain conformational entropy in protein folding. Prot Sci. 1995;4:2247–2251. doi: 10.1002/pro.5560041101. [DOI] [PMC free article] [PubMed] [Google Scholar]
- 14.Lindemann FA. The calculation of molecular vibration frequencies. Physik Z. 1910;11:609–612. [Google Scholar]
- 15.Zhou Y, Vitkup D, Karplus M. Native proteins are surface-molten solids: Application of the Lindemann criterion for the solid versus liquid state. J Mol Biol. 1999;285:1371–1375. doi: 10.1006/jmbi.1998.2374. [DOI] [PubMed] [Google Scholar]
- 16.Dobson CM. Protein folding and misfolding. Nature. 2003;426:884–890. doi: 10.1038/nature02261. [DOI] [PubMed] [Google Scholar]
- 17.Daggett V. Protein folding-simulation. Chem Rev. 2006;106:1898–1916. doi: 10.1021/cr0404242. [DOI] [PubMed] [Google Scholar]
- 18.Lindorff-larsen K, Trbovic N, Maragakis P, Piana S, Shaw DE. Structure and dynamics of an unfolded protein examined by molecular dynamics simulation. J Am Chem Soc. 2012;134:3787–3791. doi: 10.1021/ja209931w. [DOI] [PubMed] [Google Scholar]
- 19.Lovesey S. Theory of Neutron Scattering from Condensed Matter. Oxford Univ Press; Oxford: 1988. [Google Scholar]
- 20.Wang L, Friesner R, Berne B. Replica exchange with solute scaling: A more efficient version of replica exchange with solute tempering (rest2) J Phys Chem B. 2011;115:9431–9438. doi: 10.1021/jp204407d. [DOI] [PMC free article] [PubMed] [Google Scholar]
- 21.Stirnemann G, Sterpone F. Recovering protein thermal stability using all-atom Hamiltonian replica-exchange simulations in explicit solvent. J Chem Theory Comput. 2015;11:5573–5577. doi: 10.1021/acs.jctc.5b00954. [DOI] [PubMed] [Google Scholar]
- 22.Fujita Y, Noda Y. Effect of hydration on the thermal denaturation of lysozyme as measured by differential scanning calorimetry. Bull Chem Soc Jpn. 1978;51:1567–1568. [Google Scholar]
- 23.Vural D, Hong L, Smith JC, Glyde HR. Motional displacements in proteins: The origin of wave-vector-dependent values. Phys Rev E Stat Nonlin Soft Matter Phys. 2015;91:052705. doi: 10.1103/PhysRevE.91.052705. [DOI] [PubMed] [Google Scholar]
- 24.Capaccioli S, Ngai K, Ancherbak S, Paciaroni A. Evidence of coexistence of change of caged dynamics at T(g) and the dynamic transition at T(d) in solvated proteins. J Phys Chem B. 2012;116:1745–1757. doi: 10.1021/jp2057892. [DOI] [PubMed] [Google Scholar]
- 25.Doster W, Cusack S, Petry W. Dynamical transition of myoglobin revealed by inelastic neutron scattering. Nature. 1989;337:754–757. doi: 10.1038/337754a0. [DOI] [PubMed] [Google Scholar]
- 26.Engler N, Ostermann A, Niimura N, Parak FG. Hydrogen atoms in proteins: Positions and dynamics. Proc Natl Acad Sci USA. 2003;100:10243–10248. doi: 10.1073/pnas.1834279100. [DOI] [PMC free article] [PubMed] [Google Scholar]
- 27.Roh JH, et al. Onsets of anharmonicity in protein dynamics. Phys Rev Lett. 2005;95:038101. doi: 10.1103/PhysRevLett.95.038101. [DOI] [PubMed] [Google Scholar]
- 28.Stillinger FH. A topographic view of supercooled liquids and glass formation. Science. 1995;267:1935–1939. doi: 10.1126/science.267.5206.1935. [DOI] [PubMed] [Google Scholar]
- 29.Hawley SA. Reversible pressure-temperature denaturation of chymotrypsinogen. Biochemistry. 1971;10:2436–2442. doi: 10.1021/bi00789a002. [DOI] [PubMed] [Google Scholar]
- 30.Lindorff-Larsen K, Piana S, Dror R, Shaw D. How fast-folding proteins fold. Science. 2011;334:517–520. doi: 10.1126/science.1208351. [DOI] [PubMed] [Google Scholar]
- 31.Hirai M, et al. Hierarchical map of protein unfolding and refolding at thermal equilibrium revealed by wide-angle x-ray scattering. Biochemistry. 2004;43:9036–9049. doi: 10.1021/bi0499664. [DOI] [PubMed] [Google Scholar]
- 32.Meersman F, et al. Consistent picture of the reversible thermal unfolding of hen egg-white lysozyme from experiment and molecular dynamics. Biophys J. 2010;99:2255–2263. doi: 10.1016/j.bpj.2010.07.060. [DOI] [PMC free article] [PubMed] [Google Scholar]
- 33.Wang Y, Sarkar M, Smith AE, Krois AS, Pielak GJ. Macromolecular crowding and protein stability. J Am Chem Soc. 2012;134:16614–16618. doi: 10.1021/ja305300m. [DOI] [PubMed] [Google Scholar]
- 34.Fitter J. A measure of conformational entropy change during thermal protein unfolding using neutron spectroscopy. Biophys J. 2003;84:3924–3930. doi: 10.1016/S0006-3495(03)75120-0. [DOI] [PMC free article] [PubMed] [Google Scholar]
- 35.Gallat FX, et al. Dynamical coupling of intrinsically disordered proteins and their hydration water: Comparison with folded soluble and membrane proteins. Biophys J. 2012;103:129–136. doi: 10.1016/j.bpj.2012.05.027. [DOI] [PMC free article] [PubMed] [Google Scholar]
- 36.Jin Z, Gumbsch P, Lu K, Ma E. Melting mechanisms at the limit of superheating. Phys Rev Lett. 2001;87:0557031–0557034. doi: 10.1103/PhysRevLett.87.055703. [DOI] [PubMed] [Google Scholar]
- 37.Hynes J, Kapral R, Weinberg M. Molecular theory of translational diffusion: Microscopic generalization of the normal velocity boundary condition. J Chem Phys. 1979;70:1456–1466. [Google Scholar]
- 38.Hall RW, Wolynes PG. The aperiodic crystal picture and free energy barriers in glasses. J Chem Phys. 1987;86:2943–2948. [Google Scholar]
- 39.Xia X, Wolynes PG. Fragilities of liquids predicted from the random first order transition theory of glasses. Proc Natl Acad Sci USA. 2000;97:2990–2994. doi: 10.1073/pnas.97.7.2990. [DOI] [PMC free article] [PubMed] [Google Scholar]
- 40.Cornicchi E, Onori G, Paciaroni A. Picosecond-time-scale fluctuations of proteins in glassy matrices: The role of viscosity. Phys Rev Lett. 2005;95:158104. doi: 10.1103/PhysRevLett.95.158104. [DOI] [PubMed] [Google Scholar]
- 41.Trejo González JA, Longinotti MP, Corti HR. The viscosity of glycerol-water mixtures including the supercooled region. J Chem Eng Data. 2011;56:1397–1406. [Google Scholar]
- 42.Parks G, Barton L, Spaght ME, Richardson JW. The viscosity of undercooled liquid glucose. J App Phys. 1934;5:193–199. [Google Scholar]
- 43.Dill KA, Ghosh K, Schmit JD. Physical limits of cells and proteomes. Proc Natl Acad Sci USA. 2011;108:17876–17882. doi: 10.1073/pnas.1114477108. [DOI] [PMC free article] [PubMed] [Google Scholar]
- 44.Tehei M, et al. Adaptation to extreme environments: Macromolecular dynamics in bacteria compared in vivo by neutron scattering. EMBO Rep. 2004;5:66–70. doi: 10.1038/sj.embor.7400049. [DOI] [PMC free article] [PubMed] [Google Scholar]
- 45.Závodszky P, Kardos J, Svingor A, Petsko GA. Adjustment of conformational flexibility is a key event in the thermal adaptation of proteins. Proc Natl Acad Sci USA. 1998;95:7406–7411. doi: 10.1073/pnas.95.13.7406. [DOI] [PMC free article] [PubMed] [Google Scholar]
- 46.MacKerell AD, Feig M, Brooks CL., 3rd Extending the treatment of backbone energetics in protein force fields: Limitations of gas-phase quantum mechanics in reproducing protein conformational distributions in molecular dynamics simulations. J Comput Chem. 2004;25:1400–1415. doi: 10.1002/jcc.20065. [DOI] [PubMed] [Google Scholar]
- 47.Hatcher ER, Guvench O, MacKerell AD. Charmm additive all-atom force field for acyclic polyalcohols, acyclic carbohydrates, and inositol. J Chem Theory Comput. 2009;5:1315–1327. doi: 10.1021/ct9000608. [DOI] [PMC free article] [PubMed] [Google Scholar]
- 48.Phillips JC, et al. Scalable molecular dynamics with NAMD. J Comput Chem. 2005;26:1781–1802. doi: 10.1002/jcc.20289. [DOI] [PMC free article] [PubMed] [Google Scholar]
- 49.Schiro G, Natali F, Cupane A. Physical origin of anharmonic dynamics in proteins: New insights from resolution-dependent neutron scattering on homomeric polypeptides. Phys Rev Lett. 2012;109:128102. doi: 10.1103/PhysRevLett.109.128102. [DOI] [PubMed] [Google Scholar]
- 50.Wanderlingh UN, Corsaro C, Hayward RL, Bee M, Middendorf HD. Proton mobilities in crambin and glutathione S-transferase. Chem Phys. 2003;292:445–450. [Google Scholar]
- 51.Stadler A, et al. 2006. Temperature Dependence of Hemoglobin Dynamics in Intact Erythocytes (Institut Laue-Langevin, Grenoble, France), Annual Rep IN13.
- 52.Stadler AM, Pellegrini E, Johnson M, Fitter J, Zaccai G. Dynamics-stability relationships in apo- and holomyoglobin: A combined neutron scattering and molecular dynamics simulations study. Biophys J. 2012;102:351–359. doi: 10.1016/j.bpj.2011.12.031. [DOI] [PMC free article] [PubMed] [Google Scholar]
- 53.Hedoux A, et al. Thermostabilization mechanism of bovine serum albumin by trehalose. J Phys Chem B. 2009;113:6119–6126. doi: 10.1021/jp900330r. [DOI] [PubMed] [Google Scholar]
- 54.De Marco A, Lecompte JT, Llinás M. Solvent and temperature effects on crambin, a hydrophobic protein, as investigated by proton magnetic resonance. Eur J Biochem. 1980;119:483–490. doi: 10.1111/j.1432-1033.1981.tb05633.x. [DOI] [PubMed] [Google Scholar]
- 55.Jansson H, Swenson J. Dynamical changes of hemoglobin and its surrounding water during thermal denaturation as studied by quasielastic neutron scattering and temperature modulated differential scanning calorimetry. J Chem Phys. 2008;128:245104. doi: 10.1063/1.2943199. [DOI] [PubMed] [Google Scholar]
- 56.Tsuji A, Kaneko Y, Takahashi K, Ogawa M, Goto S. The effects of temperature and pH on the growth of eight enteric and nine glucose non-fermenting species of gram-negative rods. Microbiol Immunol. 1982;26:15–24. doi: 10.1111/j.1348-0421.1982.tb00149.x. [DOI] [PubMed] [Google Scholar]
- 57.Huber R, et al. Aquifex pyrophilus gen. nov. sp. nov., represents a novel group of marine hyperthermophilic hydrogen-oxidizing bacteria. Syst Appl Microbiol. 1992;15:340–351. [Google Scholar]


