Significance
Good examples of the relative autonomy of organ development are teeth, and for decades researchers have cultured isolated mouse teeth on a petri dish by starting from the earliest recognizable stage. We have cultured cheek teeth of voles, another species of rodent, and show how the cultured vole teeth lack their species-specific morphology. Based on computational modeling, 3D imaging, and experiments in which we culture mouse and vole teeth between microscopic braces, we suggest that the development of vole tooth shape requires the lateral support of the jaw. Because mice lack the vole-specific morphology, the requirement of the jaw for tooth shape has not been possible to uncover previously. Comparative studies are required for the understanding of organogenesis.
Keywords: evodevo, patterning, odontogenesis, diversity, tissue engineering
Abstract
Much of the basic information about individual organ development comes from studies using model species. Whereas conservation of gene regulatory networks across higher taxa supports generalizations made from a limited number of species, generality of mechanistic inferences remains to be tested in tissue culture systems. Here, using mammalian tooth explants cultured in isolation, we investigate self-regulation of patterning by comparing developing molars of the mouse, the model species of mammalian research, and the bank vole. A distinct patterning difference between the vole and the mouse molars is the alternate cusp offset present in the vole. Analyses of both species using 3D reconstructions of developing molars and jaws, computational modeling of cusp patterning, and tooth explants cultured with small braces show that correct cusp offset requires constraints on the lateral expansion of the developing tooth. Vole molars cultured without the braces lose their cusp offset, and mouse molars cultured with the braces develop a cusp offset. Our results suggest that cusp offset, which changes frequently in mammalian evolution, is more dependent on the 3D support of the developing jaw than other aspects of tooth shape. This jaw–tooth integration of a specific aspect of the tooth phenotype indicates that organs may outsource specific aspects of their morphology to be regulated by adjacent body parts or organs. Comparative studies of morphologically different species are needed to infer the principles of organogenesis.
The conservation of gene regulatory networks in the development of homologous organs is well exemplified by dentitions. Teeth in fish, reptiles, and mammals have been found to use largely shared developmental gene networks (1, 2). Furthermore, tooth development, similar to organ development in general, results from sequential events that appear to be relatively independent from the development of other organs. In particular, mammalian teeth have been considered highly self-regulatory, as they form inside the dental follicle buffered from the surrounding environment (3–5). The self-regulatory aspect of teeth is further supported by the reiterative use of the same signaling pathways and signaling centers, called enamel knots, present within each growing tooth (2). Experiments on growing teeth have revealed how an activator–inhibitor balance of signaling molecules within a developing tooth and between adjacent teeth regulate dental patterning (6–12).
Despite the evidence from mice indicating self-regulation of teeth, several observations suggest an intriguing link between jaw bone and tooth crown formation (3, 13, 14). In humans, abnormal crown patterns in patients with congenital syphilis have been ascribed to result from infection of the tooth follicle (3). Likewise, loss of function of parathyroid hormone-related protein (PTHrP) leads to loss of alveolar bone resorption and deformation of the tooth crown in the mouse (15–19). A lethal human syndrome called Blomstrand chondrodysplasia, which involves a loss of function of the receptor for PTHrP, results in a severe deformation of the base of a tooth crown due to an excess of bone formation (20). Conversely, experiments using cultured sections of mouse jaws show that molars grow larger after alveolar bone has been removed (21).
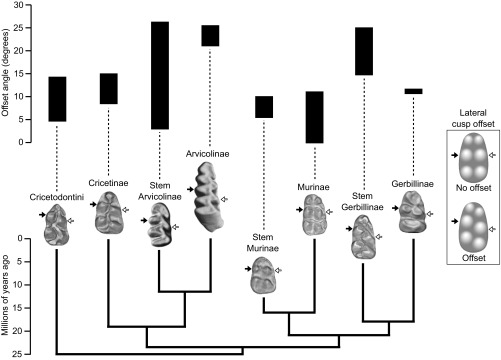
To address the limited comparative evidence on the self-regulation of teeth, here we asked whether molar cusp patterns are indeed entirely self-regulatory, or whether the surrounding jaw should also be considered in tooth patterning and evolution. Our specific focus is inspired by early computational modeling, which has implicated that the lateral configuration of cusps depends on lateral expansion of the developing molar (22). Molars typically have lateral cusp configurations that range from largely parallel, as in mice and humans, to alternate, as in the evolutionarily basal mammalian molar, the tribosphenic molar. Teeth of several lineages have repeatedly evolved from alternate to parallel cusp configurations during the Cenozoic, and in particular, rodents show great evolutionary diversity in their lateral cusp configurations (Fig. 1; Table S1) (23–26). Functionally, lateral cusp configuration is related to occlusion and to chewing direction in cuspidate teeth (26, 27).
Fig. 1.
Cusp offsets show diverse evolutionary patterns across the phylogeny of muroids. The plot shows the range of protoconid (white arrow) and metaconid (black arrow) angular values measured for extant and extinct muroid families (Materials and Methods; Table S1). Mouse (Murinae) and vole (Arvicolinae) cusp offsets are in the extreme ends of muroids. The teeth are not to scale.
Table S1.
Cusp-offset measurements of the fossil lineages of muroids
| Subfamily | Species | N | Minimum | Maximum | Mean |
| Cricetodontini | Cricetodon albanensis | 5 | 9.0 | 14.3 | 11.3 |
| Ruscinomys europaeus | 5 | 4.7 | 11.2 | 7.66 | |
| Cricetinae | Democriceton sp. | 3 | 8.5 | 10.1 | 9.07 |
| Megacricetodon tautavelensis | 4 | 12.3 | 15.0 | 13.60 | |
| Stem Arvicolinae | Rotundomys montisrotundi | 8 | 2.9 | 13.8 | 8.67 |
| Microtodon longidens | 5 | 21.6 | 26.3 | 23.26 | |
| Arvicolinae | Dolomys sp. | 5 | 21 | 25.4 | 23.44 |
| Mimomys septimanus | 3 | 21.1 | 24.8 | 22.57 | |
| Stem Gerbillinae | Myocricetodon ihroudi | 3 | 14.7 | 25.0 | 20.03 |
| Gerbillinae | Protatera algeriensis | 3 | 10.6 | 11.7 | 11.00 |
| Stem Murinae | Potwarmus thailandicus | 7 | 5.4 | 10.0 | 7.16 |
| Murinae | Progonomys cathalai | 7 | 0.0 | 4.0 | 2.36 |
| Rhagamys orthodon | 5 | 7.9 | 11.1 | 8.76 |
Measurements are for individual specimens and are in degrees.
Developmentally, parallel and alternate cusp configurations are one of the earliest features to appear during crown patterning (28), suggesting a relatively narrow time during which the cusp offset can be influenced. Despite the increasing knowledge about developmental regulation of tooth patterning, none of the known pathways or mutations in the mouse has transformed its parallel cusp configuration to the pattern of alternate cusp configuration (2, 6–8, 10–12, 29–31). This lack of suitable mouse mutants further necessitates a comparative approach to studying lateral cusp configurations.
We examined molar development of two extreme cases: the mouse (Mus musculus), the model species used in mammalian tooth development with parallel cusps, and the bank vole (Myodes glareolus), with alternate cusps (Fig. 1; Fig. S1).
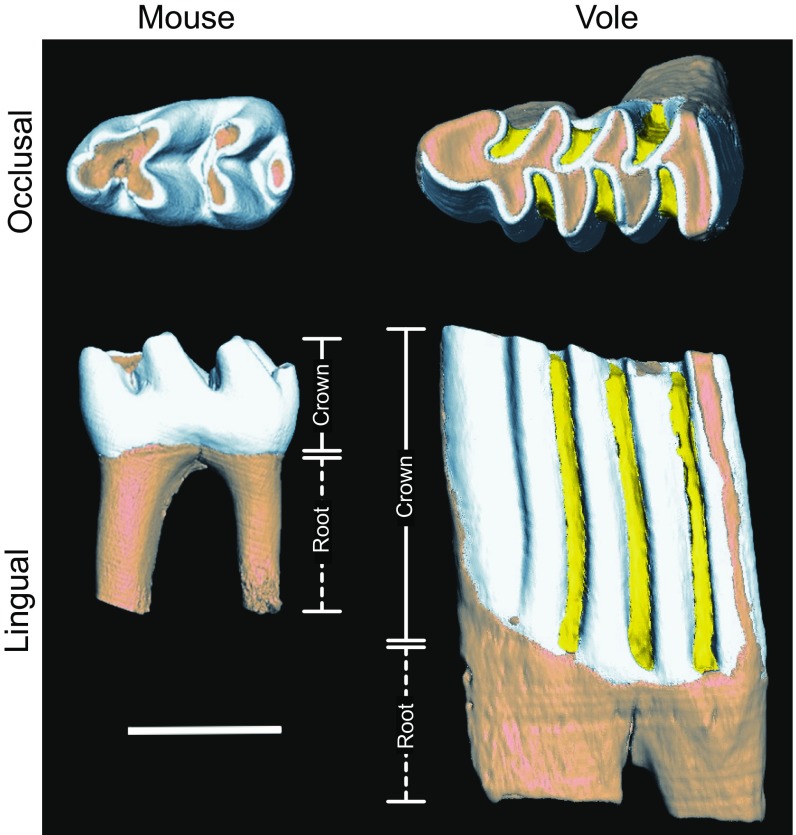
Fig. S1.
First lower molars of adult mouse (M musculus) and vole (M glareolus) shown from occlusal and lateral views. The crown height differences appear after the cusp patterning. Coronal cementum shown in yellow. (Scale bar, 1 mm.)
Results
Computational Modeling Implicates Lateral Expansion in the Regulation of Cusp Offset.
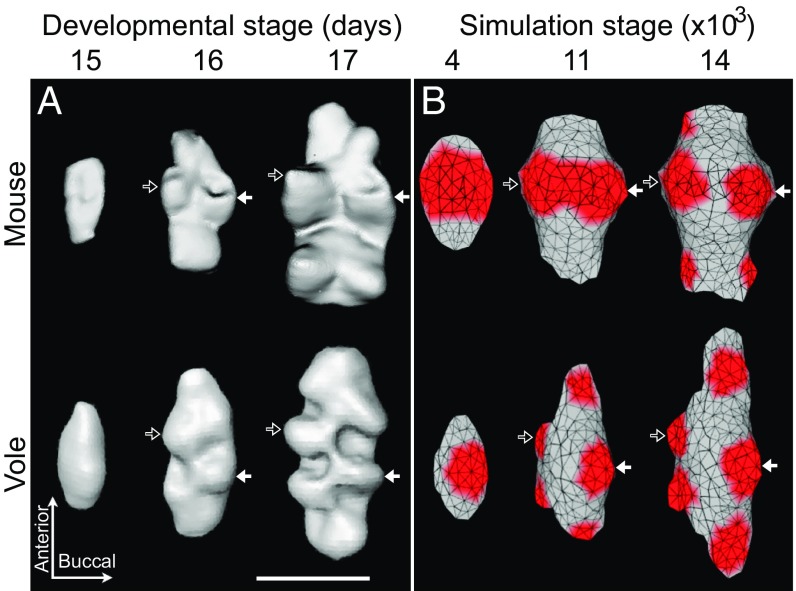
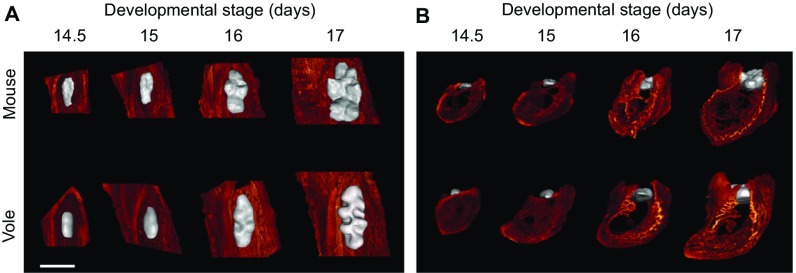
First we used soft tissue microcomputed tomography (microCT; Materials and Methods) to measure cusp-offset angles in the first (m1) lower molars of the mouse and the vole. This method allowed us to examine the development of lateral cusp configuration more accurately than with histology-based 3D reconstructions. The tomography data (Fig. 2A) show that the difference in m1 cusp offset between mouse and vole is well established by stage E16 (corresponding to the late bell stage of tooth development), agreeing with earlier reports (28).
Fig. 2.
Adjusting lateral biases changes cusp offset in computational modeling and mimics the real patterns of vole and mouse molar development. Soft tissue tomography reconstructions of developing mouse and vole molars show early appearance of cusp-offset patterns (A). The protoconid is marked with a white arrow, and the metaconid with a black arrow. Mouse molar simulation used parameters from ref. 12, and the vole simulation has greatly reduced lingual and buccal biases to produce the cusp offset (B). In addition, to simulate the greater anterior elongation of the vole molar compared with the mouse molar, we increased the anterior and decreased the posterior biases (Table S2 for parameter values). The secondary enamel knot produced growth factor is shown in red, marking the developing cusp patterns (B). Anterior is toward the top. (Scale bar, 500 µm.)
Although previous computational modeling had implicated lateral growth to control lateral cusp configuration (22), the model used had only a rough depiction of tissue growth dynamics. Therefore, here we used a morphodynamic model incorporating genetic interactions with tissue biomechanics through the ToothMaker interface (12, 32). We systematically constrained lateral expansion of teeth, starting from parameters used to model a mouse tooth; that is, parallel cusp configuration (12).
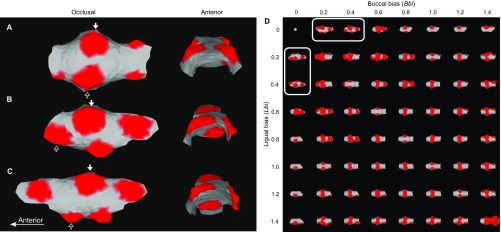
Our ToothMaker simulations show that a substantial reduction in the parameters affecting lingual (Lbi) and buccal (Bbi) expansion of the tooth at a critical stage results in the alternate vole cusp pattern (Fig. 2; Table S2; Fig. S2). The development of the alternate vole pattern results from a narrower cross-section of the simulated tooth germ, which fit in the secondary enamel knots only in the alternating pattern (Fig. 2B; Fig. S2). These modeled patterns suggest mechanisms limiting lateral expansion of developing teeth at this stage are needed for alternate cusp configuration. To specifically simulate the rapid longitudinal extension of the vole first molar (33), anterior and posterior biases also need to be changed (Fig. 2; Fig. S2C). However, minimizing lateral biases alone is sufficient to produce cusp offset in the mouse model (Fig. S2 B and D).
Table S2.
Parameters used to generate mouse and vole molar simulations
| Parameter category | Parameter | Mouse | Vole |
| Iterations | 14,000 | 14,000 | |
| Degradation | Deg (Protein degradation rate) | 0.076 | 0.076 |
| Growth factor | Set (Growth factor threshold) | 0.95 | 0.95 |
| Sec (Growth factor secretion rate) | 0.14 | 0.14 | |
| Ds (Growth factor diffusion rate) | 1.0 | 1.0 | |
| Activator | Act (Activators) | 1.6 | 1.6 |
| Da (Activator diffusion rate) | 0.2 | 0.2 | |
| Lbi (Lingual bias) | 1.34 | 0.4 | |
| Bbi (Buccal bias) | 1.31 | 0.0001 | |
| Ina (Initial activator concentration) | 0.0 | 0.0 | |
| Inhibitor | Int (Initial inhibitor threshold) | 0.19 | 0.19 |
| Inh (Inhibitors) | 800.0 | 800.0 | |
| Di (Inhibitor diffusion rate) | 0.2 | 0.2 | |
| Epithelium | Egr (Epithelial growth) | 0.013 | 0.013 |
| Dgr (Downward vector of growth) | 10,500.0 | 10,500.0 | |
| Dff (Differentiation rate) | 0.0002 | 0.0002 | |
| Adh (Traction between neighbors) | 0.005 | 0.005 | |
| Rep (Young's modulus, stiffness) | 1.5 | 1.5 | |
| Ntr (Mechanical traction from the borders to the nucleus) | 0.00013 | 0.00013 | |
| Abi (Anterior bias) | 3.2 | 8.0 | |
| Pbi (Posterior bias) | 7.0 | 5.0 | |
| Mesenchyme | Mgr (Mesenchymal growth) | 16,000.0 | 16,000.0 |
| Bgr (Border growth amount in antero-posterior) | 0.2 | 0.2 | |
| Boy (Mesenchyme mechanic resistance) | 0.17 | 0.17 | |
| Initial size | Rad (Radius of initial conditions) | 3.0 | 3.0 |
| Swi (Distance from 0 where the borders are defined) | 1.51 | 1.51 | |
| Bwi (Width of border) | 3.4 | 3.4 |
Parameters with different values in mouse and vole simulations are in bold. For parameters, see Materials and Methods and refs. 12 and 31. The model has the mouse parameter values as defaults (it can be downloaded at dead.cthulhu.fi/ToothMaker/).
Fig. S2.
Computational modeling of mouse and vole molar cusp patterns. Mouse molars have a small lateral cusp offset, and a small difference in parameters affecting buccal (Bbi) and lingual (Lbi) biases can reproduce this offset (A). Highly reduced biases result in pronounced cusp offset (B). When the anterior (Abi) and posterior (Pbi) biases are adjusted, the modeled shape in B approximates a developing vole tooth (C). The protoconid is marked with a white arrow and the metaconid with a black arrow. The simulations are produced with the same number of iterations (14,000), and growth factor domains (threshold = 0.04) mark the position of developing cusps (red). All the parameter values are in Table S2. Systematic scanning of lateral biases shows that the biases need to be reduced substantially to generate a cusp offset (circled in D). The offset is achieved by constraining one side more than the other, which results in one cusp forming first, and which reflects real teeth as they grow more lingually than buccally.
Because the modeling approach does not directly identify the factors limiting lateral expansion of molars, next we examined whether the appearance of mouse and vole cusp patterns are associated spatiotemporally with jaw formation.
Cusp Offset Appears When the Developing Tooth Becomes Surrounded by the Jawbone.
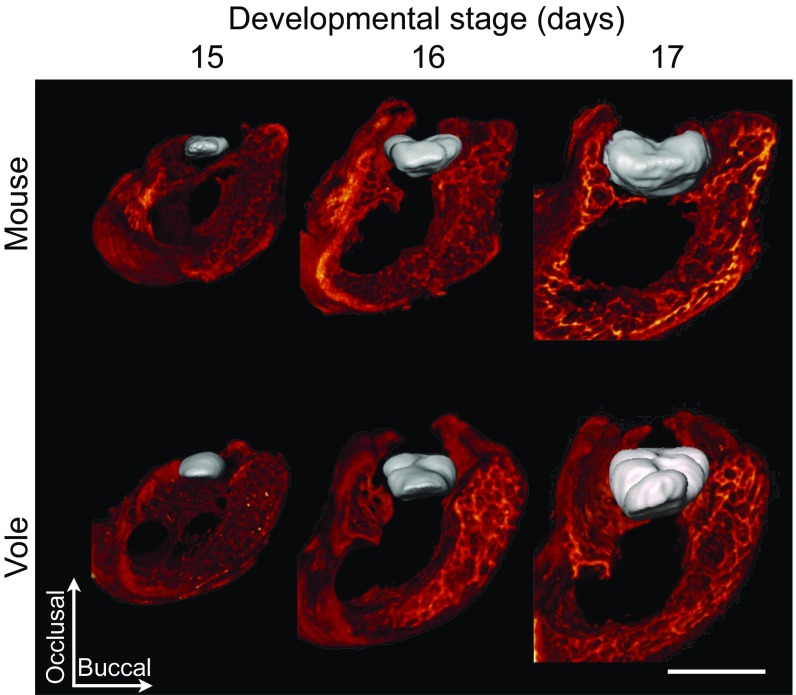
Because our tomography imaging also provided high-resolution data on developing jaws, we examined the spatiotemporal association between the developing bone crypt and the tooth (Materials and Methods). The reconstructions show that the growing jawbone appears to be dynamically associated with the lateral expansion of the molars (Fig. 3; Fig. S3; Movie S1).
Fig. 3.
Soft tissue tomography reveals a close proximity of molars and jawbone from the onset of patterning. The first lower molar (m1) and its surrounding alveolar jawbone of mouse and vole are represented in false color (m1 in gray and jawbone in red) from the posterior view. An animation showing the development of the m1–jawbone relationship from E15 to E17 stages (Movie S1) further illustrates the close association of the jaw with growing tooth. Buccal is toward the right. (Scale bar, 500 µm.)
Fig. S3.
3D reconstructions of soft tissue microCT scans show both the forming bone and developing tooth. Occlusal (A) and anterior (B) views show how the forming tooth is enclosed by bone in both species. A posterior view is animated in Movie S1. (Scale bar, 500 µm.)
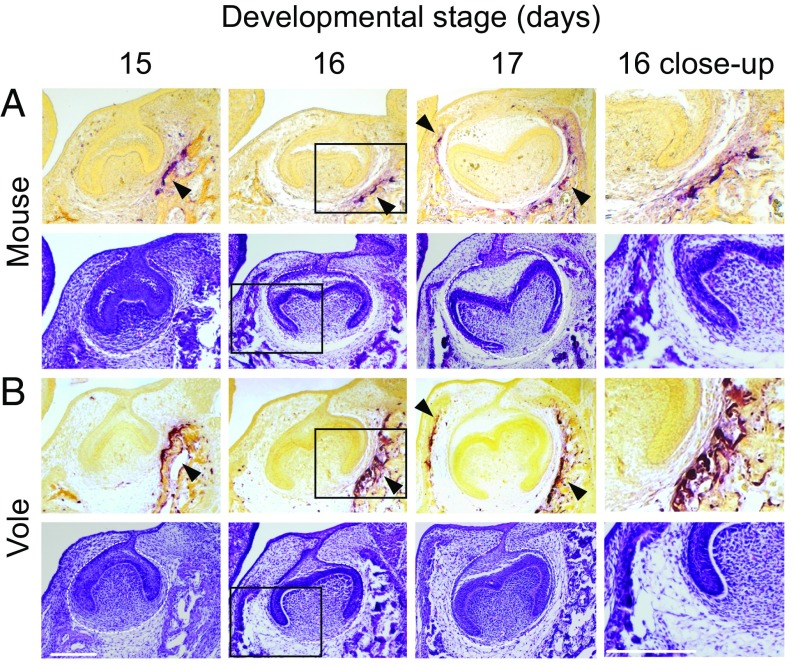
The close temporal and spatial association of forming bone with developing tooth is further supported by osteoclast activity detected using tartrate-resistant acid phosphatase (TRAP) staining (21, 34) (Fig. 4). In both species, first the buccal and then the lingual sides show TRAP staining in the bone closest to the tooth (Fig. 4 A and B), suggesting an active remodeling of the jaw (21) (Fig. 4). Vole m1 shows a larger TRAP-positive region close to buccal cervical loop than mouse m1, possibly due to the continuing crown growth of hypsodont (tall) vole molar (Fig. 4B; Fig. S1).
Fig. 4.
Osteoclast activity indicates active interaction between growing molars and jawbone in both species. Mouse (A) and vole (B) histological sections with TRAP staining (Upper) and H&E staining (Lower) show osteoclast activity (black arrowheads) first on the buccal (at E15 and E16) and then on the lingual (at E17) side. Accordingly, the H&E stainings show that bone encroaches the tooth first from the buccal and then from the lingual side (at E16). Buccal is toward the right. (Scale bar, 200 µm.)
Experimentally Constraining Lateral Expansion of Teeth.
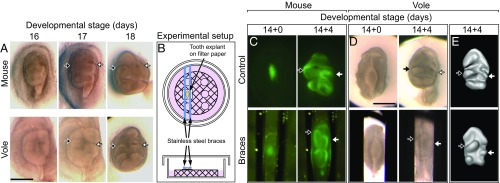
The presence of active bone remodeling adjacent to developing teeth during the appearance of cusp offset further suggests a role of the adjacent jawbone in the regulation of lateral cusp configuration. To examine cusp patterning experimentally, we next explored how the cusp offset forms in cultured teeth when no jawbone is present. We used an organ culture system to grow both mouse and vole molars (Fig. 5A; Fig. S4). In these organ cultures, the tooth primordia are dissected from the surrounding jaw tissue before the appearance of bone, and cultured on a filter paper (Materials and Methods; Fig. 5B). Tooth development can be followed continuously, and mouse molar patterning has been reported to be relatively normal, using the ex vivo cultures (e.g., refs. 9, 12). We cultured first lower molars of both species, starting at E14, when the cusps have not yet appeared (Fig. 5A; Materials and Methods).
Fig. 5.
Cusp offset is lost in teeth cultured ex vivo and regained by using small braces. First lower molar (m1) explants of mouse and vole have largely parallel lateral cusp configurations (A). A Petri dish culturing system using small steel braces was used to constrain lateral expansion of teeth (B). ShhGFP-mouse molars show relatively normal cusp offset when cultured without braces and pronounced offset of the protoconid and the metaconid when cultured with closely spaced braces (C). Vole molars cultured with the braces rescue wild-type vole cusp offset. The cuspal patterns of vole molars (which lack GFP reporter activity) are more visible in 3D reconstructions made from soft tissue tomography (D and E). The protoconid is marked with a white arrow, and the metaconid with a black arrow. Anterior is toward the top. (Scale bar, 500 µm.)
Fig. S4.
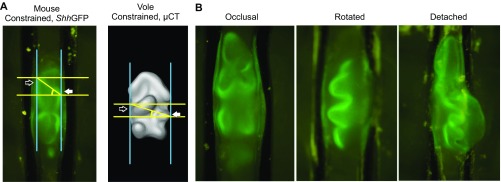
The method to measure cusp offset. Two parallel lines (yellow, perpendicular to the longitudinal axis of the tooth, marked with two blue lines) crossing the tips of the protoconid (white arrow) and the metaconid (black arrow) are used to delineate the diagonal line from the protoconid to the metaconid (A). Cusp offset is the angle measured from the protoconid. Measurements are shown for ex vivo cultured molars constrained laterally. The mouse molar is from a ShhGFP reporter mouse, the vole is segmented and reconstructed from microCT scan images. All the other cusp offsets measurements were performed the same way in in vivo and in vitro experiments and in extant and fossil teeth. In experiments, only teeth that remained in occlusal orientation were measured (Left), and rotated or detached teeth were excluded (B).
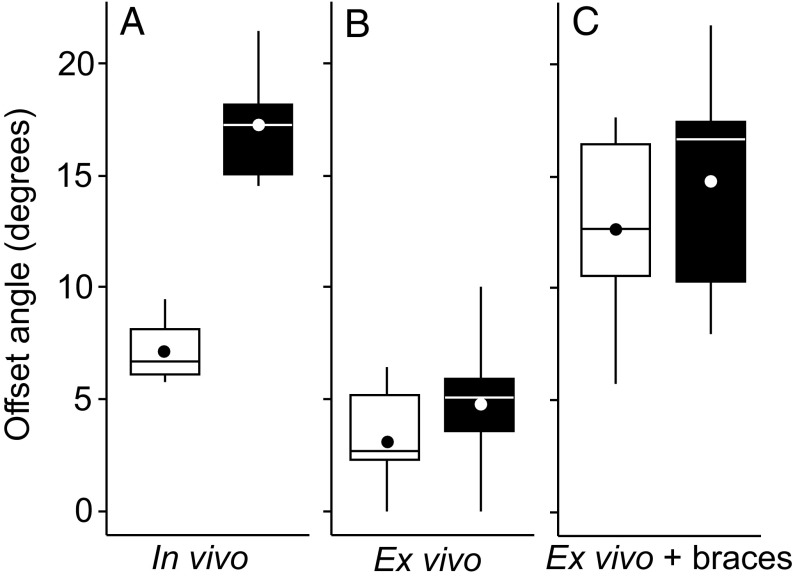
The results show that vole molars, when cultured ex vivo without surrounding jaw tissue, lose their in vivo alternate cusp pattern (Figs. 5A and 6 A and B). The change in the vole cusp offset is so large that the lateral cusp patterns of both the vole and the mouse are very similar ex vivo. Moreover, ex vivo cultured mouse molars showed more perfectly parallel cusp configuration than the small offset present in mouse teeth in vivo (Figs. 2A, 5, and 6 A and B). We note that, to our knowledge, this loss of cusp offset in cultured mouse molars has not been previously reported, most likely because it has been overlooked due to the subtleness of the offset in the in vivo mouse molars. Compared with in vivo molars and dental crypts in the jaw, the cultured mouse and vole molars grow wider (Table S3). In contrast to the lateral cusp patterns, longitudinal patterning of the teeth was largely unaffected during culture.
Fig. 6.
Both mouse and vole cusp offset can be controlled ex vivo. The mouse (white) and vole (black) cusp offset angles between the two first developing cusps, the protoconid and the metaconid, are distinct in vivo (n = 4 for mouse and 6 for vole) (A). In ex vivo cultured teeth, the cusps are almost parallel both in the mouse and the vole (n = 9 for mouse and 26 for vole) (B). In ex vivo cultured teeth with braces, the cusps show comparable offset both in the mouse and the vole (n = 6 for mouse and 5 for vole) (C). Boxes enclose 50% of observations; the median and mean are indicated with a horizontal bar and circle, respectively, and whiskers denote range. Statistical tests are in Table S5.
Table S3.
Mean widths of cultured teeth, in vivo reconstructed teeth, and dental crypts (in mm)
| Taxa | Day | Ex vivo | In vivo | Crypt | Ex vivo/in vivo | Ex vivo/crypt | ||||||
| Width | SD | N | Width | SD | N | Width | SD | N | ||||
| Mouse | E15 | 0.467 | 0.04 | 7 | 0.347 | 1 | 0.470 | 0.02 | 10 | 1.35 | 0.99 | |
| E16 | 0.553 | 0.07 | 7 | 0.351 | 0.01 | 3 | 0.471 | 0.04 | 10 | 1.58 | 1.17 | |
| E17 | 0.628 | 0.04 | 7 | 0.510 | 0.02 | 3 | 0.574 | 0.04 | 9 | 1.23 | 1.09 | |
| Vole | E15 | 0.406 | 0.06 | 26 | 0.299 | 0.04 | 3 | 0.317 | 1 | 1.36 | 1.28 | |
| E16 | 0.500 | 0.07 | 26 | 0.430 | 0.01 | 3 | 0.477 | 0.04 | 2 | 1.16 | 1.05 | |
| E17 | 0.610 | 0.09 | 26 | 0.485 | 0.01 | 2 | 0.603 | 0.02 | 5 | 1.26 | 1.01 | |
As a result of the tissue shrinkage of fixed soft tissue, the in vivo measurements (from CT reconstructions) can be considered underestimates compared with the crypt (from Fig. S5A) and ex vivo (from cultures) measurements.
Because whole-tooth primordia can be cultured only in isolation from the jaw and bone, we used artificial lateral constraints on the growing tooth to test whether they modify lateral cusp patterns. We used stainless steel wires to make small braces that limit the lateral growth of the rodent molar to a fixed width of ≈400 to ≈500 µm (Fig. 5 C and D; Materials and Methods). These widths approximate the distances between the buccal and lingual jawbone when cusp configuration is being determined (Fig. S5A).
Fig. S5.
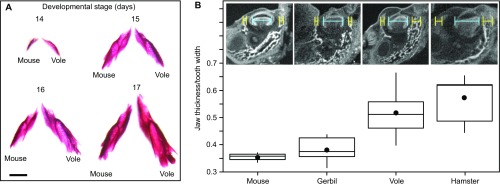
Measurements of developing jaws. (A) Alizarin red-stained mandibles of the mouse and the vole. The buccolingual widths of the developing dental crypts are in Table S3. (Scale bar, 1 mm.) (B) Total width of the developing buccal and lingual jaw bone (yellow) relative to the corresponding tooth width (blue) in the mouse and gerbil (M. unguiculatus) that lack pronounced cusp offset (mean, 5.8 and 6.1 degrees, respectively), and in the vole and hamster (M. auratus) that have more pronounced cusp offset (mean, 17.3 and 13.6 degrees, respectively; n = 3 for all four species). Measurements were taken from microCT scans at the midpoint anteroposteriorly. Stages measured were for mouse E15 (n = 1) and E16 (n = 3), for gerbil E20.5 (n = 2) and E21 (n = 3), for vole E15 (n = 3) and E16 (n = 3), and for hamster E13 (n = 4) and E14 (n = 3). Boxes enclose 50% of observations; the median and mean are indicated with a horizontal bar and circle, respectively, and whiskers denote range.
In the culture experiments using braces, the alternate vole pattern was partially restored (Figs. 5 D and E and 6C; Tables S4 and S5). Furthermore, some of the mouse molars cultured with braces switched to the alternate-like vole pattern (Figs. 5 D and E and 6C). These results indicate that lateral constraint of the developing m1 ex vivo is necessary to recover the cusp offset of the vole crown, and sufficient to transform mouse m1 cusp offset into vole m1 pattern. Compared with the in vivo patterns, the cusp offset angles were highly variable in the brace experiments (Fig. 6; Tables S4 and S5). While the high variability is likely to reflect variation in the experimental settings, our modeling also suggests buccal and lingual sides may have to be constrained differently to fully capture the in vivo patterns (Fig. S2D; Table S2). This inference from the modeling agrees with the dynamics of real molar development; in developing mouse and vole molars, the lingual side expands more during the initiation of cusp development, and the first lingual secondary enamel knot establishes the metaconid cusp (28). On the buccal side, the protoconid cusp is established by the remnants of the primary enamel knot.
Table S4.
Measurements of the cusp angles in vivo, ex vivo, and ex vivo with constraints (in degrees)
| Experiment | Angle |
| Mouse in vivo | 6.46 |
| 9.39 | |
| 6.95 | |
| 5.81 | |
| Mouse ex vivo | 0 |
| 5.21 | |
| 2.64 | |
| 6.37 | |
| 2.66 | |
| 0 | |
| 2.31 | |
| 2.93 | |
| 5.99 | |
| Mouse ex vivo + braces | 10.52 |
| 17.57 | |
| 16.38 | |
| 12.67 | |
| 5.65 | |
| 12.58 | |
| Vole in vivo | 17.54 |
| 17.01 | |
| 15.03 | |
| 14.49 | |
| 18.14 | |
| 21.50 | |
| Vole ex vivo | 3.66 |
| 5.99 | |
| 5.05 | |
| 8.29 | |
| 5.27 | |
| 5.19 | |
| 3.87 | |
| 5.16 | |
| 7.15 | |
| 3.55 | |
| 5.02 | |
| 3.25 | |
| 1.67 | |
| 3.02 | |
| 2.11 | |
| 5.41 | |
| 4.62 | |
| 0 | |
| 6.17 | |
| 4.54 | |
| 5.19 | |
| 3.63 | |
| 9.98 | |
| 7.32 | |
| 6.20 | |
| 3.03 | |
| Vole ex vivo + braces | 10.21 |
| 16.62 | |
| 21.72 | |
| 17.41 | |
| 7.91 |
Only teeth that grew in occlusal orientation were measured (Fig. S4B). Twenty-four percent (15/63) of mouse molars and 40% (31/78) of vole molars in culture were measured.
Table S5.
Statistical tests of cusp angle differences
| Mann-Whitney U randomization test | Vole in vivo | Mouse in vivo | Vole ex vivo | Mouse ex vivo | Vole ex vivo + braces | Mouse ex vivo + braces |
| Vole in vivo | 0.0095 | 0.0002 | 0.0004 | 0.5368 | 0.0649 | |
| Mouse in vivo | 0.0054 | 0.0303 | 0.0112 | 0.0317 | 0.1143 | |
| Vole ex vivo | 0.0000 | 0.0467 | 0.0858 | 0.0008 | 0.0067 | |
| Mouse ex vivo | 0.0001 | 0.0134 | 0.0588 | 0.0010 | 0.0016 | |
| Vole ex vivo + braces | 0.3492 | 0.0521 | 0.0000 | 0.0004 | 0.6623 | |
| Mouse ex vivo + braces | 0.0361 | 0.0514 | 0.0000 | 0.0007 | 0.4666 |
The upper diagonal of the table shows Mann–Whitney U-test results (two-tailed significance levels obtained using Monte Carlo permutations), and the lower diagonal shows permutation tests of differences between group means (two-tailed significance levels obtained using 10,000 permutations). When a Bonferroni-corrected multiple comparisons is used, the significance level is 0.0033 for 15 comparisons; the P values below the threshold are marked in bold. Values tested are from Table S4.
Finally, because our wire experiments physically limit the lateral expansion of growing teeth, we explored whether jaw thickness during the patterning might be associated with lateral cusp configuration. We measured jaw thickness during the patterning in mouse, gerbil (Meriones unguiculatus), vole, and hamster (Mesocricetus auratus) jaws, with the former two lacking and the latter two having a more pronounced cusp offset, respectively. The results show that the vole and the hamster jaws are thicker relative to tooth width than the mouse and the gerbil jaws (Fig. S5B), suggesting cusp offset might be associated with more robust jaws during development. However, because bone geometry and heterogeneity of mineral density also affect bone properties (35), the exact role of the jaw structure remains to be determined. It is equally possible that the role of the jaw in the development of the lateral cusp configuration is relatively passive by providing a 3D constraint or support for the growing tooth.
Discussion
The spatiotemporal association of jawbone formation with the appearance of the lateral cusp offset, the requirement of lateral constraints to achieve cusp offset in cultured teeth, and the computational modeling implicating lateral biases in the regulation of cusp offset all point to the jaw providing a 3D environment that physically facilitates the formation of the correct cusp patterns. A relevant aspect of the system is that the physical effect occurs during early stages of tooth development when mineralized jawbone is already present, whereas mineralization has not yet begun in molars. One implication of our results is that cusp offset might be more sensitive to disturbances than other aspects of tooth shape. Another possibility is that the jawbone may form a developmental module with the teeth that specifically affects the lateral cusp configuration. This interpretation is in agreement with, and may provide comparative support for, studies implicating stronger genetic links between body size and tooth width than between body size and tooth length (36, 37). Nevertheless, additional comparative studies will be needed to decompose the multifactorial quagmire (38) of selective targets on tooth phenotypes.
Regardless of the exact molecular details of the interactions between the tooth and the jaw, our analyses suggest organs may outsource specific aspects of morphology to be regulated by adjacent body parts or organs. This kind of physical outsourcing differs from developmental integration in which, for example, adjacent organs affect the size of each other (9, 39–41). It remains to be explored what kind of organs are more purely self-regulated (genetically and physically), and what kind of organs are more likely to have evolved regulatory feedback mechanisms with surrounding tissues that physically modify shape.
Finally, the morphology-specific effect of the lateral constraint in regulating cusp configuration may explain why the role of the jaw has not been realized previously. The model species of dental research, the mouse, has close to parallel cusp configuration, and thus mouse teeth develop relatively normally in organ culture. This point underscores the importance of evolutionary comparative data for research on biological pattern formation, including organ engineering, where the role of surrounding or adjacent tissue in regulating organ shape is unknown.
Materials and Methods
Mouse and Vole Teeth.
The development of the lower jawbone was observed in the vole species (M. glareolus) and the mouse species (M. musculus) from embryonic day 15 (E15), when it starts to reach the buccal side of the developing tooth, to stage E17, when the crown cusp pattern is settled. The appearance of the vaginal plug was taken as developmental stage 0 (E0) in mouse and vole. The developmental stages were defined by limb morphology and tooth comparison in both mouse and vole. Adult vole and mouse skulls were used to compare the final process of tooth implantation into the jawbone. Positive embryos from Shhwt/GFPcre reporter mice expressing green fluorescent protein under a Sonic hedgehog promoter (42) were used in the constraint experiment. The epifluorescence of ShhGFP molars was used to visualize the enamel knots leading to the cusp pattern development. ShhGFP mutant mice were maintained in a Naval Medical Research Institute background. All the procedures of this study involving animals were reviewed and approved by the National Animal Experiment Board, Helsinki.
MicroC -Data and 3D Reconstructions.
MicroCT scans on dissected half-lower jaws allowed us to reconstruct in three dimensions the codevelopment of teeth and jawbone. Dissected tissue samples were fixed overnight in 4% paraformaldehyde (PFA) and then dehydrated in 50–70% ethanol overnight. To increase tissue contrast during the microCT scanning, soft tissues were stained overnight with 0.3% (wt/vol) phosphotungstic acid in 70% ethanol. Then samples were stored at 4 °C in 70% ethanol (43). Samples were scanned in 70% ethanol. X-ray microCT of the lower jaws was obtained with a custom-built microCT system Nanotom 180 NF (with an effective voxel size between 3 and 8 μm). Tooth segmentations between epithelium and mesenchyme were performed with Image J 1.45c software (https://imagej.nih.gov/ij) and Amira (FEI Visualization Science Group). Jawbones were segmented with Amira and Avizo software (FEI Visualization Science Group). Both structures were assembled in Amira and Avizo software. Three embryos were used for each developmental stage (E15–E17) in mouse and vole. In addition, alveolar bone thickness (relative to tooth width) was measured from buccal and lingual sides at the level of the broadest part of the developing molar in mouse, gerbil, vole, and hamster teeth (Fig. S5B). The measured mouse and vole stage E15 and E16 equivalents were E13 and E14 in the hamster and E20.5 and E21 in the gerbil. Adult skulls were scanned without specific staining. Fossil specimens were scanned using a microtomograph VISCOM ×8050 (Centre de Microtomographie at the University of Poitiers) (26). All the subfamilies were measured from one or two genera. Phylogenetic relationships and molecular estimated dates of divergence from ref. 44, and fossil dates from refs. 45 and 46.
Modeling Buccolingual Biases in Silico with ToothMaker.
We used ToothMaker (12) to find parameters that would reproduce a buccolingual bias during the developing molars in silico (Table S2). The model integrates experimentally inferred genetic interactions with tissue biomechanics to simulate tooth development. The genetic parameters entail three diffusible signals: an activator inducing enamel knots, an enamel knot-secreted inhibitor of enamel knot formation, and a growth factor regulating growth of the epithelium and the mesenchyme. The buccal (Bbi) and lingual (Lbi) bias parameters adjust for the differential expression of activator in the mesenchyme surrounding the tooth germ in the buccal and lingual sides. Since the activator inhibits epithelial growth, these biases result in stronger or weaker lateral expansion of the tooth, which indirectly affects the positions to which new enamel knots and cusps form. In addition to the lateral biases, we increased the anterior side elongation of the tooth (Abi) relative to the posterior growth (Pbi). The model was run for 14,000 iterations. ToothMaker software is freely available for Windows, MacOS, and Linux (available from the authors).
Histological Sections and Analyses.
Head samples of embryonic mouse and voles were fixed in 4% PFA at 37 °C for 30 min, and the 4% PFA was then changed every 30 min over the course of 3 h at room temperature. Then the samples stayed overnight in 4% PFA at 4 °C. Samples were paraffin embedded over the course of 64.5 h in a Leica ASP200: 1 min, milliQ-H2O; 10 h, 70% ethanol; 14 h, 94% ethanol; 3×2 h of absolute ethanol washes; 3×3.5 h of xylene washes; 3×8 h of paraffin embedding. Samples were not decalcified to preserve the structure of the mineralized jawbone. Histological sections are 10 μm thick. To observe the cell structure of the tooth-jawbone relationship between mouse and vole, histological sections were stained with hematoxylin and eosin, using standard protocols.
TRAP or acid phosphatase leukocyte (Sigma-Aldrich, Proc. No. 387) was used to stain osteoclast cells in mouse and vole alveolar jawbone from E15 to E17 developmental stages. The deparaffination protocol used xylene 100% for 10 min (four steps), absolute ethanol for 5 min (three steps), and 94% ethanol (two steps), 75% ethanol (one step), 50% ethanol (one step), and reverse osmosis water for 3 min each. The staining was performed on paraffin sections of 7 μm thickness, according to the manufacturer protocol, in 60-mL jars. The temperature was carefully maintained at 37 °C for all the solutions. Slides were not air-dried, but cover-slipped with water-based mounting. Pictures were taken with a Zeiss microscope Axio Imager 2 with Bright Field mode.
Ex Vivo Culturing Experiments of Mouse and Vole Molar Explants.
Mouse and vole tooth germs from E14 were cultured ex vivo, subjected to a constraint on lateral growth by placing a wire barrier on both sides of the tooth germ (Fig. 5B). Autoclaved stainless steel wires (0.016 mm and 0.007 mm) were used in experiments. Both wire widths produced comparable results. Only the experiments for which the distance between wires remained constant in all sequential images were measured. Wire distances of ≈400–500 µm were used for the experiments. Wider and narrower wire distances were also tried. The former had no discernable effect on cusp offset, and the narrower caused severe distortion of the tooth. Tooth germs were cultured in a Trowell-type organ culture system using established tooth culture methods (47) for 4–5 d. The culture medium was changed every 2 d. Pictures were taken every 24 h from the first day of culture with a fluorescent microscope LEICA MZFLIII¨¨ and a fluorescent stereomicroscope ZEISS-Lumar V12 for the ShhGFP mice and with an Olympus SZX9 for mouse and vole bright light images.
Cusp-Offset Measurements of the Protoconid and the Metaconid in Developing and Fully Formed Teeth.
The two first cusps to develop in every lower molar of rodents are the protoconid (buccal) and the metaconid (lingual) (28). The cusp-offset angle was measured between these two cusps during all the developmental stages studied, in both constrained and nonconstrained teeth. The measurements corresponding to the stage E14+4 d of culture were used in comparison with the in vivo measurements. The angle was measured between the external tangents of the anterior edge of the cusps and the lines crossing the cusps tips (Fig. S4). This method reduces the error that could be made measuring the cusp tip, especially in flat surfaces such as the vole teeth. Statistical tests were performed using Mann-Whitey U tests, and random permutation tests on differences between group means (Table S5).
Supplementary Material
Acknowledgments
We thank Alistair Evans, Klaus Tähkä, and the members of the Center of Excellence in Experimental and Computational Developmental Biology for discussions, comments, or advice, and Agnés Viherä, Riikka Santalahti, Aki Kallonen, and Ann-Christine Aho for expert technical assistance. This study was supported by the Academy of Finland.
Footnotes
The authors declare no conflict of interest.
This article is a PNAS Direct Submission.
This article contains supporting information online at www.pnas.org/lookup/suppl/doi:10.1073/pnas.1707410114/-/DCSupplemental.
References
- 1.Fraser GJ, et al. An ancient gene network is co-opted for teeth on old and new jaws. PLoS Biol. 2009;7:e31. doi: 10.1371/journal.pbio.1000031. [DOI] [PMC free article] [PubMed] [Google Scholar]
- 2.Jernvall J, Thesleff I. Tooth shape formation and tooth renewal: Evolving with the same signals. Development. 2012;139:3487–3497. doi: 10.1242/dev.085084. [DOI] [PubMed] [Google Scholar]
- 3.Butler PM. The ontogeny of molar pattern. Biol Rev Camb Philos Soc. 1956;31:30–70. [Google Scholar]
- 4.Glasstone S. Regulative changes in tooth germs grown in tissue culture. J Dent Res. 1963;42:L1364–L1368. doi: 10.1177/00220345630420061101. [DOI] [PubMed] [Google Scholar]
- 5.Fisher AR. Morphological development in vitro of the whole and halved lower molar tooth germ of the mouse. Arch Oral Biol. 1971;16:1481–1496. doi: 10.1016/0003-9969(71)90084-7. [DOI] [PubMed] [Google Scholar]
- 6.Kassai Y, et al. Regulation of mammalian tooth cusp patterning by ectodin. Science. 2005;309:2067–2070. doi: 10.1126/science.1116848. [DOI] [PubMed] [Google Scholar]
- 7.Plikus MV, et al. Morphoregulation of teeth: Modulating the number, size, shape and differentiation by tuning Bmp activity. Evol Dev. 2005;7:440–457. doi: 10.1111/j.1525-142X.2005.05048.x. [DOI] [PMC free article] [PubMed] [Google Scholar]
- 8.Klein OD, et al. Sprouty genes control diastema tooth development via bidirectional antagonism of epithelial-mesenchymal FGF signaling. Dev Cell. 2006;11:181–190. doi: 10.1016/j.devcel.2006.05.014. [DOI] [PMC free article] [PubMed] [Google Scholar]
- 9.Kavanagh KD, Evans AR, Jernvall J. Predicting evolutionary patterns of mammalian teeth from development. Nature. 2007;449:427–432. doi: 10.1038/nature06153. [DOI] [PubMed] [Google Scholar]
- 10.Ahn Y, Sanderson BW, Klein OD, Krumlauf R. Inhibition of Wnt signaling by Wise (Sostdc1) and negative feedback from Shh controls tooth number and patterning. Development. 2010;137:3221–3231. doi: 10.1242/dev.054668. [DOI] [PMC free article] [PubMed] [Google Scholar]
- 11.Charles C, et al. Regulation of tooth number by fine-tuning levels of receptor-tyrosine kinase signaling. Development. 2011;138:4063–4073. doi: 10.1242/dev.069195. [DOI] [PMC free article] [PubMed] [Google Scholar]
- 12.Harjunmaa E, et al. Replaying evolutionary transitions from the dental fossil record. Nature. 2014;512:44–48. doi: 10.1038/nature13613. [DOI] [PMC free article] [PubMed] [Google Scholar]
- 13.Roth VL. Fabricational noise in elphant dentitions. Paleobiology. 1989;15:165–179. [Google Scholar]
- 14.Miles AEW, Grisgson C. Colyer’s Variations of the Teeth of Animals. Cambridge University Press; Cambridge: 2003. [Google Scholar]
- 15.Philbrick WM, Dreyer BE, Nakchbandi IA, Karaplis AC. Parathyroid hormone-related protein is required for tooth eruption. Proc Natl Acad Sci USA. 1998;95:11846–11851. doi: 10.1073/pnas.95.20.11846. [DOI] [PMC free article] [PubMed] [Google Scholar]
- 16.Liu J-G, et al. Parathyroid hormone-related peptide is involved in protection against invasion of tooth germs by bone via promoting the differentiation of osteoclasts during tooth development. Mech Dev. 2000;95:189–200. doi: 10.1016/s0925-4773(00)00366-x. [DOI] [PubMed] [Google Scholar]
- 17.Kitahara Y, et al. Disturbed tooth development in parathyroid hormone-related protein (PTHrP)-gene knockout mice. Bone. 2002;30:48–56. doi: 10.1016/s8756-3282(01)00669-x. [DOI] [PubMed] [Google Scholar]
- 18.Mekaapiruk K, et al. The influence of parathyroid hormone-related protein (PTHrP) on tooth-germ development and osteoclastogenesis in alveolar bone of PTHrP-knock out and wild-type mice in vitro. Arch Oral Biol. 2002;47:665–672. doi: 10.1016/s0003-9969(02)00026-2. [DOI] [PubMed] [Google Scholar]
- 19.Sun W, et al. Alterations in phosphorus, calcium and PTHrP contribute to defects in dental and dental alveolar bone formation in calcium-sensing receptor-deficient mice. Development. 2010;137:985–992. doi: 10.1242/dev.045898. [DOI] [PMC free article] [PubMed] [Google Scholar]
- 20.Wysolmerski JJ, et al. Absence of functional type 1 parathyroid hormone (PTH)/PTH-related protein receptors in humans is associated with abnormal breast development and tooth impaction. J Clin Endocrinol Metab. 2001;86:1788–1794. doi: 10.1210/jcem.86.4.7404. [DOI] [PubMed] [Google Scholar]
- 21.Alfaqeeh SA, Gaete M, Tucker AS. Interactions of the tooth and bone during development. J Dent Res. 2013;92:1129–1135. doi: 10.1177/0022034513510321. [DOI] [PubMed] [Google Scholar]
- 22.Salazar-Ciudad I, Jernvall J. A gene network model accounting for development and evolution of mammalian teeth. Proc Natl Acad Sci USA. 2002;99:8116–8120. doi: 10.1073/pnas.132069499. [DOI] [PMC free article] [PubMed] [Google Scholar]
- 23.Butler PM. In: Evolutionary Relationships among the Rodents: A Multidisciplinary Approach. Luckett WP, Hartenberger JL, editors. Plenum Press; New York, London: 1985. pp. 381–401. [Google Scholar]
- 24.Hartenberger J-L. Une Brève Histoire de Mammifères: Bréviaire de Mammalogie. Belin; Paris: 2001. [Google Scholar]
- 25.Evans AR, Wilson GP, Fortelius M, Jernvall J. High-level similarity of dentitions in carnivorans and rodents. Nature. 2007;445:78–81. doi: 10.1038/nature05433. [DOI] [PubMed] [Google Scholar]
- 26.Lazzari V, et al. In: Evolution of the Rodents: Advances in Phylogeny, Functional Morphology and Development. Cox PG, Hautier L, editors. Cambridge University Press; United Kingdom: 2015. pp. 448–477. [Google Scholar]
- 27.Lazzari V, et al. Mosaic convergence of rodent dentitions. PLoS One. 2008;3:e3607. doi: 10.1371/journal.pone.0003607. [DOI] [PMC free article] [PubMed] [Google Scholar]
- 28.Jernvall J, Keränen SVE, Thesleff I. Evolutionary modification of development in mammalian teeth: Quantifying gene expression patterns and topography. Proc Natl Acad Sci USA. 2000;97:14444–14448. doi: 10.1073/pnas.97.26.14444. [DOI] [PMC free article] [PubMed] [Google Scholar]
- 29.Michon F. Tooth evolution and dental defects: From genetic regulation network to micro-RNA fine-tuning. Birth Defects Res A Clin Mol Teratol. 2011;91:763–769. doi: 10.1002/bdra.20787. [DOI] [PubMed] [Google Scholar]
- 30.Harjunmaa E, et al. On the difficulty of increasing dental complexity. Nature. 2012;483:324–327. doi: 10.1038/nature10876. [DOI] [PubMed] [Google Scholar]
- 31.Lan Y, Jia S, Jiang R. Molecular patterning of the mammalian dentition. Semin Cell Dev Biol. 2014;25-26:61–70. doi: 10.1016/j.semcdb.2013.12.003. [DOI] [PMC free article] [PubMed] [Google Scholar]
- 32.Salazar-Ciudad I, Jernvall J. A computational model of teeth and the developmental origins of morphological variation. Nature. 2010;464:583–586. doi: 10.1038/nature08838. [DOI] [PubMed] [Google Scholar]
- 33.Renvoisé E, et al. Evolution of mammal tooth patterns: New insights from a developmental prediction model. Evolution. 2009;63:1327–1340. doi: 10.1111/j.1558-5646.2009.00639.x. [DOI] [PubMed] [Google Scholar]
- 34.Marks SC, Jr, Grolman M-L. Tartrate-resistant acid phosphatase in mononuclear and multinuclear cells during the bone resorption of tooth eruption. J Histochem Cytochem. 1987;35:1227–1230. doi: 10.1177/35.11.3655324. [DOI] [PubMed] [Google Scholar]
- 35.Reznikov N, Shahar R, Weiner S. Bone hierarchical structure in three dimensions. Acta Biomater. 2014;10:3815–3826. doi: 10.1016/j.actbio.2014.05.024. [DOI] [PubMed] [Google Scholar]
- 36.Hlusko LJ, Lease LR, Mahaney MC. Evolution of genetically correlated traits: Tooth size and body size in baboons. Am J Phys Anthropol. 2006;131:420–427. doi: 10.1002/ajpa.20435. [DOI] [PubMed] [Google Scholar]
- 37.Hlusko LJ, Schmitt CA, Monson TA, Brasil MF, Mahaney MC. The integration of quantitative genetics, paleontology, and neontology reveals genetic underpinnings of primate dental evolution. Proc Natl Acad Sci USA. 2016;113:9262–9267. doi: 10.1073/pnas.1605901113. [DOI] [PMC free article] [PubMed] [Google Scholar]
- 38.Polly PD. Quantitative genetics provides predictive power for paleontological studies of morphological evolution. Proc Natl Acad Sci USA. 2016;113:9142–9144. doi: 10.1073/pnas.1610454113. [DOI] [PMC free article] [PubMed] [Google Scholar]
- 39.Nijhout HF, Emlen DJ. Competition among body parts in the development and evolution of insect morphology. Proc Natl Acad Sci USA. 1998;95:3685–3689. doi: 10.1073/pnas.95.7.3685. [DOI] [PMC free article] [PubMed] [Google Scholar]
- 40.Emlen DJ. Costs and the diversification of exaggerated animal structures. Science. 2001;291:1534–1536. doi: 10.1126/science.1056607. [DOI] [PubMed] [Google Scholar]
- 41.Young NM, Winslow B, Takkellapati S, Kavanagh K. Shared rules of development predict patterns of evolution in vertebrate segmentation. Nat Commun. 2015;6:6690. doi: 10.1038/ncomms7690. [DOI] [PubMed] [Google Scholar]
- 42.Harfe BD, et al. Evidence for an expansion-based temporal Shh gradient in specifying vertebrate digit identities. Cell. 2004;118:517–528. doi: 10.1016/j.cell.2004.07.024. [DOI] [PubMed] [Google Scholar]
- 43.Metscher BD. MicroCT for comparative morphology: Simple staining methods allow high-contrast 3D imaging of diverse non-mineralized animal tissues. BMC Physiol. 2009;9:11. doi: 10.1186/1472-6793-9-11. [DOI] [PMC free article] [PubMed] [Google Scholar]
- 44.Steppan S, Adkins R, Anderson J. Phylogeny and divergence-date estimates of rapid radiations in muroid rodents based on multiple nuclear genes. Syst Biol. 2004;53:533–553. doi: 10.1080/10635150490468701. [DOI] [PubMed] [Google Scholar]
- 45.Fejfar O, Heinrich W-D, Kordos L, Maul LC. Microtoid cricetids and the early history of arvicolids (Mammalia, Rodentia) Palaeontol Electronica. 2011;14:PE14.3.27A. [Google Scholar]
- 46.Jacobs LL, Flynn LJ. In: Interpreting the Past: Essays on Human, Primate and Mammal Evolution. Lieberman D, Smith R, Kelley J, editors. Brill Academic; Leiden: 2005. pp. 63–80. [Google Scholar]
- 47.Sahlberg C, Mustonen T, Thesleff I. In: Methods of Molecular Biology. Epithelial Cell Culture Protocols. Wise C, editor. Humana Press; Totowa, NJ: 2009. pp. 373–382. [Google Scholar]
Associated Data
This section collects any data citations, data availability statements, or supplementary materials included in this article.


