We have designed and validated a fully automated quantitative system with which to detect and enumerate levels of thoracic and lumbar vertebral body compression fractures on CT images, determine Genant classification of compression severity and morphology, generate extended Genant scores for fracture lateralization, and measure bone attenuation.
Abstract
Purpose
To create and validate a computer system with which to detect, localize, and classify compression fractures and measure bone density of thoracic and lumbar vertebral bodies on computed tomographic (CT) images.
Materials and Methods
Institutional review board approval was obtained, and informed consent was waived in this HIPAA-compliant retrospective study. A CT study set of 150 patients (mean age, 73 years; age range, 55–96 years; 92 women, 58 men) with (n = 75) and without (n = 75) compression fractures was assembled. All case patients were age and sex matched with control subjects. A total of 210 thoracic and lumbar vertebrae showed compression fractures and were electronically marked and classified by a radiologist. Prototype fully automated spinal segmentation and fracture detection software were then used to analyze the study set. System performance was evaluated with free-response receiver operating characteristic analysis.
Results
Sensitivity for detection or localization of compression fractures was 95.7% (201 of 210; 95% confidence interval [CI]: 87.0%, 98.9%), with a false-positive rate of 0.29 per patient. Additionally, sensitivity was 98.7% and specificity was 77.3% at case-based receiver operating characteristic curve analysis. Accuracy for classification by Genant type (anterior, middle, or posterior height loss) was 0.95 (107 of 113; 95% CI: 0.89, 0.98), with weighted κ of 0.90 (95% CI: 0.81, 0.99). Accuracy for categorization by Genant height loss grade was 0.68 (77 of 113; 95% CI: 0.59, 0.76), with a weighted κ of 0.59 (95% CI: 0.47, 0.71). The average bone attenuation for T12-L4 vertebrae was 146 HU ± 29 (standard deviation) in case patients and 173 HU ± 42 in control patients; this difference was statistically significant (P < .001).
Conclusion
An automated machine learning computer system was created to detect, anatomically localize, and categorize vertebral compression fractures at high sensitivity and with a low false-positive rate, as well as to calculate vertebral bone density, on CT images.
© RSNA, 2017
Introduction
The societal burden of spine compression fractures is substantial, with an estimated 700 000–750 000 fractures per year in the United States (1–3). Compression fractures are reportedly underdiagnosed due to clinically silent fractures, nonspecific back pain, and unreported fractures (4–7). Early diagnosis is important, as partial compression of one vertebral body portends increased risk for progressive fracturing of that vertebra, compression fracturing of one vertebra positively correlates with subsequent compression fracturing of other vertebrae, and vertebral compression increases the risk profile for hip fractures (3,5,8–12). Mild compression fractures increase patient risk for new fractures, even as detection sensitivity is lower and interobserver variability is higher, lending importance to sensitive and uniform detection (6,13–16). Furthermore, increasing severity of prevalent fractures increases risk for incident fractures; thus, severity grading is important for risk stratification (8,10). Assessment of severity is also important, as compression of more than 50% increases the risk of segmental instability, and compression of more than 80%–90% may obviate vertebroplasty and kyphoplasty (2,17–19). Incident fracture risk is additionally linked to compression morphology, lending importance to determination of shape type (11). Finally, increased risk for vertebral fractures is independently linked to osteoporosis, with the combined risk factors of osteoporosis and prevalent fractures acting as risk multipliers (20–23). Early diagnosis enables one to initiate administration of bisphosphonates and selective estrogen receptor modulators to decrease the risk of subsequent fractures, versus management with an intervention such as kyphoplasty (7,17–19). A computer system that could be used to sensitively detect compression, classify the degree of height loss and pattern of compression, and assess bone mineral density would be useful in clinical detection and classification. This system could be integrated into an opportunistic detection framework to assess CT images obtained for indications other than vertebral fracture. It could also be used in research studies on risk prediction in clinical decision making.
The widely used semiquantitative Genant classification system was developed in the 1990s to assess vertebral compression deformities on two-dimensional radiographic images (3). We have created a system that updates the schema by using the full power of three-dimensional (3D) computed tomographic (CT) images with lateralization of the compression fracture patterns. When coupled with metrics such as bone density, this system has potential for use in prospective clinical trials, in the generation of risk factors for progressive vertebral body compression fracturing, and in the generation of statistical profiles for patients who may benefit from intervention rather than conservative care.
The purpose of this study was to create and validate a computer system with which to detect, localize, and classify compression fractures and to calculate bone density of thoracic and lumbar vertebral bodies on CT images.
Materials and Methods
Study Subjects
Our study was compliant with the Health Insurance Portability and Accountability Act and was conducted with institutional review board approval. Informed consent was waived for this retrospective study in which we analyzed previously obtained images.
Reports from CT examinations performed with the spine protocol were drawn from the imaging database of the University of California-Irvine medical center by using the radiology information system application Radiology Report Search (RadNet; Cerner Millennium, North Kansas City, Mo). The date of service for examinations selected ranged from 2012 to 2015. Figure E1 (online) shows a Standards for Reporting Diagnostic Accuracy Studies chart for the report search method.
Reports dictated as positive for thoracic or lumbar compression fractures within the search region from the T1 to L5 vertebrae were flagged, and associated CT images were reviewed with an Impax picture archiving and communications system, (AGFA, Mortsel, Belgium). During this review, exclusion criteria (Fig E1 [online]) for case selection were applied. A case set of 75 consecutive patients with one or more compression fractures was assembled. Additionally, images in 75 patients without fractures who were matched by age and sex to patients in the case set were assembled to constitute the control set. The mean age of patients was 73 years ± 11 (standard deviation), with an age range of 55–96 years. There were 46 women and 29 men in both the patient group and the group of age- and sex-matched control subjects. In the female cohort, the mean age was 76 years ± 10 (range, 56–92 years). In the male cohort, the mean age was 69 years ± 11 (range, 55–96 years). The age difference between the male and female cohorts was significant (P < .001).
Compression Fracture Identification and Description
CT images from the picture archiving and communication system were saved with soft-tissue reconstruction kernel in uncompressed Digital Imaging and Communications in Medicine format. Section thickness of the images ranged from 1.0 to 2.0 mm, and in-plane resolution ranged from 0.31 to 0.45 mm. In the 75-patient CT case set, the approximate centroid of each of the 210 thoracic and lumbar vertebrae that showed vertebral body compression fracture deformities was electronically marked and recorded (J.E.B., a board-certified radiologist with 10 years of experience).
Additionally, an enhanced Genant classification of vertebral body compression fractures by type (wedge, concave, or crush) and grade of height loss (grade 1, <25%; grade 2, 26%–40%; grade 3, >40%) was performed for 113 vertebrae in the case set. Classification was restricted to studies with no more than two contiguous fracture levels to mitigate the percentage height loss scaling inaccuracies in the assessment of patients with multiple contiguous compressed levels due to the lack of a standardized uniform anatomically proximate comparator. In creating the reference standard data set for percentage height loss, the reference point used was the nearest normal-appearing vertebra, which was chosen with qualitative visual inspection.
The axial profile of each vertebral body was divided into five zones (Fig 1). This zone division was designed to conform to the original Genant classification schema, with allowances for lateralization and development of an enhanced Genant classification.
Figure 1:
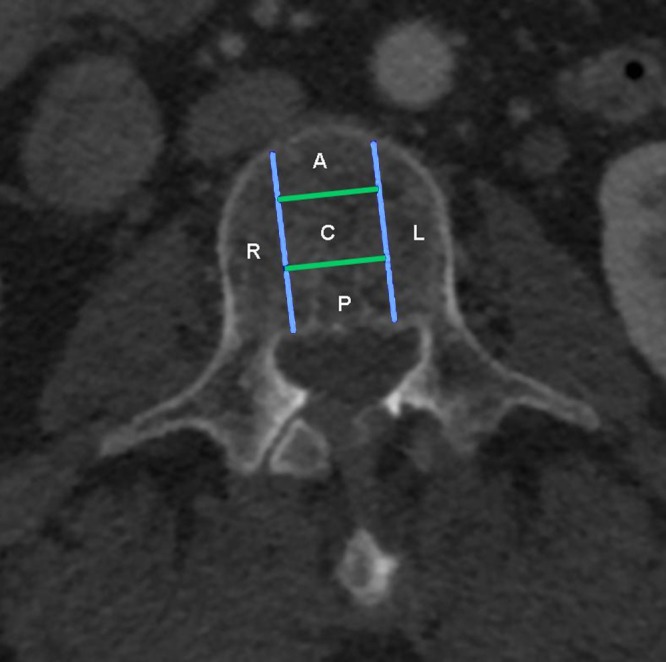
Axial CT image of a vertebra shows zone division of the vertebral body. The axial section of the vertebral bodies was divided into zones for determination of subsection of height loss. This zone division was designed to conform to the original Genant classification schema, with allowance for lateralization and development of an enhanced Genant classification schema. The two lateral zones created by the sagittal plane partitions are defined as R (right) and L (left). Three zones were created by partitioning the central sagittal region into three central coronal zones A (anterior), C (central), and P (posterior).
The reference standard for system performance was a manually annotated data set of compression deformities. Percentage height loss for each zone was manually determined by comparing it with the same zone on a neighboring uncompressed vertebra by using standard picture archiving and communication system measurement ratio tools on sagittal images (Table 1). Genant morphology classification was determined by manual image review of central sagittal subzones.
Table 1.
Statistics of Genant Grades
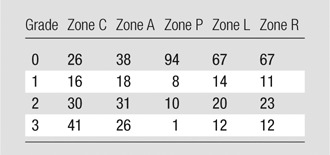
Note.—Data are number of vertebrae. Genant grades of height loss are as follows: grade 0, less than 15% height loss; grade 1, 15%–25% height loss; grade 2, 26%–40% height loss; and grade 3 more than 40% height loss. Lateral zones are created by the right (R) and left (L) sagittal plane partitions, and the central sagittal region was partitioned into three coronal zones: A (anterior), C (central), and P (posterior). See Figure 1 for a map of zone locations.
Quantitative Image Analysis Method
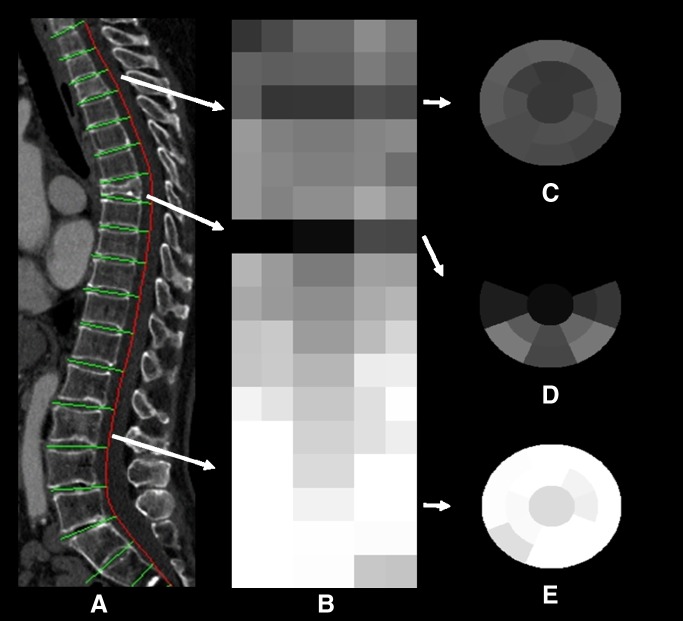
Automated segmentation of the spine and vertebral body partitioning was performed first, with detection of superior and inferior endplates of each vertebra (Fig 2a) (24). A height compass (height distribution across the vertebral body) was computed by partitioning the axial cross-section of a vertebral body into 17 sectors (Fig 2c–2e). Uniform and systematic averaging of sectors in the three vertebrae cranial to and in the three vertebrae caudal to the level of interest was used to determine relative height loss. Features such as mean vertebral height, height relative to neighboring vertebrae, and bone density can be assigned to each sector or zone. The height compass can be stacked together to form a global view of height distribution within the entire spinal column (Fig 2b). The pattern of the height compass (17 sectors, with three features for each sector) was analyzed and used to differentiate between fractured and normal vertebrae. Fifty-one features from these 17 sectors were considered, and all were used in our model. The technical aspects of this technique are discussed in more detail in the literature (25). The sector resolution of the system is then decreased to match the simpler enhanced Genant system classification five-zone model (Fig 1). The characteristics of the fractures are then graded by using a support vector regression technique, which is a supervised machine learning technique that associates vertebral height distribution with the fracture grades and types.
Figure 2:
Height compass and compression fracture detection and characterization. The geometric arrangement of the height compass is a compasslike structure, with a central circular sector surrounded by two ring-shaped finite thickness concentric bands. Each band is divided by eight radii of common central angles into eight sectors. All images were obtained in an 86-year-old woman with compression fractures. A, Sagittal CT section shows vertebral column segmentation and partitioning. B, Stacked height compass of the entire vertebral column. C, Height compass of a grade 2 concave fracture at T3. D, Height compass of a grade 3 wedge fracture at T7. E, Height compass of a normal vertebral body at L2.
Fully automated bone densitometry computation was then performed for T12-L4 vertebrae. Bone density algorithms had an origin in previous software developed to determine bone mineral density in the spine at CT (26). Vertebrae marked positive with the fracture-detection algorithms were excluded from densitometry calculations because of alterations in native bone density inherent in the compressive process. With previously computed vertebral segmentation and partitioning, the cortex was removed from the underlying trabecular bone via a process of adaptive erosion by up to 5 mm of the vertebral body periphery. Bone density was then estimated by averaging the attenuation (in Hounsfield units) within the remaining 3D medullary space (26,27).
Analysis of each case lasted approximately 5 minutes and was performed with a high-performance desktop computer with a dual 2.30-GHz central processing unit, 16.0-GB memory, and a 64-bit Windows 7 operating system (Dell Precision T7600; Dell, Round Rock, Tex).
The false-positive and false-negative compression fracture detections were reviewed and were decided in consensus by two board-certified fellowship-trained radiologists (J.E.B., R.M.S.; the latter had 19 years of experience).
Statistical Analyses
System performance for the CT data set was gauged by using free-response receiver operating characteristic (FROC) curve analysis with 10-fold cross validation. When we varied the support vector machine probability threshold in the determination of compression fracture versus a nonfractured vertebra, it resulted in the generation of the FROC curve. Confidence intervals (CIs) were obtained by resampling the test set 1000 times (bootstrapping) and averaging the performance.
The target computer-aided detection sensitivity in compression fracture detection was set at 90% or greater, which was in balance with a clinically reasonable false-positive rate, when we chose the FROC analysis operating point.
Results
Of the 75 patients in the case set, 25 had a fracture in one vertebral body, 19 had a fracture in two vertebral bodies, 13 had fractures in three vertebral bodies, four had fractures in four vertebral bodies, and 14 had fractures in five or more vertebral bodies for a total of 210 fractured thoracic and lumbar vertebral bodies with more than 10% height loss in the case set. An average of 2.8 vertebral body compression fracture deformities per patient and a range of one to nine compressed vertebrae per patient were identified in the case set. A total of 1275 vertebrae were evaluated with the computer system in the combined set of 150 CT examinations (case group, n = 75; control group, n = 75).
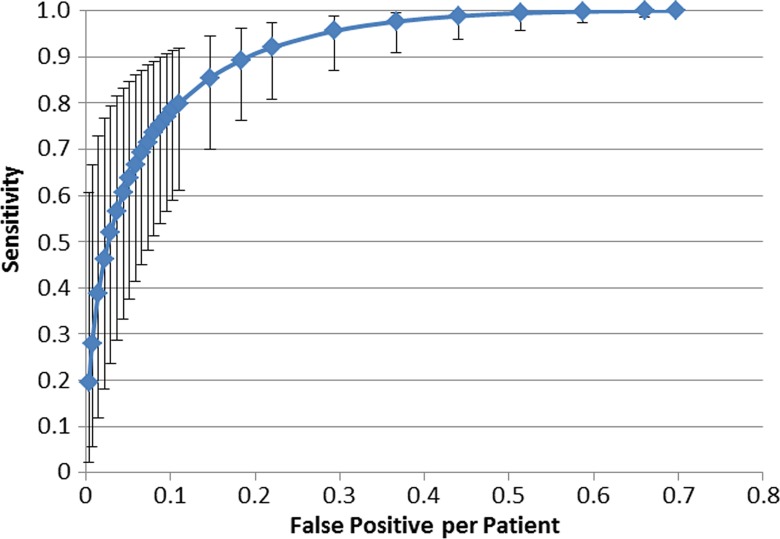
Sensitivity in the detection of vertebrae with compression fracture deformities was 95.7% relative to the reference standard (201 of 210 vertebrae, 95% CI: 87.0%, 98.9%), with a false-positive rate of 0.29 per patient (Fig 3). Additionally, at case-based receiver operating characteristic curve analysis, sensitivity was 98.7% and specificity was 77.3%.
Figure 3:
FROC curve of support vector machine performance in the detection of vertebral bodies with compression fractures shows 95.7% sensitivity (95% CI: 87%, 98.9%) with a false-positive rate of 0.29 per patient. Error bars represent 95% CIs.
Figure 4 shows examples of false-negative findings in compression fracture detection. Examples of true-positive findings are shown in Figure 5 and Figure E2 (online). Examples of false-positive findings are shown in Figure E3 (online). A total of 43 false-positive findings were generated with the system, of which nine (21%) were due to vertebra fusion, nine (21%) were due to degenerative height loss, six (14%) were due to an L5 vertebra variant, four (9%) were due to endplate deformation, four (9%) were due to partitioning error, three (7%) were due to osteopenia, and one (2%) was due to Scheuerman disease. Seven (16%) of the initially categorized false-positive findings were found to be mild compression fractures at secondary review; thus, these were true-positive detections omitted from the reference standard data set.
Figure 4:
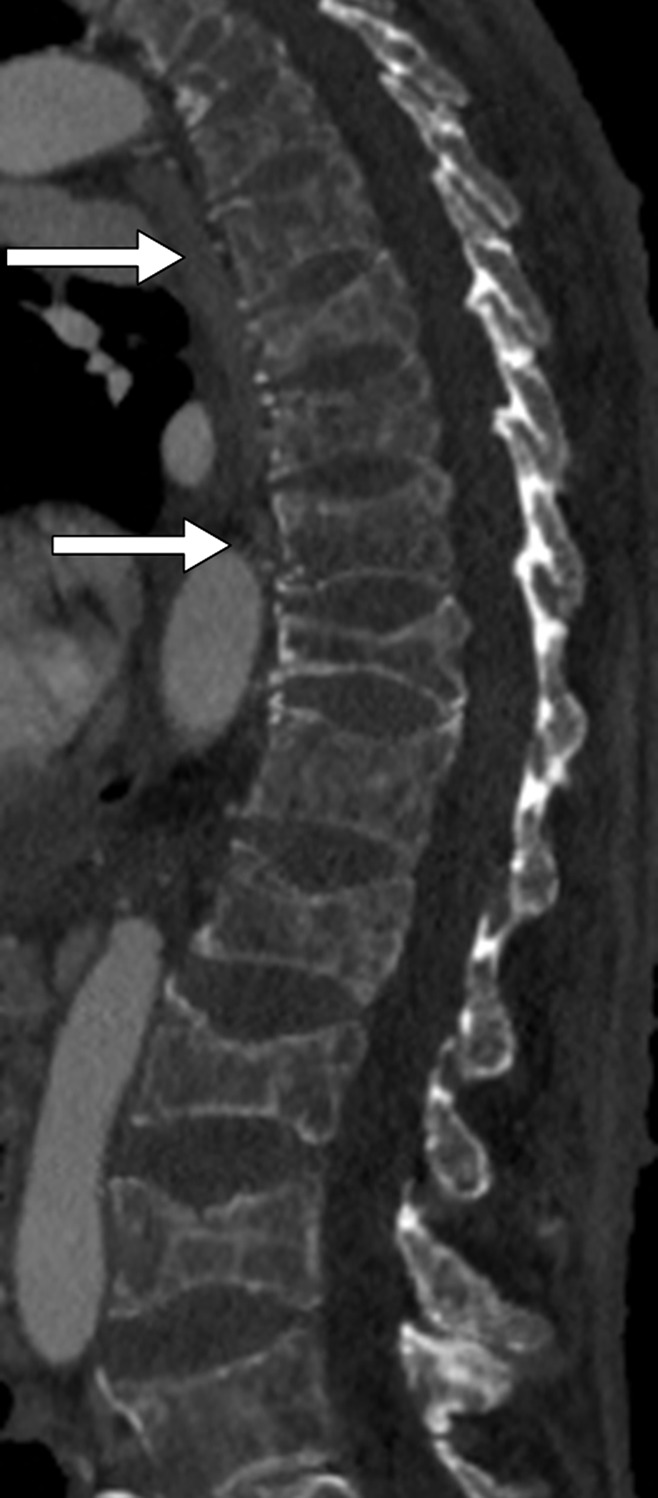
Sagittal CT section shows false-negative findings in compression fracture detection with the computer system in a 77-year-old male patient. Missed concave fractures (arrows) are visible at T8 and T11.
Figure 5a:
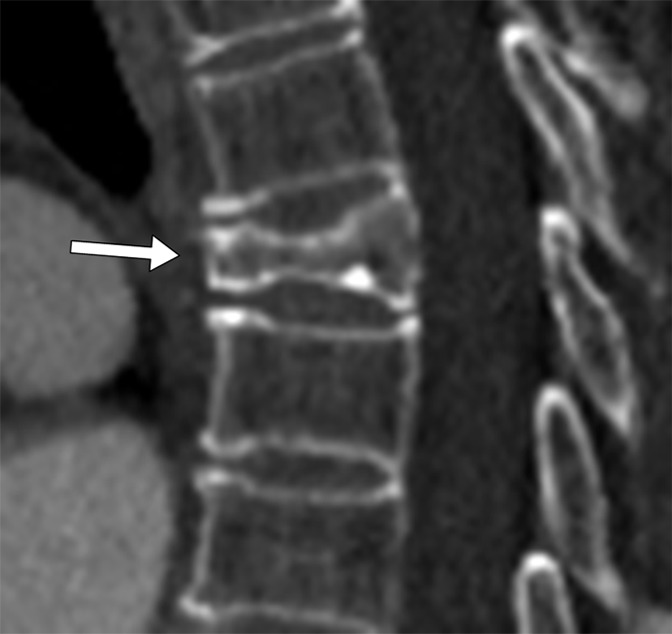
Sagittal CT sections show examples of compression fracture grading with the computer system. These are true-positive findings. (a) Image shows the T6 vertebra in an 86-year-old female patient. The radiologist grade was a grade 3 wedge fracture; the computer grade also was a grade 3 wedge fracture. (b) Image shows the T10 vertebra in a 79-year-old male patient. The radiologist grade was a grade 1 concave fracture; the computer grade was a grade 2 concave fracture.
Figure 5b:
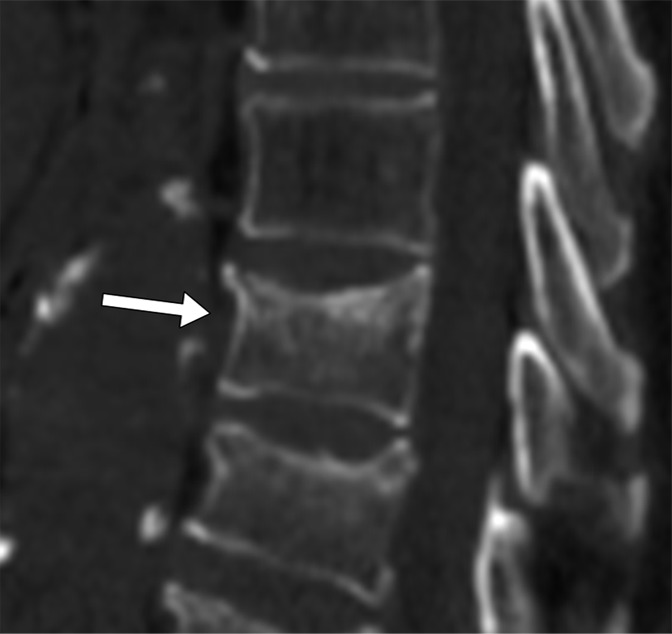
Sagittal CT sections show examples of compression fracture grading with the computer system. These are true-positive findings. (a) Image shows the T6 vertebra in an 86-year-old female patient. The radiologist grade was a grade 3 wedge fracture; the computer grade also was a grade 3 wedge fracture. (b) Image shows the T10 vertebra in a 79-year-old male patient. The radiologist grade was a grade 1 concave fracture; the computer grade was a grade 2 concave fracture.
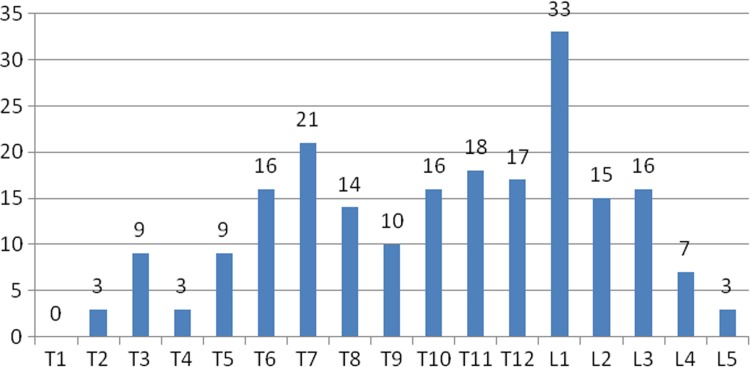
Fracture detection in the case set showed a bimodal distribution, with local peaks in the number of fractures at the L1 and T7 levels. The largest distribution of fractures was about the thoracolumbar junction (Fig 6).
Figure 6:
The distribution of vertebrae in the thoracic and lumbar spine with compression fracture deformities. This graph is annotated in standard anatomic fashion, with T1 indicating the first thoracic vertebra, L1 indicating the first lumbar vertebra, and so on. At the top of each bar is the number of compression fractures at that anatomic level in the case set. The expected bimodal distribution of the frequency of fractures is seen, with a peak in the midthoracic spine (at T7 here) and a peak in the upper lumbar spine (at L1).
The most common morphologic compression type found in the case set was the wedge-type anterior compression fracture. There were 80 wedge-type fractures, three crush fractures, and 30 biconcave fractures. The most common grade of fracture was grade 3 (>40% height loss). There were 35 grade 1, 31 grade 2, and 47 grade 3 fractures detected with the system.
System performance was determined relative to the manual annotation data set for the morphology of compression deformities. There was 95% overall agreement (107 of 113 vertebrae, 95% CI: 0.89, 0.98) for categorization of compression morphology (wedge, concave, or crush fracture) with the system relative to radiologist classification (Table 2). The calculated weighted κ coefficient was 0.90 (95% CI: 0.81, 0.99), which was consistent with the highest level agreement category (ie, very good agreement). FROC curves for compression morphology are shown in Figure E4 (online); crush-type morphology was not included in the curves because of small statistics.
Table 2.
Confusion Matrix of Genant Fracture Morphology: Radiologist versus Computer Assessment of Fracture Type

Note.—Data are number of cases with concordance (diagonal values) versus discrepancy (off-diagonal values) in the categorization of Genant fracture morphology by radiologist and by computer system. Of the 210 fractured vertebrae, 113 were assessed for type and grade of height loss and are listed in this table.
System performance was also determined relative to the manual annotation data set for the severity grade of compression deformities. There was 68% overall agreement (77 of 113 vertebrae, 95% CI: 0.59, 0.76) for categorization of compression severity (grade 1, 2, or 3) with the system relative to radiologist classification (Table 3). The calculated weighted κ coefficient was 0.59 (95% CI: 0.47, 0.71), which was indicative of moderate or good agreement. FROC curves of system performance for compression severity are shown in Figure 7. Additionally, system performance for severity grade of compression was also determined relative to manual annotation for each of the Genant-enhanced classification zones (A, C, P, R, or L). There was 59% overall agreement (66 of 113, 95% CI: 0.49, 0.67) for categorization of compression severity for zone A, 65% overall agreement (65 of 113, 95% CI: 0.49, 0.67) for categorization of compression severity for zone C, and 86% overall agreement (97 of 113, 95% CI: 0.78, 0.91) for categorization of compression severity for zone P. There was 69% overall agreement (78 of 113, 95% CI: 0.60, 0.77) for categorization of compression severity for zone R and 69% overall agreement (78 of 113, 95% CI: 0.60, 0.77) for categorization of compression severity for zone L. Figure 5 shows examples of compression fracture grading by a radiologist and with a computer. Additional examples of compression fracture grading can be found in Figure E5 (online).
Table 3.
Confusion Matrix of Genant Severity Grade: Radiologist versus Computer Assessment
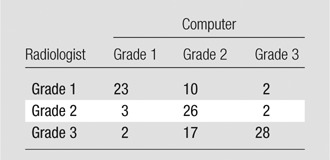
Note.—Data are number of cases with concordance (diagonal values) versus discrepancy (off-diagonal values) in the categorization of Genant severity grade by radiologist and by computer system. Genant grades of height loss are as follows: grade 0, less than 15% height loss; grade 1, 15%–25% height loss; grade 2, 26%–40% height loss; and grade 3 more than 40% height loss. Of the 210 fractured vertebrae, 113 were assessed for type and grade of height loss and are listed in this table.
Figure 7:
FROC curves arranged by grade. FROC curves of system performance for Genant fracture severity grade 1 (<25%), grade 2 (26%–40%), and grade 3 (>40%). The performance difference between grade 1 and grade 3 classification is significant (P = .05), while performance differences between grades 2 and 3 (P = .12) and between grades 1 and 2 (P = .64)
Bone densitometry results showed average bone density in patients with fractures was less than that in those without fractures, as we intuitively expected (Table 4). The average bone density for the T12-L4 interval was 146 HU ± 29 in the case set and 173 HU ± 42 in the control set. The difference in bone density was significant between case and control sets, both at individual vertebral levels from T12 to L4 as well as in summation (P < .001, paired t test). On an individual basis, bone density of each age- and sex-matched control patient exceeded that of the correlating case patient 67%–73% of the time, depending on the level from T12 to L4.
Table 4.
Bone Density Comparison of Case and Control Studies for Various Thoracolumbar Vertebral Levels

Note.—Bone attenuation is given as mean ± standard deviation.
Discussion
We designed and validated an automated machine learning system to detect and enumerate the level of vertebral compression fractures and to classify fracture morphology and severity according to Genant standards. We have updated the Genant schema to use the full power of 3D CT images. Additionally, this system was designed to delineate bone density, with the potential to provide combined metrics for risk stratification of progressive compression fracturing of prevalent vertebrae and incident vertebral fracturing based on both shape and compositional feature metrics.
The system holds potential to decrease interobserver variability of Genant classification via systematic and uniform quantitative compression assessment. The vertebral body is a 3D structure, and the system can be used to evaluate asymmetric left- and right-sided compression, extending the two-dimensional radiographic Genant system into three dimensions. As such, the system also enables assessment of postcompression scoliosis and kyphosis. This system holds potential in the determination of developmentally related scoliosis, and Scheuermann disease.
This system performed with 95.7% sensitivity in fracture detection and localization to the correct vertebral level, with a low false-positive rate. There was a high level of overall agreement (95%) for compression morphology and 68% overall agreement for severity categorization relative to radiologist classification.
Quantitative data generated by our system have the potential to decrease interobserver variability in compression fracture detection and in morphology and severity classification. Detailed information regarding morphology and severity, combined with the per-patient speed of analysis (approximately 5 minutes), can be used to predict future ability to provide repeatable, timely, and detailed evaluation of compression patterns within the Genant schema and to allow extension to new 3D classification schemas. Fracture risk stratification is of current interest in patients with osteopenia or osteoporosis (28). The stacked height compass model forms a global height loss view of the spinal column and may be applicable to the semiquantitative spinal deformity index risk matrix (29). Quantitative morphologic features of vertebrae, both individually and statistically as a group, in combination with bone density generated with the system, may further aid comparative effectiveness research, thereby generating predictive features and risk profiles for further fracturing and helping to guide the development of new treatment paradigms based on evidence-based medicine patient outcome studies.
The bimodal distribution of fractures mirrored that which was expected and reported in other works (15,21). Fracture severity was somewhat unusual. Grade 3 deformities were the most common finding, whereas we had expected grade 1 deformities to be the most common finding on the basis of prior studies (30). Possible reasons for this discrepancy include small sample size and sampling bias.
As intuitively expected, the system calculated a significantly lower bone density in the case population than in the age- and sex-matched control subjects, on average. On an individual case-matched basis, bone density of patients in the case group exceeded that of patients in the control group 27%–33% of the time. This was thought to be most likely related to selection bias and variation in the individual medical histories of patients in this small sample.
Prior work to assess vertebral compression fractures on lateral radiographs has reached the stage of clinical application (31,32). We have designed a system to assess height loss on CT images and to incorporate the 3D characteristics of the vertebral body. When compared with the method of Hsieh et al (33), vertebral body height loss is measured directly with 3D segmentation and partitioning of the vertebrae rather than indirectly by measuring spinal curvature. We have incorporated the left and right aspects for 3D lateralization, extending beyond anterior, middle, and posterior sagittal midline vertebral body height loss as in Ghosh et al (34) and Baum et al (25), and compared with Baum et al (25), we include the entire thoracic spine, not just the T5-T12 vertebrae. Additionally, we measured bone density in this study. Our group performed preliminary work in direct determination of height loss in the height compass model, without creation of a Genant model and without Genant categorization or assessment of bone density (35).
The main limitation of this system is thought to be the lack of concrete comparative manual reference standards with which to determine the percentage height loss. Posterior body wall compression can limit use as a reference standard for anterior compression. Normal architecture of the adjacent vertebrae can be variable due to degenerative change, variant anatomy, and compression fracture, limiting its use as a reference point. A normal increase in vertebral body size proceeding from cranial to caudal incorporates systematic error into the measure of relative height loss. The computer determined percentage height loss by uniform and systematic averaging of multiple adjacent vertebrae; this was difficult to replicate manually and was likely more accurate than manual assessment. A second limitation was related to the finite size of each axial zone with (generally) continuous variation of vertebral body height within each zone. The reference standard data were created by visual inspection of images for the approximate midpoint, allowing for skewed random variation in the choice of reference point. A third limitation was that our estimation of sensitivity was based on use of a cutoff derived from the data and the resulting FROC curve; thus, the calculated 95.7% sensitivity may be an overestimate. Finally, the bone density determined was not renormalized into bone mineral density units, as an external reference was not available for all patients in this retrospective study. However, Hounsfield units from clinical CT examinations have been previously shown to correlate with dual energy x-ray absorptiometry values (27).
In conclusion, we have designed and validated a fully automated quantitative system with which to detect and enumerate levels of thoracic and lumbar vertebral body compression fractures on CT images, determine Genant classification of compression severity and morphology, generate extended Genant scores for fracture lateralization, and generate bone densities. Our work is proposed as a proof-of-concept system for fracture risk stratification and clinical decision support.
Advances in Knowledge
■ A fully automated machine learning software system with which to detect, localize, and classify compression fractures and determine the bone density of thoracic and lumbar vertebral bodies on CT images was developed and validated.
■ The computer system has a sensitivity of 95.7% in the detection of compression fractures and in the localization of these fractures to the correct vertebrae, with a false-positive rate of 0.29 per patient.
■ The accuracy of this computer system in fracture classification by Genant type was 95% (weighted κ = 0.90).
Implications for Patient Care
■ This proof-of-function computer system depicts compression fractures of the thoracic and lumbar vertebrae with a high degree of sensitivity, devoid of interobserver variability, potentially enabling early detection and treatment to mitigate the risk of fracture progression or additional fractures.
■ This system enables one to discern the severity and pattern of compression of the fractured vertebra and bone density, and it has potential for use in risk stratification for further fracturing to help guide patient care.
■ Potential benefits of this system include automated classification of fractures with an extended three-dimensional Genant classification schema and standardized reporting of compression fractures.
SUPPLEMENTAL FIGURES
Received September 8, 2016; revision requested November 4; revision received December 5; accepted December 21; final version accepted January 12, 2017.
Supported by the Intramural Research Programs of the National Institutes of Health Clinical Center (1Z01 CL040004).
Disclosures of Conflicts of Interest: J.E.B. disclosed no relevant relationships. J.Y. Activities related to the present article: disclosed no relevant relationships. Activities not related to the present article: receives patent royalties from iCAD, received graphics card donations from Nvidia. Other relationships: disclosed no relevant relationships. R.M.S. Activities related to the present article: disclosed no relevant relationships. Activities not related to the present article: receives patent royalties from iCAD, receives research support from iCAD and Ping An, received graphics card donations from Nvidia. Other relationships: disclosed no relevant relationships.
Abbreviations:
- CI
- confidence interval
- FROC
- free-response receiver operating characteristic
- 3D
- three-dimensional
References
- 1.Riggs BL, Melton LJ, 3rd. The worldwide problem of osteoporosis: insights afforded by epidemiology. Bone 1995;17(5 Suppl):505S–511S. [DOI] [PubMed] [Google Scholar]
- 2.American Society of Neurological Surgeons . Vertebral compression fractures. In: American Society of Neurological Surgeons/Patient Information/Vertebral Compression Fractures. Rolling Meadows, Ill: American Society of Neurological Surgeons, 2016. [Google Scholar]
- 3.Lenchik L, Rogers LF, Delmas PD, Genant HK. Diagnosis of osteoporotic vertebral fractures: importance of recognition and description by radiologists. AJR Am J Roentgenol 2004;183(4):949–958. [DOI] [PubMed] [Google Scholar]
- 4.Lentle BC, Brown JP, Khan A, et al. Recognizing and reporting vertebral fractures: reducing the risk of future osteoporotic fractures. Can Assoc Radiol J 2007;58(1):27–36. [PubMed] [Google Scholar]
- 5.Francis RM, Aspray TJ, Hide G, Sutcliffe AM, Wilkinson P. Back pain in osteoporotic vertebral fractures. Osteoporos Int 2008;19(7):895–903. [DOI] [PubMed] [Google Scholar]
- 6.Fink HA, Milavetz DL, Palermo L, et al. What proportion of incident radiographic vertebral deformities is clinically diagnosed and vice versa? J Bone Miner Res 2005;20(7):1216–1222. [DOI] [PubMed] [Google Scholar]
- 7.Wong CC, McGirt MJ. Vertebral compression fractures: a review of current management and multimodal therapy. J Multidiscip Healthc 2013;6:205–214. [DOI] [PMC free article] [PubMed] [Google Scholar]
- 8.Siris ES, Genant HK, Laster AJ, Chen P, Misurski DA, Krege JH. Enhanced prediction of fracture risk combining vertebral fracture status and BMD. Osteoporos Int 2007;18(6):761–770. [DOI] [PubMed] [Google Scholar]
- 9.McCloskey EV, Vasireddy S, Threlkeld J, et al. Vertebral fracture assessment (VFA) with a densitometer predicts future fractures in elderly women unselected for osteoporosis. J Bone Miner Res 2008;23(10):1561–1568. [DOI] [PubMed] [Google Scholar]
- 10.Delmas PD, Genant HK, Crans GG, et al. Severity of prevalent vertebral fractures and the risk of subsequent vertebral and nonvertebral fractures: results from the MORE trial. Bone 2003;33(4):522–532. [DOI] [PubMed] [Google Scholar]
- 11.Lunt M, O’Neill TW, Felsenberg D, et al. Characteristics of a prevalent vertebral deformity predict subsequent vertebral fracture: results from the European Prospective Osteoporosis Study (EPOS). Bone 2003;33(4):505–513. [DOI] [PubMed] [Google Scholar]
- 12.Adams JE. Opportunistic identification of vertebral fractures. J Clin Densitom 2016;19(1):54–62. [DOI] [PubMed] [Google Scholar]
- 13.Roux C, Fechtenbaum J, Kolta S, Briot K, Girard M. Mild prevalent and incident vertebral fractures are risk factors for new fractures. Osteoporos Int 2007;18(12):1617–1624. [DOI] [PubMed] [Google Scholar]
- 14.Delmas PD, van de Langerijt L, Watts NB, et al. Underdiagnosis of vertebral fractures is a worldwide problem: the IMPACT study. J Bone Miner Res 2005;20(4):557–563. [DOI] [PubMed] [Google Scholar]
- 15.Samelson EJ, Christiansen BA, Demissie S, et al. Reliability of vertebral fracture assessment using multidetector CT lateral scout views: the Framingham Osteoporosis Study. Osteoporos Int 2011;22(4):1123–1131. [DOI] [PMC free article] [PubMed] [Google Scholar]
- 16.Schousboe JT, Debold CR. Reliability and accuracy of vertebral fracture assessment with densitometry compared to radiography in clinical practice. Osteoporos Int 2006;17(2):281–289. [DOI] [PubMed] [Google Scholar]
- 17.Alexandru D, So W. Evaluation and management of vertebral compression fractures. Perm J 2012;16(4):46–51. [DOI] [PMC free article] [PubMed] [Google Scholar]
- 18.Predey TA, Sewall LE, Smith SJ. Percutaneous vertebroplasty: new treatment for vertebral compression fractures. Am Fam Physician 2002;66(4):611–615. [PubMed] [Google Scholar]
- 19.Anselmetti GC, Muto M, Guglielmi G, Masala S. Percutaneous vertebroplasty or kyphoplasty. Radiol Clin North Am 2010;48(3):641–649. [DOI] [PubMed] [Google Scholar]
- 20.Ross PD, Genant HK, Davis JW, Miller PD, Wasnich RD. Predicting vertebral fracture incidence from prevalent fractures and bone density among non-black, osteoporotic women. Osteoporos Int 1993;3(3):120–126. [DOI] [PubMed] [Google Scholar]
- 21.Jager PL, Jonkman S, Koolhaas W, Stiekema A, Wolffenbuttel BH, Slart RH. Combined vertebral fracture assessment and bone mineral density measurement: a new standard in the diagnosis of osteoporosis in academic populations. Osteoporos Int 2011;22(4):1059–1068. [DOI] [PMC free article] [PubMed] [Google Scholar]
- 22.Huopio J, Kröger H, Honkanen R, Saarikoski S, Alhava E. Risk factors for perimenopausal fractures: a prospective study. Osteoporos Int 2000;11(3):219–227. [DOI] [PubMed] [Google Scholar]
- 23.Genant HK, Li J, Wu CY, Shepherd JA. Vertebral fractures in osteoporosis: a new method for clinical assessment. J Clin Densitom 2000;3(3):281–290. [DOI] [PubMed] [Google Scholar]
- 24.Yao J, O’Connor S, Summers R. Automated spinal column extraction and partitioning. In: International Symposium on Biomedical Imaging (ISBI). Arlington, Va: IEEE, 2006; 390–393. [Google Scholar]
- 25.Baum T, Bauer JS, Klinder T, et al. Automatic detection of osteoporotic vertebral fractures in routine thoracic and abdominal MDCT. Eur Radiol 2014;24(4):872–880. [DOI] [PubMed] [Google Scholar]
- 26.Summers RM, Baecher N, Yao J, et al. Feasibility of simultaneous computed tomographic colonography and fully automated bone mineral densitometry in a single examination. J Comput Assist Tomogr 2011;35(2):212–216. [DOI] [PMC free article] [PubMed] [Google Scholar]
- 27.Schreiber JJ, Anderson PA, Rosas HG, Buchholz AL, Au AG. Hounsfield units for assessing bone mineral density and strength: a tool for osteoporosis management. J Bone Joint Surg Am 2011;93(11):1057–1063. [DOI] [PubMed] [Google Scholar]
- 28.Unnanuntana A, Gladnick BP, Donnelly E, Lane JM. The assessment of fracture risk. J Bone Joint Surg Am 2010;92(3):743–753. [DOI] [PMC free article] [PubMed] [Google Scholar]
- 29.Crans GG, Genant HK, Krege JH. Prognostic utility of a semiquantitative spinal deformity index. Bone 2005;37(2):175–179. [DOI] [PubMed] [Google Scholar]
- 30.Diacinti D, Guglielmi G. Vertebral morphometry. Radiol Clin North Am 2010;48(3):561–575. [DOI] [PubMed] [Google Scholar]
- 31.Guglielmi G, Diacinti D, van Kuijk C, et al. Vertebral morphometry: current methods and recent advances. Eur Radiol 2008;18(7):1484–1496. [DOI] [PubMed] [Google Scholar]
- 32.Guglielmi G, Palmieri F, Placentino MG, D’Errico F, Stoppino LP. Assessment of osteoporotic vertebral fractures using specialized workflow software for 6-point morphometry. Eur J Radiol 2009;70(1):142–148. [DOI] [PubMed] [Google Scholar]
- 33.Hsieh MS, Tsai MD, Yeh YD, Jou SB. Automatic spinal fracture diagnosis and surgical management based on 3D image analysis and reconstruction of CT transverse sections. Biomed Eng Appl Basis Commun 2002;14(5):204–214. [Google Scholar]
- 34.Ghosh S, Alomari RS, Chaudhary V, Dhillon G. Automatic lumbar vertebra segmentation from clinical CT for wedge compression fracture diagnosis. In: Summers RM, van Ginneken B, eds. Proceedings of SPIE: medical imaging 2011—computer-aided diagnosis. Vol 7963. Bellingham, Wash: International Society for Optics and Photonics, 2011; 796303. [Google Scholar]
- 35.Yao J, Burns JE, Wiese T, Summers RM. Quantitative vertebral compression fracture evaluation using a height compass. In: van Ginneken B, Novak CL, eds. Proceedings of SPIE: medical imaging 2012—computer-aided diagnosis. Vol 8315. Bellingham, Wash: International Society for Optics and Photonics, 2012; 83151X. [Google Scholar]
Associated Data
This section collects any data citations, data availability statements, or supplementary materials included in this article.


