

Abstract
Background
Mitochondrial Ca2+ homeostasis is fundamental to the regulation of mitochondrial reactive oxygen species (ROS) generation and adenosine triphosphate production. Recently, transient receptor potential channel, canonical type 3 (TRPC3), has been shown to localize to the mitochondria and to play a role in maintaining mitochondrial calcium homeostasis. Inhibition of TRPC3 attenuates vascular calcium influx in spontaneously hypertensive rats (SHRs). However, it remains elusive whether mitochondrial TRPC3 participates in hypertension by increasing mitochondrial calcium handling and ROS production.
Methods and Results
In this study we demonstrated increased TRPC3 expression in purified mitochondria in the vasculature from SHRs, which facilitates enhanced mitochondrial calcium uptake and ROS generation compared with Wistar‐Kyoto rats. Furthermore, inhibition of TRPC3 by its specific inhibitor, Pyr3, significantly decreased the vascular mitochondrial ROS production and H2O2 synthesis and increased adenosine triphosphate content. Administration of telmisartan can improve these abnormalities. This beneficial effect was associated with improvement of the mitochondrial respiratory function through recovering the activity of pyruvate dehydrogenase in the vasculature of SHRs. In vivo, chronic administration of telmisartan suppressed TRPC3‐mediated excessive mitochondrial ROS generation and vasoconstriction in the vasculature of SHRs. More importantly, TRPC3 knockout mice exhibited significantly ameliorated hypertension through reduction of angiotensin II–induced mitochondrial ROS generation.
Conclusions
Together, we give experimental evidence for a potential mechanism by which enhanced TRPC3 activity at the cytoplasmic and mitochondrial levels contributes to redox signaling and calcium dysregulation in the vasculature from SHRs. Angiotensin II or telmisartan can regulate [Ca2+]mito, ROS production, and mitochondrial energy metabolism through targeting TRPC3.
Keywords: mitochondria; pyruvate dehydrogenase; telmisartan; transient receptor potential channel, canonical type 3; vasoconstriction
Subject Categories: Hypertension, Oxidant Stress, Vascular Biology
Clinical Perspective
What Is New?
This study is the first to demonstrate that enhanced mitochondrial transient receptor potential channel, canonical 3 (TRPC3) expression in the vasculature from spontaneously hypertensive rats facilitates mitochondrial calcium entry and reactive oxygen species generation and impairs adenosine triphosphate synthesis.
TRPC3 gene knockout ameliorates hypertension through reduction of angiotensin II–induced mitochondrial calcium overload and reactive oxygen species generation.
Telmisartan administration inhibits TRPC3‐mediated excessive mitochondrial reactive oxygen species generation and vasoconstriction in the vasculature of spontaneously hypertensive rats.
What Are the Clinical Implications?
Telmisartan is widely used clinically as an antihypertensive drug. We demonstrate that angiotensin II and telmisartan may exert angiotensin receptor–independent effects by targeting TRPC3 in the vasculature.
Telmisartan shows a promising and novel antihypertensive pathway through inhibition of vascular mitochondrial TRPC3‐mediated redox signaling and calcium dysregulation.
Introduction
Mitochondrial Ca2+ uptake is critical for regulation of numerous cellular processes, including energy metabolism and cytosolic Ca2+ homeostasis.1 Mitochondria undergo rapid changes in matrix Ca2+ concentration ([Ca2+]mito) on cell stimulation to affect the aerobic metabolism,2, 3 and mitochondrial matrix Ca2+ overload impairs mitochondrial function and leads to reactive oxygen species (ROS) generation.4, 5 Mitochondrial adenosine triphosphate (ATP) and ROS production can directly affect the vascular function,6 whereas insufficient ATP supply and excessive ROS production contribute to the pathogenesis of hypertension.7, 8 Mitochondrial ROS and Ca2+ homeostasis have mutual interplay roles,2 especially in the vasculature.9 A group of nonselective cation channels, transient receptor potential channels (TRPCs), have been demonstrated to function in regulating vascular calcium signaling.10, 11, 12 Our previous study indicated that increased transient receptor potential channel, canonical 3 (TRPC3) was associated with enhanced cytosolic calcium influx and vasoconstriction in the vasculature from spontaneously hypertensive rats (SHRs) compared with Wistar‐Kyoto (WKY) rats.13 Recently, TRPC3 channel protein has been shown to localize in the inner membrane of mitochondria and to regulate mitochondrial Ca2+ uptake.14 Other groups have investigated that the basal [Ca2+]mito levels were different in heart, kidney, and brain tissues from SHRs compared with WKY rats,15, 16 but the differences and functions of [Ca2+]mito in the vasculature of SHRs remain unclear.
Overproduction of ROS in the mitochondrial respiratory chain can progressively impair mitochondrial energy metabolism. Several studies have shown that mitochondria‐produced ATP and ROS can regulate the functions of TRPCs,17, 18 thus influencing intracellular Ca2+ signaling, vascular tone, and blood pressure (BP).19 Pyruvate dehydrogenase (PDH) was a key enzyme located in the mitochondrial matrix and functions in the metabolism of the Krebs cycle, and the activity of PDH can be regulated by [Ca2+]mito and other vasoactive substances including angiotensin II in its subunit E1α.20, 21
Telmisartan is widely used in the treatment of hypertension.13 In general, angiotensin receptor blockers antagonize the action of angiotensin II by blocking vascular angiotensin II receptor subtype 1 (AT1R). Clinical trials have shown that the prognostic benefit of telmisartan is better in preventing cardiovascular events and hypertension than other angiotensin receptor blockers.22 We showed that angiotensin II upregulated TRPC3 expression levels and promoted cytosolic calcium influx in the vasculature from SHR, and this effect was inhibited by telmisartan.13 However, little is known about whether angiotensin II can regulate [Ca2+]mito and ROS production in the mitochondrial respiratory chain and elevate blood pressure through targeting TRPC3 in the vascular smooth muscle cells (VSMCs) from SHRs. Therefore, we hypothesize that enhanced TRPC3‐mediated mitochondrial Ca2+ uptake and ROS production involved elevated blood pressure in the vasculatures from SHRs compared with WKY rats.
Methods
Animals and Treatment
Eight‐week‐old male SHRs and normal control WKY rats were obtained from Charles River Laboratories (Wilmington, MA). The rats were maintained at a controlled temperature (21°C to 23°C) under a 12/12‐hour light‐dark cycle and with free access to food and water. After a 2‐week adaptation period, 30 male SHRs and 30 age‐matched WKY rats were randomly divided into normal diet (ND) and ND plus telmisartan (Telmi, 5 mg/kg per day) groups (N=15 per group) and treated for 12 weeks. Every 4 weeks the tail‐cuff blood pressure (BP) levels were measured. After 12 weeks of intervention, the rats were surgically implanted with telemetric transmitters to measure the 24‐hour ambulatory BP levels. Then, the rats were euthanized, and tissue samples were isolated for further experiments.
Wild‐type and Trpc3 −/− mice were purchased from the Jackson Laboratory (Bar Harbor, ME). Homozygotes, heterozygotes, and wild‐type littermates were identified according to previously described methods.23 Briefly, 10 6‐month‐old Trpc3 −/− mice and 10 6‐month‐old wild‐type littermates were surgically implanted with 14‐day mini‐osmotic pumps (Alzet Company, Cupertino, CA) filled with saline or angiotensin II (Sigma, St. Louis, MO) solutions randomly, each subgroup having 5 mice. The dose of angiotensin II was 0.7 mg/day per kilogram body weight. The tail‐cuff BP was measured at baseline, as well as at 7 and 14 days after intervention. After intervention, the 24‐hour ambulatory BP was measured, and then these animals were euthanized for other experiments. All of the experimental procedures were performed in accordance with protocols approved by the Institutional Animal Care and Use Committee of the Third Military Medical University.
Primary Aortic VSMC Culture and Treatment
The VSMC layer was isolated from aortas of WKY rats and SHRs by removing the intima and adventitia.11 The tissue blocks were then incubated with Dulbecco Modified Eagle Medium (DMEM; Gibco, Gaithersburg, MD) containing 10% fetal bovine serum (Gibco), streptomycin (100 μg/mL), and penicillin (100 U/mL). Cultured VSMCs were plated and grown at 37°C in a humidified atmosphere of 95% air/5% CO2. Cultured VSMCs were used between passages 2 and 8. MitoTEMPO was purchased from Santa Cruz Biotechnology (Dallas, TX).19 Telmisartan and Pyr3 were all purchased from Sigma‐Aldrich (St. Louis, MO).
Small Interfering RNA and Plasmid Overexpression Experiments
RNA interference and overexpression experiments were conducted as previously described.24 Briefly, Lipofectamine 3000 was purchased from ThermoFisher Scientific (Waltham, MA), and rat TRPC3‐specific small interfering RNA (siRNA) and negative control siRNA were purchased from Genecopoeia (Guangzhou, China). The pcDNA‐TRPC3myc overexpression plasmid was kindly provided by Dr Craig Montell (Addgene plasmid 25902).
Tail‐Cuff and 24‐Hour Ambulatory BP Measurements
The tail‐cuff BP measurement was conducted using a Softron BP‐2010A as previously described.11 The 24‐hour ambulatory BP measurement was conducted as previously described11 using surgically implanted telemetric transmitters (Data Sciences International, New Brighton, MN). In rats, the measurements were conducted after the animals had received a normal diet or a normal diet plus telmisartan for 12 weeks, whereas mice were assessed 14 days after the implantation of osmotic pumps. The implant catheter was placed into the abdominal aorta of rats or the descending carotid artery of mice. The animals were allowed to recover from the surgery for at least 7 days, and the 24‐hour ambulatory systolic and diastolic BP were then measured by telemetry in conscious, unrestrained animals. We collected data once every minute and used the mean values of 24 hours for the analysis.
Measurement of Vascular Reactivity
The vascular reactivity was measured as previously described.25 Briefly, after the mice or rats were anesthetized with pentobarbital sodium, the mesenteric vascular bed was removed and placed in cold (4°C) Krebs solution (in mmol/L: 118 NaCl, 25 NaHCO3, 11 d‐glucose, 4.7 KCl, 1.2 KH2PO4, 1.17 MgSO4, and 2.5 CaCl2, set to the pH of 7.4). The first branches of the mesenteric arteries (MAs) (for mice) and second branches of the MAs (for rats) were excised with the connective tissues, such as fat. Subsequently, 2‐mm MA segments were mounted on a myograph (Danish Myo Technology, Aarhus, Denmark). After incubation in 95% O2 and 5% CO2 at 37°C, the MA segments were stretched to optimum baseline tension (1.8 mN for mouse MAs and 2.5 mN for rat MAs). The arteries were then equilibrated for 60 minutes before precontraction with 60 mmol/L KCl. After several washouts, each ring was treated with different vasoactive substances (phenylephrine, U46619, acetylcholine, or nitroglycerin, all purchased from Sigma‐Aldrich) or other substances (Pyr3, MitoTEMPO, etc). Isometric contractions were recorded using a computerized data acquisition system (PowerLab/8SP; AD Instruments Pty Ltd, Castle Hill, Australia).
Evaluation of ROS Levels
The ROS levels were measured using a dihydroethidium (DHE) fluorescent probe for cytosolic ROS detection or MitoSOX Red (ThermoFisher Scientific, Waltham, MA) for mitochondrial ROS detection. DHE and MitoSOX staining and detection were conducted as previously described.26 The cellular H2O2 levels were detected using a Hydrogen Peroxide Assay Kit (Beyotime, Shanghai, China). Tissue sections were frozen in optimal cutting temperature compound and quickly sectioned, and the sections were then stained with DHE or MitoSOX dye according to the manufacturers' protocols. To quantify the intensity of DHE and MitoSOX fluorescence, the plates were measured using a Fluoroskan Ascent Fluorometer (ThermoFisher, Helsinki, Finland). The ROS concentrations are expressed as a normalized value relative to the fluorescence intensity of the control cells. To visualize the staining, the sections or specimens were placed on an inverted fluorescence microscope (Nikon TE2000, Nikon Corporation, Tokyo, Japan).
ATP Content Measurement
The ATP levels in VSMCs were measured using a firefly luciferase‐based ATP assay kit (Beyotime, Shanghai, China) as previously described.27 Briefly, treated VSMCs were lysed with a specific lysis buffer, followed by centrifugation at 12 000g for 5 minutes at 4°C. Subsequently, 100 μL of each supernatant was mixed with 100 μL of an ATP detection solution that had been diluted to the proper working concentration. Luminescence was measured using a Varioskan Flash instrument (ThermoFisher Scientific, Waltham, MA). The protein concentration of each treated group was also measured using a Bradford Protein Assay. The total ATP levels are expressed as nanomoles per milligram protein, and the ratios between different groups were calculated and presented.
High‐Resolution Respirometry
Mitochondrial respiratory function was analyzed using a 2‐channel titration injection respirometer (Oxygraph‐2k, Oroboros Instruments, Innsbruck, Austria) equipped with 2 chambers, as previously described.28 In general, VSMCs were harvested, resuspended in the MiR05 solution, and transferred separately to oxygraph chambers at a final cell density of ≈1×10⁶ cells/mL. Routine respiration was assessed while respiration was stabilized. The plasma membrane was then permeabilized with digitonin (10 μg per 106 cells), and Complex I‐dependent oxidative phosphorylation (CIOXPHOS) was measured after addition of glutamate (G, 5 mmol/L), malate (M, 2 mmol/L), and ADP (D, 5 mmol/L). The integrity of the outer mitochondrial membrane was assessed by adding cytochrome c (10 μmol/L). Subsequently, succinate (S, 10 mmol/L) was added to induce maximal oxidative phosphorylation (OXPHOS) capacity with convergent input through CI+IIOXPHOS. After uncoupling with 2‐[[4‐(trifluoromethoxy)phenyl]hydrazinylidene]propanedinitrile (FCCP; injected stepwise up to 1‐1.5 μmol/L) in the noncoupled state, CI+II‐supported noncoupled respiration (CI+IIETS) was measured. The addition of rotenone (0.5 μmol/L) allowed the determination of CIIETS. Residual oxygen consumption was evaluated after the inhibition of CIII with antimycin A (2.5 μmol/L). CIVETS was measured by adding the CIV substrates ascorbate sodium salt (2 mmol/L) and TMPD (N,N,N',N'‐Tetramethyl‐p‐phenylenediamine dihydrochloride) (0.5 mmol/L).
Respiratory Chain Enzyme Activity Assay
The respiratory chain enzyme activities were measured as previously described27 using a Mitochondrial Complexes Activity Assay Kit (Millipore, Darmstadt, Germany) according to the manufacturer's instructions. The enzyme activities of mitochondrial Complex I were detected at 450 nm and 37°C for 30 minutes, whereas Complex II activities were detected at 600 nm and 37°C for 60 minutes.
Western Blot and Immunofluorescence
Western blot and immunofluorescence assays were conducted as previously described.12 The primary antibody against TRPC3 was purchased from Alomone (Alomone Labs, Jerusalem, Israel), and the primary antibody against GAPDH was purchased from Santa Cruz Biotechnology (Dallas, TX). The primary antibody against phosphorylated PDHE1α (p‐PDHE1α) was purchased from Merck‐Millipore (Darmstadt, Germany). Primary antibodies against PDHE1α and voltage‐dependent anion‐selective channel and fluorescently labeled secondary antibodies were purchased from Abcam (Cambridge, MA). Horseradish peroxidase (HRP)‐labeled secondary antibodies were purchased from Zhongshan Company (Beijing, China).
Isolation of Mitochondria From VSMCs and Aortic Tissues
Mitochondria were isolated from aortic tissues or primary cultured VSMCs using Percoll density gradient centrifugation.29 Briefly, tissues or cells were homogenized in homogenization buffers (in mmol/L: 225 mannitol, 75 sucrose, 0.1 EGTA and 30 Tris‐HCl, pH 7.4) and centrifuged twice at 600g for 5 minutes at 4°C to remove intact cells and nuclei. The supernatant (cytosol fraction) was centrifuged twice (7000g, 10 minutes, 4°C), and the insoluble part was the crude mitochondrial fraction. To obtain the crude mitochondria fraction, the pellet was resuspended in starting buffer (in mmol/L: 225 mannitol, 75 sucrose and 30 Tris‐HCl, pH 7.4) and centrifuged twice at 7000g and 4°C for 10 minutes. Then, crude mitochondrial fraction pellet was resuspended in 2 mL of mitochondria‐resuspending buffer (in mmol/L: 250 mannitol, 5 HEPES and 0.5 EGTA, pH 7.4) and loaded on Percoll medium (in mmol/L: 225 mannitol, 25 HEPES, 1 EGTA and 30% Percoll [vol/vol], pH 7.4). After centrifugation (95 000g, 30 minutes, 4°C), the mitochondrial fraction was isolated. Pure mitochondria were then obtained by centrifuging twice at 6300g for 10 minutes. The protein pellets were solubilized in SDS sample buffer and analyzed by Western blotting using antibodies against TRPC3, voltage‐dependent anion‐selective channel protein (as a mitochondrial control) and GAPDH (as a loading control).
Intracellular and Mitochondrial Calcium Measurement
The cytosolic and mitochondrial Ca2+ concentrations, [Ca2+]c and [Ca2+]mito, were measured using Fura‐2 AM and Rhod‐2 AM (ThermoFisher Scientific, Waltham, MA), respectively. For the [Ca2+]c measurement,13 cells were digested and resuspended in Hank's Balanced Salt Solution (in mmol/L: 136 NaCl, 5.4 KCl, 0.44 KH2PO4, 0.34 Na2HPO4, 5.6 d‐glucose, 10 HEPES and 1 CaCl2, pH 7.4). For loading with Fura‐2, the cells were incubated with 1 μmol/L Fura‐2 AM and 0.025% F‐127 (from Sigma‐Aldrich) for 30 minutes at 37°C in the dark, washed 3 times with Ca2+‐free Hank's Balanced Salt Solution and resuspended in Ca2+‐free Hank's Balanced Salt Solution. Fluorescence was measured at baseline and after treatment at an emission of 510 nm using excitation wavelengths of 340 and 380 nm. The resultant data are presented as Fx/F0, where Fx is the ratio of fluorescence between excitation at 340 and 380 nm with emission at 510 nm, and F0 is the mean F340 nm/F380 nm value during the pretreatment period in each experiment. Changes in [Ca2+]c were deduced from the ratios of the transient increases in the fluorescence intensity at 340 and 380 nm.
For the [Ca2+]mito measurement,14 cells were digested and resuspended using an extracellular solution (in mmol/L: 120 NaCl, 6 KCl, 0.3 CaCl2, 2 MgCl2, 12 d‐glucose, 12 sucrose, and 10 HEPES‐free acid, pH 7.4). For loading with Rhod‐2, cells were incubated with 5 μmol/L Rhod‐2 AM and 0.025% F‐127 for 30 minutes at 37°C in the dark and washed 3 times with an extracellular solution. Cells were permeabilized with 10 μmol/L digitonin for 5 minutes at 37°C in the intracellular solution (in mmol/L: 120 KCl, 10 NaCl, 1 KH2PO4, 20 HEPES, 2 Mg‐ATP, 2 succinate and proteinase inhibitor mixtures, pH 7.2) and then washed 3 times with intracellular solution. Agonists (ATP or histamine) and Ca2+ were added to the washing solution for treatment. The fluorescence was measured at an emission wavelength of 581 nm and an excitation wavelength of 552 nm at baseline and after treatment. The statistical analysis of the calcium measurements is graphically presented as the RX/R0 value, where R is the emission values induced by excitation and R0 is the mean value of R during the pretreatment period in each experiment.
Statistical Analysis
The data are presented as the mean±SEM. For the comparisons of means between 2 groups, unpaired Student t test was used to examine the differences. For the comparisons of means among 3 or more groups, ANOVA followed by Bonferroni post hoc tests were used to examine the differences. For the analysis of wire myograph data, concentration‐response curves were analyzed with a nonlinear regression followed by a 1‐way ANOVA method to compare the Emax as the maximal response and pD2 as the negative logarithm of the drug concentration that produced 50% of Emax among these groups.30 For the analysis of tail‐cuff systolic BP changes in rats and angiotensin II–infused mice with repeated tests over time, a repeated‐measures ANOVA method was used to compare the blood pressure changes over time. Meanwhile, for other comparisons with nonrepeated tests in animal experiments and all of the cellular experiments, unpaired Student t tests or 1‐way ANOVA were used to examine differences between or among these groups. All the data analysis was conducted using GraphPad Prism (La Jolla, CA) or SPSS 19.0 (IBM Analytics, Armonk, NY). Two‐sided P‐value less than 0.05 was considered as statistically significant.
Results
Increased Mitochondrial TRPC3 Expression in the Vasculature From SHRs
First, we examined the expression levels of mitochondrial TRPC3 using purified mitochondria from primary cultured VSMCs from WKY rats and SHRs. It showed that the expression levels of total and mitochondrial TRPC3 were significantly increased in VSMCs from SHRs compared with WKY rats but were significantly decreased on telmisartan treatment (Figure 1). These results indicated that increased vascular mitochondrial TRPC3 expression in SHRs was inhibited by telmisartan.
Figure 1.
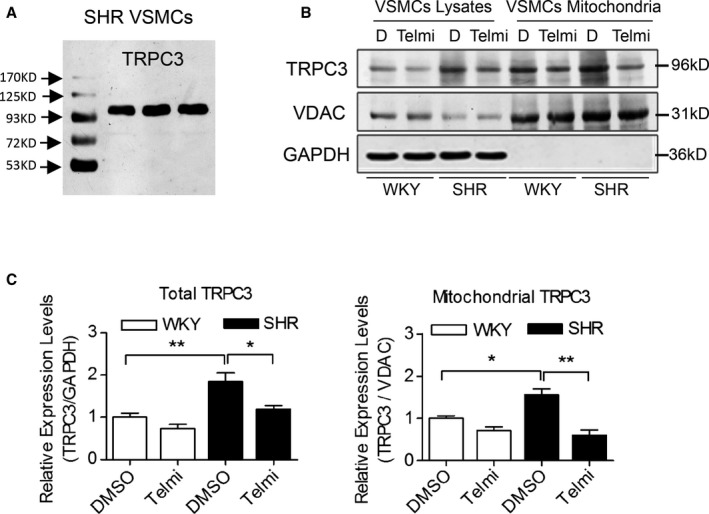
The whole‐cell and mitochondrial TRPC3 expression levels in primary VSMCs from WKY rats and SHRs. A, TRPC3 immunoreactivity was detected by the anti‐TRPC3 antibody (96 kDa) in homogenates of primary VSMCs from SHRs. B and C, The TRPC3 expression levels in cell lysates and purified mitochondria of primarily cultured VSMCs were analyzed by Western blotting, using VDAC protein as a mitochondrial control and GAPDH as an internal reference in (B). D indicates DMSO treatment. Three Western blot bands were quantified and analyzed in the lower panels (C). *P<0.05, **P<0.01. SHR indicates spontaneously hypertensive rats; Telmi, telmisartan; TRPC3, transient receptor potential channel, canonical type 3; VDAC, voltage‐dependent anion‐selective channel; VSMC, vascular smooth muscle cells; WKY, Wistar‐Kyoto.
Enhanced Mitochondrial TRPC3‐Mediated Calcium Handling in the Vasculature From SHRs
To assess the function of increased mitochondrial TRPC3 expression in the vasculature of SHRs, we examined the [Ca2+]mito changes in VSMCs. Specifically, ATP or histamine significantly increased the [Ca2+]mito in VSMCs from SHRs compared with WKY rats, whereas the administration of telmisartan or TRPC3 inhibitor (Pyr3) significantly attenuated this effect (Figure 2A through 2D). Moreover, we used permeabilized VSMCs to exclude the contribution of plasma membrane TRPC3 to [Ca2+]mito. The [Ca2+]mito remained higher in SHRs, and this increase was significantly reduced by pretreatment with telmisartan or Pyr3 (Figure 2E and 2F). Furthermore, TRPC3 knockdown with a specific siRNA significantly reduced the [Ca2+]mito in the permeabilized VSMCs from SHRs (Figure 2G and 2H), whereas the overexpression of TRPC3 with the pcDNA‐TRPC3 plasmid significantly augmented the [Ca2+]mito in WKY (Figure 2I and 2J). Taken together, these results suggest that increased mitochondrial TRPC3 expression regulated mitochondrial Ca2+ homeostasis in the vasculature of SHRs.
Figure 2.
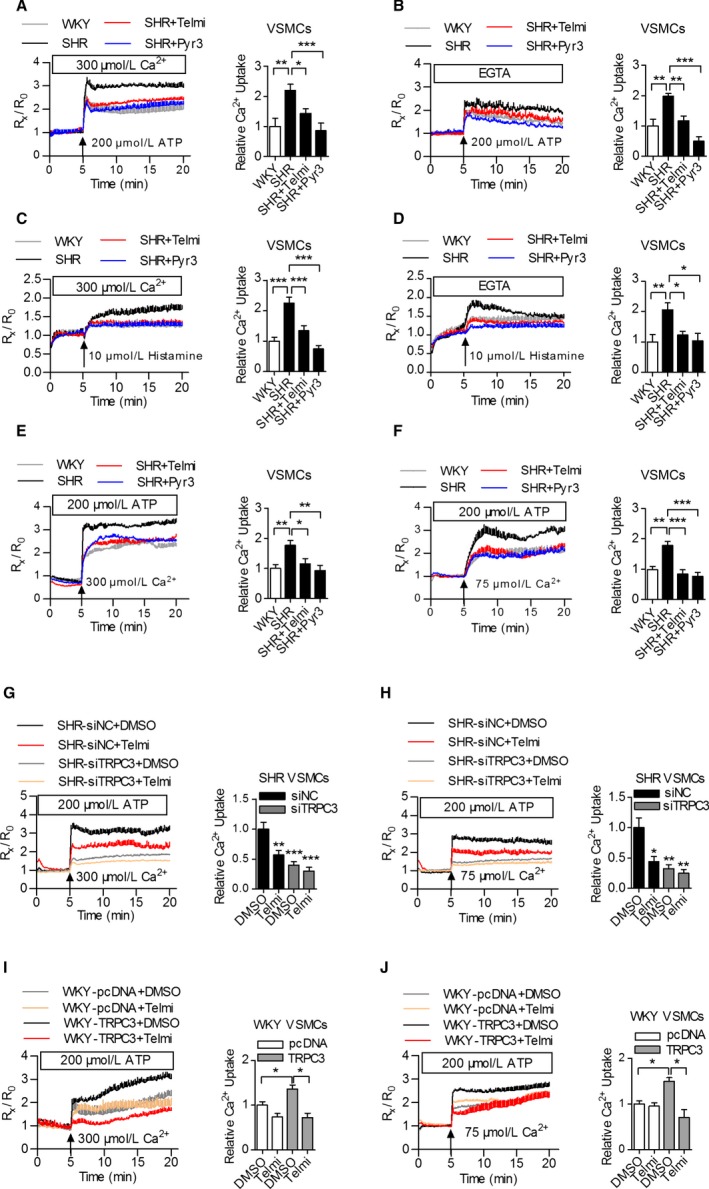
The effects of TRPC3 on mitochondrial calcium uptake in VSMCs from WKY rats and SHRs. A and B, Mitochondrial Ca2+ concentrations ([Ca2+]mito) in the VSMCs from WKY rats and SHRs treated with 200 μmol/L ATP in either a 0.3 mmol/L extracellular Ca2+ solution (A) or a calcium‐free (B) extracellular solution after preincubation with 10 μmol/L Pyr3 or telmisartan. [Ca2+]mito was monitored based on the fluorescence of R552 nm/R581 nm. N=9 to 12 per group. *P<0.05, **P<0.01, ***P<0.0001. C and D, [Ca2+]mito in the VSMCs from WKY rats and SHRs treated with 10 μmol/L histamine in a 0.3 mmol/L extracellular Ca2+ solution (C) or a calcium‐free (D) extracellular solution after preincubation with 10 μmol/L Pyr3 or telmisartan. N=12 to 15 per group. *P<0.05, **P<0.01, ***P<0.0001. E and F, [Ca2+]mito changes in VSMCs permeabilized with 10 μmol/L digitonin and challenged with the cytosolic loading of 300 μmol/L (E) or 75 μmol/L (F) Ca2+. N=9 to 12 per group. *P<0.05, **P<0.01, ***P<0.0001. G and H, The VSMCs from SHRs were transfected with TRPC3 siRNA and negative control siRNA, followed by the addition of telmisartan, after which the cells were permeabilized with digitonin and [Ca2+]mito was monitored with cytosolic loading of 300 μmol/L (G) or 75 μmol/L (H) Ca2+. N=9 to 12 per group. **P<0.01, ***P<0.0001 vs siNC DMSO in (G); *P<0.05, **P<0.01 vs siNC DMSO as shown in (H). I and J, The VSMCs from WKY rats were transfected with pcDNA‐TRPC3myc and pcDNA3.1, respectively, followed by the addition of telmisartan, after which the cells were permeabilized with digitonin and [Ca2+]mito was monitored with cytosolic loading of either 300 μmol/L (I) or 75 μmol/L (J) Ca2+. N=9 to 12 per group. *P<0.05. Pyr3 indicates specific inhibitor of TRPC3; SHR, spontaneously hypertensive rats; siNC, negative control small interfering RNA; Telmi, telmisartan; TRPC3, transient receptor potential channel, canonical type 3; VSMC, vascular smooth muscle cells; WKY, Wistar‐Kyoto.
We further confirmed that increased mitochondrial TRPC3‐mediated calcium uptake affected vascular tone. Specifically, mitoTEMPO or telmisartan treatment inhibited increases in store‐operated calcium entry in the VSMCs of SHRs (Figure 3A and 3B), and the administration of mitoTEMPO or Pyr3 significantly suppressed the excessive vasoconstriction induced by either phenylephrine or U46619 in SHRs (Figure 3C and 3D). These findings suggested that increased TRPC3 activity at both the cytoplasmic and mitochondrial levels regulated Ca2+ homeostasis in the vasculature from SHRs. Inhibition of TRPC3 improved vascular tone in the setting of hypertension.
Figure 3.
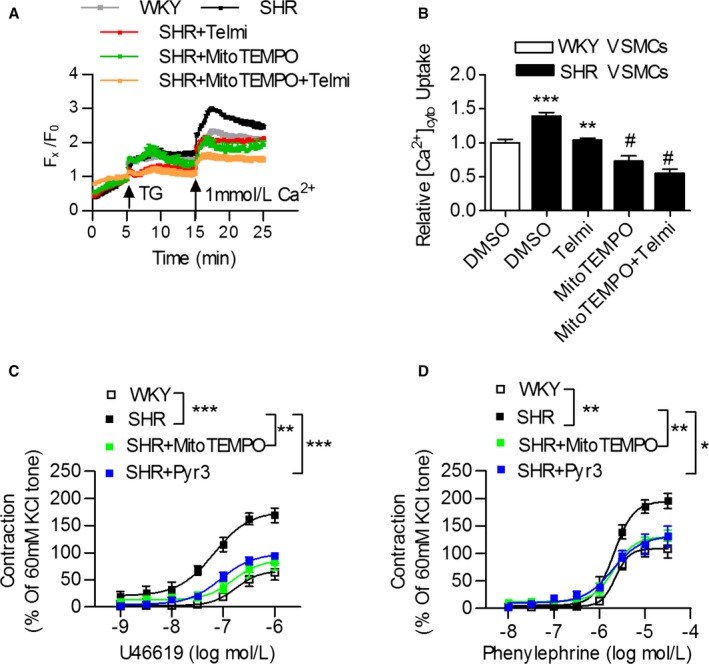
Mitochondria participate in calcium handling and vasoconstriction in the vasculature from WKY rats and SHRs. A and B, VSMCs from WKY rats and SHRs were pretreated with 10 μmol/L of the mitochondria‐target reactive oxygen species (ROS) scavenger mitoTEMPO, 10 μmol/L of telmisartan or both for 24 hours, and 1 μmol/L of thapsigargin (TG) was then added to detect the store‐operated calcium entry (SOCE). ***P<0.0001 vs WKY; **P<0.01 vs SHR control; # P<0.0001 vs SHR control. C and D, The effect of 50 μmol/L of mitoTEMPO and 10 μmol/L of the TRPC3 inhibitor Pyr3 incubation on U46619‐ and phenylephrine (PE)‐induced vasoconstriction in mesenteric arteries from SHR, compared with WKY rats. N=6 to 8 per group. *P<0.05, **P<0.01, ***P<0.0001. Pyr3 indicates specific inhibitor of TRPC3; SHR, spontaneously hypertensive rats; Telmi, telmisartan; TRPC3, transient receptor potential channel, canonical type 3; VSMC, vascular smooth muscle cells; WKY, Wistar‐Kyoto.
Inhibition of TRPC3 Improved Mitochondrial Function and Reduced ROS Production in the Vasculature of SHRs
We then investigated the effect of telmisartan and Pyr3 treatment on mitochondrial ROS production and respiratory functions in VSMCs. Specifically, parameters of mitochondrial respiratory function, such as CIOXPHOS, CI+IIOXPHOS, and CI+IIETS, were significantly reduced in the VSMCs from SHRs compared with those from WKY rats, whereas telmisartan treatment significantly improved these parameters (Figure 4A). Furthermore, increased cellular and mitochondrial ROS production, enhanced H2O2 production, but impaired ATP synthesis were identified in SHR compared with WKY. Both telmisartan and Pyr3 treatment significantly reversed these changes in mitochondrial parameters (Figure 4B through 4E). Specifically, the phosphorylation of the pyruvate dehydrogenase E1α subunit (phospho‐PDHE1α) was significantly increased, but total PDHE1α was not changed in the VSMCs from SHRs compared with WKY rats. Both telmisartan and Pyr3 treatment significantly reduced the phospho‐PDHE1α expression levels (Figure 4F). These results indicated that the inhibition of TRPC3 improved mitochondrial respiratory function and reduced ROS production in the setting of hypertension.
Figure 4.
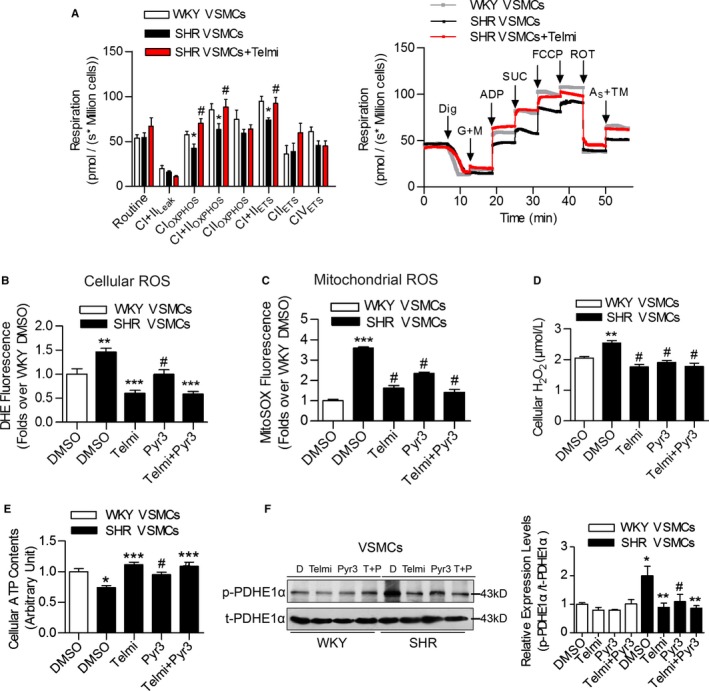
The effects of TRPC3 inhibition on mitochondrial function and ROS production in the vasculature of SHRs. A, Mitochondrial oxygen consumption was measured in primary VSMCs from aortas of SHRs and WKY rats using Oxygraph‐2k high‐resolution respirometry. Routine values indicate respiration in the original state; CI+IIL eak, respiration on Complex I plus Complex II substrates to compensate for a proton leak; CIOXPHOS, Complex I‐dependent oxidative phosphorylation; CIIOXPHOS, Complex II‐dependent oxidative phosphorylation; CI+IIOXPHOS, oxidative phosphorylation providing Complex I and Complex II substrates; CI+IIETS, noncoupled respiration with Complex I and Complex II substrates (ie, the maximum capacity of the ETS state); CIIETS, noncoupled Complex II‐dependent respiration; CIVETS, noncoupled Complex IV‐dependent respiration. N=6 to 10 per group. *P<0.05 vs WKY; # P<0.05 vs SHR. The right panel is the representative oxygen graph of the left panel. Dig, digitonin 10 μg per 106 cells; G+M, glutamate 5 mmol/L, malate 2 mmol/L; ADP, 5 mmol/L; SUC, succinate 10 mmol/L; FCCP, 1 to 1.5 μmol/L; ROT, rotenone 0.5 μmol/L; AS+TM, ascorbate sodium 2 mmol/L, TMPD 0.5 mmol/L. B, The effect of telmisartan or Pyr3 on cellular ROS levels in VSMCs as determined by DHE staining. N=6 per group, **P<0.01 vs WKY; ***P<0.0001 vs SHR; # P<0.01 vs SHR. C, The effect of telmisartan or Pyr3 on mitochondrial ROS levels in VSMCs as determined by MitoSOX staining. N=6 per group, ***P<0.0001 vs WKY; # P<0.0001 vs SHR. D, The effect of telmisartan or Pyr3 on cellular H2O2 levels in VSMCs. N=4 per group. **P<0.01 vs WKY; # P<0.01 vs SHR. E, The effect of telmisartan or Pyr3 on cellular ATP levels in VSMCs. N=4 per group. *P<0.05 vs WKY; ***P<0.0001 vs SHR; # P<0.05 vs SHR. F, The expression levels of phospho‐PDHE1α (p‐PDHE1α) and total PDHE1α (t‐PDHE1α) in VSMCs from WKY and SHR, after treatment with either telmisartan or Pyr3, were analyzed by western blotting. T indicates telmisartan; P indicates Pyr3. Three Western blot bands were quantified, and the gray values are analyzed in the right panel. *P<0.05 vs WKY DMSO; **P<0.01 vs SHR DMSO, # P<0.05 vs SHR DMSO. DHE indicates dihydroethidium; MitoSOX, mitochondrial superoxide indicator; Pyr3, specific inhibitor of TRPC3; ROS, reactive oxygen species; SHR, spontaneously hypertensive rats; Telmi, telmisartan; TMPD, (N,N,N',N'‐Tetramethyl‐p‐phenylenediamine dihydrochloride); TRPC3, transient receptor potential channel, canonical type 3; VSMC, vascular smooth muscle cells; WKY, Wistar‐Kyoto.
Chronic Telmisartan Treatment Attenuated the Vasoconstrictions Associated With the Inhibition of Mitochondrial TRPC3
We further investigated the effect of TRPC3 inhibition on mitochondrial function and vascular tone in vivo. The total and mitochondrial TRPC3 expression levels were significantly increased in the aortas of SHRs compared with WKY rats, but both were attenuated by long‐term telmisartan administration (Figure 5A, Figure S1). Moreover, chronic telmisartan treatment decreased cellular and mitochondrial ROS production in aortas of SHRs (Figure 5B). The enzyme activities of mitochondrial complex I, but not mitochondrial complex II, were significantly reduced in aortas of SHRs, and this decrease was attenuated by chronic telmisartan treatment (Figure 5C).
Figure 5.
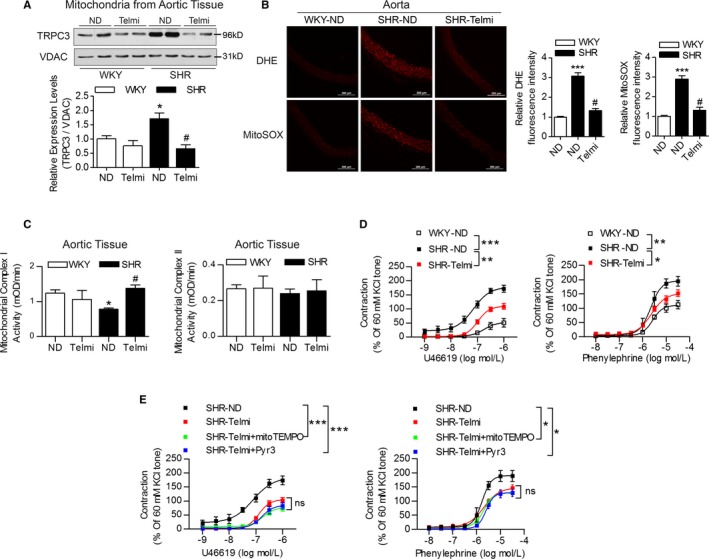
The effects of chronic oral telmisartan intervention on mitochondrial and vascular function in the vasculature from SHRs. A, The TRPC3 expression levels in isolated mitochondria from the aortic tissues of WKY rats and SHRs, in the presence and absence of telmisartan treatment, as analyzed by Western blotting using voltage‐dependent anion‐selective channel protein as a mitochondrial control. Western blot bands were quantified and analyzed in the below panel. N=4 per group. *P<0.05 vs WKY‐ND (indicates WKY rats with ND treatment); # P<0.05 vs SHR‐ND. B, Representative images of DHE and MitoSOX staining. The relative fluorescence intensity of the aortas from WKY rats and SHRs were quantified in the presence and absence of telmisartan treatment. SHR‐Telmi indicates SHRs after long‐term administration of telmisartan. N=6 per group. ***P<0.0001 vs WKY‐ND; # P<0.0001 vs SHR‐ND. C, The effects of chronic telmisartan intervention on mitochondrial complex I and complex II activities of aorta isolated from WKY rats and SHRs. *P<0.05 vs WKY; # P<0.05 vs SHR. D, The effects of chronic oral telmisartan intervention on U46619‐ and PE‐induced vasoconstriction in MAs from SHRs. N=6 to 8 per group. *P<0.05, **P<0.01, ***P<0.0001. E, The effects of mitoTEMPO and Pyr3 administration on U46619‐ and PE‐induced vasoconstriction in the MAs of SHRs treated with telmisartan. Isolated MAs were preincubated with 50 μmol/L of mitoTEMPO or 10 μmol/L of TRPC3 inhibitor Pyr3 for 30 minutes before experiments. N=6 to 8 per group. *P<0.05, ***P<0.0001. DHE indicates dihydroethidium; MA, mesenteric artery; MitoSOX, mitochondrial superoxide indicator; Pyr3, specific inhibitor of TRPC3; SHR, spontaneously hypertensive rats; Telmi, telmisartan; TRPC3, transient receptor potential channel, canonical type 3; VDAC, voltage‐dependent anion‐selective channel; WKY, Wistar‐Kyoto.
Chronic telmisartan treatment also significantly inhibited increases in vasoconstriction (Figure 5D) but only slightly improved endothelium‐dependent relaxations and had no effect on endothelium‐independent relaxations in SHRs (Figure S2A). Incubation with mitoTEMPO or Pyr3 only slightly improved the vascular constrictions in SHRs with chronic telmisartan treatment, but without significant changes (Figure 5E). Furthermore, the administration of telmisartan consistently lowered blood pressure in SHRs (Figure S2B and S2C). Taken together, these results indicated that the inhibition of TRPC3 improved the vascular tone of SHRs both in vivo and in vitro.
TRPC3 Knockout Ameliorated Angiotensin II–Induced Mitochondrial ROS Production and Hypertension
Specifically, mitoTEMPO or Pyr3 administration significantly attenuated vasoconstriction induced by U46619 and PE in wild‐type mice (Figure 6A). Meanwhile, Trpc3 −/− significantly attenuated the enhanced mitochondrial Ca2+ uptake induced by angiotensin II infusion (Figure 6B and 6C). The total and mitochondrial ROS production on angiotensin II infusion was also decreased in the vasculature of Trpc3 −/− mice compared with wild‐type mice (Figure 6D). Additionally, angiotensin II significantly increased the phosphorylation of PDHE1α with no effect on the total PDHE1α expression levels in the aorta of wild‐type mice, but this increase was partially ameliorated in Trpc3 −/− mice (Figure 6E).
Figure 6.
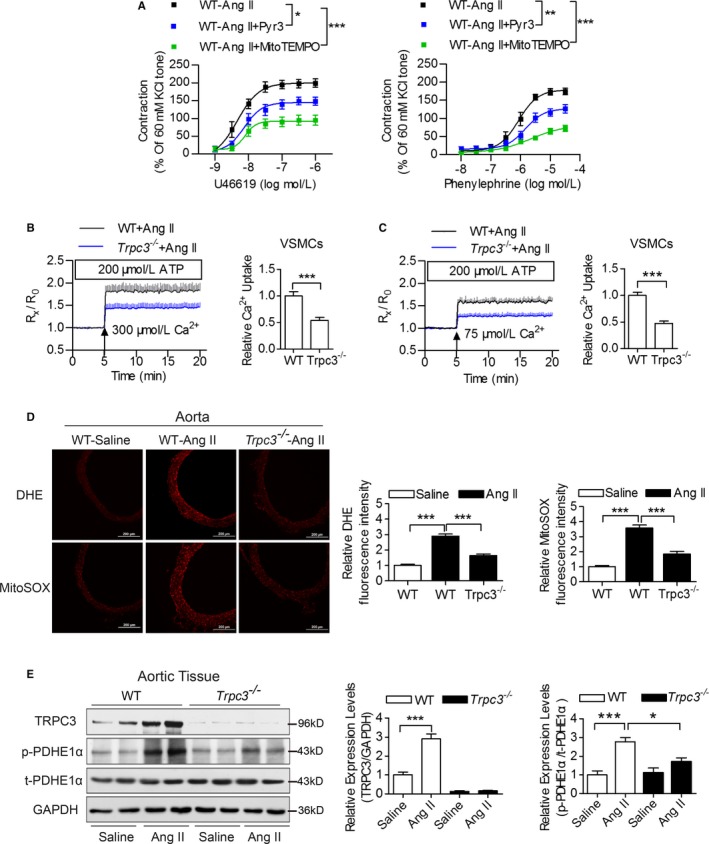
The effects of TRPC3 on angiotensin II (Ang II)‐induced vascular mitochondrial dysfunctions. A, The effects of Pyr3 and mitoTEMPO administration on vascular constrictions of MAs in Ang II‐infused hypertensive mice. N=6 to 8 per group. *P<0.05, **P<0.01, ***P<0.0001. B and C, [Ca2+]mito changes in permeabilized primary VSMCs from WT and Trpc3 −/− mice, pretreated with 200 nmol/L Ang II and challenged with the cytosolic loading of 300 μmol/L (B) or 75 μmol/L (C) Ca2+. N=9 per group. ***P<0.0001. D, Representative images of DHE‐ and MitoSOX‐stained aortic sections from Ang II‐infused WT and Trpc3 −/− mice. N=7 per group. ***P<0.0001. E, Immunoblotting of the expression levels of TRPC3, p‐PDHE1α and t‐PDHE1α in aortic tissues isolated from WT and Trpc3 −/− mice, using GAPDH as a loading control. Four Western blot bands in each group were quantified and analyzed in the right panels. *P<0.05, ***P<0.0001. DHE indicates dihydroethidium; MA, mesenteric artery; MitoSOX, mitochondrial superoxide indicator; Pyr3, specific inhibitor of TRPC3; TRPC3, transient receptor potential channel, canonical type 3; VSMC, vascular smooth muscle cells; WT, wild type.
Furthermore, we used in vivo experiments to validate the role of TRPC3 in angiotensin II–induced hypertension and vasoconstriction. It showed that the angiotensin II–induced elevated tail‐cuff systolic blood pressure, the 24‐hour ambulatory blood pressure, as well as U46619‐ and PE‐induced vasoconstriction were significantly attenuated in Trpc3 −/− mice (Figure 7A through 7C). Moreover, the activation of RhoA/Rho kinase due to angiotensin II infusion was also partially inhibited in Trpc3 −/− mice, and this effect was mediated by the inhibition of MYPT1 and MLC2 phosphorylation (Figure 7D through 7F). These data indicate that TRPC3 may act by regulating mitochondrial functions, thus influencing the redox state and RhoA/Rho kinase pathway, which modulates vascular tone and blood pressure in hypertension.
Figure 7.
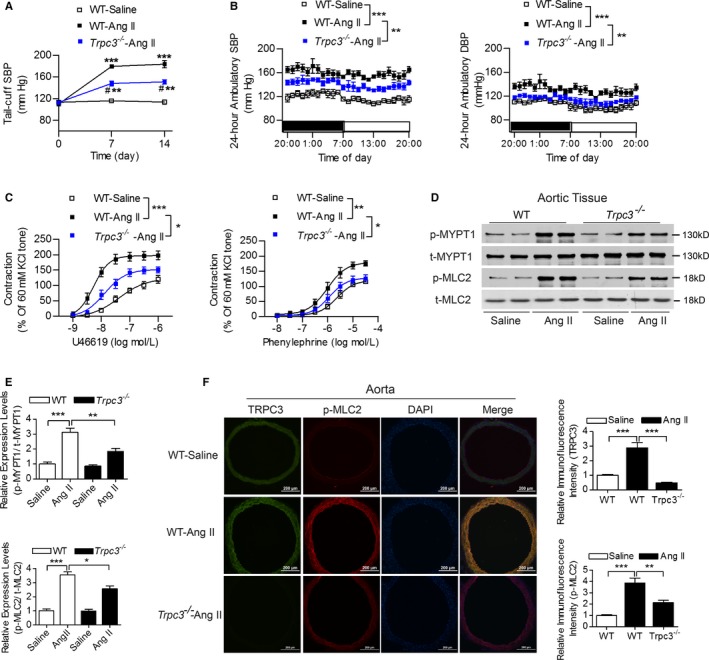
The effects of TRPC3 on angiotensin II (Ang II)–induced hypertension and vascular reactivity. A and B, The effects of TRPC3 on the tail‐cuff SBP (A) and the 24‐hour ambulatory blood pressure levels (B) in Ang II–infused hypertensive mice. N=5 per group. A, ***P<0.0001, # P<0.0001, vs corresponding tail‐cuff SBP levels at baseline via repeated measures ANOVA within each group; **P<0.01 vs WT‐Ang II (indicates WT mice with Ang II infusion) at the same time point. B, **P<0.01, ***P<0.0001. C, The effects of TRPC3 on vascular constrictions in Ang II‐infused hypertensive mice. N=7 to 8 per group. *P<0.05, **P<0.01, ***P<0.0001. D and E, The expression levels of phosphorylated and total MYPT1 and MLC2 in aortic tissues from these groups were detected using Western blot (D). E, Quantification of Western blot bands presented as the amount of phosphorylated/total levels. N=4 per group. *P<0.05, **P<0.01, ***P<0.0001. F, Representative images of the immunofluorescence staining of TRPC3, p‐MLC2 and DAPI using aortic sections from Ang II‐infused mice. Quantification of the intensities in each graph was presented in the right 2 panels. N=6 per group. **P<0.01, ***P<0.0001. DAPI, 4′,6‐diamidino‐2‐phenylindole; DBP, diastolic blood pressure; MLC2, myosin light chain 2; MYPT1, myosin phosphatase targeting protein; SBP, systolic blood pressure; transient receptor potential channel, canonical type 3; WT, wild type.
Discussion
This study is the first to provide important evidence showing that increased vascular mitochondrial TRPC3 function participates in abnormal mitochondrial Ca2+ homeostasis and enhances vascular tone in the setting of hypertension, and this regulation is associated with increased mitochondrial ROS production and impaired ATP synthesis. Moreover, long‐term telmisartan administration improves mitochondrial function and decreases mitochondrial ROS production and vascular constriction by inhibiting mitochondrial TRPC3 in the vasculature from SHRs (Figure 8). Furthermore, a global knockout of TRPC3 attenuates angiotensin II–induced ROS production, suppresses vasoconstriction and lowers blood pressure in vivo. In our study, we demonstrated a novel mechanism by which enhanced mitochondrial TRPC3‐mediated ROS production is involved in mitochondrial redox signaling and calcium dysregulation in the vasculature from a hypertensive model.
Figure 8.
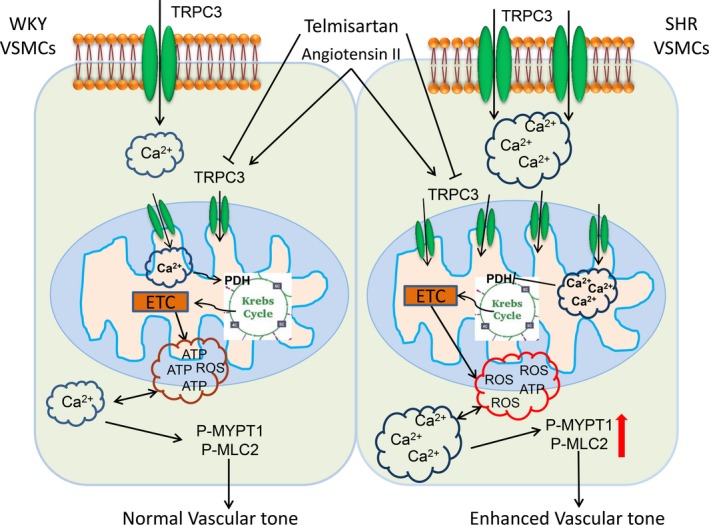
A schematic illustration depicts the mechanism by which increased mitochondrial TRPC3 contributes to hypertension. SHR or Ang II–infusion hypertension have increased mitochondrial TRPC3 expression levels, which induced an enhanced mitochondrial Ca2+ uptake, impaired mitochondrial respiratory functions, and increased ROS production. These abnormalities lead to enhanced ROS production, increased [Ca2+]c, and activation of the RhoA/Rho kinase pathway in hypertension. Inhibition of TRPC3 by telmisartan or Pyr3 ameliorated mitochondrial Ca2+ overload, restored PDH activities, and improved mitochondrial respiratory functions. Targeting TRPC3 may become a new strategy to antagonizing hypertension. Ang indicates angiotensin; PDH, pyruvate dehydrogenase; Pyr3, specific inhibitor of TRPC3; ROS, reactive oxygen species; SHR, spontaneously hypertensive rats; TRPC3, transient receptor potential channel, canonical type 3; VSMC, vascular smooth muscle cells.
Mitochondrial Ca2+ is vital to mitochondrial function because it regulates the activities of Ca2+‐sensitive enzymes in the Krebs cycle.31 The regulation of mitochondrial Ca2+ homeostasis is complicated, including a pro‐uptake mitochondrial calcium uniporter, a prorelease sodium‐calcium exchanger, a sodium‐hydrogen exchanger, and a mitochondrial permeability transition pore.1, 32 In this study, we provide evidence to show that elevated mitochondrial TRPC3 expression is associated with enhanced mitochondrial Ca2+ uptake in hypertension and that telmisartan can decrease mitochondrial Ca2+ uptake by inhibiting TRPC3 in the vasculature from SHRs. Recently, Feng et al reported that ≈44% of total TRPC3 is localized to the inner membrane of mitochondria.14 We confirmed that mitochondrial TRPC3 expression was increased by 56% in the VSMCs from SHRs compared with WKY rats, whereas treatment with ATP enhanced the [Ca2+]mito in the permeabilized VSMCs from SHRs compared with WKY rats. Inhibition of TRPC3 attenuated these elevated [Ca2+]mito levels in the VSMCs from SHRs. Furthermore, TRPC3 overexpression enhanced [Ca2+]mito in permeabilized VSMCs from WKY rats. Therefore, targeting mitochondrial TRPC3 may modulate the mitochondrial Ca2+ homeostasis in the vasculature of hypertensive individuals.
Mitochondrial ROS plays a role in the regulation of vascular tone by influencing the functions of VSMCs and the endothelium.33, 34 A recent study shows that mitochondrial ion channels/transporters act as sensors and regulators of cellular redox signaling.31 Under physiological conditions, Ca2+ diminishes ROS from both complexes I and III while enhancing ROS generation if these complexes are dysfunctional.35 However, excessive mitochondrial Ca2+ uptake promotes ROS production.36 In this study, we provide evidence showing that the elevated mitochondrial TRPC3‐mediated Ca2+ uptake is associated with increased mitochondrial ROS production in SHR. Chronic telmisartan administration decreased mitochondrial ROS levels by 56% in the VSMCs and by 55% in the aortas of SHRs through inhibiting TRPC3 and improving the enzyme activities of complexes in the mitochondrial respiratory chain. Generally, mitochondrial matrix Ca2+ can activate PDH at its E1α subunit and promote the transformation of pyruvic acid to acetyl‐CoA in the mitochondrial matrix.3 PDH is a key dehydrogenase, and its activity can also be blunted by angiotensin II through increasing the vascular PDH phosphorylation.15 However, the regulation of PDH activities in the vasculature in hypertension is poorly understood. In this study, we demonstrated that the phosphorylation of PDHE1ɑ was significantly increased by 101%, but total PDHE1ɑ was not changed in the VSMCs from SHRs compared with WKY rats. Moreover, parameters of mitochondrial respiratory functions and the enzyme activity of mitochondrial Complex I were impaired in the vasculature from SHRs. Furthermore, mitochondrial TRPC3 inversely correlated with the activities of PDH in the vasculature of SHRs and angiotensin II–infused mice, which may be partially attributable to TRPC3‐mediated vascular mitochondrial redox signaling and calcium dysregulation. PDHE1ɑ phosphorylation is mediated by redox‐sensitive PDH kinase, a kinase that could be activated by mitochondrial ROS.37, 38 Therefore, reduction of mitochondrial ROS in the VSMCs from TRPC3−/− mice can be responsible for reduced PDH kinase activity and recovery of PDH activity, increased mitochondrial Complex IOXPHOS levels, and ATP synthesis.
Angiotensin II may exert AT1R‐independent effect by targeting TRPC3 in the vasculature. Although the role of AT1R‐NADPH oxidase by modulating the cellular and mitochondrial ROS productions in cardiovascular diseases has been investigated,19, 39, 40 recent studies have shown that TRPC3 participates in RAS‐related cardiovascular complications.41 Angiotensin II–induced vasomotion was associated with increased TRPC3 expression in the mesenteric arteries from SHRs.42 TRPC3 is involved in atherosclerosis through regulation of vascular cell adhesion molecule‐1 and phospho‐IkBα expression in apoe −/− mice,43 and the inhibition of TRPC3 has been shown to reduce pathological cardiac hypertrophy.41, 44 We recently showed that long‐term taurine supplementation improved vascular tone by increasing plasma H2S content and targeting TRPC3‐mediated Ca2+ influx in SHRs.12 Other groups reported that TRPC3 influenced contractility and peripheral vascular resistance in hypertension.45, 46 In the present study, we provided experimental evidence that angiotensin II can regulate [Ca2+]mito, ROS production, and mitochondrial energy metabolism through targeting TRPC3. Specifically, the angiotensin II–induced activation of the RhoA/Rho kinase pathway was significantly attenuated in Trpc3 −/− mice. We have shown that the expression levels of AT1R in the vasculatures of WKY rats and SHRs did not significantly differ,13 which was in agreement with other reports.47 There were studies that indicated that mitochondrial angiotensin receptors existed in many other models.48, 49 Therefore, we proposed that angiotensin II may exert an AT1R‐independent effect by targeting TRPC3.
Telmisartan as a first line antihypertensive drug is commonly used clinically.22 We showed before that telmisartan improved the insulin resistance and body weight by activating peroxisome proliferator‐activated receptor‐δ.50, 51 Telmisartan has been proven to promote phosphorylation of endothelial nitric oxide synthase and improve mitochondrial function in VSMCs in a peroxisome proliferator‐activated receptor‐γ‐dependent manner.52, 53 Moreover, a recent study showed that telmisartan modulates the balance between oxidative stress and antioxidant properties, which improves cardioprotection, but the mechanism is unclear.54 In this study, the long‐term administration of telmisartan inhibited mitochondrial Ca2+ uptake, reduced ROS production, and improved vascular tone through inhibition of vascular mitochondrial TRPC3 in vivo. However, the effect of telmisartan in improving mitochondrial functions may attributed to several pathways, which include reduced NADPH oxidase activity,52 reduced inflammation,55, 56 and diminished Ca2+‐induced mitochondrial oxidative stress.
In summary, we tested the hypothesis that increased TRPC3‐mediated mitochondrial Ca2+ uptake in VSMCs and aortic tissues of SHRs compared with WKY rats. TRPC3 knockout significantly reduced angiotensin II–induced ROS production and vasoconstriction. Telmisartan shows promise in the treatment of hypertension through inhibition of TRPC3 and improvement of vascular mitochondrial redox signaling and calcium dysregulation.
Study Limitations
The limitation of this study is that it cannot rule out the plasma membrane TRPC3 channel which also contributes to the regulation of calcium handling13 and ROS generation.57 Further experiments are needed to distinguish plasma membrane– and mitochondrial TRPC3–mediated effects. In addition, they should also examine how TRPC3 is integrated into mitochondria and whether this process is genetically altered in the vasculature of hypertensive rats.
Sources of Funding
This study was funded by the National Natural Science Foundation of China (81370366), the National Basic Research Program of China (2013CB531205), the National Natural Science Foundation of China (81600331), and the Natural Science Foundation of Chongqing (cstc2012jjA10123).
Disclosures
None.
Supporting information
Figure S1. The effect of chronic telmisartan treatment on TRPC3 expression levels. A, Representative images of the immunofluorescence staining of TRPC3, α‐smooth muscle actin, and DAPI using aortic sections from WKY rats and SHRs, subjected to or for ongoing telmisartan intervention. Quantification of the intensities in each graph is presented in the right panel. N=6 per group. *P<0.05, ***P<0.0001. B, Expression levels of TRPC3 in aortic tissues from these groups were detected using Western blot. Quantification of Western blot bands is presented as the amount of target protein/GAPDH levels. N=4 per group. **P<0.01, ***P<0.0001. DAPI indicates 4′,6‐diamidino‐2‐phenylindole; SHR, spontaneously hypertensive rat; TRPC3, transient receptor potential channel, canonical type 3; WKY, Wistar‐Kyoto.
Figure S2. The effect of chronic oral telmisartan intervention on blood pressure (BP) levels in SHRs. A, Effects of telmisartan treatment on acetylcholine (ACh)‐and nitroglycerin‐induced relaxation in mesenteric arteries (MAs) from WKY rats and SHRs. N=8 to 12 per group. Concentration‐response curves were analyzed by nonlinear regression followed by Student t test or 1‐way ANOVA for comparisons between 2 groups or among more than 2 groups, respectively. *P<0.05 versus 10−7 mol/L Ach‐induced relaxation of SHR MAs; ***P<0.0001 versus SHR. B, Effects of 12‐week telmisartan intervention on the tail‐cuff systolic blood pressure (SBP) levels of SHR. N=10 per group. ***P<0.0001 versus WKY at baseline, # P<0.0001 versus SHR‐Telmi at baseline using repeated‐measures ANOVA, † P<0.0001 versus SHR at the same time point. C, Effects of telmisartan intervention on the 24‐hour ambulatory BP levels in SHRs. N=5 per group. **P<0.01, ***P<0.0001. SHR indicates spontaneously hypertensive rat; Telmi, telmisartan; WKY, Wistar‐Kyoto.
Acknowledgments
We gratefully acknowledge the technical assistance of Tingbing Cao and Lijuan Wang (Chongqing Institute of Hypertension, Chongqing, China) with our experiments.
(J Am Heart Assoc. 2017;6:e005812 DOI: 10.1161/JAHA.117.005812.)28711865
Contributor Information
Daoyan Liu, Email: daoyanliu@yahoo.com.
Zhiming Zhu, Email: zhuzm@yahoo.com.
References
- 1. Wang L, Yang X, Shen Y. Molecular mechanism of mitochondrial calcium uptake. Cell Mol Life Sci. 2015;72:1489–1498. [DOI] [PMC free article] [PubMed] [Google Scholar]
- 2. Gorlach A, Bertram K, Hudecova S, Krizanova O. Calcium and ROS: a mutual interplay. Redox Biol. 2015;6:260–271. [DOI] [PMC free article] [PubMed] [Google Scholar]
- 3. Cardenas C, Miller RA, Smith I, Bui T, Molgo J, Muller M, Vais H, Cheung KH, Yang J, Parker I, Thompson CB, Birnbaum MJ, Hallows KR, Foskett JK. Essential regulation of cell bioenergetics by constitutive InsP3 receptor Ca2+ transfer to mitochondria. Cell. 2010;142:270–283. [DOI] [PMC free article] [PubMed] [Google Scholar]
- 4. Esterberg R, Linbo T, Pickett SB, Wu P, Ou HC, Rubel EW, Raible DW. Mitochondrial calcium uptake underlies ROS generation during aminoglycoside‐induced hair cell death. J Clin Invest. 2016;126:3556–3566. [DOI] [PMC free article] [PubMed] [Google Scholar]
- 5. Williams GS, Boyman L, Chikando AC, Khairallah RJ, Lederer WJ. Mitochondrial calcium uptake. Proc Natl Acad Sci USA. 2013;110:10479–10486. [DOI] [PMC free article] [PubMed] [Google Scholar]
- 6. Chiong M, Cartes‐Saavedra B, Norambuena‐Soto I, Mondaca‐Ruff D, Morales PE, Garcia‐Miguel M, Mellado R. Mitochondrial metabolism and the control of vascular smooth muscle cell proliferation. Front Cell Dev Biol. 2014;2:72. [DOI] [PMC free article] [PubMed] [Google Scholar]
- 7. Liu MY, Jin J, Li SL, Yan J, Zhen CL, Gao JL, Zhang YH, Zhang YQ, Shen X, Zhang LS, Wei YY, Zhao Y, Wang CG, Bai YL, Dong DL. Mitochondrial fission of smooth muscle cells is involved in artery constriction. Hypertension. 2016;68:1245–1254. [DOI] [PubMed] [Google Scholar]
- 8. Dikalov SI, Ungvari Z. Role of mitochondrial oxidative stress in hypertension. Am J Physiol Heart Circ Physiol. 2013;305:H1417–H1427. [DOI] [PMC free article] [PubMed] [Google Scholar]
- 9. Trebak M, Ginnan R, Singer HA, Jourd'heuil D. Interplay between calcium and reactive oxygen/nitrogen species: an essential paradigm for vascular smooth muscle signaling. Antioxid Redox Signal. 2010;12:657–674. [DOI] [PMC free article] [PubMed] [Google Scholar]
- 10. Yang D, Luo Z, Ma S, Wong WT, Ma L, Zhong J, He H, Zhao Z, Cao T, Yan Z, Liu D, Arendshorst WJ, Huang Y, Tepel M, Zhu Z. Activation of TRPV1 by dietary capsaicin improves endothelium‐dependent vasorelaxation and prevents hypertension. Cell Metab. 2010;12:130–141. [DOI] [PMC free article] [PubMed] [Google Scholar]
- 11. Sun J, Yang T, Wang P, Ma S, Zhu Z, Pu Y, Li L, Zhao Y, Xiong S, Liu D. Activation of cold‐sensing transient receptor potential melastatin subtype 8 antagonizes vasoconstriction and hypertension through attenuating RhoA/Rho kinase pathway. Hypertension. 2014;63:1354–1363. [DOI] [PubMed] [Google Scholar]
- 12. Sun Q, Wang B, Li Y, Sun F, Li P, Xia W, Zhou X, Li Q, Wang X, Chen J, Zeng X, Zhao Z, He H, Liu D, Zhu Z. Taurine supplementation lowers blood pressure and improves vascular function in prehypertension: randomized, double‐blind, placebo‐controlled study. Hypertension. 2016;67:541–549. [DOI] [PubMed] [Google Scholar]
- 13. Liu D, Yang D, He H, Chen X, Cao T, Feng X, Ma L, Luo Z, Wang L, Yan Z, Zhu Z, Tepel M. Increased transient receptor potential canonical type 3 channels in vasculature from hypertensive rats. Hypertension. 2009;53:70–76. [DOI] [PubMed] [Google Scholar]
- 14. Feng S, Li H, Tai Y, Huang J, Su Y, Abramowitz J, Zhu MX, Birnbaumer L, Wang Y. Canonical transient receptor potential 3 channels regulate mitochondrial calcium uptake. Proc Natl Acad Sci USA. 2013;110:11011–11016. [DOI] [PMC free article] [PubMed] [Google Scholar]
- 15. Calderon‐Cortes E, Cortes‐Rojo C, Clemente‐Guerrero M, Manzo‐Avalos S, Villalobos‐Molina R, Boldogh I, Saavedra‐Molina A. Changes in mitochondrial functionality and calcium uptake in hypertensive rats as a function of age. Mitochondrion. 2008;8:262–272. [DOI] [PMC free article] [PubMed] [Google Scholar]
- 16. Pardo AC, Rinaldi GJ, Mosca SM. Mitochondrial calcium handling in normotensive and spontaneously hypertensive rats: correlation with systolic blood pressure levels. Mitochondrion. 2015;20:75–81. [DOI] [PubMed] [Google Scholar]
- 17. Yamamoto S, Shimizu S, Kiyonaka S, Takahashi N, Wajima T, Hara Y, Negoro T, Hiroi T, Kiuchi Y, Okada T, Kaneko S, Lange I, Fleig A, Penner R, Nishi M, Takeshima H, Mori Y. TRPM2‐mediated Ca2+ influx induces chemokine production in monocytes that aggravates inflammatory neutrophil infiltration. Nat Med. 2008;14:738–747. [DOI] [PMC free article] [PubMed] [Google Scholar]
- 18. Ding Y, Winters A, Ding M, Graham S, Akopova I, Muallem S, Wang Y, Hong JH, Gryczynski Z, Yang SH, Birnbaumer L, Ma R. Reactive oxygen species‐mediated TRPC6 protein activation in vascular myocytes, a mechanism for vasoconstrictor‐regulated vascular tone. J Biol Chem. 2011;286:31799–31809. [DOI] [PMC free article] [PubMed] [Google Scholar]
- 19. Dikalova AE, Bikineyeva AT, Budzyn K, Nazarewicz RR, McCann L, Lewis W, Harrison DG, Dikalov SI. Therapeutic targeting of mitochondrial superoxide in hypertension. Circ Res. 2010;107:106–116. [DOI] [PMC free article] [PubMed] [Google Scholar]
- 20. Karpova T, Danchuk S, Kolobova E, Popov KM. Characterization of the isozymes of pyruvate dehydrogenase phosphatase: implications for the regulation of pyruvate dehydrogenase activity. Biochim Biophys Acta. 2003;1652:126–135. [DOI] [PubMed] [Google Scholar]
- 21. Mori J, Alrob OA, Wagg CS, Harris RA, Lopaschuk GD, Oudit GY. ANG II causes insulin resistance and induces cardiac metabolic switch and inefficiency: a critical role of PDK4. Am J Physiol Heart Circ Physiol. 2013;304:H1103–H1113. [DOI] [PubMed] [Google Scholar]
- 22. Sueta D, Koibuchi N, Hasegawa Y, Toyama K, Uekawa K, Katayama T, Ma M, Nakagawa T, Ogawa H, Kim‐Mitsuyama S. Telmisartan exerts sustained blood pressure control and reduces blood pressure variability in metabolic syndrome by inhibiting sympathetic activity. Am J Hypertens. 2014;27:1464–1471. [DOI] [PubMed] [Google Scholar]
- 23. Hartmann J, Dragicevic E, Adelsberger H, Henning HA, Sumser M, Abramowitz J, Blum R, Dietrich A, Freichel M, Flockerzi V, Birnbaumer L, Konnerth A. TRPC3 channels are required for synaptic transmission and motor coordination. Neuron. 2008;59:392–398. [DOI] [PMC free article] [PubMed] [Google Scholar]
- 24. Wang B, Ni Z, Dai X, Qin L, Li X, Xu L, Lian J, He F. The Bcl‐2/xL inhibitor ABT‐263 increases the stability of Mcl‐1 mRNA and protein in hepatocellular carcinoma cells. Mol Cancer. 2014;13:98. [DOI] [PMC free article] [PubMed] [Google Scholar]
- 25. Zhang H, Pu Y, Chen J, Tong W, Cui Y, Sun F, Zheng Z, Li Q, Yang T, Meng C, Lu Z, Li L, Yan Z, Liu D, Zhu Z. Gastrointestinal intervention ameliorates high blood pressure through antagonizing overdrive of the sympathetic nerve in hypertensive patients and rats. J Am Heart Assoc. 2014;3:e000929 DOI: 10.1161/JAHA.114.000929. [DOI] [PMC free article] [PubMed] [Google Scholar]
- 26. Xiong S, Wang P, Ma L, Gao P, Gong L, Li L, Li Q, Sun F, Zhou X, He H, Chen J, Yan Z, Liu D, Zhu Z. Ameliorating endothelial mitochondrial dysfunction restores coronary function via transient receptor potential vanilloid 1‐mediated protein kinase A/uncoupling protein 2 pathway. Hypertension. 2016;67:451–460. [DOI] [PubMed] [Google Scholar]
- 27. Lang H, Li Q, Yu H, Li P, Lu Z, Xiong S, Yang T, Zhao Y, Huang X, Gao P, Zhang H, Shang Q, Liu D, Zhu Z. Activation of TRPV1 attenuates high salt‐induced cardiac hypertrophy through improvement of mitochondrial function. Br J Pharmacol. 2015;172:5548–5558. [DOI] [PMC free article] [PubMed] [Google Scholar]
- 28. Li P, Wang B, Sun F, Li Y, Li Q, Lang H, Zhao Z, Gao P, Zhao Y, Shang Q, Liu D, Zhu Z. Mitochondrial respiratory dysfunctions of blood mononuclear cells link with cardiac disturbance in patients with early‐stage heart failure. Sci Rep. 2015;5:10229. [DOI] [PMC free article] [PubMed] [Google Scholar]
- 29. Wieckowski MR, Giorgi C, Lebiedzinska M, Duszynski J, Pinton P. Isolation of mitochondria‐associated membranes and mitochondria from animal tissues and cells. Nat Protoc. 2009;4:1582–1590. [DOI] [PubMed] [Google Scholar]
- 30. Liu L, Liu J, Wong WT, Tian XY, Lau CW, Wang YX, Xu G, Pu Y, Zhu Z, Xu A, Lam KS, Chen ZY, Ng CF, Yao X, Huang Y. Dipeptidyl peptidase 4 inhibitor sitagliptin protects endothelial function in hypertension through a glucagon‐like peptide 1‐dependent mechanism. Hypertension. 2012;60:833–841. [DOI] [PubMed] [Google Scholar]
- 31. O‐Uchi J, Ryu SY, Jhun BS, Hurst S, Sheu SS. Mitochondrial ion channels/transporters as sensors and regulators of cellular redox signaling. Antioxid Redox Signal. 2014;21:987–1006. [DOI] [PMC free article] [PubMed] [Google Scholar]
- 32. Itani HA, Dikalova AE, McMaster WG, Nazarewicz RR, Bikineyeva AT, Harrison DG, Dikalov SI. Mitochondrial cyclophilin D in vascular oxidative stress and hypertension. Hypertension. 2016;67:1218–1227. [DOI] [PMC free article] [PubMed] [Google Scholar]
- 33. Martinez‐Revelles S, Avendano MS, Garcia‐Redondo AB, Alvarez Y, Aguado A, Perez‐Giron JV, Garcia‐Redondo L, Esteban V, Redondo JM, Alonso MJ, Briones AM, Salaices M. Reciprocal relationship between reactive oxygen species and cyclooxygenase‐2 and vascular dysfunction in hypertension. Antioxid Redox Signal. 2013;18:51–65. [DOI] [PubMed] [Google Scholar]
- 34. Amaral JH, Montenegro MF, Pinheiro LC, Ferreira GC, Barroso RP, Costa‐Filho AJ, Tanus‐Santos JE. TEMPOL enhances the antihypertensive effects of sodium nitrite by mechanisms facilitating nitrite‐derived gastric nitric oxide formation. Free Radic Biol Med. 2013;65:446–455. [DOI] [PubMed] [Google Scholar]
- 35. Brookes PS, Yoon Y, Robotham JL, Anders MW, Sheu SS. Calcium, ATP, and ROS: a mitochondrial love‐hate triangle. Am J Physiol Cell Physiol. 2004;287:C817–C833. [DOI] [PubMed] [Google Scholar]
- 36. Aldakkak M, Stowe DF, Dash RK, Camara AK. Mitochondrial handling of excess Ca2+ is substrate‐dependent with implications for reactive oxygen species generation. Free Radic Biol Med. 2013;56:193–203. [DOI] [PMC free article] [PubMed] [Google Scholar]
- 37. Wu CA, Chao Y, Shiah SG, Lin WW. Nutrient deprivation induces the Warburg effect through ROS/AMPK‐dependent activation of pyruvate dehydrogenase kinase. Biochim Biophys Acta. 2013;1833:1147–1156. [DOI] [PubMed] [Google Scholar]
- 38. Kirito K, Hu Y, Komatsu N. HIF‐1 prevents the overproduction of mitochondrial ROS after cytokine stimulation through induction of PDK‐1. Cell Cycle. 2009;8:2844–2849. [DOI] [PubMed] [Google Scholar]
- 39. Dikalov SI, Nazarewicz RR, Bikineyeva A, Hilenski L, Lassegue B, Griendling KK, Harrison DG, Dikalova AE. Nox2‐induced production of mitochondrial superoxide in angiotensin II‐mediated endothelial oxidative stress and hypertension. Antioxid Redox Signal. 2014;20:281–294. [DOI] [PMC free article] [PubMed] [Google Scholar]
- 40. Dikalov S. Cross talk between mitochondria and NADPH oxidases. Free Radic Biol Med. 2011;51:1289–1301. [DOI] [PMC free article] [PubMed] [Google Scholar]
- 41. Wang P, Liu D, Tepel M, Zhu Z. Transient receptor potential canonical type 3 channels—their evolving role in hypertension and its related complications. J Cardiovasc Pharmacol. 2013;61:455–460. [DOI] [PubMed] [Google Scholar]
- 42. Chen X, Yang D, Ma S, He H, Luo Z, Feng X, Cao T, Ma L, Yan Z, Liu D, Tepel M, Zhu Z. Increased rhythmicity in hypertensive arterial smooth muscle is linked to transient receptor potential canonical channels. J Cell Mol Med. 2010;14:2483–2494. [DOI] [PMC free article] [PubMed] [Google Scholar]
- 43. Smedlund KB, Birnbaumer L, Vazquez G. Increased size and cellularity of advanced atherosclerotic lesions in mice with endothelial overexpression of the human TRPC3 channel. Proc Natl Acad Sci USA. 2015;112:E2201–E2206. [DOI] [PMC free article] [PubMed] [Google Scholar]
- 44. Seo K, Rainer PP, Shalkey Hahn V, Lee DI, Jo SH, Andersen A, Liu T, Xu X, Willette RN, Lepore JJ, Marino JP Jr, Birnbaumer L, Schnackenberg CG, Kass DA. Combined TRPC3 and TRPC6 blockade by selective small‐molecule or genetic deletion inhibits pathological cardiac hypertrophy. Proc Natl Acad Sci USA. 2014;111:1551–1556. [DOI] [PMC free article] [PubMed] [Google Scholar]
- 45. Noorani MM, Noel RC, Marrelli SP. Upregulated TRPC3 and downregulated TRPC1 channel expression during hypertension is associated with increased vascular contractility in rat. Front Physiol. 2011;2:42. [DOI] [PMC free article] [PubMed] [Google Scholar]
- 46. Park HW, Kim JY, Choi SK, Lee YH, Zeng W, Kim KH, Muallem S, Lee MG. Serine‐threonine kinase with‐no‐lysine 4 (WNK4) controls blood pressure via transient receptor potential canonical 3 (TRPC3) in the vasculature. Proc Natl Acad Sci USA. 2011;108:10750–10755. [DOI] [PMC free article] [PubMed] [Google Scholar]
- 47. Fukuda T, Kuroda T, Kono M, Miyamoto T, Tanaka M, Matsui T. Attenuation of L‐type Ca2+ channel expression and vasomotor response in the aorta with age in both Wistar‐Kyoto and spontaneously hypertensive rats. PLoS One. 2014;9:e88975. [DOI] [PMC free article] [PubMed] [Google Scholar]
- 48. Abadir PM, Foster DB, Crow M, Cooke CA, Rucker JJ, Jain A, Smith BJ, Burks TN, Cohn RD, Fedarko NS, Carey RM, O'Rourke B, Walston JD. Identification and characterization of a functional mitochondrial angiotensin system. Proc Natl Acad Sci USA. 2011;108:14849–14854. [DOI] [PMC free article] [PubMed] [Google Scholar]
- 49. Cook JL, Zhang Z, Re RN. In vitro evidence for an intracellular site of angiotensin action. Circ Res. 2001;89:1138–1146. [DOI] [PubMed] [Google Scholar]
- 50. He H, Yang D, Ma L, Luo Z, Ma S, Feng X, Cao T, Yan Z, Liu D, Tepel M, Zhu Z. Telmisartan prevents weight gain and obesity through activation of peroxisome proliferator‐activated receptor‐δ‐dependent pathways. Hypertension. 2010;55:869–879. [DOI] [PubMed] [Google Scholar]
- 51. Li L, Luo Z, Yu H, Feng X, Wang P, Chen J, Pu Y, Zhao Y, He H, Zhong J, Liu D, Zhu Z. Telmisartan improves insulin resistance of skeletal muscle through peroxisome proliferator‐activated receptor‐δ activation. Diabetes. 2013;62:762–774. [DOI] [PMC free article] [PubMed] [Google Scholar]
- 52. Wenzel P, Schulz E, Oelze M, Muller J, Schuhmacher S, Alhamdani MS, Debrezion J, Hortmann M, Reifenberg K, Fleming I, Munzel T, Daiber A. AT1‐receptor blockade by telmisartan upregulates GTP‐cyclohydrolase I and protects eNOS in diabetic rats. Free Radic Biol Med. 2008;45:619–626. [DOI] [PubMed] [Google Scholar]
- 53. Takeuchi K, Yamamoto K, Ohishi M, Takeshita H, Hongyo K, Kawai T, Takeda M, Kamide K, Kurtz TW, Rakugi H. Telmisartan modulates mitochondrial function in vascular smooth muscle cells. Hypertens Res. 2013;36:433–439. [DOI] [PubMed] [Google Scholar]
- 54. Yoo SM, Choi SH, Jung MD, Lim SC, Baek SH. Short‐term use of telmisartan attenuates oxidation and improves Prdx2 expression more than antioxidant β‐blockers in the cardiovascular systems of spontaneously hypertensive rats. Hypertens Res. 2015;38:106–115. [DOI] [PubMed] [Google Scholar]
- 55. Pang T, Wang J, Benicky J, Sanchez‐Lemus E, Saavedra JM. Telmisartan directly ameliorates the neuronal inflammatory response to IL‐1β partly through the JNK/c‐Jun and NADPH oxidase pathways. J Neuroinflammation. 2012;9:102. [DOI] [PMC free article] [PubMed] [Google Scholar]
- 56. Toba H, Tojo C, Wang J, Noda K, Kobara M, Nakata T. Telmisartan inhibits vascular dysfunction and inflammation via activation of peroxisome proliferator‐activated receptor‐γ in subtotal nephrectomized rat. Eur J Pharmacol. 2012;685:91–98. [DOI] [PubMed] [Google Scholar]
- 57. Kitajima N, Numaga‐Tomita T, Watanabe M, Kuroda T, Nishimura A, Miyano K, Yasuda S, Kuwahara K, Sato Y, Ide T, Birnbaumer L, Sumimoto H, Mori Y, Nishida M. TRPC3 positively regulates reactive oxygen species driving maladaptive cardiac remodeling. Sci Rep. 2016;6:37001. [DOI] [PMC free article] [PubMed] [Google Scholar]
Associated Data
This section collects any data citations, data availability statements, or supplementary materials included in this article.
Supplementary Materials
Figure S1. The effect of chronic telmisartan treatment on TRPC3 expression levels. A, Representative images of the immunofluorescence staining of TRPC3, α‐smooth muscle actin, and DAPI using aortic sections from WKY rats and SHRs, subjected to or for ongoing telmisartan intervention. Quantification of the intensities in each graph is presented in the right panel. N=6 per group. *P<0.05, ***P<0.0001. B, Expression levels of TRPC3 in aortic tissues from these groups were detected using Western blot. Quantification of Western blot bands is presented as the amount of target protein/GAPDH levels. N=4 per group. **P<0.01, ***P<0.0001. DAPI indicates 4′,6‐diamidino‐2‐phenylindole; SHR, spontaneously hypertensive rat; TRPC3, transient receptor potential channel, canonical type 3; WKY, Wistar‐Kyoto.
Figure S2. The effect of chronic oral telmisartan intervention on blood pressure (BP) levels in SHRs. A, Effects of telmisartan treatment on acetylcholine (ACh)‐and nitroglycerin‐induced relaxation in mesenteric arteries (MAs) from WKY rats and SHRs. N=8 to 12 per group. Concentration‐response curves were analyzed by nonlinear regression followed by Student t test or 1‐way ANOVA for comparisons between 2 groups or among more than 2 groups, respectively. *P<0.05 versus 10−7 mol/L Ach‐induced relaxation of SHR MAs; ***P<0.0001 versus SHR. B, Effects of 12‐week telmisartan intervention on the tail‐cuff systolic blood pressure (SBP) levels of SHR. N=10 per group. ***P<0.0001 versus WKY at baseline, # P<0.0001 versus SHR‐Telmi at baseline using repeated‐measures ANOVA, † P<0.0001 versus SHR at the same time point. C, Effects of telmisartan intervention on the 24‐hour ambulatory BP levels in SHRs. N=5 per group. **P<0.01, ***P<0.0001. SHR indicates spontaneously hypertensive rat; Telmi, telmisartan; WKY, Wistar‐Kyoto.