Abstract
A method based on the multiplex polymerase chain reaction (PCR) and gel electrophoresis for the comparative analysis of gene expression levels was developed. Using the method many cDNA fragments from different sources can be compared simultaneously. Competitive PCR amplification of expressed genes from different sources was performed by using ‘module-shuffling primers’ (MPSs). The MPSs (labeled with different fluorophores) consist of sequence modules of 3 or 4 nt. The modules are arranged in different orders in each primer; therefore, the base sequences of the primers are different but their melting temperatures are identical. The genes expressed in different sources are ligated with tags complementary with the MPSs. Tag-ligated fragments are mixed in one tube and amplified at the same amplification efficiency by the MPSs. Amplified fragments are detected separately by multiple-color gel electrophoresis. This method can detect different amounts of each expressed gene, up to a difference in amounts of 30%, and its detection limit is 0.1 amol per assay.
INTRODUCTION
DNA sequence analysis of the human genome will be completed in a few years. The latest genome project has found that there are a large number of genes whose functions are not yet known (1,2). Measuring the expression levels of such genes in various tissues or cells is therefore essential in order to understand the mechanism of living organs.
Many methods for obtaining information on expressed genes have been developed; for example, high-density filter hybridization (3,4) and oligonucleotide microarrays (5,6). Although they can simultaneously analyze several thousand gene components, they suffer technological limitations in fine analysis of expressed genes because of detection sensitivity and cross-hybridization. Therefore, we have developed a method that uses a polymerase chain reaction (PCR) coupled with electrophoresis separation for analyzing expressed genes. The PCR improves sensitivity and the electrophoresis enables amplified products to be easily discriminated.
Liang and Pardee first showed gene expression profiles by differential display (7). It was based on electrophoresis analysis of PCR products obtained from arbitrary random primers that can hybridize on various cDNA fragments in a mixture. The protocols of differential display were improved so that reliable differential display method can be performed on a fluorescent DNA sequencer (8). More recently, selective primers (which give more reproducible electropherograms) with a similar melting temperature replaced the random primers (9,10).
A method for comparative analysis of expressed gene messages by using PCR and electrophoresis to clarify the gene functions requires high reproducibility and must be quantitative. The amplification efficiency strongly depends on the co-existing DNA fragments in the sample, so it is laborious to carry out a precise comparative analysis. If PCR of expressed genes derived from different sources is simultaneously carried out in the same reaction tube, the PCR products can be reliably compared. However, there is no way to distinguish the original sources of expressed genes because the sequences of target expressed genes are the same. The key to overcoming this difficulty is to use primers with the same melting temperature but different sequences or to introduce an artificial difference in the target sequences. Adapter-tagged competitive PCR (11) is an example of the latter method. It uses an artificial short sequence introduced between cDNA fragments and PCR priming sites. The several additional introduced bases are used to distinguish their original sources, because the sizes of amplified fragments are slightly different depending on their original sources. This method has been successfully used for quantitatively comparing a gene expressed in various tissues.
We have developed a new method that can analyze plural genes from various sources by utilizing color-selective detection coupled with size separation. The color-selective detection distinguishes the gene sources and the gel electrophoresis separates the gene species. The number of fragment species that can be distinguished in an electropherogram is 10–15 by the use of color detection. The developed method is the first to use module-shuffling primers (MSPs) for comparing gene expression levels in various cells.
Principle
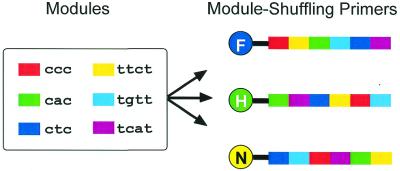
The target expressed genes derived from different sources have the same base sequence. Therefore, our first task was to label and discriminate them according to their sources. The expressed genes are converted to double-stranded cDNA, which can be digested, and oligonucleotide tags are ligated to the cutting sites for PCR. The sequences of the tags are common to all fragment species in one source but the tags ligated with fragments derived from different sources are different. We prepared primers that hybridize with the tags on the sources, which have the same melting temperature. We could therefore discriminately amplify cDNA fragments from different sources. The primers we developed are MSPs; the principle of MSPs is illustrated in Figure 1. The structures of the MSPs consist of several modules (3 or 4 nt). The MSPs share the same modules but the order of their modules is different. The sequences of different MSPs are quite different, but their thermodynamic parameters are identical. The MSPs are labeled with different fluorophores. PCR products amplified by MSPs are distinguished in the original sources according to their different fluorophores. Since a conventional DNA sequencer has four color channels, one of which is used for detecting standard size DNA, three color channels can be used for comparative analysis.
Figure 1.
Structures of MSPs. The MSPs are labeled with different fluorophores (F, 6-FAM; H, HEX; and N, NED). The primers consist of sequence modules of ‘cnc’ and ‘tnnt’ nucleotides (where n is either a, c, g or t). The modules are arranged in a different order in every primer; therefore, the base sequence of the primers is different but their melting temperatures are identical. They independently hybridize with corresponding tags.
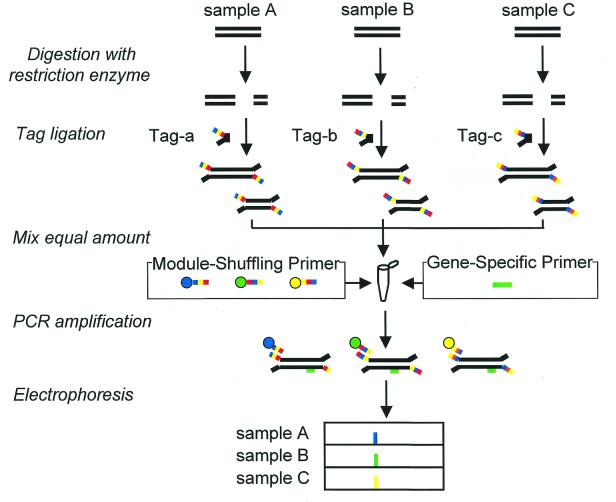
The procedure for comparing expressed genes from different sources by using a PCR with MSPs is shown in Figure 2. The cDNAs are digested by four-base recognition endonuclease and then tagged by ligation. The tag-ligated fragments from different sources are mixed and are used as a template for the PCR. A target cDNA fragment in a mixture is amplified by PCR with a pair of MSPs and a gene-specific primer. The gene-specific primer can distinguish expressed genes in a pool of cDNAs from different sources. Amplified fragments were analyzed by DNA sequencer, and their origins were detected as different colors.
Figure 2.
Comparative analysis of expressed genes by one-tube PCR (using MSPs) of the cDNA fragments mixed from different sources.
MATERIALS AND METHODS
Measurement of melting temperature of module-shuffling primers
Absorbance versus temperature curves at the wavelength of 260 nm with a heating rate of 0.8°C/min were measured by spectrometer (U-3300; Hitachi, Japan). The same buffer used for the PCR was used to obtain the melting curves (50 mM KCl, 1.5 mM MgCl2 and 20 mM Tris–HCl pH 8.4). MSP and complementary oligonucleotide were mixed in a 1:1 molar ratio. Samples were denatured at 80°C for 5 min and then slowly cooled to room temperature. The absorbance of each sample at 260 nm from 20 to 90°C was then measured.
RNA isolation and cDNA synthesis
We used cDNA fragments prepared from Saccharomyces cerevisiae FY1679 strain. Total RNA was isolated from this strain by using the hot-phenol method (12). First-strand cDNA was synthesized by using the SuperScript Pre-amplification System for First-Strand cDNA Synthesis (Life Technologies, Inc., USA) and converted to double-stranded cDNA (13). Ten microliters of template solution containing 2.5 µg total RNA and 0.5 µg oligo(dT)12–18 primer was incubated for 10 min at 70°C and then cooled on ice. Ten microliters of enzyme solution containing 50 mM Tris–HCl pH 8.3, 75 mM KCl, 3 mM MgCl2, 20 mM dithiothreitol, 1 mM dNTPs and 200 U of Super Script II reverse transcriptase (Life Technologies, Inc.) was added to the template solution and incubated for 50 min at 42°C and 15 min at 70°C.
For second strand synthesis, 80 µl of reaction buffer containing 18.8 mM Tris–HCl pH 8.3, 90.6 mM KCl, 4.6 mM MgCl2, 3.8 mM dithiothreitol, 0.15 mM NAD, 10 mM (NH4)2SO4, 0.1 mM dNTPs, 50 U of Escherichia coli DNA polymerase I, 10 U of E.coli DNA ligase, and 2 U of E.coli RNase H was added to 20 µl of the first strand solution and incubated for 120 min at 16°C and 15 min at 70°C.
Enzymatic digestion and adapter ligation
After extraction with phenol:chloroform (1:1) twice and ethanol precipitation, double-stranded cDNA was digested with 60 U of MboI (Takara, Japan) for 120 min at 37°C in 20 mM Tris–HCl pH 8.5, 10 mM MgCl2, 1 mM ditiothreitol and 100 mM KCl. To inactivate the restriction enzyme, the sample solution was incubated for 15 min at 75°C.
For tag ligation, the solutions of digested cDNA were put into three separate tubes. To one of the three tubes 10 pmol of tag-a and 10 pmol of LA (counter oligonucleotide of the tag) were added. The sample solution containing 25 mM Tris–HCl pH 7.6, 5 mM MgCl2, 0.5 mM ATP, 0.5 mM dithiothreitol and 2.5% polyethlene glycol-8000 was incubated for 10 min at 70°C and then slowly cooled to 16°C. Twenty units of T4 DNA ligase (Life Technologies, Inc.) was added to the tube and reacted for 2 h at 16°C. The ligated product was used as the template for MSP-PCR. The digested cDNA samples in the other two tubes were ligated with tag-b and tag-c, respectively.
Module-shuffling primers and oligonucleotides
The base sequences of the three prepared MSPs are as follows: MSP-A, 5′-FAM-ccc ttct cac tgtt ctc tcat-3′; MSP-B, 5′-HEX-cac tcat ctc ttct ccc tgtt-3′; MSP-C, 5′-NED-ctc tgtt ccc tcat cac ttct-3′.
The sequences of MSPs were made up from the same module sequences. They consist of six module sequences consisting of 3 or 4 nt (ccc, ttct, cac, tgtt, ctc and tcat). The order of each module in the MSPs is different. For fluorescent detection of PCR products, the 5′-end of the MSPs was labeled with a fluorescent dye (6-FAM, HEX and NED from Applied Biosystems, USA), designated by FAM, HEX and NED in the sequence (Fig. 1). The MSPs were obtained from Applied Biosystems.
Three Y-shaped tags corresponding to the MSPs were prepared. The sequences of the tags are shown below. LA adapter and one of tag-a, b or c hybridized Y-shaped form (14). Nucleotide sequences of tags and gene-specific primers (GSPs) used are listed below. All adapters and GSPs were obtained from Genset, France.
Sequences of tags and GSPs: tag-a, 5′-ccc ttct cac tgtt ctc tcat ctg cgc atc act cg-3′; tag-b, 5′-cac tcat ctc ttct ccc tgtt ctg cgc atc act cg-3′; tag-c, 5′-ctc tgtt ccc tcat cac ttct ctg cgc atc act cg-3′; LA, 5′-gat ccg agt gat gcg cca c-3′; rabbit alpha-globin, 5′-act tct ggt cca gtc cga ctg-3′; D-oligonucleotide, 5′-gct acc ctt cct tct cta tct-3′; GSP1, 5′-caa cag cat ggt aaa tga-3′; GSP2, 5′-cgt cga tat ctt tca ct-3′; GSP3, 5′-ctc ctc tga ggt tat g-3′; GSP4, 5′-gta ttc caa aga tac gtt-3′; GSP5, 5′-gtc gtt gtg gta taa tga-3′; GSP6, 5′-gac gag ttt gta atc tt-3′; GSP7, 5′-gtc tag tat gaa tac cta ac-3′; GSP8, 5′-gtc tcg tac aat aag ttt-3′; GSP9, 5′-ttc gta cgt cta atc a-3′; GSP10, 5′-ctg aat tca tgc taa gta-3′; GSP11, 5′-ctg aga ata cct cga tta-3′; GSP12, 5′-ttg ctg aag ttc tag ac-3′; GSP13, 5′-tca gtt agc gta ctt aat-3′; GSP14, 5′-tct ctt gtt aat ctt atc c-3′.
PCR amplification of cDNA restriction fragments and gel electrophoresis
Equal amounts of cDNA restriction fragments (ligated with tag-a, tag-b and tag-c) were mixed and used as a PCR template solution. Equal amounts of 1 pmol/µl MSP-A, MSP-B and MSP-C were mixed. The tag-ligated cDNA restriction fragments were amplified in a 10 µl PCR mixture consisting of 1 µl of PCR template solution, 1 pmol each of mixed MSPs and a GSP, 20 mM Tris–HCl pH 8.0, 50 mM KCl, 0.2 mM dNTPs and 1.25 U of Pt Taq DNA polymerase (Life Technologies, Inc.). The PCR was carried out at the thermal conditions of 30 cycles at 94°C for 30 s, 60°C for 1 min and 72°C for 30 s.
After amplification, the sample was desalted by ethanol precipitation and dissolved in 2 µl of loading buffer containing 83% formamide, 8.3 mg/ml blue dextran, 4.2 mM EDTA and 1 µl of GeneScan500Rox (Applied Biosystems) as a marker. The sample was denatured at 95°C for 5 min, then immediately cooled on ice. Two-thirds volume of the sample was analyzed by a fluorescent DNA sequencer (Model 377; Applied Biosystems) with a denaturing polyacrylamide gel (36 cm gel length, 6 M urea, 4% T, 5% C) at 75 V/cm. The obtained data were analyzed by GeneScan version 3.1 (Applied Biosystems).
RESULTS AND DISCUSSION
Thermodynamic properties of module-shuffling primers
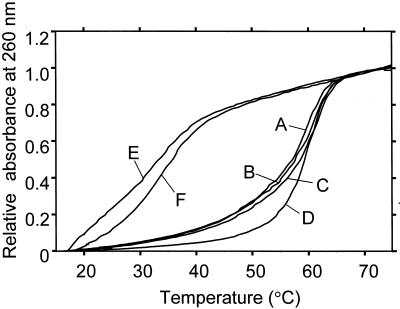
The obtained melting curves of several oligonucleotide complexes are shown in Figure 3. The melting curves of MSPs and their complementary oligonucleotides are close to one another; within 2°C from 20 to 75°C (curves A, B and C). The good agreement of the three melting curves shows that the transition from double-stranded forms to random coils between MSPs and complementary strands are almost the same. Melting curve D represents a pair of different oligonucleotides, which have the same base length (21 bp) as the MSPs and consist of the same base composition (2A, 9C, 1G and 9T). The calculated melting temperature of the oligonucleotide is close to those of MSPs (59.1 and 60.3°C, respectively). However, the melting curve of the oligonucleotide pair (curve D) was different from those of MSPs. The difference in melting curves of MSPs from the oligonucleotide pair of D is larger than the difference in melting curves of MSP samples (A, B and C). Such close agreement between both melting temperature and melting curves of the MSPs indicates the thermodynamic properties of the three MSPs are the almost same.
Figure 3.
Melting curves of MSP-A, B and C paired with their complementary oligonucleotides (curves A, B and C, respectively), a double-stranded oligonucleotide (21 bp, curve D), and a MSP-A paired with an uncomplementary oligonucleotide tag-b and -c (curves E and F, respectively). The melting curves were obtained from 1.52 µM of the oligonucleotide pairs. The curves are normalised with the absorbance of 1.0 at 75°C. The data was collected by a U-3300 spectrometer coupled with thermo-programmer (Hitachi, Japan).
The melting curves of mismatched pairs between MSPs and non-complementary oligonucleotides are shown by Figure 3, curves E and F. These curves indicate that they did not form duplexes. For a one-tube reaction, it is important that all MSPs form a duplex with only corresponding oligonucleotides and do not form a duplex with non-complementary oligonucleotides.
MSPs were designed to have the same nucleotide sequence at a module-connecting section. This is achieved by putting the same nucleotide species at the 5′- and 3′-termini of the modules. As a result, the sequences of the module-connecting parts were ‘ct’ or ‘tc’ and were unchanged by shuffling the order of the modules (Fig. 1). The same sequences of the termini of the modules make the thermodynamic parameters identical. If the sequences connecting parts are changed by module shuffling, the melting curves of the MSP complexes are slightly different as a result of the base neighboring effect (15).
Discrimination ability of module-shuffling primers in PCR amplification
The sequences of the MSPs were designed so as to prevent the undesired hybridization of the primers. To ensure high priming selectivity, any conjugate of an MSP and a non-corresponding priming site does not have a matched sequence longer than three bases. The melting curves (Fig. 3) show that the MSPs do not hybridize with non-corresponding oligonucleotides in the reaction solution. To confirm the selectivity of the MSPs in priming a polymerase reaction, PCR was carried out with various combinations of MSPs. The results of relative fluorescence intensities of PCR products are listed in Table 1. Only the reaction between MSPs and corresponding DNA fragments produced PCR products. The PCR products due to mismatched primer extension are <0.3% of the matched ones. These results indicate that each MSP reacts with only the corresponding DNA fragments independently in one tube.
Table 1. Specificity of MSPs in PCR.
| Tag | |||
| |
a |
b |
c |
| MSP-A |
1.000 |
0.003 |
0.000 |
| MSP-B |
0.000 |
1.000 |
0.002 |
| MSP-C | 0.000 | 0.001 | 1.000 |
The sequences of MSP-A, B and C complement those of tag-a, b and c, respectively. The data were normalized by the relative fluorescence intensities obtained from PCR products amplified with MSPs and their complementary tags.
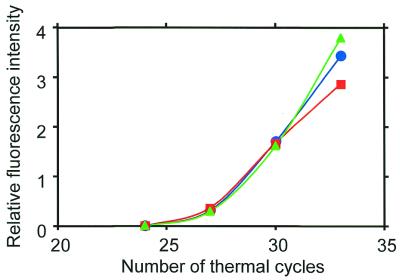
The PCR amplification efficiencies of the MSPs are compared in Figure 4. The efficiency was measured in terms of the fluorescence intensity from each MSP. Clearly, the fluorescence intensities agree well over the range of thermal cycles. This agreement shows that the MSPs have the same amplification efficiency and matches that of the melting curves of the MSPs.
Figure 4.
PCR amplification efficiency of each MSP. The sample was a mixture of cDNA fragments ligated with different tags for the three MSPs. The ORF YAL062W in the mixture was simultaneously amplified by MSP-A, B and C (symbolized by blue circles, green triangles and red squares, respectively).
Reproducibility and effect of co-existing DNA fragments on PCR by module-shuffling primers
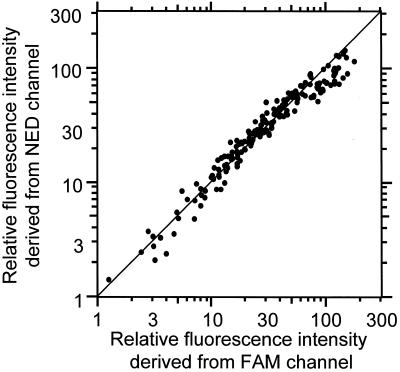
Samples usually contain many co-existing DNA fragments with similar sequences but in different amounts. This causes a major problem in PCR because the reproducibility of PCR depends on the reaction conditions, including the amount of co-existing DNA fragments. However, PCR amplification of cDNA by using MSPs solves this problem. The cDNA ligated with two tags in a mixture was amplified simultaneously in one reaction tube (Fig. 5). Figure 5 shows the correlation between fluorescence intensities obtained from 200 cDNAs by using two MSPs. The fluorescence intensities obtained from different tags are plotted on separate axes. The fluorescence intensities of the amplified cDNA fragments are within a difference of 30%. The correlation coefficient is as good as 0.95.
Figure 5.
Reproducibility of the MSP-PCR method. 200 cDNA fragments were measured. The cDNA of a S.cerevisiae ligated with two tags and simultaneously amplified by MSP-A (horizontal axis, labeled with FAM) and B (vertical axis, labeled with HEX). Thermal cycling was carried out 30 times. The mixture contains different cDNA fragments derived from different sources as co-existent DNA factors. The cDNA ligated with two tags in a mixture was amplified simultaneously in one reaction tube.
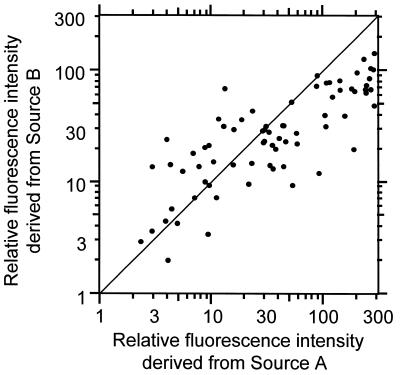
To demonstrate the superior reproducibility of the one-tube PCR method, PCR of two samples was carried out in two different tubes. The two samples contained the same cDNA mixtures and different cDNA mixtures from different sources, therefore they contained different amounts of co-existing DNAs. The same cDNAs in the two mixtures were amplified independently. In Figure 6 the results from the two different PCRs are plotted along each axis. It is clear that the fluorescence intensities of the amplified cDNA fragments are dispersed. The correlation coefficient is 0.81. This value shows the PCR depends heavily on the co-existing DNAs. The MSP-PCR method achieves superior reproducibility when the amount of co-existing DNAs is changed.
Figure 6.
Reproducibility of PCR. The same cDNA (100 species) in the two mixtures was amplified independently. The two samples had the same cDNA groups and different cDNA mixtures from different sources, therefore they had different amount of co-existing DNAs. Different axes plot the fluorescence intensities obtained from different PCRs.
In general, the reproducibility of conventional PCR is also good when the reactions are carried out under uniform conditions. However, the samples usually contain many partially sequence-coincident DNA fragments, like alternative splicing products, in different amounts.
There are many factors that suppress the PCR, namely non-specific hybridization of primers with a similar-sequence template frequently occurs. A target DNA fragment and its sequence-coincident DNA fragment interact with each other. The activity of DNA polymerase is shared with the specific template–primer complex and other co-existing DNA fragments. All these factors affect the PCR amplification efficiency and cannot easily be avoided only by specifying the reaction conditions. Figure 5 shows the superiority of the MSP-PCR method in comparing the amount of cDNA from different sources.
Detection limit on using PCR with module-shuffling primers
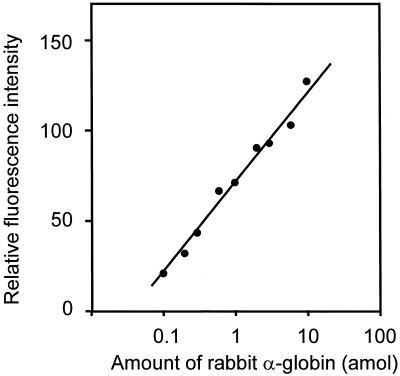
The dynamic range and detection limit of the method were measured in the following experiment. Rabbit α-globin mRNA (Life Technologies, Inc.) 2.5 × 10⁻¹¹ to 7.5 × 10⁻⁹ g was mixed with 3.5 × 10⁻⁶ g of total RNA extracted from yeast, and cDNA was synthesized. The cDNAs containing various concentrations of rabbit α-globin were ligated with one of three tags and mixed together in the ratio of 1:2:3 (tag-a:tag-b:tag-c). A 1/600 portion of each sample was amplified by the MSP-PCR method. Figure 7 shows the relative fluorescence intensity against the amount of rabbit α-globin. The fluorescence intensity is clearly proportional to the amount of mRNA in the target rabbit α-globin (ranging from 0.1 to 10.0 amol; corresponding to from 10 to 1000 molecules per cell). The figure shows that the MSP-PCR method has a useful dynamic range from 0.1 to 10.0 amol at 30 thermal cycles.
Figure 7.
Calibration curves for rabbit α-globin. Since the MSP method relatively compares three different amount of cDNA, several sets of three amounts of cDNA with different tags at the ratio of 1:2:3 were measured. Relative fluorescence intensities are plotted against amount of rabbit α-globin.
Multiplex PCR of expressed genes by using module-shuffling primers
The MSP-PCR method described here can compare the amount of expressed genes from different sources. However, analysis of an expression profile requires many PCR and electrophoresis runs. Therefore, for expression profiling, a multiplex PCR to analyze several expressed genes simultaneously is required.
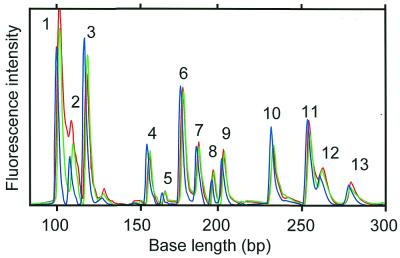
Figure 8 shows the fluorescence intensity from a PCR with 13 kinds of expressed genes. The figure shows that 13 genes can be amplified simultaneously by MSPs. In the MSP-PCR method, the specifically amplified products are easily discriminated from the false positive products according to the detected base length. A difference in size of about 10 bases is required for discriminating PCR products. Primer sequences used in MSP-PCR were designed to satisfy the condition that the base length of amplified products is longer than 100 bp. The base length of most MSP-PCR products is shorter than 256 bp, because the templates used in the MSP-PCR method were tag-ligated cDNA fragments digested by a four-base recognition restriction enzyme. Therefore, the maximum number of multiplex PCRs is estimated to be 10–15.
Figure 8.
Electropherograms of multiplex PCR products (13 kinds of expressed genes). The blue, green and red lines represent MSP-A (FAM-channel), MSP-B (HEX-channel) and MSP-C (NED-channel), respectively. Lengths of PCR products 1–13 are 100, 109, 119, 158, 167, 177, 186, 195, 204, 232, 253, 264 and 273 bp, respectively.
CONCLUSIONS
Molecular biology is rapidly approaching the stage of functional genomics. The screening of gene expression profiles has become a major research field. The MSP-PCR method has the potential for quantitative comparison of expressed gene levels, especially for sensitive measurement, for rare expressed genes, and for alternative splicing products. The MSP-PCR method can be applied to any genes whose partial sequences are already known. The method also has great potential for the analysis of sequence-similar genes; for example, for alternative splicing products and genes belonging to super families.
Acknowledgments
ACKNOWLEDGEMENTS
This work was performed as a part of the research and development project of Industrial Science and Technology Program supported by NEDO (New Energy and Industrial Technology Development Organization), Japan.
References
- 1.Lander E.S., Linton,L.M., Birren,B., Nusbaum,C., Zody,M.C., Baldwin,J., Devon,K., Dewar,K., Doyle,M., FitzHugh,W. et al. (2001) Initial Sequencing and Analysis of the Human Genome. Nature, 409, 860–921. [DOI] [PubMed] [Google Scholar]
- 2.Venter J.C., Adams,M.D., Myers,E.W., Li,P.W., Mural,R.J., Sutton,G.G., Smith,H.O., Yandell,M., Evans,C.A., Holt,R.A. et al. (2001) The sequence of the human genome. Science, 291, 1304–1351. [DOI] [PubMed] [Google Scholar]
- 3.Meier-Ewert S., Maier,E., Ahmadi,A., Curtis,J. and Lehrach,H. (1993) An automated approach to generating expressed sequence catalogues. Nature, 361, 375–376. [DOI] [PubMed] [Google Scholar]
- 4.Hoheisel J.D., Ross,M.T., Zehetner,G. and Lehrach,H. (1994) Relational genome analysis using reference libraries and hybridization fingerprinting. J. Biotechnol., 35, 121–134. [DOI] [PubMed] [Google Scholar]
- 5.Schena M., Shalon,D., Davis,R.W. and Brown,P.O. (1995) Quantitative monitoring of gene expression patterns with a complementary DNA microarray. Science, 270, 467–470. [DOI] [PubMed] [Google Scholar]
- 6.Marton M.J., DeRisi,J.L., Bennett,H.A., Iyer,V.R., Meyer,M.R., Roberts,C.J., Stoughton,R., Burchard,J., Slade,D., Dai,H. et al. (1998) Drug target validation and identification of secondary drug target effects using DNA microarrays. Nature Med., 4, 1293–1301. [DOI] [PubMed] [Google Scholar]
- 7.Liang P. and Pardee,A.B. (1992) Differential display of eukaryotic messenger RNA by means of the polymerase chain reaction. Science, 257, 967–971. [DOI] [PubMed] [Google Scholar]
- 8.Ito T., Kito,K., Adati,N., Mitsui,Y., Hagiwara,H. and Sakaki,Y. (1994) Fluorescent differential display: arbitrarily primed RT-PCR fingerprinting on an automated DNA sequencer. FEBS Lett., 351, 231–236. [DOI] [PubMed] [Google Scholar]
- 9.Vos P., Hogers,R., Bleeker,M., Reijans,M., van de Lee,T., Hornes,M., Frijters,A., Pot,J., Peleman,J., Kuiper,M. et al. (1995) AFLP: a new technique for DNA fingerprinting. Nucleic Acids Res., 23, 4407–4414. [DOI] [PMC free article] [PubMed] [Google Scholar]
- 10.Uematsu C., Suzuki,Y., Sugano,S., Kambara,H. and Suyama,A. (1996) Measurement of mRNA expression by selective amplification of cDNA restriction fragments with selective primers. Nucleic Acids Symp. Ser., 35, 257–258. [Google Scholar]
- 11.Kato K. (1997) Adapter-tagged competitive PCR: a novel method for measuring relative gene expression. Nucleic Acids Res., 25, 4694–4696. [DOI] [PMC free article] [PubMed] [Google Scholar]
- 12.Schmitt M.E., Brown,T.A. and Trumpower,B.L. (1990) A rapid and simple method for preparation of RNA from Saccharomyces cerevisiae. Nucleic Acids Res., 18, 3091–3092. [DOI] [PMC free article] [PubMed] [Google Scholar]
- 13.Gubler U. and Hoffman,B.J. (1983) A simple and very efficient method for generating cDNA libraries. Gene, 25, 263–269. [DOI] [PubMed] [Google Scholar]
- 14.Prashar Y. and Weissman,S.M. (1996) Analysis of differential gene expression by display of 3′ end restriction fragments of cDNAs. Proc. Natl Acad. Sci. USA, 93, 659–663. [DOI] [PMC free article] [PubMed] [Google Scholar]
- 15.SantaLucia J.,Jr, Allawi,H.T. and Seneviratne,P.A. (1996) Improved nearest-neighbor parameters for predicting DNA duplex stability. Biochemistry, 35, 3555–3562. [DOI] [PubMed] [Google Scholar]


