Abstract
Metastasis involves the phenotype transition of cancer cells to gain invasiveness, and the following migration at the tumor site. Here an integrated microfluidic chip to study this process is presented by combining on-chip delivery of siRNA for gene silencing and cell migration assay. The major advantage of the integrated chip is the simple input of cells and gene transfection materials, and the ultimate output of migration ability. The reverse-fishbone structure and 0.7× phosphate-buffered saline solution are the optimized parameters for improved delivery efficiency. Using the chip, it is validated that cofilin plays an essential role in regulating cancer cell migration. The integrated chip may provide a simple and effective platform for biologists to easily check the role of specific genes in metastasis.
Keywords: cancer cell migration, gene silencing, metastasis, microfluidics, siRNA
Metastasis, which results from the dissemination of cancer cells from primary tumor to distant organ sites, is the leading cause of cancer-related deaths. The initial steps of metastasis involve the activation of signaling pathway and the transition of noninvasive phenotype to invasive phenotype, for example, epithelial-mesenchymal transition (EMT) in cancer cells.[1] The phenotype change is a result of abnormal gene expression, and can activate cancer cell migration into the adjacent tissue.[2] Therefore, genes involved in regulating cancer cell migration could be potential targets for antimetastasis therapy.[3]
To study the functional role of genes in cancer cell migration, specific genes can be knocked down by shRNA[4] or siRNA,[2a] or knocked out by CRISPR[5] or TALEN,[6] followed by traditional cell migration assays[7] including transwell, wound-healing, and scratch assay. This process is complicated with multistep operations. Gene transfection by liposomes, electroporation, and viral vector usually has the problem of low efficiency, high cell death rate, or mutagenic effect.[8] Traditional migration assays are often limited in microenvironment control and lack information on migration dynamics. More effective approaches with simple operation, improved transfection efficiency, and controlled migration environment are required.
Microfluidics, featuring small dimensions, fast reaction, and precise manipulation of cells, can potentially satisfy the above criteria.[9] Recently, a new microfluidic delivery method was developed. By squeezing cells through microgaps, materials such as siRNA, ssDNA, or plasmids, can be delivered into a variety of cell types, particularly hard-to-transfect cells, for gene transfection.[10] A further application, which is useful but challenging, is the integration of microfluidic transfection with downstream analysis of cellular function to study the biological role of transfected genes. Here, for the first time, we present an integrated-microfluidic-system chip (IMS-chip), which achieves both on-chip delivery of siRNA for gene knockdown, and on-chip cell migration assay. The IMS-chip consists of two functional modules. In the first module, through rapid deformation of cancer cells to produce transient membrane holes, siRNA can diffuse into cancer cells. In the second module, the delivered cells are captured, cultured for gene expression, and migrate in the presence of controlled chemotaxis gradient. To summarize, the IMS-chip has the following merits: (1) Simple operation with the input of cells and transfection materials, and the output of migration ability; (2) efficient gene silencing enabled by the optimized reverse-fishbone structure and delivery solution; (3) precise control of physiological microenvironment for cell migration. The IMS-chip may provide a simple and effective platform for biologists to easily check the role of specific genes in cancer cell migration and metastasis.
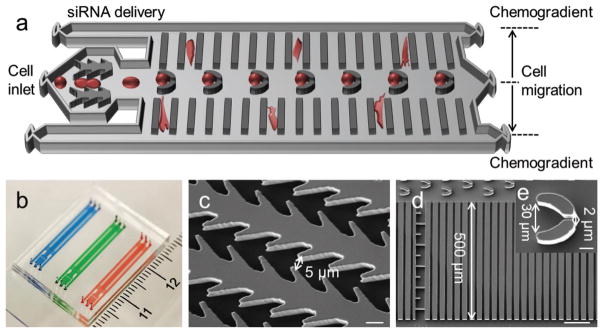
The IMS-chip consists of three inlets, three outlets, and two functional modules (Figure 1a,b). In the first module, the microgap array was like reverse-fishbone with the gap width of 5 μm (Figure 1c). In the second module, the trap structure was like a funnel with the entrance width of 30 μm and the exit width of 2 μm (Figure 1d). There were 40 migration chambers, each of which consisted of 20 migration microchannels with the width of 8 μm and the length of 500 μm. The width of 8 μm can mimic the dimension of capillaries or pores of tissues. Previous study suggested that cancer cells can easily squeeze through 8 μm wide confined channel during migration.[11] The height of microfluidic structures was 20 μm. The average diameter of MDA-MB-231 cells was around 15 μm which was much larger than the microgap width.
Figure 1.
IMS-chip design and work principle. a) Schematic illustration of the integrated chip for siRNA delivery and cell migration evaluation. b) Photo of microfluidic chip. c) SEM image of delivery structure. Scale bar, 10 μm. d) SEM image of cell migration structure. Scale bar, 100 μm. e) SEM image of cell capture structure. Scale bar, 10 μm.
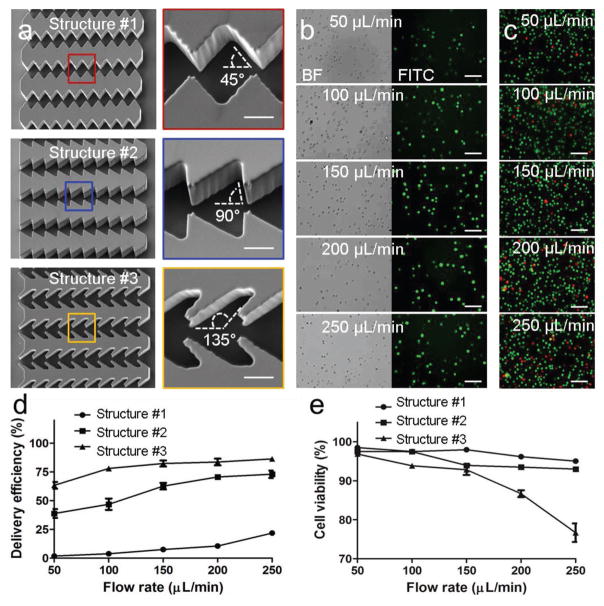
Delivery efficiency indicates the ratio of cancer cells that were successfully delivered with materials. To improve the delivery efficiency, we first optimized the delivery structures. Three structures were designed with different orientation angles (45° of #1, 90° of #2, and 135° of #3) between the gap edge and the fluid direction (Figure 2a). (Fluorescein isothiocyanate) FITC-dextran (MW 70 000) was used as delivery material to characterize delivery efficiency. A variety of flow rates from 50 to 250 μL min−1 were tested. The imaging results indicate that more cells were successfully delivered with dextran using the higher flow rate (Figure 2b and Figure S1, Supporting Information). At the same flow rate, the structure #2 achieved better delivery efficiency than the structure #1 while the structure #3 achieved the best delivery effect. The imaging results of cell viability assay suggest that higher flow rate induced more cell deaths (Figure 2c and Figure S2, Supporting Information). At the same flow rate, there were more cell deaths using the structure #2 and the most cell deaths using the structure #3. The delivery efficiency and the cell viability were then calculated (Figure 2d,e). Better delivery efficiency was achieved using the structure #3. Though the structure #3 resulted in more cell deaths, the viability was maintained more than 90% at the flow rates of less than 150 μL min−1. Considering both delivery efficiency and cell viability, the optimized structure was the structure #3 and the optimized flow rate using the structure #3 was 150 μL min−1.
Figure 2.
Optimization of delivery structures. a) SEM images of three delivery structures. Scale bar, 10 μm. b) Images of MDA-MB-231 cells delivered with FITC-dextran (70K) at different flow rates. Scale bar, 100 μm. c) Images of live/dead staining of the delivered cells. Green dots represent live cells and red dots indicate dead cells. Scale bar, 100 μm. d) Delivery efficiency by different structures and flow rates. e) Cell viability of the delivered cells by different structures and flow rates.
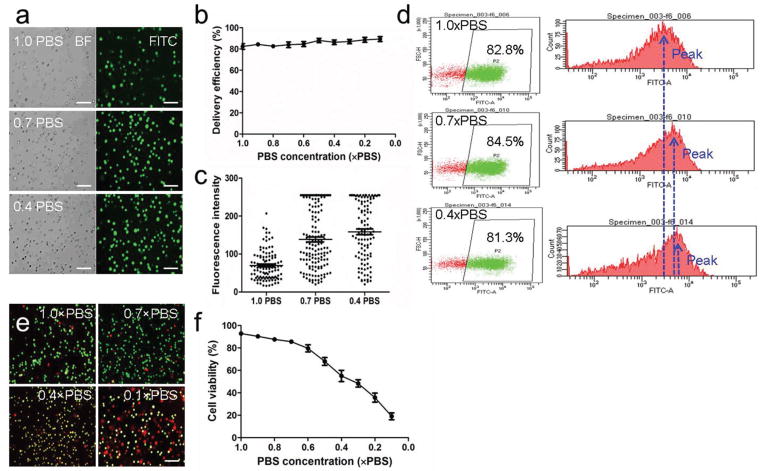
Besides delivery structures, the phosphate-buffered saline (PBS) concentration in the solution may also affect delivery efficiency. A variety of PBS concentrations ranging from 0.1 × PBS to 1.0 × PBS was tested using the optimized structure #3 and the optimized flow rate of 150 μL min−1. With the decrease of PBS concentration, the delivery efficiency was maintained between 80% and 85% (Figure 3a,b and Figure S3, Supporting Information). Though the delivery efficiency had little change, there was significant increase of fluorescence intensity (Figure 3c). Fluorescence intensity shows how much material was delivered into cells. The increase of fluorescence intensity suggested more FITC-dextran was delivered into each cell. This was further validated by flow cytometry analysis. There was little change of delivery efficiency, while the peak value of FITC signal increased with the decrease of PBS concentration (Figure 3d). The results shown in Figure 3c,d suggested that the low PBS solution cannot increase the ratio of delivered cancer cells, but can increase the amount of FITC-dextran that was successfully delivered into cells. Cell viability was further analyzed. With the decrease of PBS concentration, cell viability decreased (Figure 3e,f and Figure S4, Supporting Information). When the PBS concentration was higher than 0.7×, the cell viability was maintained above 80%. Considering both delivery efficiency and cell viability, the optimized PBS concentration was 0.7×.
Figure 3.
Optimization of PBS concentrations. a) Images of FITC-dextran (70K) delivered cells in different PBS solutions. Scale bar, 100 μm. b) Delivery efficiency in different PBS solutions. c) Fluorescence intensity of delivered cells in different PBS solutions. d) Flow cytometry analysis of cancer cells delivered in different PBS solutions. e) Images of live/dead staining of delivered cells. Green dots represent live cells and red dots represent dead cells. Scale bar, 100 μm. f) Cell viability of delivered cells in different PBS solutions.
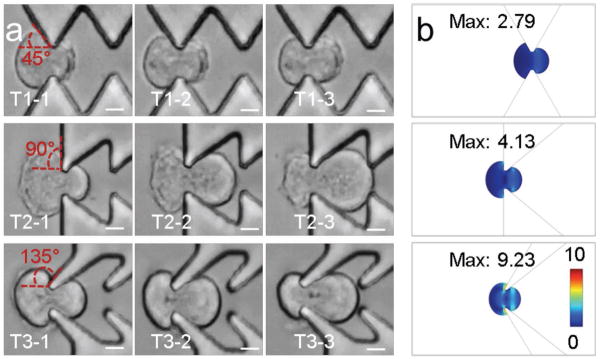
Sharei et al.[10a] first developed microfluidic squeezing for intracellular delivery. During squeezing, cell stretching generates transient membrane holes for molecular diffusion. In this study, it is proposed that changing membrane orientation together with cell stretching may help to improve delivery efficiency. When cells successfully passed through microgaps in the three structures (Movies S1–S3, Supporting Information), cells changed the membrane orientation with different angles, which were 45° for structure #1, 90° for structure #2, and 135° for structure #3 (Figure 4a). The computer modeling shows that the peak stress from the structure #3 was 9.23, which was much higher than 2.7 from the structure #1 and also higher than 4.13 from the structure #2 (Figure 4b). The modeling results suggest that more change of membrane orientation resulted in higher localized membrane stress. The increase of localized stress may potentially generate more holes or larger holes for better delivery. The implementation of change of membrane orientation with cell squeezing may provide a useful strategy for microfluidic delivery.
Figure 4.
Delivery mechanisms. a) Images of cell squeezing through different constriction structures. Scale bar, 100 μm. b) Stress analysis by computer modeling of three structures. The unit is N m−2.
Regarding the optimization of delivery solution, we hypothesized that the loose membrane may help generate more membrane holes for molecular diffusion. To generate the loose membrane, low salt solution was used by decreasing PBS concentration. In less-salted solution, membrane expanded and became loose due to the change of osmotic pressure.[12] The results of improved delivery efficiency in less salted solution supported our hypothesis. Though using low PBS concentration solution can improve delivery efficiency, it resulted in more deaths. Therefore, there should be a balance between delivery efficiency and cell viability using less salted solution for delivery.
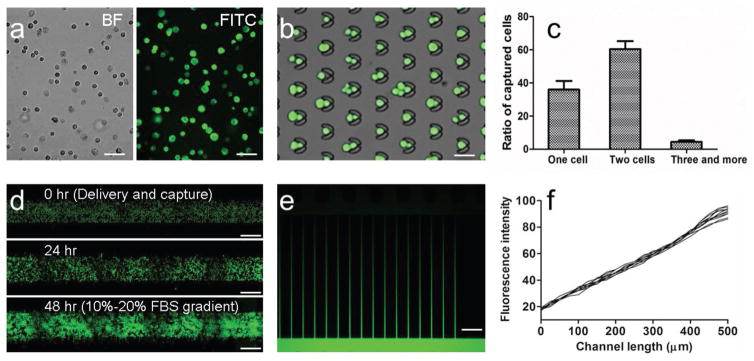
Using the optimized delivery structure and the optimized PBS concentration, we next delivered FITC-siRNA into MDA-MB-231 cells. The results of cellular imaging after delivery show that siRNA was efficiently delivered into cells (Figure 5a). The delivered cells were next perfused into the zone of trap array, and captured by traps. Most traps can capture one or two cancer cells (Figure 5b,c). The captured cells were then cultured for 2 or 3 d. During culture, fresh media was perfused into the microfluidic chip by gravity flow. Cancer cells (MDA-MB-231-GFP) proliferated well with the obvious increase of cell number (Figure 5d). After 2 or 3 d on-chip culture, fetal bovine serum (FBS) gradient was used to activate cancer cell migration. FBS contains a variety of nutrients and growth factors that help to maintain survival, growth, and division of cancer cells. FBS gradient was generated to promote directional cancer cell migration. The chemotaxis gradient was maintained by the perfusion of different FBS containing media through the three inlets, and controlled by syringe pumps. The simulation of gradient by FITC solution indicates that linear gradient was successfully generated (Figure 5e,f).
Figure 5.
On-chip cell capture and culture. a) Images of MDA-MB-231 cells delivered with FITC-siRNA. Scale bar, 100 μm. b) Images of FITC-siRNA delivered MDA-MB-231 cells captured by trap array. Scale bar, 40 μm. c) Ratio of number of captured cells. d) Images of MDA-MB-231-GFP cells after delivery and culture for 0, 24, and 48 h. Scale bar, 200 μm. e) Image of FITC gradient generated across migration microchannels. Scale bar, 50 μm. f) Fluorescence intensity profiles of FITC gradient.
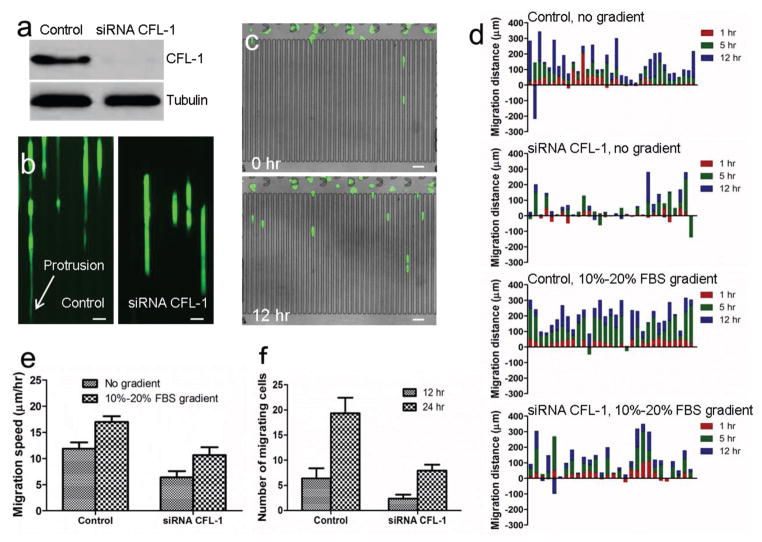
Cofilin (CFL) is a widely distributed actin-modulating protein that can bind and depolymerize F-actin.[13] It is regarded that cofilin is a key player in regulating the dynamics of actin cytoskeleton of migrating cells.[14] In this study, siRNA CFL-1 was delivered into MDA-MB-231/GFP cells using the optimized parameters to study the effect on cancer cell migration. After the gene knockdown by siRNA CFL-1, the expression of CFL protein was silenced, as shown in western blotting assay (Figure 6a). In the presence of 10%–20% FBS gradient, the migration potentials of control and knockdown cells were compared. During migration, control cells showed elongated morphology with long protrusion and migrated fast (Figure 6b and Movie S4, Supporting Information). In contrast, cells in which CFL-1 was knocked down by siRNA CFL-1 were lacking in long protrusion and migrated slowly (Figure 6b and Movie S5, Supporting Information). Time-lapse imaging and cell tracking were used to study migration direction, distance, and speed at different time points. The study of migration dynamics can provide more accurate characterization of the effects of microenvironment, and can also discriminate the migration modes, for example, mesenchymal migration or collective migration. Ren et al. reported that multiconstriction design was superior to a single constriction design in differentiating MDA-MB-231 and MCF-10A cells by recording videos of cell movement.[15] Wong et al. reported spatiotemporal measurements of individually and collectively migrating cells in the array of PDMS micropillars, and revealed that individually migrating cells exhibited diminished chemosensitivity.[16] After delivery, cells were captured and cultured for 6 h to allow cell adhesion and maintain viability. Time-lapse imaging was then used to record cell movement. The migration distances and speed in the presence or absence of FBS gradient were summarized (Figure 6c–e). 10%–20% FBS gradient promoted cancer cell migration. After CFL-1 knockdown, cancer cells migrated shorter distance at a low speed. After 12 or 24 h of culturing, the number of cancer cells migrating into microchannels from capture array was counted. More control cells migrated into microchannels (Figure 6f). The overall results confirm that CFL-1 plays an essential role in regulating cell migration.
Figure 6.
Migration of control and CFL-1 knockdown MDA-MB-231-GFP cells. a) Western blot analysis of expression of CFL-1 in control and siRNA CFL-1 knockdown cells. b) Fluorescent images of control and knockdown cells before and after 12 h migration. Protrusion is indicated by white arrow. Scale bar: 30 μm. c) Images of cells before and after 12 h migration. Scale bar: 50 μm. d) Migration distance of control and knockdown cells in the presence and absence of 10%–20% FBS gradient. X-axis indicates individual cells. The numbers of cells in the four experiments were 35, 31, 31, and 28, respectively. e) Migration speed of control and knockdown cells. f) Number of cells migrating into microchannels after 12 and 24 h culture.
Microfluidic delivery is attractive for gene editing and gene silencing. The downstream analysis of editing effect is usually performed using off-chip biological approaches. The whole process is complicated and labor intensive with multiple operations. To the best of our knowledge, this study is the first report of the integration of microfluidic delivery and on-chip downstream analysis. The operation is simple with the input of cells and transfection materials, and the output of migration ability. The integration provides the advantages of miniaturization, automation, ease of use, and low-cost assay. On-chip integration could be potentially extended to include other phenotype analysis, such as proliferation and 3D invasion.
Experimental Section
Chip Fabrication
Auto computer aided design (CAD) software was used to design microfluidic structures, which was printed out onto glass photomask (Photo Sciences, Torrance, CA). The microfluidic chip was then fabricated using standard photolithography and soft lithography techniques. Negative photoresist SU8-3025 (Microchem Corp., Naton, MA) was used to generate micropatterns on silicon wafer using a photomask. Polydimethylsiloxane (PDMS) prepolymer (Sylgard 184, Dow Corning, USA) was mixed with curing agent (10:1 w/w ratio), poured onto silicon wafer, and curried at 80 °C for 1 h. The inlet and outlet area of PDMS mold was punched with holes. The PDMS molds were bonded to glass slides after plasma treatment (Plasma Etch, Inc., NV).
Finite Element Simulation
The flow stress on cells during delivery was analyzed using the finite element method. To perform the temporal simulation, the fluidic dynamics (incompressible Navier–Stokes equations) and solid mechanics equations (Newton’s second law of motion) were coupled and implemented by fluid–solid interactions. The mesh geometry was moved continuously and deformed by applying the arbitrary Lagrangian–Eulerian method. The dimensions and mechanical properties of modeling were similar to the actual experiment. Flow stress on cells was computed as the von Mises stress.
Cell Culture
Human cancer cell line MDA-MB-231 from ATCC (Manassas, VA) was cultured in Dulbecco’s modified Eagle medium (DMEM)/F-12 base medium (Lonza, Walkersville, MD) supplemented with 10% FBS and 1% penicillin streptomycin solution (Cellgro, MA). Cell culture was maintained in humidified environment with 5% CO2 at 37 °C. At 80% confluence, cells were harvested by incubation with 0.0425% trypsin solution (PromoCell, Heidelberg, Germany).
Operation of Microfluidic Chips
The microfluidic chips were blocked with 3% bovine serum albumin in PBS for 30 min, followed by PBS flushing. MDA-MB-231 or MDA-MB-231-GFP cancer cells were suspended in PBS and then mixed with the delivery materials including FITC-dextran (MW 70 000, Sigma, St. Louis, MO) or siRNA (Santa Cruz Biotechnology, Dallas, TX). The mixed solution was perfused into the microfluidic chip through the middle inlet. The other two inlets were perfused with PBS. Flow rate was controlled by syringe pump. Cancer cells squeezed through microgaps in the first module, and were then captured by the trap microarray in the second module. Captured cancer cells were continued to be cultured for 2 or 3 d in the microfluidic chip. During cell culture, fresh media was introduced into chips through the three inlets by gravity flow. Cancer cell migration was controlled by FBS gradient. To generate gradient, the middle inlet was perfused with 10% FBS media at the flow rate of 0.08 μL min−1 and the other inlets were perfused with 20% FBS media at the flow rate of 0.025 μL min−1. Cancer cell migration was monitored by EVOS FL Auto Cell Imaging System (Life Technologies, Carlsbad, CA).
Characterization of Delivery Efficiency by Cell Imaging, Flow Cytometry, and Viability Assay
Part of delivered MDA-MB-231 cells were collected through the outlets and imaged by EVOS FL microscope (Life Technologies, Carlsbad, CA). The fluorescence intensity of each cell was analyzed by Image J software. The delivery efficiency was also analyzed by flow cytometry using a BD LSRFortessa analyzer. Viability of MDA-MB-231 cells collected from the outlets was assessed by LIVE/DEAD assay (Invitrogen, CA). Live cells were stained with green fluorescence and dead cells were stained with red fluorescence.
Western Blotting Assay
The cofilin-1 (CFL-1) protein expression after siRNA CFL-1 knockdown was analyzed by western blotting. MDA-MB-231-GFP cells delivered with siRNA CFL-1 were allowed to recover in culture for 2 or 3 d. Cancer cells were then collected for western blotting assay. The used primary antibody was anti-CFL-1 antibody (Sigma).
Supplementary Material
Acknowledgments
This study was funded by National Institutes of Health (R01 DA035868, R01 CA180083, R56 AG049714, R21 CA191179, and R01 AI101437).
Footnotes
Conflict of Interest
The authors declare no conflict of interest.
Supporting Information is available from the Wiley Online Library or from the author.
Contributor Information
Dr. Zongbin Liu, Department of Nanomedicine, Houston Methodist Research Institute, Houston, TX 77030, USA. Department of Cell and Development Biology, Weill Medical College of Cornell University, New York, NY 10065, USA
Dr. Xin Han, Department of Nanomedicine, Houston Methodist Research Institute, Houston, TX 77030, USA. Department of Cell and Development Biology, Weill Medical College of Cornell University, New York, NY 10065, USA
Dr. Qing Zhou, Department of Microbiology and Molecular Genetics, McGovern Medical School, Houston, TX 77030, USA
Rui Chen, Department of Nanomedicine, Houston Methodist Research Institute, Houston, TX 77030, USA. Department of Cell and Development Biology, Weill Medical College of Cornell University, New York, NY 10065, USA. The Third Affiliated Hospital of Guangzhou Medical University, Guangzhou Medical University, Guangzhou, Guangdong 540150, China.
Shelby Fruge, Department of Nanomedicine, Houston Methodist Research Institute, Houston, TX 77030, USA. Department of Pediatrics, School of Medicine, Emory University, Atlanta, GA 30302, USA.
Dr. Myeong Chan Jo, Department of Nanomedicine, Houston Methodist Research Institute, Houston, TX 77030, USA. Department of Cell and Development Biology, Weill Medical College of Cornell University, New York, NY 10065, USA
Yuan Ma, Department of Nanomedicine, Houston Methodist Research Institute, Houston, TX 77030, USA. Department of Cell and Development Biology, Weill Medical College of Cornell University, New York, NY 10065, USA.
Dr. Ziyin Li, Department of Microbiology and Molecular Genetics, McGovern Medical School, Houston, TX 77030, USA
Dr. Kenji Yokoi, Department of Nanomedicine, Houston Methodist Research Institute, Houston, TX 77030, USA
Prof. Lidong Qin, Department of Nanomedicine, Houston Methodist Research Institute, Houston, TX 77030, USA. Department of Cell and Development Biology, Weill Medical College of Cornell University, New York, NY 10065, USA
References
- 1.a) Tsai JH, Yang J. Genes Dev. 2013;27:2192. doi: 10.1101/gad.225334.113. [DOI] [PMC free article] [PubMed] [Google Scholar]; b) Ward Y, Wang W, Woodhouse E, Linnoila I, Liotta L, Kelly K. Mol Cell Biol. 2001;21:5958. doi: 10.1128/MCB.21.17.5958-5969.2001. [DOI] [PMC free article] [PubMed] [Google Scholar]
- 2.a) Simpson KJ, Selfors LM, Bui J, Reynolds A, Leake D, Khvorova A, Brugge JS. Nat Cell Biol. 2008;10:1027. doi: 10.1038/ncb1762. [DOI] [PubMed] [Google Scholar]; b) Suyama E, Kawasaki H, Nakajima M, Taira K. Proc Natl Acad Sci USA. 2003;100:5616. doi: 10.1073/pnas.1035850100. [DOI] [PMC free article] [PubMed] [Google Scholar]; c) van Roosmalen W, Le Devedec SE, Golani O, Smid M, Pulyakhina I, Timmermans AM, Look MP, Zi D, Pont C, de Graauw M, Naffar-Abu-Amara S, Kirsanova C, Rustici G, ’t Hoen PAC, Martens JWM, Foekens JA, Geiger B, van de Water B. J Clin Invest. 2015;125:1648. doi: 10.1172/JCI74440. [DOI] [PMC free article] [PubMed] [Google Scholar]; d) Walter M, Liang S, Ghosh S, Hornsby PJ, Li R. Oncogene. 2009;28:2745. doi: 10.1038/onc.2009.130. [DOI] [PMC free article] [PubMed] [Google Scholar]
- 3.a) Ferrari-Amorotti G, Chiodoni C, Shen F, Cattelani S, Soliera AR, Manzotti G, Grisendi G, Dominici M, Rivasi F, Colombo MP, Fatatis A, Calabretta B. Neoplasia. 2014;16:1047. doi: 10.1016/j.neo.2014.10.006. [DOI] [PMC free article] [PubMed] [Google Scholar]; b) Liang Z, Yoon Y, Votaw J, Goodman MM, Williams L, Shim H. Cancer Res. 2005;65:967. [PMC free article] [PubMed] [Google Scholar]; c) Zhang Y, Wang Z, Chen M, Peng L, Wang X, Ma Q, Ma F, Jiang B. Mol Cancer. 2012;11:23. doi: 10.1186/1476-4598-11-23. [DOI] [PMC free article] [PubMed] [Google Scholar]
- 4.a) Ding H, Quan H, Yan W, Han J. Biosci Rep. 2016;36:e00389. doi: 10.1042/BSR20160053. [DOI] [PMC free article] [PubMed] [Google Scholar] [Retracted]; b) Ying TH, Lee CH, Chiou HL, Yang SF, Lin CL, Hung CH, Tsai JP, Hsieh YH. Sci Rep. 2016;6:29385. doi: 10.1038/srep29385. [DOI] [PMC free article] [PubMed] [Google Scholar]
- 5.a) Kawamura N, Nimura K, Nagano H, Yamaguchi S, Nonomura N, Kaneda Y. Oncotarget. 2015;6:22361. doi: 10.18632/oncotarget.4293. [DOI] [PMC free article] [PubMed] [Google Scholar]; b) Shalem O, Sanjana NE, Hartenian E, Shi X, Scott DA, Mikkelsen TS, Heckl D, Ebert BL, Root DE, Doench JG, Zhang F. Science. 2014;343:84. doi: 10.1126/science.1247005. [DOI] [PMC free article] [PubMed] [Google Scholar]
- 6.a) Cao K, Jiang WT, Cao PG, Zou Q, Xiao S, Zhou JD, Huang CH. Mol Med Rep. 2014;10:848. doi: 10.3892/mmr.2014.2268. [DOI] [PubMed] [Google Scholar]; b) Ren YG, Qiu L, Lu FL, Ru XF, Li SJ, Xiang YC, Yu SW, Zhang YG. Sci Rep. 2016;6:23775. doi: 10.1038/srep23775. [DOI] [PMC free article] [PubMed] [Google Scholar]
- 7.a) Justus CR, Leffler N, Ruiz-Echevarria M, Yang LV. Jove-J Vis Exp. 2014 doi: 10.3791/51046. [DOI] [PMC free article] [PubMed] [Google Scholar]; b) Liang CC, Park AY. J L Guan, Nat Protoc. 2007;2:329. doi: 10.1038/nprot.2007.30. [DOI] [PubMed] [Google Scholar]
- 8.a) Kim TK, Eberwine JH. Anal Bioanal Chem. 2010;397:3173. doi: 10.1007/s00216-010-3821-6. [DOI] [PMC free article] [PubMed] [Google Scholar]; b) Wang WW, Li WZ, Ma N, Steinhoff G. Curr Pharm Biotechnol. 2013;14:46. [PubMed] [Google Scholar]; c) Yamano S, Dai JS, Moursi AM. Mol Biotechnol. 2010;46:287. doi: 10.1007/s12033-010-9302-5. [DOI] [PubMed] [Google Scholar]
- 9.Liu Z, Han X, Qin L. Adv Healthcare Mater. 2016;5:871. doi: 10.1002/adhm.201600009. [DOI] [PMC free article] [PubMed] [Google Scholar]
- 10.a) Sharei A, Zoldan J, Adamo A, Sim WY, Cho N, Jackson E, Mao S, Schneider S, Han MJ, Lytton-Jean A, Basto PA, Jhunjhunwala S, Lee J, Heller DA, Kang JW, Hartoularos GC, Kim KS, Anderson DG, Langer R, Jensen KF. Proc Natl Acad Sci USA. 2013;110:2082. doi: 10.1073/pnas.1218705110. [DOI] [PMC free article] [PubMed] [Google Scholar]; b) Han X, Liu Z, Jo MC, Zhang K, Li Y, Zeng Z, Li N, Zu Y, Qin L. Sci Adv. 2015;1:e1500454. doi: 10.1126/sciadv.1500454. [DOI] [PMC free article] [PubMed] [Google Scholar]
- 11.a) Chen YC, Allen SG, Ingram PN, Buckanovich R, Merajver SD, Yoon E. Sci Rep. 2015;5:9980. doi: 10.1038/srep09980. [DOI] [PMC free article] [PubMed] [Google Scholar]; b) Peyrin JM, Deleglise B, Saias L, Vignes M, Gougis P, Magnifico S, Betuing S, Pietri M, Caboche J, Vanhoutte P, Viovy JL, Brugg B. Lab Chip. 2011;11:3663. doi: 10.1039/c1lc20014c. [DOI] [PubMed] [Google Scholar]
- 12.a) Singh-Zocchi M, Andreasen A, Zocchi G. Proc Natl Acad Sci USA. 1999;96:6711. doi: 10.1073/pnas.96.12.6711. [DOI] [PMC free article] [PubMed] [Google Scholar]; b) Walski T, Chludzinska L, Komorowska M, Witkiewicz W. BioMed Res Int. 2014;2014:162102. doi: 10.1155/2014/162102. [DOI] [PMC free article] [PubMed] [Google Scholar]
- 13.McGough A, Pope B, Chiu W, Weeds A. J Cell Biol. 1997;138:771. doi: 10.1083/jcb.138.4.771. [DOI] [PMC free article] [PubMed] [Google Scholar]
- 14.a) Bravo-Cordero JJ, Magalhaes MA, Eddy RJ, Hodgson L, Condeelis J. Nat Rev Mol Cell Biol. 2013;14:405. doi: 10.1038/nrm3609. [DOI] [PMC free article] [PubMed] [Google Scholar]; b) Sidani M, Wessels D, Mouneimne G, Ghosh M, Goswami S, Sarmiento C, Wang W, Kuhl S, El-Sibai M, Backer JM, Eddy R, Soll D, Condeelis J. J Cell Biol. 2007;179:777. doi: 10.1083/jcb.200707009. [DOI] [PMC free article] [PubMed] [Google Scholar]
- 15.Ren X, Ghassemi P, Babahosseini H, Strobl JS, Agah M. ACS Sens. 2017;2:290. doi: 10.1021/acssensors.6b00823. [DOI] [PMC free article] [PubMed] [Google Scholar]
- 16.Wong IY, Javaid S, Wong EA, Perk S, Haber DA, Toner M, Irimia D. Nat Mater. 2014;13:1063. doi: 10.1038/nmat4062. [DOI] [PMC free article] [PubMed] [Google Scholar]
Associated Data
This section collects any data citations, data availability statements, or supplementary materials included in this article.


