

Abstract
Many complex systems reveal a small-world topology, which allows simultaneously local and global efficiency in the interaction between system constituents. Here, we report the results of a comprehensive study that investigates the relation between the clustering properties in such small-world systems and the strength of interactions between its constituents, quantified by the link weight. For brain, gene, social and language networks, we find a local integrative weight organization in which strong links preferentially occur between nodes with overlapping neighbourhoods; we relate this to global robustness of the clustering to removal of the weakest links. Furthermore, we identify local learning rules that establish integrative networks and improve network traffic in response to past traffic failures. Our findings identify a general organization for complex systems that strikes a balance between efficient local and global communication in their strong interactions, while allowing for robust, exploratory development of weak interactions.
Networks as diverse as those linking scientific collaborations and those connecting the US electrical power grid exhibit a small-world topology characterized by short node-to-node distances and highly clustered neighbourhoods, as quantified by a high clustering coefficient, C (refs 1–4). This enables complex systems to simultaneously achieve both global and local efficiency in the interactions of their components5–7. In the brain, this topology captures the organization of neural connectivity at different spatial scales and in various species8–13 as well as the propagation of activity in the form of neuronal avalanches14–16.
In most real-world networks, a gradation of interactions exists, commonly quantified by the link weight, w (refs 2,17), which reflects important functional properties such as capacity in transportation routes and communication networks, strength of friendships in social networks, or memories reinforced in brain networks. Recently, many features of weighted networks have been studied, for example the relationship between the node degree and node strength18,19, pair-wise node correlations20, dynamical properties21,22 and stability23, but some of the earliest findings regarding the relationship between weights and network topology were observed in social networks four decades ago24,25. In the seminal work by Granovetter24, it is stated that “the degree of overlap of two individuals’ friendship networks varies directly with the strength of their tie to one another”. Thus, strong links are found between nodes with highly overlapping neighbourhoods, a principle that was recently confirmed in mobile phone communications26. Here we extend this finding to other complex networks, in particular brain, gene, and human interaction networks. On the other hand, some real networks and network models exhibit the opposite behaviour, where strong links tend to connect non-overlapping neighbourhoods.
We analyse the relationship between clustering and the weights, both locally and globally, in small-world networks. We assign to each link a local measure of clustering, the link clustering coefficient, CL, defined using the relative neighbourhood overlap,
where nC is the number of common neighbours and nT is the total number of neighbouring nodes, excluding the end nodes (Fig. 1a). For directed networks, we use outgoing links for neighbourhood definition if not stated otherwise (see Supplementary Information). For undirected networks, CL is equivalent to the edge clustering coefficient27,28, but normalized differently.
Figure 1. Link clustering in real-world networks reveals preferential placement of strong links with respect to the neighbourhood overlap of the corresponding end nodes.

a, The link clustering coefficient CL is defined as the relative overlap between the neighbourhoods of a link’s end nodes i and j, that is, the number of common nodes (red). b, In integrative networks, strong links (thick lines) correlate with high overlap (left), whereas the opposite is found in dispersive networks (right). c, Functional connectivity derived from neuronal avalanches in the cortex of awake macaque monkeys and organotypic cultures. The average link clustering ΔCL plotted versus weight rank shows a strong positive trend between link weight and relative neighbourhood overlap. The first rank is the smallest weight. d–f, Functional and structural architecture of human cerebral cortex networks (d), gene expression networks (e) and social co-appearance networks (f) show similar results to c. g, Functional connectivity for language networks showing a weak positive trend for ΔCL. h, Summary for three networks of C. elegans reveals no trend in link clustering. i, Dispersive US Air flight network showing a weak, negative trend of ΔCL and the airport passenger network showing a low to slightly positive ΔCL. j, Author collaboration networks showing a negative trend in ΔCL. Condensed matter (Cond. Mat.), high-energy physics (HEP), astrophysics (Astro.), network science (Net.). Error bars indicate the standard error (s.e.).
We quantify the relationship between CL and link weight, w, using the correlation coefficient, RCL . As RCL reveals only the linear trend, we also visualize the dependence of the average excess link clustering, ΔCL, on weight rank (rank 1 being the smallest weight). In Fig. 1c, results are shown for three functional networks derived from neuronal avalanche activity in two different types of organotypic neuronal culture and in the pre-motor cortex in awake macaque monkeys14–16. In these networks, weights represent the spontaneous propagation of neuronal activity between different nodes, that is, sites in the neural tissue16. The steep positive trend we observe and the positive value of RCL demonstrate that activity propagates preferentially between nodes with highly overlapping neighbourhoods.
Similar results are obtained for networks of the structural and functional organization of the human cerebral cortex9 (Fig. 1d), both describing the connectivity between ~1,000 cortical regions of interest (nodes) distributed over 66 functional cortical areas. The weights in these two networks represent axonal fibre density, identified using diffusion spectrum imaging (DSI), and the correlation strength, derived from the ‘resting state’ cortical activity using functional magnetic resonance imaging9 (fMRI), respectively. In Fig. 1e, we show similar results for gene regulation networks derived from human and mouse gene expression data29. The weights in these networks measure the degree of regulation between two genes. To have computationally manageable link analysis, links lower than a threshold of 0.08 were discarded. We point out that similar results are obtained for gene sub-networks containing a smaller and randomly chosen subset of the original nodes (Supplementary Fig. S1). A comparable weight organization is also found for two co-appearance ‘social’ networks (Fig. 1f), a film actor collaboration network (N =54,000) and the network of characters in the chapters of the novel Les Misérables (N = 77). In two language networks, consisting of the Reuters News 9/11 network (N =13,300) and the directed words free-association network (N =10,600), in which weights represent the co-occurrences of words in news articles and the number of subjects that associate a source word to a target word, respectively, RCL is positive, but with small ΔCL (Fig. 1g).
These results demonstrate that the local weighting rule relating the neighbourhood overlap and the strength of the links, first observed in social networks24,25, has a more general validity, and is found to hold strongly in the above-mentioned biological and social networks. A number of other networks, however, show a less positive, or even negative, trend between neighbourhood overlap and link strength. The anatomically well-characterized neural network of the worm Caenorhabditis elegans (C. elegans, Fig. 1h) shows a negligible trend, with RCL ≈0. Regarding transportation networks (Fig. 1i), we find positive RCL for traffic between 500 US airports, and negative RCL for the US Airways (US Air) transportation network2,18, that is, strong links preferentially occur between non-overlapping neighbourhoods, indicating that strong routes connect airports that preferentially serve different destinations. Similarly, physics author collaboration networks (Fig. 1j), in which weights reflect the number of papers co-authored normalized by the number of authors for each paper, exhibit negative RCL. (For detailed properties of all networks see Supplementary Information and Table SI therein.)
For convenience, we define a weight organization with significantly positive RCL as integrative, because of the tendency of strong links to connect nodes with overlapping neighbourhoods (Fig. 1b, left). Conversely, networks with negative RCL, in which strong links connect non-overlapping neighbourhoods, are defined as dispersive (Fig. 1b, right). Zero RCL defines neutral weight organization.
Robustness of clustering in integrative networks
The importance of network robustness to a loss of nodes or links has been emphasized in various studies30,31. Here, we explore the relationship between the integrative weight organization, a local network property, and the robustness of the average node clustering coefficient, C, to the loss of weak links, a global network property. More specifically, we use pruning analysis to characterize the change in the network on successive removal of the weakest (bottom-pruning), or strongest (top-pruning) links. For the neuronal avalanche networks described above, we find that, even when a large fraction f of the weakest links is removed, the excess clustering remains high and fairly constant, that is, invariant (Fig. 2a; solid lines). In contrast, removing even a small fraction of the strongest links readily destroys clustering in avalanche networks (Fig. 2a; dashed lines). Similar results are found for other integrative networks, such as the brain, gene, social and language networks (Fig. 2b–f). In contrast, the opposite trend for ΔC is found for dispersive networks such as the US Air transportation network (Fig. 2g), which is robust to top-pruning but not bottom-pruning. We quantify the difference in constancy of ΔC between bottom- pruning and top-pruning by the measure M, which ranges between −1 and 1 (see Methods). It is positive for networks in which ΔC is more invariant to bottom-pruning than top-pruning and negative when the opposite is true. M is zero or small for networks, such as collaboration networks (Fig. 2h), that show no robustness or pruning asymmetry.
Figure 2. The robustness of clustering to the loss of their weakest or strongest links in small-world networks and its correlation to link clustering.

a–d, Neuronal avalanche networks from awake macaque monkeys and organotypic cortex cultures (a), the human brain (b), gene interaction (c) and some social networks (d). In these cases ΔC remains invariant for bottom-pruning (solid lines) but not for top-pruning (broken lines); f is the fraction of weakest and strongest links pruned respectively. e, Language networks. f, C. elegans network. g, Transportation networks such as the US Air flights and airport passenger networks are robust to top pruning, but not bottom-pruning, that is, clustering largely depends on weak links. Note that high capacity routes for US Air flights are formed between airports with a clustering coefficient below chance. h, Author collaboration networks show no asymmetry between top-pruning and bottom-pruning and M is close to 0. Abbreviations are defined in Fig. 1. The error bars represent the s.e. among n replicates (when n>1).
Basic models of weight–clustering relationships
To fully appreciate the particular weight–clustering organization shown in Figs 1 and 2, we first compare it with the case where weights are independent of any topological features. Therefore, the correlation RCL is zero and ΔCL shows no trend with respect to link rank. We show analytically in Methods that for independent weights ΔC decreases linearly for either pruning direction from the initial value,ΔC0, to zero, namely ΔC(f )=ΔC0(1–f ), and consequently M = 0. Indeed, in simulations for the directed Ozik–Hunt–Ott growing network (OHO (ref. 32); see Supplementary Information) and Watts–Newman (WN; ref. 33) network with randomly assigned weights, ΔCL is flat and ΔC decays linearly to zero for both top-pruning and bottom-pruning (Fig. 3a).
Figure 3. Link clustering and pruning analysis for neutral, dispersive, and integrative weight organizations.

Simulations are shown for OHO and WN topologies (n=10 networks, each with N=100; 〈k〉=12,10 for OHO, WN respectively; see Supplementary Table S1). a, Example of neutral weight organization with randomly assigned link weights w (independent of the topology). Left: ΔCL shows no trend versus weight rank. Right: ΔC decreases linearly with f for bottom-pruning (solid line) and top-pruning (broken line). b, In networks with dispersive weight organization, here implemented according to equation (1), ΔCL is highest for weak links and ΔC is robust only for top-pruning. c, In networks with integrative weight organization, here implemented using equation (2), ΔCL is highest for strong links and ΔC is robust only for bottom-pruning. The error bars represent the s.e. among n replicates.
Next, we compare our results with so-called Class II networks19, in which weights are positively correlated with node degrees. An example is the global airline network18, for which the link weights are related to the end node
| (1) |
with θ = 0.5 ± 0.1. Implementing equation (1) in OHO and WN topologies results in networks which are robust to the loss of their strongest but not weakest links, and in which traffic occurs preferentially between non-overlapping neighbourhoods (Fig. 3b). Thus, ΔCL decreases with higher w, RCL is negative, and ΔC remains high for top-pruning but not for bottom-pruning, yielding negative M.
To study further the local interaction of clustering and weights in integrative networks, we create a weighting model in which the link weights are proportional to the product of the clustering coefficients Ci and Cj of its end nodes
| (2) |
Its implementation on OHO and WN topologies leads to integrative networks, with positive RCL and ΔC, that are robust for bottom-pruning but not top-pruning, as observed in brain, gene and human networks (Fig. 3c; see Supplementary Figs S4 and S5 for additional details).
Figure 4 summarizes the findings for RCL and M for natural networks as well as the three weight models. In general, we find that if RCL >0 then M >0, and vice versa, thus values concentrate in the upper right quadrant for integrative networks and the lower left quadrant for dispersive networks; neutral networks occupy the area near the origin. This reflects the intuitive understanding that networks in which strong links are clustered should be more robust in their general clustering properties against the loss of their weak links, and vice versa. In principle, such robustness can take many forms, but our analysis shows that many of the strongly integrative real networks are actually invariant in their clustering against a large (> 90%) loss of their weakest links, that is, they have high M. This property should provide these networks with considerable freedom in reorganizing their weak links without loss in functionality (see below). We also note that the scatter within each quadrant is substantial, as quantified by the relatively low correlation for integrative (R = 0.54) and dispersive (R=0.35) weight organization. This concentration on two quadrants and high variability within quadrants is also found when using incoming links or all links to define the node neighbourhood (Supplementary Fig. S6a).
Figure 4. Summary plot of M versus RCL for all the networks analysed in the present study.

Brain, gene, social and language networks are integrative, with brain and gene networks exhibiting among the highest positive values of M and RCL. We note that only models OHO II and GM1 achieve high dispersive characteristics, whereas natural networks such as airline and collaboration networks range from weakly dispersive to neutral. For further description of the simulated networks see the main text.
Strength of the weak links is their randomness
Granovetter’s work on the ‘strength of weak ties’24 and recent work on mobile phone communication26 demonstrate that weak links serve a cohesive function in complex networks more than strong links23. This could reflect a specific, targeted organization for weak links that is missed by our definition of integrative, neutral and dispersive networks. To quantify the cohesiveness of the network and its dependence on link weight, we study the reduction in the relative giant component, rGC, during bottom-pruning and top-pruning for our real networks in Fig. 1. To test whether the observed cohesiveness arises from targeted weight organization, we compare the change in rGC for both pruning directions with that obtained when pruning links randomly. In Fig. 5a, we show for the fMRI brain and human gene 1 networks that removal of weak links (bottom-pruning) reduces rGC faster than random controls, in line with the targeted, non-random organization of strong links outlined in the previous sections. In contrast, the change in rGC when pruning from the top does not differ much from random removal of links. We quantify the area between the random control and each pruning direction and show that these findings are true for most integrative networks (Fig. 5b) and were also observed recently for financial networks31. We conclude that the cohesive character of weak links in most real-world networks simply reflects their random nature, rather than targeted placement, further supporting our emphasis on weight organization based on strong links.
Figure 5. The cohesive nature of weak links is grounded in their random organization.
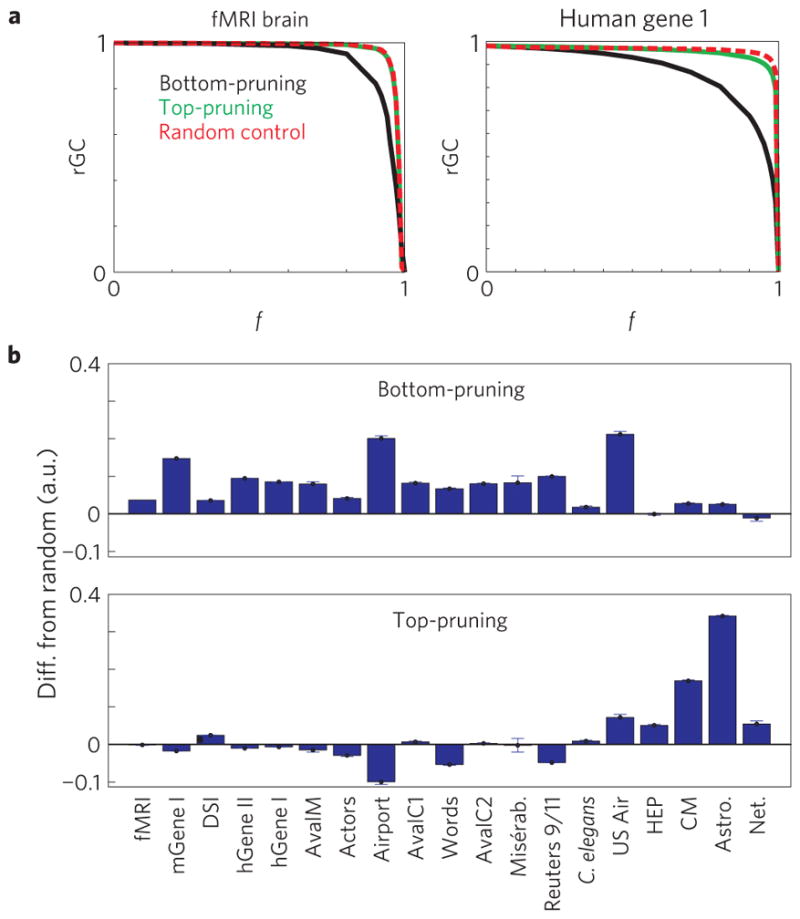
a, The relative giant component, rGC, in fMRI brain and human gene 1 networks decays faster for top-pruning than for randomized weight controls. In contrast, rGC changes similarly to randomized weight controls for top-pruning. b, Summary plots of the difference in the area under the curve of rGC for bottom-pruning and top-pruning compared against randomized weight controls for all real-world networks. The small difference for integrative networks with top-pruning indicates random organization of weak links. Conversely, the large difference for bottom-pruning indicates targeted, non-random organization of strong links. The error bars represent the s.e. among n=10 replicates.
Local learning rules create integrative networks
Highly clustered neighbourhoods with strong links, as found in integrative networks, are known to trap the flow of information26, hence the ‘strength of weak’ ties in increasing global efficiency in communication23,24. Integrative networks can potentially alleviate such neighbourhood trapping without relying on the random organization for weak links, because having strong links in such clustered neighbourhoods can only increase a chance of escape. We demonstrate this using a dynamical model in which local learning rules adaptively change weights in response to past traffic. Using an OHO topology with random weight assignments, traffic is initiated at a randomly selected node and directed probabilistically to future nodes with link weights linearly scaled into probabilities of node activation. This establishes a critical branching process dynamics in which one active node leads on average to one active node in the near future. These dynamics serve as a good model for the propagation of avalanche activity in brain networks or other stochastic traffic which neither grows exponentially nor terminates prematurely. Thus, sequences of activated nodes can span many cascading steps16, but nodes can only be active once within a cascade and remain refractory until the cascade ends. This behaviour is observed experimentally for neuronal avalanches in brain networks and, in general, restricts our exploration to non-cyclical network traffic. After each cascade, the weights of the links between nodes participating in successive time intervals, that is, cascading steps, are incremented according to different rules (see Methods).
In Fig. 6a we show that integrative networks robustly form when the weight increments are limited to the last step in a cascade. In Fig. 6c,d we plot the time progression of the parameters RCL and M during learning and show that this behaviour is observed independent of cascade length (solid coloured lines). In contrast, limiting learning to any particular pre-defined step beyond the very first link establishes dispersive networks, because longer cascades in networks with randomized weights will reflect the existing degree distribution (equation (1); Fig. 6b–d). Learning only at the first step, which follows the random initiation of cascades, maintains the initial, neutral weight organization (Fig. 6b–d).
Figure 6. Adaptive implementation of integrative and dispersive weight organization.

a, An initial random (that is, neutral) weight assignment (before) changes into integrative (after) during last step learning (106 cascades; OHO topology; N=60; n=5 realizations; see also Supplementary Table S1). b, Learning only at the first step (second step) results in neutral (dispersive) weight organization. c,d, Temporal progression of M and RCL during last-step learning (solid black), at any particular step conditional on it being also the last step (coloured solid), all-step learning (dashed black) and at any particular step (coloured dashed). Learning at every first through to fifth cascade step, if this step is also the last in the cascade, results in integrative networks. Learning at every first step (A1; red dashed) maintains neutral networks, whereas dispersive networks emerge for later steps (A2–A5). e, Last step learning enables cascades to break through the traffic traps that exist in clustered neighbourhoods during early stages of learning. Temporal progression of RC–TN for corresponding last, L1, . . . , L5 step learning in c–d. f, In dispersive networks clustered neighbourhoods continue to stall traffic throughout learning. The same key applies to all plots from c–f. Error bars indicate the s.e.
We study the learning of integrative and dispersive weight organization further by tracking the properties of the cascade termination nodes. As expected, initially, cascades tend to end in neighbourhoods of highly clustered nodes quantified by the high correlation between the clustering coefficient of a node and frequency of its participation in cascade termination, RC–TN (Fig. 6e). Importantly, the last-step learning, instead of exploring alternative routes in the network, directs more future traffic to failure sites by specifically increasing weights for links pointing to terminating nodes in highly clustered neighbourhoods. This eventually makes those nodes passable for traffic (Fig. 6e, arrowheads) while retaining the integrative weight organization (Fig. 6c–e). This improvement in flow is absent in dispersive networks, where clustered neighbourhoods remain cascade termination points throughout learning (Fig. 6f). This finding is extended to supercritical branching process dynamics, where one node on average activates more than one future node, whereas cascades in subcritical dynamics fail to reach clustered neighbourhoods sufficiently often (Fig. 4). Similar results are obtained using the WN network topology (data not shown).
Comparison with other weighted network models
We examined several network growth models (GM) with evolving weights. The first two models were originally introduced for networks with preferential attachment17,34,35 producing scale-free networks with no excess clustering. Thus, we apply the same weight assignment schemes to OHO growing network topologies to obtain a large ΔC. Neither network model shows integrative properties (Fig. 4; GM1 OHO, weights based on35, was dispersive; GM2 OHO, weights based on17,34, was neutral; see also Supplementary Fig. S7). A social network model36 with local weighting and growing rules motivated by social network dynamics and the results of Granovetter resulted in integrative weight organization, that is, positive RCL and M, for a wide range of model parameters (Fig. 4; SN; see Supplementary Information).
Discussion
Here we identify two important properties of weighted complex networks that are based on the interactions between the clustering and the weights. Earlier findings by Granovetter and others24,25 have related neighbourhood overlap to link weights between nodes in social networks, suggesting that the interaction between two people positively correlates with the number of the friends they share26. We extend its validity to other complex networks, in particular, biological and human interaction networks, using the relationship between weights and the link clustering, CL, but also find opposite behaviour in other networks (US Air transportation network, physics collaboration networks). Hence, on the basis of the local correlations between the clustering and weights, two types of networks can be distinguished, integrative and dispersive (Fig. 1b), which capture the targeted organization of strong links that emerges from a random network of weak links. Other local measures of clustering lead to a similar distinction, as demonstrated using the correlations of actual weights with the weighting model based on the clustering coefficient of nodes (see equation (2), Supplementary Fig. S9a). The division into integrative and dispersive networks requires that a common interpretation of weights is used for all networks, as any inverse transformation of weights would switch the classification. Here we presume that link weights quantify traffic, flow, intensity, or any other measure of increased communication or interaction between a pair of nodes.
We also find that integrative networks exhibit a high invariance of their clustering properties to the removal of weak links. A network with high M might have functional advantages during growth and development, as it allows the rewiring and dynamical exploration of new, weak connections37 without undermining the network’s functionality, which is embedded in the clustering of its strong links. For example, during cortex development, weak neuronal connections are constantly formed, removed or strengthened, depending on the activity that occurs between neurons. Integrative weight organization potentially enables neural systems to acquire new memories without detrimentally affecting the old ones stored in strong connections. We note that the integrative and robust weight organization depends primarily on the weighting model and cannot be explained by purely topological measures. We tabulated many of the topological properties of the observed networks, but none of them correlated significantly with high RCL or M. For example, there was no correlation between the assortativity and RCL or M (R=0.13 and R= −0.05, respectively) across all real-world networks.
The general question arises as to which degree a local integrative rule, measured by RCL, generates the desired global network characteristics, such as invariance to loss of weak links, measured by M, or the weighted measure of modularity Q (ref. 38). For the networks and simulations in this study, a positive correlation between RCL and Q was found (R=0.35, Supplementary Fig. S9b). Similarly, a recent social network model36 (Fig. 4; SN) yielded integrative weight organization with a positive correlation between RCL and Q. In the social network model, as well as in our study, moderate correlations were also found between RCL and M, further supporting the idea that local rules shape global network properties to some extent. On the other hand, the negative or weak correlation between RCL and M after the initial phase of last-step learning (Supplementary Fig. S8a) and social network growth (Supplementary Fig. S8b), and the demonstration of integrative weighting models that produce negative M (Supplementary Fig. S8c), further exemplifies the non-trivial relationship between RCL and M. It seems from the networks analysed in the present study that the local integrative property is a necessary, but not sufficient, condition for obtaining highly robust networks.
Our learning model demonstrates another benefit of integrative weight organization in that clustered neighbourhoods do not necessarily stall traffic or trap information flow, which supports efficient communication across the network. Integrative networks are established on the basis of activation history if adjustments are limited to the recent history, for example the last step of the propagation, which tags and removes information trapping. This ‘learning at the last step’ paradigm is similar to temporal difference reinforcement learning, a widely used learning algorithm in artificial intelligence which links sensory input to a desired action outcome39. In neuroscience, it bears great similarity to reward-mediated learning, in which the last step in a sequence of actions taken, that is, the nodes activated, is rewarded given the desired outcome40. Importantly, this learning rule does not require specific global information about the network despite dynamically reconfiguring the network as a function of recent activity.
The predominance of integrative weight organization in natural, complex networks seems to reflect a general local weighting principle that results in networks which maintain robust functionality and efficient communication while adapting their weights to changing environments.
Methods
Link clustering analysis
As the correlation RCL between w and CL is a linear measure, we also studied the trend of link clustering with respect to weight rank. Links ordered by their weight rank were block-averaged to obtain for the ith block, i=1,...,10. We similarly obtain 〈 〉 from degree sequence preserving randomized (DSPR; ref. 41) controls, which show no trend, and subtract this constant offset to obtain the average excess link clustering for each block, . Here, is the link clustering coefficient of the DSPR controls that corrects for the overlap contributed by the node degree distribution alone.
Pruning analysis
We studied network topology as a function of the fraction f of the weakest (bottom-pruning) or strongest (top-pruning) links removed. Thus, weights in our pruning analysis mainly serve as labels for link ordering, allowing for easier comparisons between different weighted networks, as any monotonic transformation of the weights does not affect our pruning results. The order of removal for links with identical weights was randomized.
We define the excess clustering as ΔC = C–CDSPR, where C and CDSPR are the average node clustering coefficients of the network and its randomized control, respectively. It corrects for the trivial appearance of clustering in finite-size networks and converges to C for very large, sparse networks. Many networks maintained high and approximately constant ΔC for a particular pruning direction, which we defined as robust excess clustering (REC) and quantified using the inverse of the coefficient of variation of the ΔC(f ) measured across ten values of f =[0,0.1,...,0.9]. To reduce large variations in the measure when the standard deviation (s.d.) is extremely small, we used a transformation which confines this measure to the range −1 to 1:
We calculated MREC for bottom-pruning ( ) and top-pruning ( ) profiles, ΔC(f ), and use their difference M to quantify the asymmetry in invariance
M is positive for networks that are more robust to bottom-pruning and negative for networks that are more robust to top-pruning.
To quantify the difference in the change of rGC, networks and controls were pruned until all links were removed. The area between the random removal curve and the top-pruning and bottom-pruning curves, respectively, was integrated. Positive and negative values indicate cohesiveness less than and greater than random, respectively.
Analytical results for independent weights
The pruning of a network in which link weights are independent of topology is equivalent to removing links randomly. On removal of the tth link, only the clustering coefficients of the nc common neighbours of its end nodes (Fig. 1a) are reduced, hence, the average clustering coefficient, Ct, changes according to
| (3) |
where zt is the average degree. In the continuous limit equation (3) becomes
| (4) |
Using the relationship nc (t )=(z(t )–1)C(t) in equation (4), we get
One can similarly obtain a differential equation for z(t ), of which the solution is
| (5) |
Using equation (5) in equation (4), we obtain
where t0 is the total number of links in the original network. The solution of this equation is
where f =t/t0 is the fraction of removed links. The excess clustering is a difference of two clustering coefficients, both decaying with the same rate 1–f, hence
Local learning rules
We study the weight organization resulting from dynamical learning which occurs during branching process dynamics16. We simulate a critical branching process on OHO and WN topologies initiated with uniform or random, but narrowly distributed weights (neutral). The weights, wij, are appropriately scaled to be interpreted as the critical branching process probabilities of the source node i activating the target node j (ref. 16). Before the next initiation, the scaling factor, which converts link weights into branching process probabilities, is adjusted such that the network dynamics remains critical. After
where pp (ranging from 0.01 to 1%) is a small percentage increase factor and wmax is the maximum weight allowed (5–500). Importantly, we restrict learning to particular successions (steps) in the following four ways: (1) learning only at a particular step (for example, first, second, . . . ); (2) learning at the last step of every cascade; (3) learning at a particular step, but only if it is also the last step and (4) learning at all steps without restriction. Only with learning restricted to the last steps (cases 2 and 3) does integrative behaviour occur and over a wide range of parameters until all weights eventually saturate to the maximal value wmax. Results are shown before significant weight saturation occurs. We quantify the termination of cascades by the frequency of the appearance of a particular node in the last time interval of a cascade, that is, it was a terminal node. We calculate the fraction, fTN, of all cascades in which a node was a terminal node and the correlation RC–TN between fTN and the clustering coefficient C across all nodes.
Supplementary Material
Acknowledgments
We thank M. Boguna and members of the Section on Critical Brain Dynamics, NIMH, NIH, for constructive comments during this work. We also thank S. Yu for providing some of the monkey data and J. Alstott for Matlab implementation of one of the social network models. This work was supported by the NIH Intramural Research Program of the NIMH and the DCB/CIT.
Footnotes
Author contributions
S.P. did analysis. S.P. and D.P. discussed, commented upon and wrote the manuscript.
The authors declare no competing financial interests.
Supplementary information accompanies this paper on www.nature.com/naturephysics.
References
- 1.Watts DJ, Strogatz SH. Collective dynamics of ‘small-world’ networks. Nature. 1998;393:440–442. doi: 10.1038/30918. [DOI] [PubMed] [Google Scholar]
- 2.Amaral LA, Scala A, Barthelemy M, Stanley HE. Classes of small-world networks. Proc Natl Acad Sci USA. 2000;97:11149–11152. doi: 10.1073/pnas.200327197. [DOI] [PMC free article] [PubMed] [Google Scholar]
- 3.Dorogovtsev SN, Mendes JFF. Evolution of Networks: From Biological Nets to the Internet and WWW. University Press; 2003. [Google Scholar]
- 4.Strogatz SH. Exploring complex networks. Nature. 2001;410:268–276. doi: 10.1038/35065725. [DOI] [PubMed] [Google Scholar]
- 5.Latora V, Marchiori M. Efficient behavior of small-world networks. Phys Rev Lett. 2001;87:198701. doi: 10.1103/PhysRevLett.87.198701. [DOI] [PubMed] [Google Scholar]
- 6.Petermann T, De Los RP. Physical realizability of small-world networks. Phys Rev E. 2006;73:026114. doi: 10.1103/PhysRevE.73.026114. [DOI] [PubMed] [Google Scholar]
- 7.Achard S, Bullmore E. Efficiency and cost of economical brain functional networks. PLoS Comput Biol. 2007;3:e17. doi: 10.1371/journal.pcbi.0030017. [DOI] [PMC free article] [PubMed] [Google Scholar]
- 8.Yu S, Huang D, Singer W, Nikolic D. A small world of neuronal synchrony. Cereb Cortex. 2008;18:2891–2901. doi: 10.1093/cercor/bhn047. [DOI] [PMC free article] [PubMed] [Google Scholar]
- 9.Hagmann P, et al. Mapping the structural core of human cerebral cortex. PLoS Biol. 2008;6:e159. doi: 10.1371/journal.pbio.0060159. [DOI] [PMC free article] [PubMed] [Google Scholar]
- 10.Sporns O, Honey CJ. Small worlds inside big brains. Proc Natl Acad Sci USA. 2006;103:19219–19220. doi: 10.1073/pnas.0609523103. [DOI] [PMC free article] [PubMed] [Google Scholar]
- 11.Sporns O. Small-world connectivity, motif composition, and complexity of fractal neuronal connections. Biosystems. 2006;85:55–64. doi: 10.1016/j.biosystems.2006.02.008. [DOI] [PubMed] [Google Scholar]
- 12.Eguiluz VM, Chialvo DR, Cecchi GA, Baliki M, Apkarian AV. Scale-free brain functional networks. Phys Rev Lett. 2005;94:018102. doi: 10.1103/PhysRevLett.94.018102. [DOI] [PubMed] [Google Scholar]
- 13.Bassett DS, Meyer-Lindenberg A, Achard S, Duke T, Bullmore E. Adaptive reconfiguration of fractal small-world human brain functional networks. Proc Natl Acad Sci USA. 2006;103:19518–19523. doi: 10.1073/pnas.0606005103. [DOI] [PMC free article] [PubMed] [Google Scholar]
- 14.Beggs JM, Plenz D. Neuronal avalanches in neocortical circuits. J Neurosci. 2003;23:11167–11177. doi: 10.1523/JNEUROSCI.23-35-11167.2003. [DOI] [PMC free article] [PubMed] [Google Scholar]
- 15.Petermann T, et al. Spontaneous cortical activity in awake monkeys composed of neuronal avalanches. Proc Natl Acad Sci USA. 2009;106:15921–15926. doi: 10.1073/pnas.0904089106. [DOI] [PMC free article] [PubMed] [Google Scholar]
- 16.Pajevic S, Plenz D. Efficient network reconstruction from dynamical cascades identifies small-world topology from neuronal avalanches. PLoS Comput Biol. 2008;5:e1000271. doi: 10.1371/journal.pcbi.1000271. [DOI] [PMC free article] [PubMed] [Google Scholar]
- 17.Barrat A, Barthelemy M, Vespignani A. Weighted evolving networks: Coupling topology and weight dynamics. Phys Rev Lett. 2004;92:228701. doi: 10.1103/PhysRevLett.92.228701. [DOI] [PubMed] [Google Scholar]
- 18.Barrat A, Barthelemy M, Pastor-Satorras R, Vespignani A. The architecture of complex weighted networks. Proc Natl Acad Sci USA. 2004;101:3747–3752. doi: 10.1073/pnas.0400087101. [DOI] [PMC free article] [PubMed] [Google Scholar]
- 19.Bianconi G. Emergence of weight-topology correlations in complex scale-free networks. Europhys Lett. 2005;71:1029–1035. [Google Scholar]
- 20.Serrano MA, Boguna M, Pastor-Satorras R. Correlations in weighted networks. Phys Rev E. 2006;74:055101. doi: 10.1103/PhysRevE.74.055101. [DOI] [PubMed] [Google Scholar]
- 21.Restrepo JG, Ott E, Hunt BR. Weighted percolation on directed networks. Phys Rev Lett. 2008;100:058701. doi: 10.1103/PhysRevLett.100.058701. [DOI] [PubMed] [Google Scholar]
- 22.Restrepo JG, Ott E, Hunt BR. Characterizing the dynamical importance of network nodes and links. Phys Rev Lett. 2006;97:094102. doi: 10.1103/PhysRevLett.97.094102. [DOI] [PubMed] [Google Scholar]
- 23.Csermely P. Weak Links: The Universal Key to the Stability of Networks and Complex Systems. Springer; 2006. [Google Scholar]
- 24.Granovetter MS. The strength of weak ties. Am J Soc. 1973;78:1360–1380. [Google Scholar]
- 25.Davis J. Clustering and structural balance in graphs. Hum Relations. 1967;20:181–187. [Google Scholar]
- 26.Onnela JP, et al. Structure and tie strengths in mobile communication networks. Proc Natl Acad Sci USA. 2007;104:7332–7336. doi: 10.1073/pnas.0610245104. [DOI] [PMC free article] [PubMed] [Google Scholar]
- 27.Radicchi F, Castellano C, Cecconi F, Loreto V, Parisi D. Defining and identifying communities in networks. Proc Natl Acad Sci USA. 2004;101:2658–2663. doi: 10.1073/pnas.0400054101. [DOI] [PMC free article] [PubMed] [Google Scholar]
- 28.Serrano MA, Boguna M. Clustering in complex networks. I General formalism Phys Rev E. 2006;74:056114. doi: 10.1103/PhysRevE.74.056114. [DOI] [PubMed] [Google Scholar]
- 29.Gregoretti F, Belcastro V, di Bernardo D, Oliva G. A parallel implementation of the network identification by multiple regression (NIR) algorithm to reverse-engineer regulatory gene networks. PLoS ONE. 2010;5:e10179. doi: 10.1371/journal.pone.0010179. [DOI] [PMC free article] [PubMed] [Google Scholar]
- 30.Albert R, Jeong H, Barabasi AL. Error and attack tolerance of complex networks. Nature. 2000;406:378–382. doi: 10.1038/35019019. [DOI] [PubMed] [Google Scholar]
- 31.Garas A, Argyrakis P, Shavlin S. The structural role of weak and strong links in a financial market network. Eur Phys J B. 2008;63:265–271. [Google Scholar]
- 32.Ozik J, Hunt BR, Ott E. Growing networks with geographical attachment preference: Emergence of small worlds. Phys Rev E. 2004;69:026108. doi: 10.1103/PhysRevE.69.026108. [DOI] [PubMed] [Google Scholar]
- 33.Newman ME, Watts DJ. Scaling and percolation in the small-world network model. Phys Rev E. 1999;60:7332–7342. doi: 10.1103/physreve.60.7332. [DOI] [PubMed] [Google Scholar]
- 34.Barrat A, Barthelemy M, Vespignani A. Modeling the evolution of weighted networks. Phys Rev E. 2004;70:066149. doi: 10.1103/PhysRevE.70.066149. [DOI] [PubMed] [Google Scholar]
- 35.Yook SH, Jeong H, Barabasi AL, Tu Y. Weighted evolving networks. Phys Rev Lett. 2001;86:5835–5838. doi: 10.1103/PhysRevLett.86.5835. [DOI] [PubMed] [Google Scholar]
- 36.Kumpula JM, Onnela JP, Saramaki J, Kaski K, Kertesz J. Emergence of communities in weighted networks. Phys Rev Lett. 2007;99:228701. doi: 10.1103/PhysRevLett.99.228701. [DOI] [PubMed] [Google Scholar]
- 37.Wang S, Szalay MS, Zhang C, Csermely P. Learning and innovative elements of strategy adoption rules expand cooperative network topologies. PLoS ONE. 2008;3:e1917. doi: 10.1371/journal.pone.0001917. [DOI] [PMC free article] [PubMed] [Google Scholar]
- 38.Girvan M, Newman ME. Community structure in social and biological networks. Proc Natl Acad Sci USA. 2002;99:7821–7826. doi: 10.1073/pnas.122653799. [DOI] [PMC free article] [PubMed] [Google Scholar]
- 39.Sutton RS, Barto AG. Reinforcement Learning: An Introduction. MIT Press; 1998. [Google Scholar]
- 40.Schultz W, Dayan P, Montague PR. A neural substrate of prediction and reward. Science. 1997;275:1593–1599. doi: 10.1126/science.275.5306.1593. [DOI] [PubMed] [Google Scholar]
- 41.Maslov S, Sneppen K. Specificity and stability in topology of protein networks. Science. 2002;296:910–913. doi: 10.1126/science.1065103. [DOI] [PubMed] [Google Scholar]
Associated Data
This section collects any data citations, data availability statements, or supplementary materials included in this article.