

Abstract
While non-linear peptide natural products such as Vancomycin and Daptomycin are among the most effective antibiotics, the computational techniques for sequencing such peptides are still in their infancy. Previous methods for sequencing peptide natural products are based on Nuclear Magnetic Resonance spectroscopy and require large amounts (milligrams) of purified materials. Recently, development of mass spectrometry-based methods has enabled accurate sequencing of non-linear peptide natural products using picograms of material, but the question of evaluating statistical significance of Peptide Spectrum Matches (PSM) for these peptides remains open. Moreover, it is unclear how to decide whether a given spectrum is produced by a linear, cyclic, or branch-cyclic peptide. Surprisingly, all previous mass spectrometry studies overlooked the fact that a very similar problem has been successfully addressed in particle physics in 1951. In this paper, we develop a method for estimating statistical significance of PSMs defined by any peptide (including linear and non-linear). This method enables us to identify whether a peptide is linear, cyclic or branch-cyclic, an important step toward identification of peptide natural products.
Keywords: Mass Spectrometry, Natural Products, Statistical Significance
Graphical Abstract
Introduction
The dominant technique for sequencing cyclic peptides is nuclear magnetic resonance (NMR) spectroscopy, which requires large amount (milligrams) of highly purified materials that are often nearly impossible to obtain.1 Tandem mass spectrometry (MS/MS) provides an attractive alternative to NMR because it allows one to sequence a peptide from picograms of non-purified material. Recently, new algorithms have been developed for interpreting mass spectra of cyclic peptides using de novo sequencing2–4 and database search.5
MS/MS coupled with database search is the most popular method for identification of (linear) peptides. A database search engine selects candidate peptides from a database of protein sequences that match the precursor mass from a mass spectrum. Then for each candidate peptide, the software compares a theoretical MS/MS derived from the peptide to the experimental mass spectrum, and reports a peptide with best score.
In the last decade, much effort has been invested in computing statistical significance of Peptide Spectrum Matches (PSMs). Many of these studies stem from the pioneering paper by Fenyo and Beavis6 that proposed approximating the statistical significance of PSMs by first modeling the distribution of PSM scores (e.g. by Gumbel distribution6) and further using this distribution to compute p-values.7–13 Unfortunately, this approximation approach, while useful in many applications, often fails when one has to estimate extremely small p-values typical for mass spectrometry (e.g. PSM p-values of the order 10−10 are often required to achieve 1% FDR14). Fortunately, the challenge of estimating the probability of extremely rare events has already been addressed by particle physicists in 1950s,15 and communication systems engineers in 1980s.16 However, the mass spectrometry community has overlooked these fundamental studies (directly relevant to mass spectrometry) resulting in inaccurate p-value estimation in some mass spectrometry studies.17
In the late 1940s, many top mathematicians worked on the neutron shielding problem that was crucial for designing nuclear facilities.18,19 In this problem, one has to compute the probability that a neutron, doing a random walk, would pass through a slab, an extremely rare event. Two general methods emerged for evaluating extremely rare events by Monte Carlo random sampling (using computers that became available in mid 1940s); importance sampling and multilevel splitting. Both were developed for nuclear-physics calculations by Fermi, Harris, Kahn, Metropolis, Ulam, von Neumann, and their colleagues, during the production of the first nuclear bomb.15,18–21 Importance sampling is based on the notion of modifying the underlying probability distribution in such a way that the rare events occur much more frequently. Multilevel splitting uses a selection mechanism to favor the trajectories deemed likely to lead to the rare events of interest. While importance sampling is the most popular rare event simulation method today, the main advantage of the multilevel splitting approach is the fact that it does not need to modify the probabilistic model governing the system. This makes multilevel splitting applicable to any system represented as a black box,19 and specifically applicable to mass spectrometry studies. Kahn and Harris solved the neutron shielding problem using multilevel splitting in 1951.15 Later, similar rare event estimation techniques found applications in communication systems,16 financial mathematics,22 air traffic management,23 and chemistry.24 However, this powerful approach has never been applied to mass spectrometry. This is surprising because there is a clear analogy between statistical significance evaluation in mass spectrometry, and the neutron shielding problem, where a spectrum plays the role of a neutron, a peptide plays the role of a slab, and the rare event “spectrum gets a high score against a peptide” plays the role of an event “neutron passes through a slab”.
Currently, the dominant technique for statistical evaluation of a set of PSMs is to compute the False Discovery Rate (FDR) using the Target Decoy Approach (TDA).25 TDA is attractive for proteomics studies because it is widely applicable to different instrument platforms and database search algorithms. However, TDA is not applicable to non-linear peptide studies, because in these studies researchers usually work on a few non-linear peptide at a time, whereas TDA is best suited for statistical analysis of large spectral datasets.25 Even in the case of linear peptides, some popular database search tools are not TDA-compliant.26
An alternative technique is to compute a p-value for an individual PSM.17 Given a PSM (Peptide, Spectrum) of score t, the p-value of (Peptide, Spectrum) is defined as the fraction of random peptides with a score equal to or exceeding t.17 Unlike the FDR that is defined on a set of PSMs, the p-value is defined on a single PSM. Therefore computing the p-value is adequate for non-linear peptide studies, where a single or a few non-linear peptides are considered at a time. Since our results can be applied to both cyclic peptides (e.g. surfactin) and branch-cyclic peptides (e.g. daptomycin), we will use the same term ‘cyclic’ to refer to both cyclic and branch-cyclic peptides.
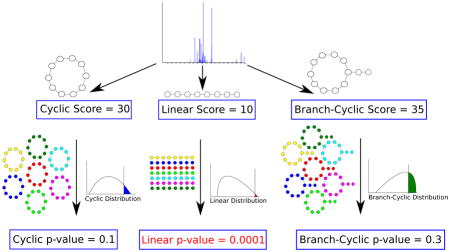
For cyclic peptide studies, computing p-values offers additional advantages. In studies of peptide natural products, we are given a mixture of spectra of linear and cyclic peptides, from which a small number of spectra of cyclic peptides should be separated and investigated independently. Therefore we need a method that identifies whether a given spectrum represents a linear or a cyclic peptide. This is difficult because different scoring functions are used for linear and cyclic peptides. Since scores from different scoring functions are not usually comparable,27,28 we need to convert them into p-values (Fig. 1).26
Figure 1.

Deciding whether a peptide that produced a spectrum is linear, cyclic or branch-cyclic. Given a spectrum with unknown structure, we compute its score under different structure assumptions (e.g. linear/cyclic/branch-cyclic), and derive a p-value for each assumption. If one of the structures result in a very small p-value (e.g. linear structure with p-value of 0.0001), that structure is accepted as the most likely structure.
In the case of linear peptides, Kim et al., 200817 presented a polynomial time algorithm for computing p-values, called MS-GF. However, MS-GF is only applicable to scoring functions that can be represented as a dot-product of vectors, i.e. additive scoring functions. Moreover, MS-GF is only applicable to linear peptides, and no one has generalized MS-GF to non-linear peptides yet.
Fenyo and Beavis6 constructed an empirical score distribution of low-scoring (erroneous) peptide identifications and extrapolated it to evaluate the p-value of high-scoring peptide identifications in the tail of the distribution. Similar approaches are now used in many tools, that provide p-value or E-value of individual PSMs, e.g. OMSSA.29 However, this approach was demonstrated to be inaccurate.17 While the pitfalls of such approaches are well recognized in genomics, they remain under-appreciated in proteomics. Waterman and Vingron30 argued that it is difficult to accurately estimate the extreme tails of a distribution in general, requiring accurate estimation of rare event probability. To do so, one may consider estimating p-values by a Monte-Carlo simulation generating a population of millions of peptides and estimating the probability distribution of scores on this population.31 This approach becomes time-consuming for estimating extremely low p-values, since it requires calculating scores of billions of randomly generated peptides for accurate estimation of p-values as low as 1 in a billion.
In this paper, we propose MS-DPR (MS-Direct Probability Redistribution), a new method for estimating p-values of PSMs based on rare event probability estimation by multilevel splitting. We show that MS-DPR reports p-values similar to those reported by MS-GF in the case of linear peptides, confirming that it accurately estimates p-values. Furthermore, we show that unlike MS-GF, MS-DPR can compute p-values of PSMs when an arbitrary (non-additive) scoring function is used or when the peptide is non-linear.
Materials and Method
In contrast to importance sampling, which changes the probability laws driving the model, multilevel splitting15,20 constructs a Markov chain and uses a selection mechanism to favor the trajectories in the Markov chain deemed likely to lead to rare events. Multilevel splitting is composed of three steps. First, decompose the trajectories to the rare events of interest into shorter sub-trajectories whose probability is not so small. Second, encourage the realizations that take these sub-trajectories (leading to the events of interest) by giving them a chance to reproduce by introducing reproduction probabilities. Third, discourage the realizations that go in the wrong direction by killing them with some positive killing probability. The sub-trajectories are usually delimited by levels. Starting from a given level, the trajectories that do not reach the next level will not reach the rare event, but those that do will split into multiple copies when they reach the next level. Each copy pursues its evolution independently from then on. This creates an artificial drift toward the rare event by favoring the trajectories that go in the right direction. In the end, an unbiased estimator can be recovered by multiplying the contribution of each trajectory by the appropriate weight.15
While multilevel splitting has wide applicability across diverse fields, it is not clear how to select the reproduction and killing probabilities, and the number of offsprings in mass spectrometry applications. Inspired by Kahn and Harris15 and proposed by Haraszti and Townsend,32 Direct Probability Redistribution (DPR) is a realization of multilevel splitting for estimating the probability of rare states in a Markov chain. Given a Markov chain, DPR implicitly constructs a modified Markov chain where probabilities of states are increased by an arbitrary order of magnitude. For a Markov chain with n states and (unknown) equilibrium probabilities p1, ⋯, pn, given oversampling factors μ1, ⋯, μn, DPR constructs a Markov chain with (unknown) equilibrium probability . For example, take a two-state Markov chain with equilibrium probabilities p1 = 0.999 and p2 = 0.001. If we choose μ1 = 1 and μ2 = 999, we end up with equilibrium probability and , illustrated in Fig. 2(A–B). If one decides to estimate probability distribution of Fig. 2(A) by Monte Carlo, thousands of simulations are required (since p2 = 0.001 is small). However, if one tries to estimate probability distribution of Fig. 2(B), only a few simulations are sufficient (since p1 = p2 = 0.5 is not small). This contrast in the number of simulations is the key idea of DPR. Here we descibe how to apply DPR to the problem of estimating probability distribution of PSM scores.
Figure 2.

A) Markov chain before performing DPR, with equilibrium probabilities (0.999,0.001). B) Markov chain after performing DPR, with equilibrium probabilities (0.5,0.5). C) An example of a Markov chain with nine peptides in three score states D) Probability distribution after performing DPR with oversampling factors (μ1,μ2,μ3) = (1, 2,3). The states with decrease in probability are shown in blue, and the states with increase in probability are shown in red.
For simplicity, we define a spectrum as a set of integer masses. A peptide of length k is defined as a string of k positive integers Peptide = m1m2 ⋯ mk. The mass of the peptide is defined as the sum of all the integers in the string. A score of a PSM (Peptide, Spectrum) is denoted by Score(Peptide, Spectrum). Note that the proposed algorithm works for an arbitrary set of amino acid alphabets, not only for the alphabet of 20 standard amino acids. Since nonribosomal peptides often contain non-standard amino acids, in this section we consider peptides in the alphabet of all integers. In the Result section we also consider the case of the standard 20 amino acid alphabet.
Note that while a linear peptide of length k has a unique representation m1, ⋯, mk, a cyclic peptide of length k can have up to k equivalent represantations. For example, peptide (3,7,1) could also be presented as (7,1,3) and (1,3,7). One can choose an arbitrary representation among these representations, e.g., the representation where the first residue has minimum mass.
Given Peptide = (m1, ⋯, mi, mi+1, ⋯, mk), integer residue index 1 ≤ i ≤ k, and integer mass −mi < δ < mi+1, we define Peptide(i,δ) as a peptide (m1, ⋯, mi + δ, mi+1 − δ, ⋯, mk). These peptides are called sister peptides. Note that sister peptides have equal lengths and equal (parent) masses, and all amino acids masses but at most two are the same (see Fig. 3(A)). Note that there are many alternative ways to define the notion of a sister peptide. RandomTransition(Peptide) is a Peptide(i,δ), where i and δ are integer random variables, i chosen from the uniform distribution on [1, k], and δ chosen from the uniform distribution on [−mi, mi+1]. Supplementary Material discusses the conditions on a RandomTransition that are needed for MS-DPR to work properly. We define PeptideSpace as the set of all peptides with length k and mass m. Consider the following Markov chain defined on PeptideSpace:
Figure 3.

A) Illustration of all sister peptides (1,3,3), (1,1,5) and (2,2,3) for the cyclic peptide (1,2,4). B) Illustration of the Markov chain for cyclic peptides of length 3 and mass 7. We have total of four different cyclic peptides, (1,1,5), (1,2,4), (1,3,3), and (2,2,3). Each random mutation is determined by selecting i (three cases), and δ (four cases), giving rise to a total of twelve equiprobable mutations. Transition probabilities between different states of the Markov chain, derived from the uniform mutation probabilities (1/12), are also shown for each edge in the Markov chain.
where Peptide0 is chosen from PeptideSpace with uniform distribution. Then the problem of finding probability distribution of all scores of peptides from PeptideSpace against Spectrum is equivalent to finding equilibrium distribution of the above Markov chain. We use the DPR technique to accurately estimate the total probability of all peptides with high scores (rare events) in this Markov chain. Figure 3(B) illustrates this Markov chain.
Assume the set of all feasible scores (called score states) is ScoreSpace = {1,…,n}, with (unknown) probabilities p1, ⋯, pn. Assume arbitrary oversampling factors μ1, ⋯,μn are given. Then the DPR approach provides a way to modify the transition probabilities such that in the equilibrium distribution of the resulting Markov chain, the probability of states with score i are oversampled by a factor μi, i.e. . An example of this procedure is shown in Fig. 2(C–D). Figure 4(A) shows the MS-DPR algorithm, which is a modification of the original DPR algorithm.32 Glasserman et. al., 1998,33 show that the optimal choice of μ1, ⋯,μn (with respect to reducing the number of trials to achieve the required accuracy for estimation of score distribution) is the one that makes all score states equiprobable, i.e. (μ1, ⋯, μn) = (1/p1, ⋯ 1/pn). However, since in practice p1, ⋯, pn are unknown beforehand, one needs their rough estimate to efficiently implement DPR. Our idea is to first run the algorithm with μ1 = ⋯ = μn = 1, and obtain a rough estimate of p1, ⋯, pn. Then we choose μk = 1/pk in the next iteration. This procedure is summarized in Fig. 4(B).
Figure 4.

(A) MS-DPR-Iteration(μ1, ⋯,μn) algorithm32 adapted for estimating statistical significance of PSMs. The algorithm produces peptide process Peptide0, Peptide1, ⋯, PeptideN, and their scores Score(Peptide0), Score(Peptide1), ⋯, Score(PeptideN), with equilibrium probability distribution satisfying for a constant c. (*) Most of the times μScore(Peptide′)/μScore(Peptide) is not integer. In that case Y would be a random variable, taking ⌈μScore(Peptide′)/μScore(Peptide)⌉ with probability p = μScore(Peptide′)/μScore(Peptide) − ⌊μScore(Peptide′)/μScore(Peptide)⌋ and ⌊μScore(Peptide′)/μScore(Peptide)⌋ with probability 1 − p. Note that in case of μ1 = ⋯ = μn = 1, this reduces to simple Monte Carlo estimation of probability distribution from N peptides. (B) MS-DPR(K) algorithm for estimating the probability distribution of scores. (**) While MS-DPR uses the same global variables as MS-DPR-Iteration, these variables are omitted for brevity.
Results
We used the Standard Protein Mix database consisting of 1.1 million spectra generated from 18 proteins using eight different mass spectrometers.34 For this study, we considered the charge 2 spectra generated by Thermo Electron LTQ where 1,388 linear peptides of length between 7 and 20 are identified with false discovery rate 2.5% using Sequest35 and PeptideProphet36 in the search against the Haemophilus influenzae database appended with sequences of the 18 proteins (567,460 residues). For testing MS-DPR on cyclic peptides, we use the dataset from the Cycloquest paper,5 that includes cyclopeptides SFTI-1 and SFT-L1 from Helianthus annuus, as well as a linear and a cyclic peptide, SDP and SKF, from Bacillus subtilits.
To apply MS-DPR, we first need to define scoring functions for linear and cyclic peptides. Linear theoretical spectrum of a peptide Peptide = (m1, ⋯, mk), LinearSpectrum(Peptide), is a set of k − 1 b-ions and k − 1 y-ions, where each b-ion is the mass of a prefix of the peptide plus rounded H+ mass, m1 + ⋯ + mj−1 + 1, and each y-ion is the mass of a suffix of the peptide plus rounded H+ and H2O mass, mj + ⋯ + mk + 19. Similarly to the Cycloquest paper, 5 The cyclic theoretical spectrum of the peptide, CyclicSpectrum(Peptide), is defined as the set of masses of its k(k − 1) substrings of the peptide, mi + ⋯ + mj−1 (mi + ⋯ + mk + m1 + ⋯ + mj−1, if i ≥ j), illustrated in Fig. 5(A). For branch-cyclic peptide Peptide, BranchCyclicSpectrum(Peptide) is defined as the union of LinearSpectrum(Peptidel) and CyclicSpectrum(Peptidec), where Peptidel is the linear part of Peptide with cyclic tail assumed as a modification, and Peptidec is the cyclic part of Peptide with the linear tail assumed as a modification, illustrated in Fig. 5(B).
Figure 5.

(A) Illustration of CyclicSpectrum(Tyrocidine). (B) Illustration of BranchCyclicSpectrum(Daptomycin).
Similarly to the Cycloquest paper,5 CyclicScore(Peptide, Spectrum) and BranchCyclicScore(Peptide, Spectrum) are defined as the number of shared masses between Spectrum with CyclicSpectrum(Peptide) and BranchCyclicSpectrum(Peptide), respectively. For simplicity, score of linear peptide Peptide and a spectrum Spectrum, LinearScore(Peptide, Spectrum), is defined as the number of shared masses between Spectrum and LinearSpectrum(Peptide) (In our experiments we will also use advanced MS-GF scores for linear peptides). We emphasize that while we use the same “shared peak count” principle, the resulting scoring functions are very different in the case of linear, cyclic and branch-cyclic peptides.
In addition to the p-value computed by MS-DPR (denoted by pDPR), we also compute the empirical p-value (denoted by pE), using a Monte Carlo approach by generating millions (or even billions) of random peptides and estimating probability distribution. Moreover, pMS–GF stand for p-value of MS-GF software tool17 (with 20 standard amino acid assumption), while pGF stands for exact score probabilities computed by the generating function approach17 for the case of arbitrary masses of amino acids.
Figure 6 shows the evolution of μ and p in three iterations of MS-DPR. p = (p1, ⋯ pn) is the original probability distribution, is the modified probability distribution, and μ= (μ1, ⋯ μn) is the vector of oversampling factors. p′ converges to uniform distribution, and p converges to the correct distribution pGF.
Figure 6.

Evolution of (A) μk (B) pk for three iterations of MS-DPR. The analysis is performed for N = 1,000,000 simulated peptides of length 7, and a spectrum of peptide KYIPGTK from standard ISB database with parent mass 787. Blue, red and green plot stands for first, second, and third iterations respectively. In part (B) pGF is plotted by black. Note that the blue plot in part (B) corresponds to first iteration of MS-DPR, which simply gives the empirical p-value, pE. From the second iteration on, pDPR is very similar to pGF.
To evaluate the accuracy of the MS-DPR approach, we used all 1388 identifications from the ISB database. We compared pDPR and pGF (Fig. 7(A)), under the following assumptions: (i) all integers are considered as possible masses of amino acids (typical assumption for analyzing non-ribosomal peptides in the alphabet of arbitrary amino acid masses4), (ii) p-values are computed under the assumption that peptides have fixed known length, and (iii) the shared peak count is used as score. A correlation R2 = 0.9998 between the two p-values shows that our method accurately estimates the probability distribution. Fig. 7(B) shows the comparison with the p-values computed by actual MS-GF software tool for the case of the standard amino acids alphabet17 (correlation of 0.9990). These small deviations of MS-DPR from the theoretical value are acceptable, as the accuracy of a Monte Carlo algorithm depends on the number of simulations.
Figure 7.

(A) Comparison of −log10 of generating function p-value with MS-DPR p-value for 1388 peptides from ISB database. Red line shows the x = y line. Correlation between the two p-values is 0.9998. Non-standard amino acid model is used, assuming each peptide has a fixed known length, and peak count score. MS-GF approach17 is modified accordingly, to satisfy these assumptions. (B) Comparison of −log10 of the original, publicly available MS-GF p-value with MS-DPR p-value. Correlation between the two p-values is 0.9990. Standard amino acid model is used, with the variable peptide length assumption and MS-GF score. 17 (C) Comparison of −log10 of plin, versus −log10 of pcyc for SFTI-1, SFT-L2, SKF, SDP, and spectra from the ISB dataset. Cyclic peptides SFTI-1, SFT-L2 and SKF are shown as green stars, and linear peptide SDP is shown as a black star. Blue dots show spectra from ISB dataset, and red line shows the x = y line.
To validate MS-DPR for cyclic peptides, we designed the following experiment. For cyclic peptide Peptide = (10,20,40), and the spectrum Spectrum = CyclicSpectrum(Peptide) = (10,20,30,40,50,60,70), CyclicScore(Peptide, Spectrum) = 7. In this case we have total of peptides of length three with mass 70, and six of them (rotations and reverse rotations of (10,20,40)), have score 7. Therefore, the exact p-value for score 7 in this case is equal to , while MS-DPR returns 0.0021. Table 1 shows comparison of theoretical and estimated p-value for some cyclic PSM of variable length.
Table 1.
Comparison of theoretical p-value of cyclic PSM (Peptide,CyclicSpectrum(Peptide)), with the p-value estimated by MS-DPR with a million simulations.
| Peptide | score | theoretical p-value | pDPR |
|---|---|---|---|
| (10, 20, 40) | 7 | 0.0025 | 0.0021 |
| (10, 20, 40, 80) | 13 | 1.42e-05 | 1.35e-05 |
| (10, 20, 40, 80, 160) | 21 | 2.59e-08 | 2.49e-08 |
| (10, 20, 40, 80, 160, 320) | 31 | 1.45e-11 | 1.09e-11 |
| (10, 20, 40, 80, 160, 320, 640) | 43 | 2.40e-15 | 6.49e-15 |
| (10, 20, 40, 80, 160, 320, 640, 1280) | 57 | 1.15e-19 | 2.71e-20 |
To validate our approach for cyclic peptides and branch-cyclic peptides in practice, we compared pDPR and pE for Tyrocidine A and Daptomycin A21978C2 spectra. Tyrocidine A is a cyclic peptide with length 10 and mass 1269.7Da, and Daptomycin A21978C2 is a branch-cyclic peptide with length 14 and mass 1652.8Da. Three different scores are used: the CyclicScore, MultiStageCyclicScore defined in the multistage de novo sequencing paper,4 and BranchCyclicScore. Figure 8 demonstrates that these approaches produce similar results for probabilities higher than 10−6.
Figure 8.

(A) Estimating the score distribution for PSMs formed by the cyclic peptide Tyrocidine A (single-stage MS). Solid line shows the distribution of scores of 109 peptides that are randomly generated. The dots show the MS-DPR p-values. (B) Similar results for the MultiStage score defined in the multistage de novo sequencing paper, 4 for 107 peptides. Red dashed lines represent the scores of the correct peptide. The figure shows that MS-DPR p-values and empirical p-values are well correlated. Moreover, the p-value of the correct peptide is lower for multi-stage score (5e – 13) single-stage score (5e – 07), illustrating the advantage of multi-stage mass spectrometry. MS-DPR enables comparisons between arbitrary scoring functions. (C) Similar results for the score distribution for PSMs formed by the branch-cyclic peptide A21978C2 (single-stage MS).
To validate efficiency of MS-DPR in identifying whether a spectrum is from a linear, or a cyclic peptide, we compare each spectrum in our dataset against the corresponding proteome. Cycloquest,5 a database search for identification of linear and cyclic peptides from the mass spectra, is used for searching these peptides, and MS-DPR is used to re-rank top scoring PSMs given by Cycloquest. For Helianthus annuus, we used the EST database described in the Cycloquest paper,5 for B. subtilis we used the genome available from Uniprot, and for ISB dataset, we used the 18 protein sequences. By calculating p-values of all PSMs, the method correctly identifies SFTI-1 and SFT-L1 as cyclic peptides with lowest p-values. SDP and SKF are also identified as linear and cyclic peptides with lowest p-values (Table 2). Among 1388 linear peptides from ISB dataset, 1358 (97.8%) are correctly identified as linear peptides, and 99.6% of linear peptide identifications have identical sequences with the ones found by the InsPecT database search tool.37 Note that the standard ISB dataset does not contain any cyclic peptide, and all 31 cyclic PSMs are non-significant (p-values assigned are larger than 0.01). Lets define plin(Spectrum) as the p-value of the most statistically significant linear PSM of Spectrum, and pcyc(Spectrum) as the p-value of the most statistically significant cyclic PSM. Figure 7(C) shows plin versus pcyc for SFTI-1, SFT-L1, SKF, SDP and all spectra in ISB dataset. The figure shows that MS-DPR distinguishes cyclic peptides from their linear counterparts.
Table 2.
Top score reconstructions of three cyclic and one linear peptides from the Cycloquest paper (A) Top score reconstruction of SFT-L1 peptide from a singly charged ion-trap spectrum. Correct reconstructions are shown in bold. PME stands for Parent Mass Error. (B) Top score reconstruction of SFTI-1 peptide from a singly charged spectrum. (C) Top score reconstruction of SKF peptide from a triply charged ion-trap spectrum. (D) Top score reconstruction of linear SDP peptide from a triply charged ion-trap spectrum. Note that the previous version of Cycloquest 5 (that lacked the algorithm for computing p-values) was unable to identify SFTI-1.
| Peptide | score | p-value | PME | length | structure |
|---|---|---|---|---|---|
| GCIEGSPVCFPD | 49 | 5.2e-11 | 0.036 | 12 | cyclic |
| ICTQGNCQLEP | 13 | 1.5e-7 | 0.069 | 11 | linear |
| LNICCNVEVAQ | 11 | 9.9e-6 | 0.105:x:x | 11 | linear |
|
| |||||
| GRCTKSIPPICFPD | 42 | 1.7e-7 | 0.024 | 14 | cyclic |
| ICKQRVACWKNKG | 36 | 8.7e-7 | 0.083 | 13 | cyclic |
| KKCQKEVIENVCL | 35 | 2.2e-6 | 0.082 | 13 | cyclic |
| PSTHCWHHGMTHC | 35 | 2.2e-6 | -0.137 | 13 | cyclic |
| PPMTTQCNICSFSS | 10 | 0.00017 | -0.092 | 14 | linear |
|
| |||||
| CMGCWASKSIAMTRVCALPHPAMRAI | 167 | 1.7e-15 | 0.007 | 26 | cyclic |
| GERTKVAGVKEANKENVKAWLKD | 120 | 7.9e-12 | -0.055 | 23 | cyclic |
| ESLLKAVRSLEADVYHLELKDAA | 119 | 1.1e-11 | -0.077 | 23 | cyclic |
| KEDAEKRVKSNLTLEAIAKAENL | 119 | 1.1e-11 | -0.045 | 23 | cyclic |
| LGVLFIWLVAASIIKWRRFTY | 16 | 6.6e-06 | 0.040 | 21 | linear |
|
| |||||
| CGLYAVCVAAGYLYVVGVNAVALQTAAAVTTAVWKYVAKYSS | 39 | 9.1e-15 | 0.24 | 42 | linear |
| CLLHDPKVLILDEPTNGLDPAGIREIRDHLKKLTRERG | 180 | 3.4e-6 | 0.37 | 38 | cyclic |
| YLPQLRGPMMIFTKVGRMSLTCYLLHSIIGTVLFLRY | 168 | 9.9e-6 | 0.34 | 37 | cyclic |
MS-DPR takes about one second per spectrum in the non-standard amino acid case and about one minute per spectrum in the standard amino acid case with MS-GF score. MS-DPR is specifically designed for computing p-values for cyclic, branch-cyclic and other non-linear peptides, where no alternative tools are available. We do not suggest using MS-DPR for linear peptides in the case of additive scoring function, where fast analytical solution is available.17 However, some MS/MS database search tools use non-additive scoring function and compute empirical estimates of p-values or E-values. Since these estimates may be inaccurate,14 MS-DPR may be used for validating or correcting these estimates.
Discussion
Most of the computational techniques developed in mass spectrometry focus on linear rather than non-linear peptides. Hence, computational mass spectrometry has not benefited the field of natural products yet, where the majority of interesting peptides are cyclic or branch-cyclic. One of the important questions in the field of peptide natural products is how to determine the structure (linear/cyclic/branch-cyclic) and amino acid sequence of a peptide from its spectrum. Since scoring functions for linear, cyclic and branch-cyclic peptides are very different, converting these scores to p-values is the first step toward automated MS-based discovery of peptide natural products.
We presented MS-DPR, a method for estimating statistical significance of PSMs in mass spectrometry. In contrast to existing methods for estimating p-values, MS-DPR can work with arbitrary scoring functions and non-linear peptides. Comparison of p-values estimated by MS-DPR with the p-values given by the generating function approach17 validated MS-DPR in the case of additive scoring function and linear peptides. While there is no method for computing exact p-value of cyclic PSMs for a comprehensive evaluation of MS-DPR in the case of cyclic peptides, incorporating p-values in the recently developed Cycloquest algorithm5 improved its performance (e.g. identification of cyclic peptide SFTI-1 missed by Cycloquest in previous study).
In the case of non-linear peptides, we used the shared peak count to score PSMs. While advanced scoring algorithms accounting for peak intensities increase the number of identifications of linear peptides at a given FDR, such scoring methods are not currently available for non-linear peptides. This is partially due to the fact that there are not enough annotated non-linear peptide spectra to train scoring algorithms. Recently, the natural product community has started collecting large scale mass spectrometry datasets. Thus, development of more comprehensive scoring algorithms will be possible in the near future.
While we tested MS-DPR only on linear, cyclic, and branch-cyclic peptides, our method is independent of a specific peptide structure and specific score scheme used. By defining a proper scoring function and random mutation for each peptide structure, MS-DPR can convert the score to an accurate p-value.
Cycloquest web-server reporting MS-DPR p-values is available at http://cyclo.ucsd.edu. The source code for MS-DPR is freely available at http://proteomics.ucsd.edu.
Supplementary Material
Acknowledgments
We would like to thank Pieter Dorrestein and Wei-Ting Liu for making the spectral dataset for SKF and SDP available, and Michelle Colgrave, Aaron Poth and Joshua Mylne for making the spectral dataset for SFTI-1 and SFT-L1 available. This work was supported by the U.S. National Institutes of Health 1-P41-RR024851-01. We are grateful to Kira Vyatkina for insightful suggestions.
Footnotes
Supporting Information Available: This material is available free of charge via the Internet at http://pubs.acs.org.
References
- 1.Li J, Vederas J. Drug discovery and natural products: end of an era or an endless frontier? Science. 2009;325:161–165. doi: 10.1126/science.1168243. [DOI] [PubMed] [Google Scholar]
- 2.Ng J, Bandeira N, Liu W, Ghassemian M, Simmons T, Gerwick W, Linington R, Dorrestein P, Pevzner P. Dereplication and de novo sequencing of nonribosomal peptides. Nat Methods. 2009;6:596–599. doi: 10.1038/nmeth.1350. [DOI] [PMC free article] [PubMed] [Google Scholar]
- 3.Mohimani H, Liu W, Liang Y, Gaudenico S, Fenical W, Dorrestein P, Pevzner P. Multiplex de Novo sequencing of peptide antibiotics. J Comput Biol. 2011;18:1371–1381. doi: 10.1089/cmb.2011.0158. [DOI] [PMC free article] [PubMed] [Google Scholar]
- 4.Mohimani H, Liang Y, Liu W, Hsieh P, Dorrestein P, Pevzner P. Sequencing cyclic peptides by multistage mass spectrometry. J Proteomics. 2011;11:3642–3650. doi: 10.1002/pmic.201000697. [DOI] [PMC free article] [PubMed] [Google Scholar]
- 5.Mohimani H, Liu W, Mylne J, Poth A, Colgrave M, Tran D, Selsted M, Dorrestein P, Pevzner P. Cycloquest: Identification of cyclopeptides via database search of their mass spectra against genome databases. J Prot Res. 2011;10:4505–4512. doi: 10.1021/pr200323a. [DOI] [PMC free article] [PubMed] [Google Scholar]
- 6.Fenyo D, Beavis R. A method for assessing the statistical significance of mass spectrometry-based protein identifications using general scoring schemes. Anal Chem. 2003;75:768–774. doi: 10.1021/ac0258709. [DOI] [PubMed] [Google Scholar]
- 7.Sadygov R, Liu H, Yates JR. Statistical Models for Protein Validation Using Tandem Mass Spectral Data and Protein Amino Acid Sequence Databases. Anal Chem. 2004;76:1664–1671. doi: 10.1021/ac035112y. [DOI] [PubMed] [Google Scholar]
- 8.Matthiesen R, Trelle MB, Hojrup P, Bunkenborg J, Jensen ON. VEMS 3.0: Algorithms and Computational Tools for Tandem Mass Spectrometry Based Identification of Post-translational Modifications in Proteins. J Prot Res. 2005;4:2338–2347. doi: 10.1021/pr050264q. [DOI] [PubMed] [Google Scholar]
- 9.Chamrad D, Koerting G, Gobom J, Thiele H, Klose J, Meyer H, Blueggel M. Interpretation of mass spectrometry data for high-throughput proteomics. Anal Bioanal Chem. 2007;376:1014–1022. doi: 10.1007/s00216-003-1995-x. [DOI] [PubMed] [Google Scholar]
- 10.Nesvizhskii A, Vitek O, Aebersold R. Analysis and validation of proteomic data generated by tandem mass spectrometry. Nat Methods. 2007;4:787–1797. doi: 10.1038/nmeth1088. [DOI] [PubMed] [Google Scholar]
- 11.Nesvizhskii A, Aebersold R. Analysis, statistical validation and dissemination of large-scale proteomics datasets generated by tandem MS. Drug Discov Today. 2004;9:173–181. doi: 10.1016/S1359-6446(03)02978-7. [DOI] [PubMed] [Google Scholar]
- 12.Spirin V, Shpunt A, Seebacher J, Gentzel M, Shevchenko A, Gygi S, Sunyaev S. Assigning spectrum-specific P-values to protein Identifications by mass spectrometry. Bioinformatics. 2011;27:1128–1134. doi: 10.1093/bioinformatics/btr089. [DOI] [PMC free article] [PubMed] [Google Scholar]
- 13.Weatherly B, Atwood J, Minning T, Cavola C, Tarleton R, Orlando R. A Heuristic Method for a False-discovery Rate for Protein Identifications from Mascot Database Search Results. Mol Cell Proteomics. 2005;4:762–772. doi: 10.1074/mcp.M400215-MCP200. [DOI] [PubMed] [Google Scholar]
- 14.Kim S, Mischerikow N, Bandeira N, Navarro J, Wich L, Mohammed S, Heck A, Pevzner P. The generating function of CID, ETD and CID/ETD pairs of tandem mass spectra: Applications to database search. Mol Cell Proteomics. 2010;9:2840–2852. doi: 10.1074/mcp.M110.003731. [DOI] [PMC free article] [PubMed] [Google Scholar]
- 15.Kahn H, Harris T. Estimation of Particle Transmission by Random Sampling. National Bureau of Standards Applied Mathematics. 1951;12:27–30. [Google Scholar]
- 16.Villen-Altamirano M, Villen-Altamirano J. RESTART: A method for accelerating rare events simulations. Queueing Performance and Control in ATM. Proceedings of ITC. 1991;13:71–76. [Google Scholar]
- 17.Kim S, Gupta N, Pevzner P. Spectral Probabilities and Generating Functions of Tandem Mass Spectra: A Strike against Decoy Databases. J Prot Res. 2008;7:3354–3363. doi: 10.1021/pr8001244. [DOI] [PMC free article] [PubMed] [Google Scholar]
- 18.Hammersley J, Handscomb D. Monte carlo methods. John Wiley and Sons; New York: 1964. [Google Scholar]
- 19.Rubino G, Tuffin B. Rare event simulation using Monte Carlo methods. Wiley; 2009. [Google Scholar]
- 20.Kahn H, Marshall AW. Rare event simulation using Monte Carlo methods. Oper Res Soc Amer. 1953;7:263–278. [Google Scholar]
- 21.Kahn H. Use of different Monte Carlo sampling techniques. RAND corporation; 1956. [Google Scholar]
- 22.Glasserman P, Heidelberger P, Shahabuddin P. Asymptotically optimal importance sampling and stratification for pricing path dependent options. Mathematical Finance. 1999;9:117–152. [Google Scholar]
- 23.Blom H, Krystul J, Bakker G, Klompstra M, Obbink B. Stochastic Hybrid Systems CRC Press. 2007. Free flight collision risk estimation by sequential MC simulation. [Google Scholar]
- 24.Sandmann W. Applicability of importance sampling to coupled molecular reactions. In Proceedings of the 12th International Conference on Applied Stochastic Models and Data Analysis; 2007. [Google Scholar]
- 25.Elias J, Gygi S. Target-decoy search strategy for increased confidence in large-scale protein identifications by mass spectrometry. Nat Methods. 2007;4:207–214. doi: 10.1038/nmeth1019. [DOI] [PubMed] [Google Scholar]
- 26.Gupta N, Bandeira N, Keich U, PP Target-decoy approach and false discovery rate: when things may go wrong. J Am Soc Mass Spectrom. 2011;22:1111–1120. doi: 10.1007/s13361-011-0139-3. [DOI] [PMC free article] [PubMed] [Google Scholar]
- 27.Nesvizhskii A. Survey of computational methods and error rate estimation procedures for peptide and protein identification in shotgun proteomics. J Prot Res. 2010;73:2092–2123. doi: 10.1016/j.jprot.2010.08.009. [DOI] [PMC free article] [PubMed] [Google Scholar]
- 28.Kwon T, Choi H, Vogel C, Nesvizhskii AI, Marcotte EM. MSblender: A probabilistic approach for integrating peptide identifications from multiple database search engines. J Prot Res. 2011;10:2949–2958. doi: 10.1021/pr2002116. [DOI] [PMC free article] [PubMed] [Google Scholar]
- 29.Geer L, Markey SP, Kowalak J, Wagner L, Xu M, Maynard DM, Yang X, Shi W, Bryant SH. Open mass spectrometry search algorithm. J Prot Res. 2004;3:958–964. doi: 10.1021/pr0499491. [DOI] [PubMed] [Google Scholar]
- 30.Waterman M, Vingron M. Rapid and accurate estimates of statistical significance for sequence data base searches. Proc Natl Acad Sci. 1994;91:4625–4628. doi: 10.1073/pnas.91.11.4625. [DOI] [PMC free article] [PubMed] [Google Scholar]
- 31.Asmussen S, Glynn PW. Stochastic simulation: algorithms and analysis. Springer; 2007. [Google Scholar]
- 32.Haraszti Z, Townsend JK. The theory of direct probability redistribution and its application to rare even simulation. ACM Trans Modeling and Computer Simulation. 1999;9:105–140. [Google Scholar]
- 33.Glasserman P, Heidelberger P, Shahabuddin P. A large deviations perspective on the efficiency of multilevel splitting. IEEE Trans Automat Contr. 1998;43:1666–1679. [Google Scholar]
- 34.Klimek J, Eddes JS, Hohmann L, Jackson J, Peterson A, Letarte S, Gafken PR, Katz J, Mallick P, Lee H, Schmidt A, Ossola R, Eng J, Aebersold R, Martin D. The standard protein mix database: a diverse data set to assist in the production of improved peptide and protein identification software tools. J Prot Res. 2008;7:96–103. doi: 10.1021/pr070244j. [DOI] [PMC free article] [PubMed] [Google Scholar]
- 35.Eng J, McCormack A, Yates J. An approach to correlate tandem mass spectral data of peptides with amino acid sequences in a protein database. J Am Soc Mass Spectrom. 1994;5:976–989. doi: 10.1016/1044-0305(94)80016-2. [DOI] [PubMed] [Google Scholar]
- 36.Keller A, Nesvizhskii A, Kolker E, Aebersold R. Empirical statistical model to estimate the accuracy of peptide identifications made by MS/MS and database search. Anal Chem. 2002;74:5383–5392. doi: 10.1021/ac025747h. [DOI] [PubMed] [Google Scholar]
- 37.Tanner S, Shu H, Frank A, Wang L, Zandi E, Mumby M, Pevzner P, Bafna V. InsPecT: identification of posttranslationally modified peptides from tandem mass spectra. Anal Chem. 2005;77:4626–4639. doi: 10.1021/ac050102d. [DOI] [PubMed] [Google Scholar]
Associated Data
This section collects any data citations, data availability statements, or supplementary materials included in this article.