Abstract
Increase in the complexity of organisms during evolution strongly correlates with the increase in the noncoding DNA content of their genomes. Although a gradual increase in the proportion of repetitive DNA elements along with increasing complexity is known, most of the noncoding components of the genome remain uncharacterized. A nonrepetitive but highly conserved noncoding component of the genome in vertebrates, called ultraconserved DNA sequences, constitutes up to 5% of the human genome. The function of most of the ultraconserved DNA elements is not well known. One such ultraconserved stretch of DNA has been identified upstream of the HoxD cluster in vertebrates. We analyzed the function of these elements in different cell lines and zebrafish. Our results suggest that these ultraconserved sequences work as repressor elements. This is the first report which reveals the repressor function of ultraconserved sequences and implicates their role in the regulation of developmental genes.
Keywords: ultraconserved DNA sequences, enhancers, repressors, HoxD, vertebrates
Introduction
The content of noncoding DNA in higher organisms increases drastically which correlate with the evolution of complexity (Mattick 2004, 2007). This suggests that noncoding DNA content in higher organisms got selected and expanded due to their role in the development of the complex features in the higher organisms. Some of the noncoding DNA sequences in vertebrates are even more conserved than many of the protein-coding DNA sequences. Such sequences of up to 200 bp are known as ultraconserved sequences (Bejerano et al. 2004). The ultraconserved sequences constitute up to 5% of the genome, several folds more than protein coding sequences in the human genome. The ultraconserved sequences are present across different animal groups (Bejerano et al. 2004; Siepel et al. 2005) and some reports suggest their presence in different plant species also (Kritsas et al. 2012; Haudry et al. 2013). The functional aspects of ultraconserved DNA sequences have not been studied in great detail but are generally thought to regulate the function of protein-coding genes. Ultraconserved sequences are distributed nonrandomly in the genome and are generally associated with developmental genes (Bejerano et al. 2004; Sandelin et al. 2004; Woolfe et al. 2004). Although not much is known about the function of ultraconserved sequences, they have been implicated as enhancers (de la Calle-Mustienes et al. 2005; Pennacchio et al. 2006; Royo et al. 2011), regulators of transcription, RNA splicing (De Grassi et al. 2010), RNA editing (Daniel et al. 2012), and in the development and maintenance of structural architecture (Marinic et al. 2013). Contrary to the expectation from a functionally important element knockout mouse for ultraconserved sequences were found to be viable without any obvious phenotype (Ahituv et al. 2007).
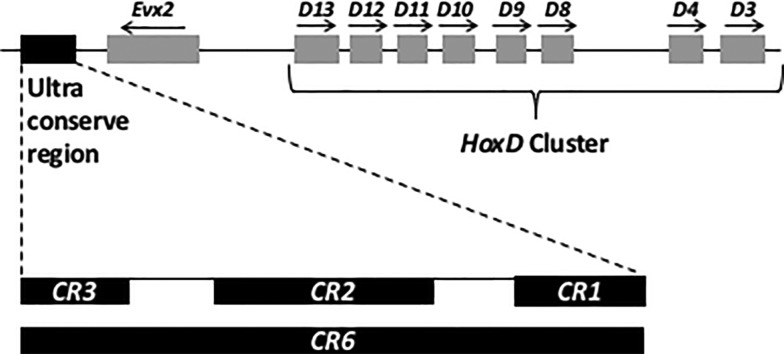
We have earlier identified three stretches of ultraconserved sequences associated with the HoxD cluster in all vertebrates referred to as Conserved Regions (CR1, CR2, and CR3) (fig. 1) (Sabarinadh et al. 2003, 2004). Hox genes are a set of transcription factors, which regulate early embryonic development and body axis formation in all bilaterians (Krumlauf 1994; Duboule 1998; Pearson et al. 2005; Iimura and Pourquié 2007). Being associated with such an important developmental locus that is regulated in very complex and sophisticated manner, we expect CRs to be of functional significance. To explore the function of CRs in this context, we used various reporter assays. Our findings, for the first time, reveals repression function of ultraconserved sequences.
Fig. 1.—
Genomic organization of ultraconserved sequences associated with HoxD cluster: The ultraconserved region downstream of Evx2 consists of three blocks of conserved sequences CR1, CR2, and CR3 spanning to 5.0 kb in mouse (GRCm38/MM10, chr2: 74,649,244–74,654,293) and 3.6 kb in zebrafish (Zv9/DanRer7, chr9: 1,996,709–2,000,392). The size of the three blocks differ slightly in mouse CR1 (315 bp), CR2 (800 bp), and CR3 (260 bp) and zebrafish CR1 (300 bp), CR2 (760 bp), and CR3 (250 bp).
Materials and Methods
Transient transfections and colony forming assay were performed in different cell lines, viz., mouse embryonic stem cells (R1 and JM-8), HeLa, IMR32, N2A, CHO, and HEK293T. HEK293T cells were used for transient transfection only because these cell lines are neomycin resistant. We chose cells of different origin and types in our experiments. We have also used zebrafish reporter system to assay the function of CRs in the developmental context.
Constructs for Various Reporter Assay
Constructs for Transient Transfection
We used plasmid PEGFP-1 as the backbone construct for this assay. EF1α promoter (Ma et al. 2003; Norrman et al. 2010) was amplified from pEF1α/His C plasmid using primers flanking with BamH1 sites and cloned in PEGFP-1 plasmid at the BamH1 site. All the CRs were cloned individually at EcoRV site. All the clones were confirmed by DNA sequencings. Plasmids were purified using NucleoBond Xtra Midi kit from Macherey-Nagel (supplementary fig. 1, Supplementary Material online) for subsequent use.
Constructs for Stable Cell Transformants
Plasmid pMCNeopolyA was used as a backbone for this assay. EF1αGFP from pEF1αGFP-1 was digested by HincII and cloned at HincII site in PMCNeopolyA plasmid. PCR amplified CRs were then cloned upstream of Neomycin resistance gene at the end filled MluI site in pMCNeoEF1αGFPA. Resulting plasmids pMCRsNeoEF1αGFPA were confirmed by DNA sequencing and then purified using NucleoBond Xtra Midi kit from Macherey-Nagel. Final plasmids were linearized by Not1 and purified by phenol-chloroform extraction for electroporation in different cell lines (supplementary fig. 1, Supplementary Material online).
Constructs for Zebrafish Reporter Assay
The pminiTol-2 and pEF1αGFP plasmids were digested with EcoRI and NotI. The EF1αGFP fragment was purified and cloned into EcoRI and NotI sites of digested pminiTol-2 plasmid. The pEF1αGFPminiTol-2 plasmid was confirmed by DNA sequencing. Zebrafish and mouse CRs were PCR amplified, purified, and cloned into the EcoRV site of pEF1αGFPminiTol-2 to generate final pCRsEF1αGFPminiTol-2 plasmids (supplementary fig. 1, Supplementary Material online). Tol-2 transposase RNA was generated by performing in vitro transcription using ambion mMessage mMachine T3 kit and XbaI digested pDB600 plasmid.
Transient Transfection Analysis
Different cell lines were transfected with pCRsEF1αGFP and pEF1α m-cherry as internal control plasmids. Equimolar plasmid concentrations were used for transfection. Lipofectamine 2000 was used as the transfection reagent. About 30–40 h after the transfection, fluorescent microscopy was done.
In separate set of experiment, after 30 h of transfection cells were trypsinized and washed with PBS for FACS (MoFlo). FACS analysis was done at respective wavelengths for GFP and m-cherry, the graph was plotted for GFP expression after normalizing with control m-cherry plasmid.
Colony Forming Assay
The pCRsNeoEF1αGFP plasmids were digested with Not1 enzyme and linearized plasmids were purified using phenol: Chloroform extraction method. An equimolar concentration of plasmids was used, in all the experiments. Cells were trypsinized, PBS washes were given, and the cell suspension was collected in an electroporation cuvette. Electroporation was done by using Gene Pulsar from Bio-Rad. Different Electroporation conditions were used for different cell lines. About 24 h after the electroporation, the cells were transferred in selection media containing G418. Selection media was replaced with fresh selection media on alternate days. G418 selection was continued, till there were no colonies left in the negative control plates. Colonies were fixed, stained with Giemsa stain, and counted.
Reporter Assay in Zebrafish
The reporter plasmids containing mouse and zebrafish CRs along with Tol2 transposase RNA were microinjected in equimolar concentration in zebrafish embryos at one cell stage. Fixed volume of injections (2nl) was maintained by using femtojet (Eppendorf). For each construct, 100 embryos were injected and in evening dead and deformed embryos were removed. Next day in morning 20 GFP-positive embryos were randomly picked and placed in 24 well-plate one embryo in each well. GFP fluorescence was imaged for each embryo for 10 days and compared with control GFP embryos. Identical settings of the microscope were used for image acquisition each time. Since all the imaging was done on Leica stereo fluorescent, where the distance between objective and the sample is large as compared with confocal microscope. This causes more scattering of light and hence sometime gives red signal due to auto fluorescence from older zebrafish larvae.
Results
Transient Transfection Assays Show Either Minimal or No Activity of CRs
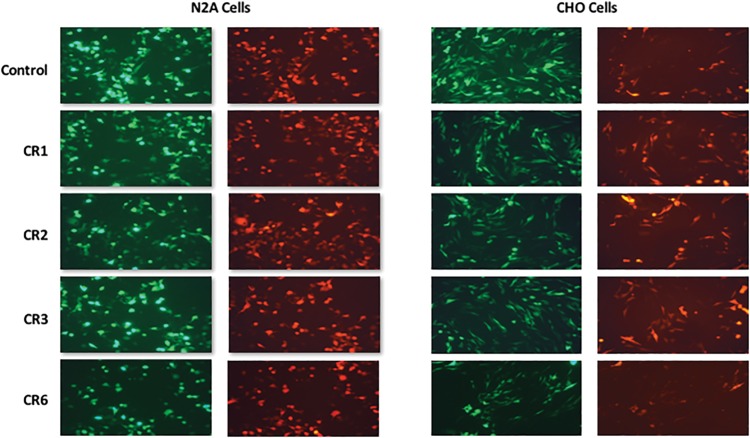
To decipher the function of CRs, we cloned them upstream of EF1α promoter followed by GFP reporter gene. We used cell lines from different vertebrates, mouse embryonic stem cells (MES), Chinese hamster ovary cells (CHO), human embryonic kidney cells (HEK), human neuroblastoma cells (IMR32), mouse neuroblastoma cells (N2A), and human cervical cancer cells (HeLa). Data from different cell lines shows either no specific activity or cell line dependent activity of CRs in transient transfection assays. In CHO cell lines, GFP expression suggests that CR1, CR2, CR3, and CR6 show less GFP expression as compared with the control. In N2A cells, CR2 and CR6 show low GFP expression as compared with CR1, CR3, and control elements (fig. 2).
Fig. 2.—
Transient transfection assays in different cell lines: Transient transfection assay was used to test the regulatory activity of mouse CR element in GFP reporter construct. The m-cherry reporter gene construct was used as an internal transfection control. No significant difference in the reporter activity is seen between the control and the test constructs.
To quantitate the expression of reporter gene in transient transfection assays, we performed FACS analysis with mouse embryonic stem cells (MES), HEK, IMR32, and N2A cells. FACS data also suggests that CRs show cell line dependent activity. In N2A cells, CR2 and CR6 work as a repressor as compared with control (supplementary fig. 2, Supplementary Material online). In IMR32 cell lines all CRs show enhancer activity as compared with control elements. In HEK and MES cells, CRs do not show any strong activity as compared with the control. Data from different cell lines suggest that in transient transfection assay, CRs do not show a significant and consistant activity, although there is some cell line dependent activity.
CRs Show Strong Repression Activity in Stable Transformation Assay
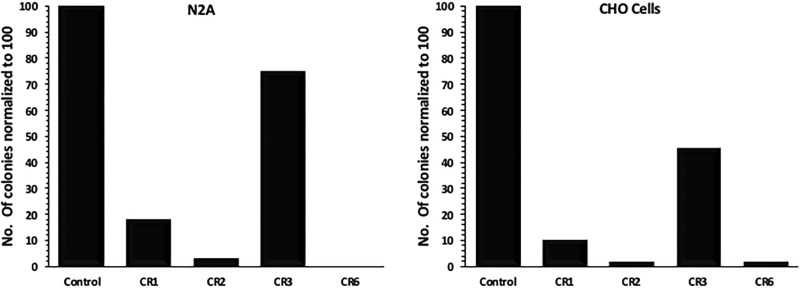
We generated stable cell transformants for different CR elements by using the construct, where CRs are placed upstream of the neomycin resistance gene. Selections were carried out till no colony was left in the negative control plate. Cell lines used for the generation of stable transformants are mouse embryonic stem cells (R-1 and JM-8), HeLa, IMR32, N2A, and CHO. HEK293T cell lines were not used for colony formation assay as this cell is already containing neomycin resistance gene. Number of colonies present in different CRs plates were counted and compared with the control plates for the respective cell lines. All cell lines follow the same trend of CR activity unlike what we observed in the transient transfection assays. Data from undifferentiated mouse embryonic stem cells and from CHO cells shows that CR2 plates contain a minimum number of colonies suggesting that CR1 and CR2 work as strong repressors as compared with the control (fig. 3). CR3 shows a moderate level of repression activity, CR6 (that contains all the CRs) shows additive repression activity of the respective CRs. Other cell lines from different origin and source also follow the same pattern as seen in MES and CHO (supplementary fig. 3, Supplementary Material online). CRs repression activity shows a positive correlation with the length of CRs, CR2 (800 bp) being the largest in size shows maximum repression activity.
Fig. 3.—
Colony formation assay in different cell lines: Neomycin resistant colonies were used to conclude the activity of CRs. Mouse CRs construct and control plasmids constructs were electroporated in different cell lines followed by drug selection till no colonies were left in negative control. X axis represents different plasmid constructs and Y axis total number of colonies formed, normalized to 100. The data suggests that CRs work as repressors. CR1, CR2, and CR6 show strong repression activity as compared with CR3.
CR2 Shows Early Enhancer and Late Repressor Activity in Reporter Assays in Zebrafish
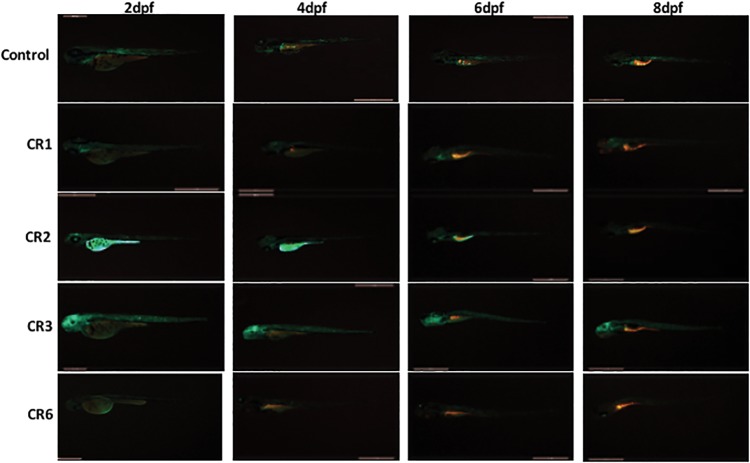
We used zebrafish model to check the function of CRs at the organism level. Mouse CR elements containing reporter gene plasmids along with Tol-2 transposase RNA were injected in zebrafish embryos at one cell stage in equimolar concentrations. The GFP expression in zebrafish larvae was compared with respect to control construct at respective different days’ postfertilization (dpf) stages. CR2 embryo, when compared with the control, show very high level of GFP expression, whereas CR1, CR3, and CR6 show moderate GFP expression (fig. 4). After 4 dpf, when organogenesis is almost over, GFP expression in CR2 injected embryos starts decreasing and by 5–6 dpf no or very less GFP expression is visible. In the case of CR1, CR3, and CR6, a weak to moderate level of GFP expression can be seen throughout as compared with the control.
Fig. 4.—
Reporter assay in zebrafish: Individual zebrafish embryos injected with different mouse CRs reporter constructs in equimolar concentration and imaged on dpf. GFP expression in the same embryo is shown at 2, 4, 6, and 8 dpf in the respective row. CR2 embryo shows high level of GFP expression during early embryogenesis and after 4 dpf GFP expression reduces drastically as compared with control embryo. CR1, CR3, and CR6 show comparable GFP expression as in the case of control even after 8 dpf.
We used zebrafish elements to check their functional conservation at organism level. Zebrafish CR constructs, along with Tol-2 transposase RNA were injected in zebrafish embryos at one cell stage in equimolar concentrations. Zebrafish CR2 injected embryos, when compared with the control, show high level of GFP expression, whereas CR1, CR3, and CR6 show a weak to moderate level of GFP expression. Zebrafish CR2 follows the same pattern of activity as that of mouse CR2 (supplementary fig. 4, Supplementary Material online). CR1, CR3, and CR6 from fish also show the same trend of expression pattern as mouse CRs. These observations suggest that CR2 works as an early enhancer and later repressor as compared with CR1, CR3, and CR6 in zebrafish embryos.
Discussion
In this study, we used variety of assays to explore the function of ultraconserved elements located upstream of HoxD locus. Transient transfection assays show a cell line dependent and inconsistent activity of CRs. One limitation of transient transfection assay is that the test plasmid is present in episomal form and it does not show its effect in the chromatin context. To overcome this limitation, we generated stable cell transformants, where CRs containing constructs were present in chromatin context. Our colony formation data from different vertebrate cell lines show that CR1 and CR2 have strong repression activity as compared with control element, whereas CR3 shows a moderate level of repression activity. The entire ultraconserved conserved region (CR6), consisting of CR1, CR2, and CR3, also shows strong repression activity suggesting the additive nature of CR activities. CRs repression activity also shows a positive correlation with the length of individual CR elements, CR2 being the largest in size show maximum repression activity followed by CR1 and CR3. A similar trend of different CRs activity in different vertebrate cell lines of different origin suggests CRs repression activity a generalized repression activity. Since CRs get randomly integrated yet we get a similar trend of repression activity further supports the general repression nature of these elements.
Cell lines are simple and convenient systems derived from one lineage and therefore do not mimic organism level cell to cell interactions. A developmental regulatory element is expected to show function in a tissue-specific and developmental stage specific manner. We, therefore, used zebrafish model system to assay the function of mouse CRs during development. Our data from this assay suggests that CRs have temporal regulation during early embryonic development. CR2 shows very high GFP expression during organogenesis and once organogenesis is completed, CR2 starts working as strong repressor. CRs from zebrafish, also show similar kind of activity pattern. This suggests that CRs not only have sequence conservation but these elements are also functionally conserved across different vertebrate systems. Early enhancer activity of CR2, coinciding with the time window of organogenesis, points towards its possible role in this process. It does not explain, however the findings that CR6 does not show this transient enhancer activity. More functions and complex mechanisms are probably operating the reporter gene expression at CR6 level. Genome editing of these elements will be used to address this aspect in the native context.
We looked at the features associated with this locus of the genome in different organisms (supplementary figs. 5 and 6, Supplementary Material online). Repeats, SNPs, and deletion/duplication events in this regions are very less as would be expected for a region, where the sequence and copy number are under strong selection pressure. These regions are also associated with ESTs associated with this region and clusters of DNase I hypersensitive sites. These features can be taken as the clues for further studies to understand their function. We also surveyed the epigenetic modifications associated with this region in publically available resources. H3K27Me3, repressive mark is found across the length of CRs in embryonic stem cells and in different tissues in mammal, whereas in zebrafish, early embryonic stages show H3K4Me3 and H3K4Me1 marks across CR1 and CR2 suggesting a potential role of these elements in development. We also observed many transcription factor binding sites coinciding with DNase hypersensitive sites mapping to this region in different cell types (supplementary figs. 5 and 6, Supplementary Material online). Although these observations may provide some clues as to how ultraconserved sequences may be functioning, further studies will be needed to understand the molecular basis of their function.
Enrichment of noncoding DNA is likely to have been selected and expanded with the evolution of the complexity due to their role in the developmental regulation of genes. The presence of CRs, next to the key regulatory loci like HoxD gives a strong indication for their regulatory function. To the best of our knowledge, we present here the first report, which shows repression activity of ultraconserved sequences and opens up a new line of study of such elements. In the context of HoxD, the repression activity of CRs might be playing a role in the setting up the specific pattern of the expression of the Hox genes perhaps by fine-tuning the expression of associated Hox genes during early embryonic development and body axis formation. Further studies will be needed to understand the precise role of CRs in the developmental regulation and the mechanism of their function.
Ethics Approval
All zebrafish experiments were approved by the institutional animal ethics committees.
Supplementary Material
Supplementary data are available at Genome Biology and Evolution online.
Authors’ Contribution
R.K.M. conceived the research program. R.K.M. and G.K. designed the experiments. G.K. carried out cell culture and zebrafish experiments. R.K.M. and G.K. discussed the results and wrote the manuscript.
Supplementary Material
Acknowledgments
Authors thank CSIR for funding through network programs BSC0118 and BSC0208. We also thank K. Ravinder and D. Santhosh for maintaining zebrafish facility and stocks.
Literature Cited
- Ahituv N, et al. 2007. Deletion of ultraconserved elements yields viable mice. PLoS Biol. 5(9):e234.. [DOI] [PMC free article] [PubMed] [Google Scholar]
- Bejerano G, et al. 2004. Ultraconserved elements in the human genome. Science 304(5675):1321–1325. [DOI] [PubMed] [Google Scholar]
- Daniel C, Venø MT, Ekdahl Y, Kjems J, Öhman M.. 2012. A distant cis acting intronic element induces site-selective RNA editing. Nucleic Acids Res. 40(19):9876–9886. [DOI] [PMC free article] [PubMed] [Google Scholar]
- De Grassi A, et al. 2010. Ultradeep sequencing of a human ultraconserved region reveals somatic and constitutional genomic instability. PLoS Biol. 8(1):e1000275.. [DOI] [PMC free article] [PubMed] [Google Scholar]
- de la Calle-Mustienes E, et al. 2005. A functional survey of the enhancer activity of conserved non-coding sequences from vertebrate Iroquois cluster gene deserts. Genome Res. 15(8):1061–1072. [DOI] [PMC free article] [PubMed] [Google Scholar]
- Duboule D. 1998. Vertebrate hox gene regulation: clustering and/or colinearity? Curr Opin Genet Dev. 8(5):514.. [DOI] [PubMed] [Google Scholar]
- Haudry A, et al. 2013. An atlas of over 90,000 conserved non-coding sequences provides insight into crucifer regulatory regions. Nat Genet. 45(8):891–898. [DOI] [PubMed] [Google Scholar]
- Iimura T, Pourquié O.. 2007. Hox genes in time and space during vertebrate body formation. Dev Growth Differ. 49(4):265–275. [DOI] [PubMed] [Google Scholar]
- Kritsas K, et al. 2012. Computational analysis and characterization of UCE-like elements (ULEs) in plant genomes. Genome Res. 22(12):2455–2466. [DOI] [PMC free article] [PubMed] [Google Scholar]
- Krumlauf R. 1994. Hox genes in vertebrate development review. Cell 78(2):191–201. [DOI] [PubMed] [Google Scholar]
- Ma Y, Ramezani A, Lewis R, Hawley RG, Thomson JA.. 2003. High‐level sustained transgene expression in human embryonic stem cells using lentiviral vectors. Stem Cells 21(1):111–117. [DOI] [PubMed] [Google Scholar]
- Marinic M, Aktas T, Ruf S, Spitz F.. 2013. An integrated holo-enhancer unit defines tissue and gene specificity of the Fgf8 regulatory landscape. Dev Cell 24(5):530–542. [DOI] [PubMed] [Google Scholar]
- Mattick JS. 2004. RNA regulation: a new genetics? Nat Rev Genet. 5(4):316–323. [DOI] [PubMed] [Google Scholar]
- Mattick JS. 2007. A new paradigm for developmental biology. J Exp Biol. 210(9):1526–1547. [DOI] [PubMed] [Google Scholar]
- Norrman K, et al. 2010. Quantitative comparison of constitutive promoters in human ES cells. PLoS One 5(8):e12413.. [DOI] [PMC free article] [PubMed] [Google Scholar]
- Pearson JC, Lemons D, McGinnis W.. 2005. Modulating Hox gene functions during animal body patterning. Nat Rev Genet. 6(12):893–904. [DOI] [PubMed] [Google Scholar]
- Pennacchio LA, et al. 2006. In vivo enhancer analysis of human conserved non-coding sequences. Nature 444(7118):499–502. [DOI] [PubMed] [Google Scholar]
- Royo JL, et al. 2011. Transphyletic conservation of developmental regulatory state in animal evolution. Proc Natl Acad Sci. 108(34):14186–14191. [DOI] [PMC free article] [PubMed] [Google Scholar]
- Sabarinadh C, Subramanian S, Mishra RK.. 2003. Extreme conservation of non-repetitive non-coding regions near HoxD complex of vertebrates. Genome Biol. 4(4):P2. [Google Scholar]
- Sabarinadh C, Subramanian S, Tripathi A, Mishra RK.. 2004. Extreme conservation of non-coding DNA near HoxD complex of vertebrates. BMC Genomics 5(1):75.. [DOI] [PMC free article] [PubMed] [Google Scholar]
- Sandelin A, et al. 2004. Arrays of ultraconserved non-coding regions span the loci of key developmental genes in vertebrate genomes. BMC Genomics 5(1):99.. [DOI] [PMC free article] [PubMed] [Google Scholar]
- Siepel A, et al. 2005. Evolutionarily conserved elements in vertebrate, insect, worm, and yeast genomes. Genome Res. 15(8):1034–1050. [DOI] [PMC free article] [PubMed] [Google Scholar]
- Woolfe A, et al. 2004. Highly conserved non-coding sequences are associated with vertebrate development. PLoS Biol. 3(1):e7. [DOI] [PMC free article] [PubMed] [Google Scholar]
Associated Data
This section collects any data citations, data availability statements, or supplementary materials included in this article.


