

Abstract
Apolipoprotein E (apoE) has an important role in the pathogenesis of Alzheimer's disease with its three isoforms having distinct effects on disease risk. Here, we assessed the conformational differences between those isoforms using a novel flow cytometry-Forster resonance energy transfer (FRET) assay. We showed that the conformation of intracellular apoE within HEK cells and astrocytes adopts a directional pattern; in other words, E4 adopts the most closed conformation, E2 adopts the most open conformation, and E3 adopts an intermediate conformation. However, this pattern was not maintained upon secretion of apoE from astrocytes. Intermolecular interactions between apoE molecules were isoform-specific, indicating a great diversity in the structure of apoE lipoparticles. Finally, we showed that secreted E4 is the most lipidated isoform in astrocytes, suggesting that increased lipidation acts as a folding chaperone enabling E4 to adopt a closed conformation. In conclusion, this study gives insights into apoE biology and establishes a robust screening system to monitor apoE conformation.
Keywords: Alzheimer's disease, apolipoprotein E (apoE), conformational change, flow cytometry, fluorescence resonance energy transfer (FRET), lipoprotein, neurodegenerative disease
Introduction
ApoE is a secreted lipoprotein that is present in the human population in three different isoforms, E2, E3, and E4. These differ from one another by single Cys-Arg interchanges at residues 112 and 158, with E4 harboring Arg at both sites, E3 at Cys-112 and Arg-158, and E2 having Cys at both sites. There are predicted to be three primary structural features: an N-terminal receptor interaction domain (1), a presumably flexible bridge (2), and a C-terminal lipid-interacting domain (3). ApoE is produced mainly by the liver in the periphery and is not believed to substantially cross into the central nervous system (CNS) (4). Thus, lipid transport functions in the CNS are subserved by apoE made primarily by astrocytes and microglia (5). Inheritance of the E4 allele is strongly associated with an increased risk for Alzheimer's disease, and inheritance of the E2 allele is strongly associated with reduced risk of Alzheimer's disease compared with the most common E3 allele (6).
Even though it has been hypothesized that conformational differences are responsible for the functional differences between apoE isoforms (7), knowledge of the tertiary and quaternary structure of apoE is limited. It has been shown both through X-ray crystallography of N-terminal fragments (3) and circular dichroism spectroscopy of full-length and fragmented apoE (8) that E4 has a more closed conformation than E3. An intradomain interaction model has been suggested as a basis for these structural differences, with a postulated salt bridge between Arg-61 and Glu-255. In this model a salt bridge would not form in E3 or E2 because the Cys-112 changes the orientation of the Arg-61 side chain and makes it less accessible to Glu-255 interaction (3, 7). These conformational differences have been confirmed through FRET assays in vitro (9, 10). Biochemical analyses of human cerebrospinal fluid and blood- and brain-derived apoE have indicated the presence of apoE intermolecular interactions and have shown that E4 does not form covalently linked multimers, in contrast to E2 and E3 (11–13). Finally, two models have been suggested for the structure of secreted apoE lipoparticles in which apoE could either surround lipids in a belt-like formation with one apoE molecule per particle or bind to lipids in a 2:1 ratio with the two apoE molecules forming a 42° angle (7, 14–16).
Despite these advances toward elucidating the tertiary and quaternary structure of apoE, there are still many open questions. Progress has been impeded by the difficulty of using standard NMR and X-ray crystallography methods as apoE is a lipoprotein and requires lipid binding in order to maintain its physiological conformation. Even though FRET-based studies have proven to be a powerful approach to study the conformation of proteins, to date they have mainly focused on intracellular or on recombinant apoE or on apoE produced from non-CNS cell types (9, 10). In addition, because of its relative rarity in the human population, the conformation of the protective E2 allele has not been studied in as much detail as E3 and E4, and the quaternary structure of intracellular and secreted apoE particles is controversial.
To address these questions, we have developed a novel FRET-flow cytometry system to study the conformation and intermolecular interactions of intracellular and secreted apoE isoforms with high resolution and sensitivity. We used this system to comparatively study the conformation of HEK- and astrocyte-produced apoE. We showed that the conformations and quaternary structures of the three isoforms differ, that the measured structure depends on the cell type of origin, and that these structural differences may be related to differences in lipidation.
Results
ApoE isoforms exhibit distinct intracellular conformations in HEK cells and astrocytes
We designed a series of plasmids encoding the three apoE isoforms, with a GFP tag fused to the C terminus and an RFP2 tag fused to the N terminus of the protein with an 18-amino acid secretion signal peptide before the RFP tag. Double-tagged proteins can be analyzed to monitor intramolecular FRET, and the results can be used as a proxy to infer the conformation status of apoE. A higher FRET ratio indicates higher energy transfer from GFP to RFP and occurs when the two termini of the protein are oriented in a way to support FRET, most likely because the two fluorophores are closer together (Fig. 1A).
Figure 1.
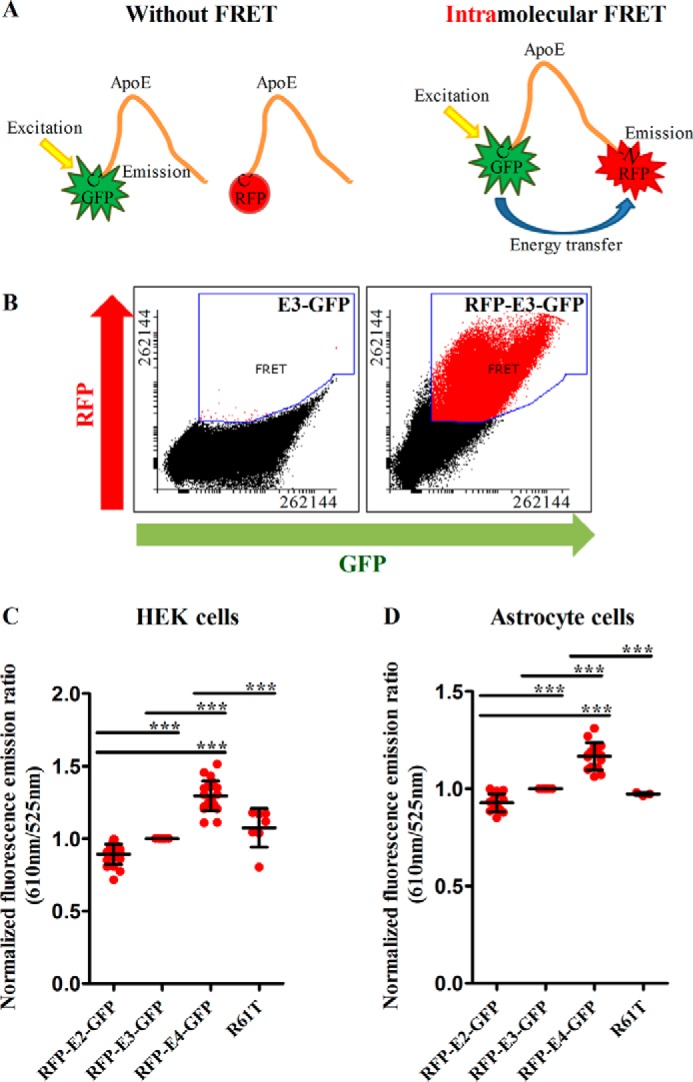
A, diagram illustrating the FRET concept for intramolecular interactions. When the donor (GFP) and the acceptor (RFP) are sufficiently close, energy transfer occurs from GFP to RFP upon excitation of GFP, thus resulting in indirect excitation of RFP. The amount of RFP excitation relative to GFP excitation can be used as a proxy for the conformation of apoE. B, flow cytometry plots for intracellular apoE from one representative experiment in HEK cells. E3-GFP is a single-tagged control. RFP-E3-GFP is a double-tagged E3 in which intramolecular FRET is present. C, intramolecular FRET for intracellular apoE in HEK cells. E4 exhibits a closed conformation, whereas E2 an open conformation, and E3 an intermediate conformation. The R61T mutation on the E4 background results in a conformation similar to E3. Number of independent experiments: intramolecular FRET for E2, E3, E4: 20; R61T: 7. D, intramolecular FRET for intracellular apoE in astrocytes. The conformational differences between the isoforms are similar to what is seen for HEK cells. Number of independent experiments: intramolecular FRET for E2, E3, E4: 15; R61T: 3. Scatter plots indicate the mean ± S.D. Statistical analysis was done through one way ANOVA with post-hoc Tukey's correction. The asterisks on the graphs indicate p values as follows: *** ≤ 0.001. All data were normalized to E3 that was designated as 1 (arbitrary units). In this and all other figures, unless indicated otherwise, each dot represents the mean from one sample from one independent experiment. In each sample, around 1,000,000 events were analyzed through flow cytometry and the mean of those events was calculated for inclusion in the meta-analysis and in the scatter plot.
To assess the intracellular conformational differences between the apoE isoforms, we transiently transfected HEK cells and apoE knock-out (KO) primary immortalized astrocytes with one of each double-tagged apoE constructs. We also transfected cells with apoE singly tagged with either GFP or RFP, and these samples were used as single color controls for the FRET experiment. As a negative control, we co-transfected cells with RFP and GFP plasmids. In this condition, any apparent FRET detected is due to misexcitation or bleed-through in the fluorescence measurements, and it would be expected that true apoE FRET would be higher than that baseline level. As a positive control, we transfected cells with an RFP-GFP fusion plasmid, which we have previously demonstrated provides a strong FRET signal (17). The respective flow cytometry plots from representative samples from HEK cells are demonstrated in Fig. 1B.
Previous work using similar FRET constructs in N2a cells (9) showed that E4 had a closer conformation than E3. We confirmed these observations within both cell types studied (HEK cells and astrocytes); intracellular apoE isoforms exhibited different FRET ratios, with E2 < E3 < E4 (Fig. 1, C and D). We interpreted the results from this experiment to suggest that both within HEK cells and within astrocytes, the N and C termini of E4 are at close proximity (“closed” conformation), the termini of E2 are far apart (“open” conformation), and that E3 has an intermediate conformation. All isoforms exhibited FRET efficiency that was above the levels of the negative control RFP+GFP (Fig. 1, C and D).
Earlier crystallography based models of recombinant N-terminal apoE suggested that apoE4 differs from apoE3 conformation in part because of the presence of a salt bridge between Arg-61 and Glu-255 and that mutation of Arg-61 abolishes this conformation, leading E4 to obtain a conformation resembling E3 (18). To test both this hypothesis in a cellular context and to further validate the conformational information derived from FRET measurements, we introduced the R61T mutation on the E4 background. In both HEK cells and astrocytes, the mutant E4 had FRET efficiency that was at levels similar to the E3 isoform (Fig. 1, C and D), consistent with the observation that the R61T mutation changes the properties of E4 to resemble E3.
HEK- but not astrocyte-secreted apoE maintains a directional FRET efficiency pattern of E2 < E3 < E4
ApoE is a lipoprotein that is important for shuttling lipids among peripheral organs or among cells within the brain, and thus it is thought that the secreted form is functionally the most important. To study the conformation of the secreted protein, we transiently transfected HEK cells and immortalized astrocytes (genetically null for murine apoE) with the double-tagged apoE constructs. Secreted apoE particles are below 1 μm in size and are undetectable by standard flow cytometry; thus, attachment to Dynabeads of a 2.8-μm diameter was necessary to enable their detection (Fig. 2A). Attachment of the secreted apoE particles to the beads was confirmed by fluorescence-based sorting (Fig. 2B). FRET analysis through flow cytometry showed that HEK-secreted apoE isoforms exhibit a conformation pattern similar to the intracellular protein, with E2 having the most open conformation and E4 the most closed conformation (Fig. 2C). The conformation of astrocyte-secreted apoE differed, as E2 and E3 exhibited similar FRET efficiencies, whereas only E4 had a statistically significant higher FRET efficiency in comparison to E3 (Fig. 2D). In both cell lines, the E4 R61T mutant exhibited a decreased FRET level in comparison to wild-type E4, consistent with what had been observed for intracellular protein (Fig. 2, C and D). To confirm that the attachment of secreted apoE to the Dynabeads through the anti-GFP antibody does not alter its conformation, we repeated the same experiment using a goat polyclonal anti-apoE antibody (#AB947, Millipore), which gave a similar pattern of results (Fig. 2E).
Figure 2.

A, diagram illustrating the attachment of secreted apoE lipoparticles to Dynabeads through an anti-GFP antibody. The attachment of secreted apoE to Dynabeads increased the light scatter and fluorescent signal, thus enabling detection with standard flow cytometry instruments. The figure is not in scale. B, flow cytometry plots for secreted apoE from one representative experiment on HEK-secreted apoE. C, FRET ratios of secreted apoE from HEK cells in OMEM without phenol + 5% FBS. The results are similar to what was seen for intracellular apoE. Number of independent experiments: intramolecular FRET for E2, E3, E4: 25; R61T: 3. D, FRET ratios of secreted apoE from astrocytes in DMEM without phenol + 1% Glutamax + 10% FBS. The conformation is similar between the three isoforms, with E4 having a slightly more closed conformation. The E4 R61T mutation resulted in a more open conformation in comparison to E4. Number of independent experiments: intramolecular FRET for E2, E3, E4: 22; R61T: 7. E, FRET ratios of secreted apoE from astrocytes in DMEM without phenol + 1% Glutamax + 10% FBS after attachment to Dynabeads using a polyclonal goat anti-apoE antibody. The results are similar to those seen when using an anti-GFP antibody for attachment, indicating that the attachment of apoE to Dynabeads does not change its conformation. Scatter plots indicate mean ± S.D. in all panels. Statistical analysis was done through one way ANOVA with post hoc Tukey's correction. The asterisks on the graphs indicate p values as follows: * ≤ 0.05, ** ≤ 0.01, *** ≤ 0.001. All data were normalized to E3 that was designated as 1 (arbitrary units). Only significant associations are indicated on the plots.
ApoE-apoE intermolecular interactions are isoform- and cell type-specific and differ between secreted and intracellular apoE
The double-tagged apoE molecules are designed to report intramolecular FRET, but the possibility that they also detect some signal from the interaction of two (double)-tagged apoEs cannot be ruled out. To directly examine whether apoE-apoE intermolecular interactions occur, we co-transfected HEK cells and astrocytes with single-tagged versions of the apoE plasmids of the same isoform with one tag placed either on the C or N terminus. We assessed the intermolecular interactions between C+C, N+C, and N+N termini using the following transfection combinations: apoE-RFP+apoE-GFP, RFP-apoE+apoE-GFP, and RFP-apoE+GFP-apoE at a 1:1 transfection ratio (Fig. 3A).
Figure 3.

A, diagram illustrating the intermolecular FRET between two apoE molecules. One terminus in each molecule is tagged with either GFP or RFP. When the termini are sufficiently close, energy transfer occurs from GFP to RFP, and the fluorescence emission ratio of RFP to GFP can be used to infer how close together the two termini are. The intermolecular interactions between C+C, C+N, and N+N termini can be assessed using various transfection combinations. B, intermolecular FRET for HEK intracellular apoE (n = 6 independent experiments). C, intermolecular FRET for astrocyte intracellular apoE (n = 6 independent experiments). D, intermolecular FRET for HEK-secreted apoE (n = 5 independent experiments). E, intermolecular FRET for astrocyte-secreted apoE (n = 7 independent experiments). In B–E, we assessed the intermolecular interactions between C+C, N+C, and N+N termini using the following transfection combinations, respectively: apoE-RFP+apoE-GFP, RFP-apoE+apoE-GFP, RFP-apoE+GFP-apoE at a 1:1 transfection ratio (HEK: 0.33 μg/cm2 each for the intracellular apoE and 0.24 μg/cm2 each for the secreted apoE; astrocytes: 0.48 μg/cm2 each for the intracellular apoE and 0.17 μg/cm2 each for the secreted apoE). The results from these experiments suggest that the intermolecular interactions of apoE are isoform- and cell type-specific and that E4 exhibits stronger intermolecular interactions between its C+C and C+N termini that E3 and E2. Thus, the E4 lipoparticles are structurally different from the E2 and E3 lipoparticles. F, flow cytometry plots from a representative experiment on HEK-secreted apoE. The population of FRET-positive beads is tight and homogeneous, indicating that the intermolecular interactions are not caused by aggregation of apoE particles on the beads. G, comparison of intermolecular FRET results between the C termini of wild-type E3 and E3 5mutant within HEK cells (n = 3 independent experiments) (G), astrocyte cells (n = 4 independent experiments) (H), HEK-secreted apoE (n = 5 independent experiments) (I), and astrocyte-secreted apoE (n = 5 independent experiments) (J). In G–I, the mutant E3 exhibits significantly reduced C+C intermolecular interactions in comparison to the wild-type version, whereas the same effect is not seen for astrocyte-secreted apoE. Scatter plots indicate mean ± S.D. Statistical analysis was done through one way ANOVA with post hoc Tukey's correction. The asterisks on the graphs indicate p values as follows: * ≤ 0.05, ** ≤ 0.01, *** ≤ 0.001.
The results from those experiments suggest that intracellular and secreted apoE produced from HEK cells and astrocytes displays intermolecular interactions (Fig. 3, B–D). They also indicate that the tertiary and quaternary structures of apoE particles substantially differ between isoforms. When comparing the interactions between corresponding combinations of the apoE termini, intermolecular FRET was higher for E4 and lower for E2, with E3 adopting intermediate FRET levels. In particular, E4 exhibited significantly stronger interactions between its C+C and N+C termini compared with E2 in all conditions studied. Intermolecular FRET was not a result of aggregation of apoE particles on the Dynabeads, as the FRET-positive population seen on the flow cytometry plots was tight and homogeneous (Fig. 3F).
To further explore the nature of the intermolecular interactions, we cloned a plasmid encoding the E3 isoform with five mutations in the C-terminal region (“E3 5mutant”) that have been previously shown through biophysical experiments to diminish intermolecular interactions of apoE (20). Consistent with these observations, we found that E3 5mutant does not form as strong C-terminal intermolecular interactions as the wild-type E3 within HEK cells and astrocytes and in HEK-secreted apoE (Fig. 3, G–I). However, astrocyte-secreted apoE behaved differently as there was a trend for stronger intermolecular interactions of the mutated isoform in comparison to wild-type E3 (Fig. 3J). These data support the interpretation that there are intermolecular interactions between wild-type apoE molecules but also reinforce the differential nature of apoE interactions under different cell conditions.
Secreted apoE exhibits isoform-specific differences in lipidation
It is widely accepted that secreted apoE is a lipoprotein and that its lipidation status is important for it to maintain its physiological structure (7, 21). However, studies of the lipidation status of brain-derived apoE have been challenging because of the low lipidation levels of centrally in comparison to liver-produced apoE (22). Thus, most studies to date have focused on the general lipid contents of the whole conditioned medium (CM) from cells producing a particular apoE isoform rather than on apoE-specific lipidation (23). For example, some data suggest that E4 is less lipidated than E2 and E3 (13, 21), but this has been contradicted by other studies (22).
To study the lipidation of secreted apoE and to assess whether differences in lipidation correlate with conformational differences between apoE isoforms, we developed a novel flow cytometry-based lipidation assay. In this assay, we attached tagged apoE secreted from HEK cells or astrocytes to Dynabeads. We then incubated the Dynabeads with various lipid dyes followed by analysis through flow cytometry. We calculated the ratio of lipid content per apoE molecule by dividing the mean fluorescence intensity (MFI) of the lipid dye to the MFI of the fluorophore tagged to apoE.
As a first approach, we examined whether lipid dyes bound beads in an apoE-dependent fashion. We expressed GFP-tagged apoE and captured it on beads with an anti-GFP antibody, so that we could simultaneously determine the amount of apoE (i.e. GFP) and the amount of lipid dye on each bead. We assessed lipid content using the well-characterized lipid sensor, 1,1′-dioctadecyl-3,3,3′,3′-tetramethylindodicarbocyanine perchlorate (DiD), which becomes fluorescent in the presence of lipids. With the ratios of protein to beads we used, in any given preparation, some beads contained detectable apoE fluorescence and others did not. Only a small proportion of Dynabeads was positive for apoE (supplemental Fig. S1). As expected, the MFI for DiD was significantly higher in the apoE(+) population in comparison to the apoE(−) population of beads (Fig. 4A), consistent with there being little nonspecific binding of the lipid dyes to the beads. This analysis showed that lipidation adopts a directional pattern for HEK- and astrocyte-secreted apoE with E4 being the most lipidated isoform, E2 being the least lipidated, and E3 having an intermediate lipidation content (Fig. 4B). In addition, the lipidation results were not dependent on whether the fluorescent tag was present on the N or C terminus of apoE (data not shown); thus, results from those experiments were pooled together for the meta-analysis.
Figure 4.

A, normalized MFI levels for DiD for each of the cell types for apoE(+) and apoE(−) Dynabead populations within one sample. The apoE analyzed in those experiments was secreted from HEK cells and astrocytes that were transfected with tagged apoE. ApoE(+) populations had significantly higher levels of lipid dyes in comparison to the apoE(−) populations. B, total lipid contents normalized to apoE amount in apoE(+) populations for each of the cell types. The apoE analyzed in those experiments was secreted from HEK cells and astrocytes that were transfected with tagged apoE. E4 is the most lipidated and E2 the least lipidated isoform. C, normalized MFI levels for each of the lipid dyes (filipin, MB, DiD) for apoE(+) and apoE(−) Dynabead populations within one sample. The apoE used in these experiments was untagged and was secreted from primary immortalized astrocytes expressing human apoE at endogenous levels. apoE(+) populations have significantly higher levels of lipid dyes in comparison to the apoE(−) populations. D, lipid contents (cholesterol, phospholipid-PE, total lipids) normalized to apoE amount in apoE(+) populations for each of the cell types. The apoE used in these experiments was untagged and was secreted from primary immortalized astrocytes expressing human apoE at endogenous levels. Tagged apoE: each of these experiments for DiD was repeated nine times for HEK cells and seven times for astrocytes. Untagged apoE: each of the experiments was repeated eight times. Scatter plots indicate the mean ± S.D. Statistical analysis was done through one way ANOVA with post-hoc Tukey's correction. The asterisks on the graphs indicate p values as follows: * ≤ 0.05. Only significant associations are indicated on the plots.
To develop methods to examine other classes of lipid dyes and to determine appropriate experimental conditions, we performed two lipidation gradient experiments. As a source of lipids, we used intact astrocyte cells that are known to express on their surface cholesterol and phospholipids in large quantities. These cells were fixed in 2% paraformaldehyde (PFA), and the lipid gradient experiments were analyzed through flow cytometry. In the first experiment we used a stable concentration of DiD, Marina Blue 1,2-dihexadecanoyl-sn-glycero-3-phosphoethanolamine (MB) (a phosphatidylethanolamine analogue), or filipin (a cholesterol lipid dye), and a serial dilution of cells. In the second experiment we used a stable concentration of cells and a serial dilution of lipid dye. These experiments showed that all three lipid dyes follow a linear dose-response curve (supplemental Fig. S2, A and B).
To assess whether the presence of the large fluorescent tags affects the lipidation status of apoE, we completed the lipidation experiments using apoE secreted from primary mouse immortalized astrocytes expressing human untagged E2, E3, and E4 (24). Secreted apoE was attached to Dynabeads using a polyclonal goat anti-apoE antibody. We expected, based on the GFP data, that only a minority of beads might contain apoE; to tag those beads and ascertain the concentrations of apoE on the beads, we then incubated with an antibody against the N terminus of apoE that was tagged with either DyLight594 or DyLight488, to complement the fluorescent properties of the lipid dyes. Finally, beads were incubated with the various lipid dyes. Flow cytometry analysis showed that apoE maintained its lipidation, with apoE(+) Dynabeads exhibiting much a higher lipid dye MFIs in comparison to apoE(−) Dynabeads (Fig. 4C). However, these assays showed less differential in lipid content among isoforms, with the pattern of E2 < E3 < E4 clear only for filipin. Lipidation patterns as determined with the DiD and MB dyes appeared to be not dependent on isoform (Fig. 4D). These data suggest that isoform-dependent lipidation measures are dependent on experimental conditions, consistent with previous literature showing discrepant results under different experimental circumstances.
Discussion
In this study we developed a novel system to study the conformation and interactions of intracellular and secreted apoE. We generated a series of plasmids encoding apoE with an RFP and a GFP tag on its N and C termini, respectively, placing a signal peptide before the N-terminal tag to ensure secretion of the double-tagged protein. Using this system we showed that the conformation of intracellular apoE adopts a directional pattern with E4 having the most closed conformation and E2 having the most open conformation. However, this pattern was not maintained upon secretion of apoE from astrocytes, in which condition the conformational differences between isoforms are diminished. We also showed that apoE molecules exhibit significant intermolecular interactions and that the structure of apoE particles is altered upon secretion, differs between isoforms, and is cell type-specific. Finally, we suggest that the extent of apoE lipidation can vary, dependent on cell, isoform, and experimental conditions.
Our findings on the conformation of intracellular apoE are consistent with previous studies. We confirmed the conformation of intracellular E3 and E4, which has been previously described using CFP/YFP FRET assays either within N2A (neuronal) cells comparing E3 and E4 or on E3 and E4 in non-physiological systems (9, 10) and is consistent with previous X-ray crystallography studies on the conformation of E3 and E4 (3, 7, 25, 26). In addition, introduction of the E4 R61T mutation thought to disrupt domain interactions between the N and C termini resulted in a more open E4 conformation, as previously predicted (18). Thus, the FRET assay appears to reliably report, at least directionally, differences in apoE conformation.
We then used this system to extend the measurements to secreted apoE and to study the intermolecular interactions and lipid association patterns of the protein. Our analysis suggested that HEK-secreted apoE maintained its intracellular conformation. However, this effect was not seen in apoE secreted from astrocytes where isoforms had similar conformations. This suggests that there are marked differences between the two cell types, at least in terms of apoE conformation, and thus caution is indicated when using data from HEK cells to make conclusions about the biology of apoE within the brain.
Analysis of intermolecular interactions between apoE molecules gave us insight into the structure of apoE particles and differences between HEK cells and astrocytes, both intracellularly and after secretion. Intermolecular FRET experiments suggested that the structure of apoE complexes is isoform-specific. Specifically, interactions between E4 molecules were much stronger than between E2 and E3 molecules. These data suggest that E4 molecules are either at closer proximity to each other or that several E4 molecules come together to form larger complexes in comparison to E2 and E3. Previous biochemical findings have suggested that apoE forms large complexes without isoform-specific differences (13) but that E4 is unable to form disulfide bonds (11), suggesting that interactions between E4 molecules follow a different mechanism. In addition, for secreted apoE in our conditions, our data support the model according to which two apoE molecules surround a lipoparticle (7, 14); if the alternative single molecule model (15, 16) was true, there would be no intermolecular interactions.
Even though efforts have been previously made to study the conformation of apoE using FRET assays (9, 27), our assay is novel in several ways. First, this is the first time that the conformation of all three apoE isoforms has been studied both within the cells and after secretion. Second, it is the first time that the conformation of apoE has been directly compared between cell types (HEK cells and astrocytes), which indicated important differences between the two cell types. Third, this FRET assay was used to study the intermolecular interactions between apoE molecules and to compare the interactions between C+C, C+N, and N+N termini, thus gaining insight into the structure of apoE complexes.
Finally, we analyzed the lipid content of secreted apoE because we hypothesized that lipidation differences contribute to the conformational and structural differences between apoE particles. The lipidation analysis suggested that apoE-specific lipidation is isoform-dependent and cell type-dependent, with E4 in general being the most lipidated isoform. Our observations differ from the majority of previous studies on plasma lipoproteins in which E4 is the least lipidated isoform (13, 21). Interestingly, one study undertaken on apoE secreted from primary immortalized astrocytes similar to the ones used in our study also indicated that E4 is more lipidated in regard to cholesterol and phospholipids (22). Thus, it appears that apoE-lipid interactions in CNS particles are regulated in a different fashion compared with peripheral apoE lipoproteins.
There are still several unanswered questions. Our results indicate that the lipidation status of astrocyte derived apoE differs from that of peripheral apoE, yet the mechanism that drives that difference is unknown. How the single amino acid changes that differentiate apoE2, apoE3, and apoE4 contribute to the conformational and lipid-binding alterations in the phenotype observed here may require detailed biophysical experiments; our observation that these parameters depend on cell type and lipid profiles emphasizes the importance of using physiologically relevant preparations for such studies. Whether the differences in conformation or lipidation status directly contribute to differential interactions with apoE-associated proteins such as apoA1, apoA2, and amyloid β or with receptor interactions remains largely unknown; the current assay may provide a tool to begin to explore some of these relationships. In addition, these results suggest that various apoE preparations may differ in fundamental characteristics based on how the molecules were prepared, perhaps helping to explain a divergent literature on apoE biology (e.g. see Ref. 28), especially when measured in vitro. Finally, our FRET assay can only compare how close or far apart the N and C termini are between apoE isoforms; an understanding of secondary structural features within the protein would require additional biophysical studies.
In conclusion, apoE appears to have considerable conformational flexibility, dependent on cell type, presence of apoE on lipoprotein particles, and likelihood of apoE-apoE intermolecular interactions. The apoE isoforms have differences in their conformation, intermolecular interactions, and lipid profiles. The consistent conformational differences of E2, E3, and E4 parallel the impact of those isoforms on disease risk in Alzheimer's disease and possibly other neurodegenerative illnesses. We speculate that the conformational or lipid profiles we observed in astrocyte-derived apoE contribute to these allele-specific risks for CNS disease.
Experimental procedures
Constructs
The RFP cDNA was cloned into the eGFP-N3 vector (Clontech) using restriction enzymes NheI and XhoI to create the RFP-eGFP vector. The cDNA of human apoE2, -E3, and -E4 (nucleotides 55-end) was cloned into the pRFP-eGFP vector using AgeI restriction site. The apoE secretion-signaling peptide (nucleotides 1–54) was synthesized de novo (Eurofins Genomics) and was inserted in the aforementioned construct using restriction enzymes EcoR1 and Kpn1. The apoE4 R61T construct, which was previously described (24), was cloned into the p(E1–54)-RFP-apoE3(55-end)-eGFP vector using the Blp1/EcoN1 restriction enzymes.
To construct the pE1–54-RFP-apoE(55-end) constructs, the E1–54-RFP-apoE(55-end) fragment was amplified by PCR using the p(E1–54)-RFP-apoE(55-end)-eGFP vector as a template in order to remove the eGFP region. The constructs pE1–54-GFP-apoE(55-end), pE1–54-apoE(55-end)-RFP, and pE1–54-apoE(55-end)-GFP were constructed using similar strategies.
To construct the pE1–54-apoE3(55-end) 5mutant-RFP and pE1–54-apoE3(55-end) 5mutant-GFP constructs, the fragment containing the 5 mutations was synthesized de novo (Eurofins Genomics) and was inserted in the respective wild-type versions of the constructs using restriction enzymes EcoR1 and BsrG1.
Tissue culture
HEK 293 cells were maintained in OMEM (#31985-088, ThermoFisher Scientific) supplemented with 5% fetal bovine serum (FBS) (#16000044, ThermoFisher Scientific) and 100 units/ml penicillin + 100 μg/ml streptomycin (#15140122, ThermoFisher Scientific). ApoE KO primary immortalized mouse astrocytes (24) were maintained in advanced DMEM (#12491-015, ThermoFisher Scientific) supplemented with 10% FBS (#16000044, ThermoFisher Scientific), 2 mm Glutamax (#35050061, ThermoFisher Scientific), and 100 μg/ml Geneticin (#10131035, ThermoFisher Scientific). Transfections for both cell lines were done with Lipofectamine 2000 (#11668019, ThermoFisher Scientific) according to the manufacturer's instructions. The aforementioned media were used when analyzing FRET in intracellular apoE. Culture conditions were optimized for analysis of FRET of secreted apoE: astrocytes were incubated in DMEM (#31053-036, ThermoFisher Scientific) + 2 mm glutamax + 10%FBS, whereas HEK cells were incubated in OMEM (#11058-21, ThermoFisher Scientific) + 5% FBS. The medium used for the flow cytometry of secreted apoE was always free of phenol in order to reduce background fluorescence.
Preparation of cells for flow cytometry
For each experiment, in addition to cells expressing the double-tagged apoE, cells expressing apoE singly tagged with either GFP or RFP were prepared. Cells were plated in 6-well plates, transfected, and collected 36 h after transfection as follows; the cells were washed with PBS (#14190-250, ThermoFisher Scientific), trypsinized, pelleted, and fixed in 2% PFA for 10 min and resuspended in 400–700 μl of PBS without Ca2+ or Mg2+ and analyzed within 24 h as previously described (29).
Preparation of CM for flow cytometry
As controls for each experiment, cells expressing apoE singly tagged with either GFP or RFP were prepared. Cells were plated in T75 flasks. 3–4 days after transfection, the CM was collected, centrifuged at 1500 rpm for 10 min to remove any floating cells, and concentrated to 1 ml using 10-kDa 15-ml Amicon concentration columns (#UFC901024, Millipore). RFP-apoE-GFP double-tagged proteins were immobilized onto protein G Dynabeads (#10007D, ThermoFisher Scientific) overnight at 4 °C with rotation using 1 μg of a polyclonal rabbit anti-GFP antibody (#AB6556, Abcam) followed immediately by flow cytometry. 4 μl of a polyclonal goat anti-apoE antibody (#AB947, Millipore) were used for the samples containing apoE not tagged with GFP.
Lipidation experiments (tagged apoE)
For the lipidation experiments, we transfected cells with apoE tagged on its N or C terminus with GFP. Within the same experiment, all samples had the fluorescent tag on the same terminus. We collected the CM after 3 days of incubation, concentrated it 15-fold using 10-kDa concentration columns, and attached it overnight to Dynabeads using a polyclonal anti-GFP antibody (#AB6556, Abcam). The following day we incubated the beads with DiD (#D7757, Life Technologies) for 30 min. DiD is a far red lipid dye that binds to all lipids. The stock solution was prepared in 100% EtOH. The concentration of DiD in the CM samples was 10 μg/ml. GFP was selected as a tag for apoE to minimize the bleed-through between the two colors. The HEK cells were grown in OMEM + 5%FBS without phenol, and the astrocytes in DMEM + 10% FBS + 2 mm Glutamax without phenol. As a single tagged control, we used CM from cells expressing untagged apoE attached through a polyclonal anti-apoE antibody (#AB947, Millipore) to the beads and incubated with the dye of choice. We also used apoE single-tagged with the fluorophore of choice (RFP or GFP) but without dye. Finally, we had CM from untransfected cells that was incubated with Dynabeads with anti-GFP antibody as a negative control.
Lipidation experiments (untagged apoE)
Primary immortalized astrocytes expressing human untagged apoE at physiological levels were plated in T75 flasks, fed with DMEM + 10% FBS + 2 mm Glutamax without phenol and incubated for 3 days. The CM was collected, and any floating cells were removed through centrifugation at 1500 rpm for 10 min. The CM was then concentrated 15-fold using 10-kDa 15-ml Amicon concentration columns (#UFC901024, Millipore) and was attached to protein G Dynabeads (#10007D, ThermoFisher Scientific) overnight at 4 °C with rotation using 4 μl of a polyclonal goat anti-apoE antibody (#AB947, Millipore). Afterward, these samples were incubated for 6–9 h with an antibody specific against the N terminus of the protein (6C5, Ottawa Heart Institute) (30) at a concentration of 0.02 μg/μl. Before incubation, this antibody was conjugated to either Dylight594 (#46413, ThermoFisher Scientific) or Dylight488 (#46403, ThermoFisher Scientific) as per the manufacturer's instructions. Unbound dye was removed through Slide-A-Lyzer dialysis cassettes 3.5K molecular weight cutoff, 0.5 ml (#66333, ThermoFisher Scientific). DiD was added to the samples with the 488 tag. Filipin iii (#F4767, Sigma) (blue) that binds to cholesterol was added to the samples with the 594 tag. We also incubated CM samples with the 594 tag with MB (#M12652, Life Technologies) (blue), a phospholipid analogue. The stock solutions of these dyes were prepared in 100% EtOH. The concentrations of the dyes in the CM samples were 100 μg/ml for filipin and MB and 10 μg/ml for DiD. The fluorophore (488 or 594) that was used as a tag on apoE was selected based on the lipid dye used to minimize bleed-through between the two colors. After the addition of the dye, the samples were incubated at 4 °C with rotation for 30 min before flow cytometry.
Flow cytometry
Right before analysis, the samples were filtered through a 35-μm cell strainer (#352235, Corning). The samples were analyzed using two custom Fortessa analyzers (BD Biosciences) with spatially separated laser beams. For FRET measurements, a 488-nm laser was used for excitation, and fluorescence was detected using 525/50-nm and 610/20-nm emission filters for GFP and RFP, respectively. RFP intensity and intensity of the 594 tag were measured using a 610/20-nm emission filter after excitation with a 561-nm laser. GFP intensity and intensity of the 488 tag were measured using a 488-nm laser and a 525/50-nm emission filter. Far red intensities were measured using a 640-nm laser and a 670/14-nm emission filter. Blue fluorescence intensities were measured using a 355-nm UV laser and a 450/50-nm emission filter. On the order of 1,000,000 events were recorded for each sample.
Analysis of flow cytometry data
For the analysis of cellular FRET data, the single events (cells) were first gated using the FSC-A/FSC-H plots. Then FRET-positive events were determined on the RFP/GFP plots after gating for the single-tagged apoE-GFP and apoE-RFP controls. The RFP and GFP coordinates for single events were extracted, and the FRET values were determined for each sample according to the following equation (representing the average FRET ratio).
| (Eq. 1) |
where n is the number of FRET-positive events analyzed.
The analysis procedure was similar for FRET in secreted apoE, with an additional control of untagged apoE included to gate out nonspecific signal.
For the analysis of lipidation data, the single color controls were used to set the compensations and to gate for apoE-positive and dye-positive populations. MFIs were calculated for the lipid dyes in the apoE(+) and apoE(−) populations. MFI for RFP or GFP was calculated in the apoE(+) population. The lipidation ratio for each sample was calculated using the following formula.
| (Eq. 2) |
Lipid gradient experiments
Primary immortalized astrocytes with apoE KO were cultured in 17 T75 flasks. When they got confluent, they were trypsinized, pelleted, and fixed in 2% PFA in suspension. For the cell gradient experiments, the stock suspension of cells was diluted 37.5:100 in PBS(−)(−). This suspension was further diluted 1:1, 1:3, 1:7, 1:15, 1:31 for the filipin and MB experiments. An undiluted sample and a sample containing only PBS were also used. These samples were incubated with 100 μg/ml filipin or MB at 4 °C for 30 min. For the DiD experiments, the dilutions used were 1:1, 1:3, 1:5, 1:7, 1:15, and 1:31, in addition to a sample with only PBS. These samples were incubated with rotation at 4 °C for 30 min with 10 μg/ml DiD. The lipid dye concentrations used in these experiments were the same as those used in the lipidation experiments described above.
For the lipid dye gradient experiments, the stock cell suspension was diluted 25:100, and this was incubated with rotation at 4 °C for 30 min with the following concentrations of lipid dyes: DiD: 0.013, 0.01, 0.007, 0.005, 0.003, 0.002, 0.001, 0.0005 mg/ml; filipin: 0.3, 0.2, 0.1, 0.05, 0.025, 0.01 mg/ml; MB: 0.2, 0.1, 0.07, 0.03, 0.017 mg/ml.
Statistical analyses
All experiments were performed at least three times, and the number of independent experiments is indicated in each figure. All results are reported as the mean ± S.D. The data from independent experiments was meta-analyzed after normalization to the E3 data. Statistical analysis using a one way ANOVA followed by Tukey's post hoc test was performed. GraphPad Prism version 5 was used.
Author contributions
B. T. H., E. K., E. H., and S. W. designed the study. B. T. H. supervised the study and obtained the funding. S. W., K. A. K., M. M., C. C. L., R. M., and O. B. provided experimental advice and contributed unpublished tools and reagents. E. K., J. D. M., and J. A. K. performed tissue culture, flow-FRET experiments, and lipidation experiments. A. D. R., E. K., J. D. M., and J. A. K. performed the biochemistry experiments. Z. F. and E. K performed the cloning. K. A. K. optimized the astrocyte transfections. E. K. and B. T. H. wrote the manuscript. All authors reviewed and critiqued the manuscript.
Supplementary Material
Acknowledgments
Cytometric findings reported here were performed in the Massachusetts General Hospital Department of Pathology Flow and Image Cytometry Research Core, which obtained support from the National Institutes of Health Shared Instrumentation program with Grants 1S10OD012027-01A1, 1S10OD016372-01, 1S10RR020936-01, and 1S10RR023440-01A1.
This work was supported, in whole or in part, by National Institutes of Health Grants AG15379 and AG044486 (to O. B.). This work was supported by an EMBO Long-term Fellowship (ATLF-815-2014), which is co-funded by the Marie Curie Actions of the European Commission (LTFCOFUND2013, GA-2013-609409) (to E. K.), the Japan Society for the Promotion of Science fellowship (to M. M.), the Kyoto University Foundation fellowship (to M. M.), and the JPB Foundation (B. T. H.). This work was supported in part by a sponsored research agreement from Abbvie and from a grant from F Prime. The content is solely the responsibility of the authors and does not necessarily represent the official views of the National Institutes of Health.
This article contains supplemental Figs. S1 and S2.
- RFP
- red fluorescent protein
- MFI
- mean fluorescence intensity
- PFA
- paraformaldehyde
- CM
- conditioned medium
- MB
- Marina Blue 1,2-dihexadecanoyl-sn-glycero-3-phosphoethanolamine
- DiD
- 1,1′-dioctadecyl-3,3,3′,3′-tetramethylindodicarbocyanine perchlorate
- eGFP
- enhanced GFP
- ANOVA
- analysis of variance.
References
- 1. Weisgraber K. H. (1994) Apolipoprotein E: structure-function relationships. Adv. Protein Chem. 45, 249–302 [DOI] [PubMed] [Google Scholar]
- 2. Morrow J. A., Hatters D. M., Lu B., Hochtl P., Oberg K. A., Rupp B., and Weisgraber K. H. (2002) Apolipoprotein E4 forms a molten globule. A potential basis for its association with disease. J. Biol. Chem. 277, 50380–50385 [DOI] [PubMed] [Google Scholar]
- 3. Dong L. M., Wilson C., Wardell M. R., Simmons T., Mahley R. W., Weisgraber K. H., and Agard D. A. (1994) Human apolipoprotein E: role of arginine 61 in mediating the lipoprotein preferences of the E3 and E4 isoforms. J. Biol. Chem. 269, 22358–22365 [PubMed] [Google Scholar]
- 4. Liu M., Kuhel D. G., Shen L., Hui D. Y., and Woods S. C. (2012) Apolipoprotein E does not cross the blood-cerebrospinal fluid barrier, as revealed by an improved technique for sampling CSF from mice. Am. J. Physiol. Regul. Integr. Comp. Physiol. 303, R903–R908 [DOI] [PMC free article] [PubMed] [Google Scholar]
- 5. Grehan S., Tse E., and Taylor J. M. (2001) Two distal downstream enhancers direct expression of the human apolipoprotein E gene to astrocytes in the brain. J. Neurosci. 21, 812–822 [DOI] [PMC free article] [PubMed] [Google Scholar]
- 6. Corder E. H., Saunders A. M., Risch N. J., Strittmatter W. J., Schmechel D. E., Gaskell P. C. Jr., Rimmler J. B., Locke P. A., Conneally P. M., and Schmader K. E. (1994) Protective effect of apolipoprotein E type 2 allele for late onset Alzheimer disease. Nat. Genet. 7, 180–184 [DOI] [PubMed] [Google Scholar]
- 7. Hatters D. M., Peters-Libeu C. A., and Weisgraber K. H. (2006) Apolipoprotein E structure: insights into function. Trends Biochem. Sci. 31, 445–454 [DOI] [PubMed] [Google Scholar]
- 8. Chou C. Y., Lin Y. L., Huang Y. C., Sheu S. Y., Lin T. H., Tsay H. J., Chang G. G., and Shiao M. S. (2005) Structural variation in human apolipoprotein E3 and E4: secondary structure, tertiary structure, and size distribution. Biophys. J. 88, 455–466 [DOI] [PMC free article] [PubMed] [Google Scholar]
- 9. Xu Q., Brecht W. J., Weisgraber K. H., Mahley R. W., and Huang Y. (2004) Apolipoprotein E4 domain interaction occurs in living neuronal cells as determined by fluorescence resonance energy transfer. J. Biol. Chem. 279, 25511–25516 [DOI] [PubMed] [Google Scholar]
- 10. Hatters D. M., Budamagunta M. S., Voss J. C., and Weisgraber K. H. (2005) Modulation of apolipoprotein E structure by domain interaction: differences in lipid-bound and lipid-free forms. J. Biol. Chem. 280, 34288–34295 [DOI] [PubMed] [Google Scholar]
- 11. Elliott D. A., Halliday G. M., and Garner B. (2010) Apolipoprotein-E forms dimers in human frontal cortex and hippocampus. BMC Neurosci. 11, 23. [DOI] [PMC free article] [PubMed] [Google Scholar]
- 12. Rebeck G. W., Alonzo N. C., Berezovska O., Harr S. D., Knowles R. B., Growdon J. H., Hyman B. T., and Mendez A. J. (1998) Structure and functions of human cerebrospinal fluid lipoproteins from individuals of different APOE genotypes. Exp. Neurol. 149, 175–182 [DOI] [PubMed] [Google Scholar]
- 13. Fu Y., Zhao J., Atagi Y., Nielsen H. M., Liu C. C., Zheng H., Shinohara M., Kanekiyo T., and Bu G. (2016) Apolipoprotein E lipoprotein particles inhibit amyloid-β uptake through cell surface heparan sulphate proteoglycan. Mol. neurodegener. 11, 37. [DOI] [PMC free article] [PubMed] [Google Scholar]
- 14. Peters-Libeu C. A., Newhouse Y., Hatters D. M., and Weisgraber K. H. (2006) Model of biologically active apolipoprotein E bound to dipalmitoylphosphatidylcholine. J. Biol. Chem. 281, 1073–1079 [DOI] [PubMed] [Google Scholar]
- 15. Davidson W. S., and Silva R. A. (2005) Apolipoprotein structural organization in high density lipoproteins: belts, bundles, hinges and hairpins. Curr. Opin. Lipidol. 16, 295–300 [DOI] [PubMed] [Google Scholar]
- 16. Fisher C. A., Narayanaswami V., and Ryan R. O. (2000) The lipid-associated conformation of the low density lipoprotein receptor binding domain of human apolipoprotein E. J. Biol. Chem. 275, 33601–33606 [DOI] [PubMed] [Google Scholar]
- 17. Uemura K., Lill C. M., Li X., Peters J. A., Ivanov A., Fan Z., DeStrooper B., Bacskai B. J., Hyman B. T., and Berezovska O. (2009) Allosteric modulation of PS1/γ-secretase conformation correlates with amyloid β(42/40) ratio. PloS ONE 4, e7893. [DOI] [PMC free article] [PubMed] [Google Scholar]
- 18. Raffai R. L., Dong L. M., Farese R. V. Jr, and Weisgraber K. H. (2001) Introduction of human apolipoprotein E4 “domain interaction” into mouse apolipoprotein E. Proc. Natl. Acad. Sci. U.S.A. 98, 11587–11591 [DOI] [PMC free article] [PubMed] [Google Scholar]
- 19. Deleted in proof.
- 20. Chen J., Li Q., and Wang J. (2011) Topology of human apolipoprotein E3 uniquely regulates its diverse biological functions. Proc. Natl. Acad. Sci. U.S.A. 108, 14813–14818 [DOI] [PMC free article] [PubMed] [Google Scholar]
- 21. Tai L. M., Mehra S., Shete V., Estus S., Rebeck G. W., Bu G., and LaDu M. J. (2014) Soluble apoE/Aβ complex: mechanism and therapeutic target for APOE4-induced AD risk. Mol. neurodegener. 9, 2. [DOI] [PMC free article] [PubMed] [Google Scholar]
- 22. DeMattos R. B., Brendza R. P., Heuser J. E., Kierson M., Cirrito J. R., Fryer J., Sullivan P. M., Fagan A. M., Han X., and Holtzman D. M. (2001) Purification and characterization of astrocyte-secreted apolipoprotein E and J-containing lipoproteins from wild-type and human apoE transgenic mice. Neurochem. Int. 39, 415–425 [DOI] [PubMed] [Google Scholar]
- 23. Morikawa M., Fryer J. D., Sullivan P. M., Christopher E. A., Wahrle S. E., DeMattos R. B., O'Dell M. A., Fagan A. M., Lashuel H. A., Walz T., Asai K., and Holtzman D. M. (2005) Production and characterization of astrocyte-derived human apolipoprotein E isoforms from immortalized astrocytes and their interactions with amyloid-β. Neurobiol. Dis. 19, 66–76 [DOI] [PubMed] [Google Scholar]
- 24. Hashimoto T., Serrano-Pozo A., Hori Y., Adams K. W., Takeda S., Banerji A. O., Mitani A., Joyner D., Thyssen D. H., Bacskai B. J., Frosch M. P., Spires-Jones T. L., Finn M. B., Holtzman D. M., and Hyman B. T. (2012) Apolipoprotein E, especially apolipoprotein E4, increases the oligomerization of amyloid β peptide. J. Neurosci. 32, 15181–15192 [DOI] [PMC free article] [PubMed] [Google Scholar]
- 25. Dong L. M., Parkin S., Trakhanov S. D., Rupp B., Simmons T., Arnold K. S., Newhouse Y. M., Innerarity T. L., and Weisgraber K. H. (1996) Novel mechanism for defective receptor binding of apolipoprotein E2 in type III hyperlipoproteinemia. Nat. Struct. Biol. 3, 718–722 [DOI] [PubMed] [Google Scholar]
- 26. Dong L. M., and Weisgraber K. H. (1996) Human apolipoprotein E4 domain interaction: arginine 61 and glutamic acid 255 interact to direct the preference for very low density lipoproteins. J. Biol. Chem. 271, 19053–19057 [DOI] [PubMed] [Google Scholar]
- 27. Chen H. K., Liu Z., Meyer-Franke A., Brodbeck J., Miranda R. D., McGuire J. G., Pleiss M. A., Ji Z. S., Balestra M. E., Walker D. W., Xu Q., Jeong D. E., Budamagunta M. S., Voss J. C., Freedman S. B., et al. (2012) Small molecule structure correctors abolish detrimental effects of apolipoprotein E4 in cultured neurons. J. Biol. Chem. 287, 5253–5266 [DOI] [PMC free article] [PubMed] [Google Scholar]
- 28. LaDu M. J., Stine W. B. Jr, Narita M., Getz G. S., Reardon C. A., and Bu G. (2006) Self-assembly of HEK cell-secreted apoE particles resembles apoE enrichment of lipoproteins as a ligand for the LDL receptor-related protein. Biochemistry 45, 381–390 [DOI] [PMC free article] [PubMed] [Google Scholar]
- 29. Holmes B. B., Furman J. L., Mahan T. E., Yamasaki T. R., Mirbaha H., Eades W. C., Belaygorod L., Cairns N. J., Holtzman D. M., and Diamond M. I. (2014) Proteopathic tau seeding predicts tauopathy in vivo. Proc. Natl. Acad. Sci. U.S.A. 111, E4376–E4385 [DOI] [PMC free article] [PubMed] [Google Scholar]
- 30. Jones P. B., Adams K. W., Rozkalne A., Spires-Jones T. L., Hshieh T. T., Hashimoto T., von Armin C. A., Mielke M., Bacskai B. J., and Hyman B. T. (2011) Apolipoprotein E: isoform specific differences in tertiary structure and interaction with amyloid-β in human Alzheimer brain. PloS ONE 6, e14586. [DOI] [PMC free article] [PubMed] [Google Scholar]
Associated Data
This section collects any data citations, data availability statements, or supplementary materials included in this article.