

Abstract
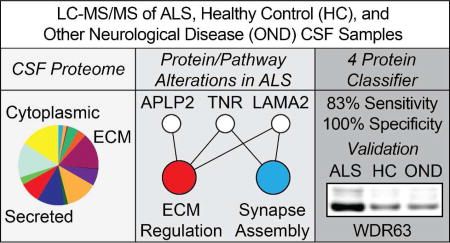
Analysis of the cerebrospinal fluid (CSF) proteome has proven valuable to the study of neurodegenerative disorders. To identify new protein/pathway alterations and candidate biomarkers for amyotrophic lateral sclerosis (ALS), we performed comparative proteomic profiling of CSF from sporadic ALS (sALS), healthy control (HC), and other neurological disease (OND) subjects using label-free liquid chromatography-tandem mass spectrometry (LC-MS/MS). A total of 1,712 CSF proteins were detected and relatively quantified by spectral counting. Levels of several proteins with diverse biological functions were significantly altered in sALS samples. Enrichment analysis was used to link these alterations to biological pathways, which were predominantly related to inflammation, neuronal activity, and extracellular matrix regulation. We then used our CSF proteomic profiles to create a support vector machines classifier capable of discriminating training set ALS from non-ALS (HC and OND) samples. Four classifier proteins, WD repeat-containing protein 63, amyloid-like protein 1, SPARC-like protein 1, and cell adhesion molecule 3 were identified by feature selection and externally validated. The resultant classifier distinguished ALS from non-ALS samples with 83% sensitivity and 100% specificity in an independent test set. Collectively, our results illustrate the utility of CSF proteomic profiling for identifying ALS protein/pathway alterations and candidate disease biomarkers.
Keywords: amyotrophic lateral sclerosis, cerebrospinal fluid, mass spectrometry, biomarker, proteomics, extracellular matrix, liquid chromatography-tandem mass spectrometry, LC-MS/MS
Graphical Abstract
INTRODUCTION
Amyotrophic lateral sclerosis (ALS) is a progressive, fatal neurodegenerative disorder marked by the loss of motor neurons of the corticospinal pathway. ALS is the most common form of adult-onset motor neuron disease, with an overall incidence of approximately 2–3 per 100,0001–4. The disease is relentlessly progressive, with most patients dying from respiratory failure within 3–5 years of diagnosis4–8.
At present, diagnosis of ALS is made clinically by use of the symptom-based El Escorial diagnostic criteria. While clinically stringent, the method does not take into account the underlying etiology of the disease. Numerous mechanisms have been proposed to cause motor neuron death in ALS, including oxidative stress, mitochondrial dysfunction, impaired RNA metabolism, protein aggregation, and proteasomal/autophagic dysfunction, among others9–12. These phenomena occur in a heterogeneous fashion in sporadic ALS cases, as do differences in site of onset and rate of disease progression. This has led to the suggestion that ALS is actually a constellation of disorders of diverse cause united by the death of motor neurons and common symptoms13,14. Thus, a more accurate understanding of the underlying protein/pathway alterations accompanying sporadic ALS could enhance diagnostic accuracy, identify novel therapeutic targets, provide relevant indices of disease progression/therapeutic response, and aid in stratification of the patient population for research studies and clinical trials.
Proteomic profiling of cerebrospinal fluid (CSF) offers considerable promise towards these ends. In the context of ALS, CSF is a proximal fluid to the site of disease15, which gives it several advantages as a biomarker source over more distal fluids, such as plasma. One such advantage is its less expansive dynamic range of protein concentrations compared to plasma. By reducing levels of highly abundant proteins such as albumin, sensitive detection and relative quantification of low abundance, disease-associated proteins can be achieved16,17. CSF and other proximal fluids are also hypothesized to contain a higher concentration of disease-associated proteins as a result of proximity to the diseased tissue microenvironment, from which such proteins may be secreted or released. For example, CSF TDP-43, an RNA binding protein known to form inclusions in neurons in ALS and FTLD-TDP, has been suggested as a possible biomarker for these disorders18–20. Thus, pathological intracellular changes resulting from disease can be detected externally through proximal fluids, such as CSF. CSF has proven useful for identifying biomarkers for other neurodegenerative diseases, including Alzheimer’s disease21, Parkinson’s disease22, and multiple sclerosis23. CSF-based ALS biomarkers could likewise be used for several purposes, including identifying novel disease mechanisms, diagnostic testing24, and evaluating drug efficacy25.
The ability to detect and quantify the CSF proteome has been aided considerably by the development of label-free mass spectrometric comparative approaches, such as ion abundance and spectral counting26–28. Several studies have shown that the values produced by these label-free methods reliably correlate with overall protein abundance across orders of magnitude in complex samples. Following appropriate processing (including filtering and normalization27), robust statistical methods can be applied to identify proteins of differential abundance between samples, as well as associated pathways/processes from databases such as Gene Ontology, Reactome, or KEGG29,30. Moreover, when combined with an appropriate feature selection method31, machine-learning approaches can be applied to such datasets to build parsimonious classifiers that, e.g., distinguish healthy from diseased samples based on protein profiles31–35. Such methods have been used to define the normal human CSF proteome. A recent study identified 2,630 proteins from a group of healthy individuals using immunoaffinity depletion of abundant proteins, multiple liquid chromatography separations, and label-free quantitation36. Moreover, 56% of these proteins were CSF-specific. This study and others suggest that the CSF proteome is relatively stable across time and that inter-subject differences are considerably greater than intra-subject longitudinal differences36,37, highlighting the utility of CSF for biomarker discovery.
Several previous studies have attempted to discover CSF-based biomarkers of ALS using mass-spectrometric methods38–42. A limitation of these studies is the small overall number of CSF samples and, consequently, proteins, peptides, or M/Z peaks detected, which can limit downstream data analysis and the detection of low-abundance, disease-associated proteins. The present study, by contrast, benefitted from an extensive patient and control population that dramatically enhanced our ability to identify CSF proteins. Subjects were segmented into groups based on age at symptom onset (< 40, 40–60, or > 60 years old) and, for ALS subjects, site of symptom onset (limb or bulbar). This grouping strategy was selected to reduce non-contributing inter-subject variability, while preserving disease-associated differences. Moreover, pooling of samples was used to maximize the sensitivity of protein detection.
The goals of this study, thus, were two-fold. First, we sought to use LC-MS/MS label-free methods to characterize the CSF proteome in ALS, healthy controls, and other neurologic disease subjects to identify disease-associated alterations in proteins and biological pathways. Second, we sought to identify CSF proteins that could distinguish sALS from both healthy control and other neurological disease subjects by applying feature selection and machine learning methods to our CSF proteomic profiles.
EXPERIMENTAL SECTION
Subjects and CSF Collection
In the first phase of the study, CSF samples from 90 sporadic amyotrophic lateral sclerosis (sALS), 80 healthy control (HC), 20 multiple sclerosis (MS), 20 Alzheimer’s disease (AD), 10 lower motor neuron disease (LMND), 10 upper motor neuron disease (UMND), and 15 familial ALS (fALS) subjects were collected. These samples were pooled into 9 sALS, 8 HC, 2 MS, 2 AD, 1 LMND, 1 UMND, and 2 fALS samples for discovery profiling (training set). Subjects were assigned to a given pool based on age and disease status, as indicated in Table 1, and all pools were gender matched. Each pool contained 200 µL of CSF from each subject in that pool. The MS, AD, LMND, and UMND samples were collectively grouped as “other neurological diseases” (OND, n=6) for subsequent statistical analyses. A separate set of 9 sALS, 7 fALS, and 4 HC CSF samples were individually processed for LC-MS/MS and used in the test set for validation of the classifier generated from our training set of pooled samples described above. The demographics of these individual samples are also described in Table 1.
Table 1.
Subject Demographics. Patient group, diagnosis, class, and age range (years) are indicated. For ALS samples, the site of disease onset and use of riluzole are indicated. The set column indicates which classifier evaluation set a sample was assigned to. Samples are ordered by class then age.
| POOLED SAMPLES | ||||||
|---|---|---|---|---|---|---|
| Group | Diagnosis | Class | Age Range | Site of Onset | Riluzole | Set |
| 1 | sALS | ALS | < 40 | Limb | No | Train |
| 2 | sALS | ALS | < 40 | Limb | No | Train |
| 3 | sALS | ALS | 40–60 | Limb | No | Train |
| 4 | sALS | ALS | 40–60 | Limb | Yes | Train |
| 5 | sALS | ALS | 40–60 | Limb | Yes | Train |
| 6 | sALS | ALS | 40–60 | Bulbar | No | Train |
| 7 | sALS | ALS | > 60 | Limb | No | Train |
| 8 | sALS | ALS | > 60 | Limb | Yes | Train |
| 9 | sALS | ALS | > 60 | Bulbar | No | Train |
| 10 | HC | HC | < 40 | n/a | n/a | Train |
| 11 | HC | HC | < 40 | n/a | n/a | Train |
| 12 | HC | HC | < 40 | n/a | n/a | Train |
| 13 | HC | HC | 30–60 | n/a | n/a | Train |
| 14 | HC | HC | 40–60 | n/a | n/a | Train |
| 15 | HC | HC | 40–60 | n/a | n/a | Train |
| 16 | HC | HC | > 60 | n/a | n/a | Train |
| 17 | HC | HC | > 60 | n/a | n/a | Train |
| 18 | MS | OND | < 40 | n/a | n/a | Test |
| 19 | MS | OND | 40–70 | n/a | n/a | Train |
| 20 | LMND | OND | 40–65 | n/a | n/a | Test |
| 21 | UMND | OND | 40–65 | n/a | n/a | Train |
| 22 | AD | OND | > 60 | n/a | n/a | Test |
| 23 | AD | OND | > 60 | n/a | n/a | Train |
| 24 | fALS | ALS | 30–60 | Limb | No | Test |
| 25 | fALS | ALS | > 40 | Limb | No | Test |
| INDIVIDUAL SAMPLES | ||||||
|---|---|---|---|---|---|---|
| Subject | Diagnosis | Class | Age | Site of Onset | Riluzole | Set |
| 1 | sALS | ALS | 42 | Limb | Yes | Test |
| 2 | sALS | ALS | 44 | Limb | Yes | Test |
| 3 | sALS | ALS | 44 | Limb | Yes | Test |
| 4 | sALS | ALS | 53 | Limb | Yes | Test |
| 5 | sALS | ALS | 54 | Limb | Yes | Test |
| 6 | sALS | ALS | 55 | Limb | Yes | Test |
| 7 | sALS | ALS | 75 | Limb | Yes | Test |
| 8 | sALS | ALS | 76 | Limb | Yes | Test |
| 9 | sALS | ALS | 77 | Limb | Yes | Test |
| 10 | fALS | ALS | 50 | Limb | No | Test |
| 11 | fALS | ALS | 52 | Limb | Yes | Test |
| 12 | fALS | ALS | 52 | Limb | Yes | Test |
| 13 | fALS | ALS | 53 | Limb | No | Test |
| 14 | fALS | ALS | 60 | Limb | No | Test |
| 15 | fALS | ALS | 62 | Limb | No | Test |
| 16 | fALS | ALS | 62 | Limb | Yes | Test |
| 17 | HC | HC | 33 | n/a | n/a | Test |
| 18 | HC | HC | 50 | n/a | n/a | Test |
| 19 | HC | HC | 51 | n/a | n/a | Test |
| 20 | HC | HC | 65 | n/a | n/a | Test |
HC = healthy control, MS = multiple sclerosis, LMND = lower motor neuron disease, UMND = upper motor neuron disease, AD = Alzheimer’s disease, OND = other neurological disease.
Revised El Escorial criteria were used to diagnose all ALS subjects, with 18% diagnosed as definite ALS, 33% probable ALS, 24% probable/lab supported ALS, and 25% possible ALS. CSF samples were obtained by lumbar puncture from subjects at either the University of Pittsburgh Medical Center (UPMC) or Massachusetts General Hospital (MGH) upon informed patient consent. The study was approved by both institutional review boards.
Following collection, all samples were spun at 3000 rpm at 4 °C for 10 minutes to remove any cells and debris, mixed by inversion, aliquoted, and stored in protein low bind polypropylene tubes at −80 °C within 2 hours of harvesting. Only CSF samples without visible blood were processed by centrifugation. Hemoglobin levels in all final CSF samples were measured by ELISA to eliminate those with evidence of significant levels of hemoglobin, denoting blood contamination43.
CSF Preparation and Digestion
To enhance the detection of low-abundance CSF proteins, abundant proteins were depleted using the Multi-Affinity Removal System spin cartridge (Agilent; Santa Clara, CA, USA) that removes the 6 most abundant human CSF proteins (albumin, IgG, IgA, haptoglobin, transferrin, and α-1-antitrypsin) according to the manufacturer’s protocol. Depleted samples were buffer exchanged into 50 mM ammonium bicarbonate (NH4HCO3) by centrifugation using Amicon Ultra3K columns (Millipore; Darmstadt, Germany) to a final volume of 300 µL.
The samples were reduced with addition of 10 mM DTT at 56 °C for 30 minutes. Samples were then alkylated in 55 mM iodoaceteamide in the dark at room temperature for 30 minutes. Next, 3 µL of 1% ProteaseMAX and Trypsin Gold (Promega; Madison, WI, USA) were added to the samples at a 1:20 ratio and digested at 37 °C for 9 hours. All samples were then de-salted using Pepclean C-18 spin columns (Pierce; Rockford, IL, USA). Peptide digests were eluted with 20 µL 0.1% TFA and 60% ACN by spinning at 1500 g for 1 minute twice. Finally, samples were dried by vacuum centrifugation.
Liquid Chromatography-Tandem Mass Spectrometry
Peptide digests were re-suspended in 0.1% TFA and analyzed in triplicate by nanoflow reversed-phase liquid chromatography tandem mass spectrometry (LC-MS/MS) using a Dionex Ultimate 3000 LC system (Dionex Corporation; Sunnyvale, CA, USA) coupled online to a linear ion trap (LIT) mass spectrometer (LTQ, ThermoFisher Scientific; San Jose, CA, USA). Run orders for each experiment were randomly determined. Separations were performed using 75 µm i.d. × 360 o.d. × 10 cm long fused silica capillary columns (Polymicro Technologies; Phoenix, AZ ,USA) that were slurry packed in house with 5 µm, 300 A pore size C-18 silica-bonded stationary phase (Jupiter, Phenomenex; Torrance, CA, USA). Approximately 1 µg of total peptide digest, as determined by BCA assay, was injected onto a C-18 trap column (Dionex, ThermoFisher Scientific; San Jose, CA, USA), the column was washed for 3 min with mobile phase A (2% acetonitrile, 0.1% formic acid in water) at a flow rate of 30 µL/min. Peptides were eluted using a linear gradient of 0.3% mobile phase B (0.1% formic acid in acetonitrile)/min for 130 minutes, then to 95% B in an additional 10 min, all at a constant flow rate of 0.20 µL/min. Column washing was performed at 95% B for 20 minutes, after which the column was re-equilibrated in mobile phase A prior to subsequent injections. The LIT-MS was operated in a data dependent MS/MS mode in which each full MS scan was followed by five MS/MS scans where the five most abundant peptide molecular ions are selected for collision-induced dissociation (CID), using a normalized collision energy of 30%. Data were collected over a broad mass to charge (m/z) precursor ion selection scan range of m/z 375–1800 with an isolation window of 3 m/z. Dynamic exclusion was used to minimize redundant selection of peptides previously selected for CID with the following settings: repeat count = 1, repeat duration = 30 s, exclusion list size = 500, exclusion duration = 90 s and expiration S/N threshold = 3.
Spectral Counting
Tandem mass spectra were searched against a combined UniProt human protein database from the European Bioinformatics Institute (http://www.ebi.ac.uk/integr8, downloaded 10-05-2010, 58,769 sequences) using the SEQUEST algorithm in BioworksBrowser (v3.31, ThermoFisher Scientific; Waltham, MA, USA). For a fully tryptic peptide to be considered legitimately identified, it had to achieve charge state and proteolytic cleavage-dependent cross correlation (Xcorr) scores of 1.9 for [M+H]1+, 2.2 for [M+2H]2+ and 3.5 for [M+3H]3+, and a minimum delta correlation ΔCn of 0.08. Additionally, peptides were searched for methionine oxidation with a mass addition of 15.9949 and serine, threonine and tyrosine phosphorylation with a mass addition of 79.9663. A false peptide discovery rate less than 2% was determined by searching the primary tandem MS data using the same criteria against a decoy database wherein the protein sequences are reversed44. Results were further filtered using software developed in-house, and differences in protein abundance between the samples were derived by summing the total CID events that resulted in a positively identified peptide for a given protein in accession across all samples (spectral counting)26–28. We further filtered our data by specifying that for a protein to be considered for subsequent statistical analysis, at least 2 unique peptides of the protein had to be detected in at least one pooled sample, in keeping with recent guidelines designed to improve reproducibility in spectral count data analyses45.
Statistical Analysis of Relative Protein Abundance
We used the beta binomial test for spectral count data46 together with normalization to total spectral counts27 to assess relative levels of identified proteins between groups. To control the false discovery rate (FDR)47 of the test, we imputed obtained p values into the R package “Q Value” to generate q values from the associated p values. Bootstrap-based resampling of p values48–52 was used to correct for multiple testing, with the FDR set at 0.05. To provide further insight into the relative differences in protein abundance between groups, we computed log2 fold difference values for each 2 group comparison (sALS/HC, sALS/OND, OND/HC). A value of “1” was added to each protein’s spectral count value to account for proteins with a zero spectral count before computing the fold difference53. To further control false positives in our analysis, we used a joint q value and fold change criteria to assign statistical significance to a given protein identified in our analysis. Previous work has shown that proteins with high spectral count values tend to produce low fold differences and vice versa27,45. Accordingly, we used a minimum log2 fold difference of 0.26 for proteins with an average spectral count of 100 or more, a 0.58 log2 fold difference for proteins with an average spectral count of 1 to 100, and a 0.77 log2 fold difference for proteins with an average count of less than 1 to filter our list of proteins with a q value of less than 0.05.
Ontological Enrichment Analysis
After filtering our dataset, we used the program STRAP (version 1.5)54,55 to characterize the CSF proteome based on the annotations of each identified protein in the Gene Ontology (GO) domains “Biological Process”, “Cellular Complex”, and “Molecular Function”. We next visualized our list of statistically significant proteins in a network layout using Cytoscape56. Proteins were visualized first by log2 fold difference values using a red (decreased in x for the x/y fold difference) to green (increased in x for the x/y fold difference) gradient above each protein’s name.
To identify biological pathways associated with our list of differentially abundant proteins, we performed enrichment analysis using ClueGO57. The hypergeometric test (with Benjamini-Hochberg multiple testing correction47) was used to assess enrichment of categories in the GO domain “Biological Process”58. Consistent with recent guidelines for the selection of a reference set59,60, we used our list of all identified proteins across groups as the reference set for enrichment analysis. In the resultant graph, the proportion of shared proteins associated with a pair of given GO terms was evaluated using the kappa statistic. Pairs of terms (nodes) with a kappa value of at least 0.4 were connected with edges in the network, with the edge thickness reflecting the kappa score value.
Following the identification of over-represented GO Biological Processes, we used Cluepedia61 to enrich the networks created from these terms. First, we visualized leading terms (GO Biological Process terms with the highest number of statistically significant proteins) together with the proteins associated with that term and the respective fold difference. In the second phase of enrichment, we sought to provide a functional context to the alterations in relative protein levels we identified. To that end, we selected an over-represented GO Biological Process (“Regulation of Extracellular Matrix” [ECM]) and visualized known STRING62,63 actions (activation, inhibition, expression, and post-translational modification) for statistically significant ECM proteins, other ECM proteins detected in our CSF samples, and several ECM proteins not found in our CSF samples. STRING action scores were used to connect nodes (proteins) in the network. All final figures were made in Adobe Illustrator CS5 (Adobe Systems, Mountain View, CA, USA).
Feature Selection, Classifier Construction, and Validation
In the second phase of the study, we used our CSF proteomic profiles to construct a classifier capable of separating ALS CSF samples from HC and OND CSF samples. The data mining software package Weka64 was used for this purpose. The classification task was the binary separation of ALS samples (ALS) from HC and OND (collectively, NON) samples. The training set included all of our pooled sALS and HC CSF proteomic profiles and 3 of the 6 OND proteomic profiles. An independent test set comprised of the remaining 3 OND samples, 9 individual sALS samples, 2 pooled fALS samples, 7 individual fALS samples, and 4 individual HC samples was used for subsequent validation of the classifier. The assignment of samples to the training or test set is indicated in Table 1.
To develop a model resilient to overfitting of the training set, we used a support vector machines algorithm for classification and performed filtering and feature selection on our list of proteins in the training set samples. Filtering was performed by removing any protein from our list if the mean spectral count of any of the classes was zero. Golub’s index (GI), a feature selection method previously used for both disease classification65 and feature selection66 of spectral count data, was used to select proteins for the classifier. The GI for a protein, i, was calculated as follows:
where is the mean normalized spectral count for protein i for the indicated class and is the standard deviation for protein i for the indicated class. Proteins with a GI ≥ 1.5 were included in the classifier. Weka’s linear support vector machine (SVM) learning algorithm was used to build the classifier. Consistent with prior studies66,67, we used a complexity parameter, C, of 100 for classifier training and test set evaluation.
To evaluate the performance of the classifier on the training set, we used stratified 10-fold cross validation. We then validated our classifier on the test set described above and in Table 1. To evaluate the performance of the classifier on the test set, we used common measures of predictive performance (ROC curve, sensitivity, specificity, ROC AUC, and F-measure).
Validation of Selected Proteins
To validate our LC-MS/MS results, we used several complementary techniques. Proteins selected for our SVM classifier were validated using Western blotting (WB). Polyacrylamide gel electrophoresis (PAGE), electrophoretic transfer to PVDF membrane, and WB were performed as previously described68. Briefly, equal volumes of CSF were loaded in each SDS-PAGE gel lane and total protein by reversible PVDF membrane stain (G-Biosciences; St. Louis, MO, USA) was used as a loading control. For WB experiments, the following antibodies were used: rabbit-anti-WDR63 (Abcam; Cambridge, MA, USA), rabbit-anti-APLP1 (Proteintech; Chicago, IL, USA), rabbit-anti-SPARCL1 (Lifespan Biosciences; Seattle, WA, USA), rabbit-anti-CADM3 (Sigma Aldrich; St. Louis, MO, USA), and rabbit-anti-secretogranin I (Proteintech; Chicago, IL, USA). To permit blot to blot comparisons, Western blot data were normalized using sum total normalization69.
ELISAs for complement C3 and cystatin C were performed as previously described70,71. Immunohistochemistry and light microscopy of spinal cord tissues for tenascin R were performed as previously described72. Immunohistochemistry, immunofluorescence, light microscopy, and confocal microscopy of spinal cord tissues for eIF 4e-transporter (4e-T) were performed as previously described72.
RESULTS
Global CSF Analysis
Our experimental work flow is illustrated in Figure 1. The demographics of each of our pooled samples are shown in Table 1. Within each of these pooled CSF samples, we identified an average of 6,137 peptides, corresponding to an average of 1,234 unique proteins per sample. Collectively, we identified 1,712 unique proteins across all groups after filtering. (Table S-1). To further understand the composition of the obtained CSF proteome, we grouped these proteins based on their annotations in the Gene Ontology (GO) domains “Biological Process”, “Cellular Complex”, and “Molecular Function”. Figure 2 shows the proportional representation of the various sub-categories in each GO domain with each value expressed as a percentage of the total. Sub-category proportions did not differ substantially between sporadic ALS (sALS), healthy control (HC), and other neurological disease (OND) groups (data not shown). Our results indicate that proteins associated with diverse biological processes, cellular complexes, and molecular functions are found in the CSF proteome. Notably, we detect proteins from numerous intracellular organelles, including the nucleus, mitochondria, ribosomes, and ER in the CSF, consistent with previous work36,37.
Figure 1.

Experimental Workflow. The process of sample preparation, data acquisition, and data analysis are shown in a flowchart. sALS = sporadic amyotrophic lateral sclerosis, HC = healthy control, OND = other neurological disease.
Figure 2.

Gene Ontology (GO) domain overview of all identified proteins. All identified proteins were input into the three GO domains – Biological Process, Cellular Complex, and Molecular Function – and the resultant terms and percentage of proteins associated with these terms are visualized as pie charts. Term names and percentages are located next to their position on the chart. Percentages correspond to all 1,712 proteins identified across all classes (sALS, HC, and OND).
Statistical Analysis of Relative Protein Abundance
To identify proteins of differential abundance in the CSF between sALS, HC, and OND groups, we performed univariate statistical analysis. Filtering the list of statistically significant proteins from this analysis using a fold difference criteria (see Experimental Section) predominantly had the effect of removing several proteins for which the class average spectral count was less than 1. In total, we identified 123 proteins that met our FDR and fold difference significance criteria (Table S-2). The top 20 proteins of increased and decreased abundance are shown in Table 2. Several proteins with documented associations with ALS were identified in the top 20 protein list, including complement C3, cystatin C, neurofilament medium polypeptide, ephrin type-A receptor 4, and secretogranin 2. Another consistent theme in the top 20 protein list was a decrease in relative levels of extracellular matrix (ECM)-associated proteins in sALS, including tenascin R, semaphorins 7A and 3G, cell adhesion molecule 3, neurexin-3-alpha, agrin, and oligodendrocyte-myelin glycoprotein (Table 2).
Table 2.
The top 20 proteins with statistically significant increased or decreased relative abundance in sALS samples are shown by q value rank (lowest to highest). Protein name, gene name, and Uniprot accession number is shown and protein isoform is indicated in the accession number. The log2 fold difference (FD) for each two group comparison is shown.
| INCREASED ABUNDANCE | ||||||
|---|---|---|---|---|---|---|
| Protein | Gene Name | Uniprot Accession | q | FD sALS-HC | FD sALS-OND | FD OND-HC |
| Neurofilament medium polypeptide | NEFM | P07197 | <0.0001 | 2.3 | 2.4 | −0.1 |
| WD repeat-containing protein 63 | WDR63 | Q8IWG1-1 | <0.0001 | 1.8 | 2.3 | −0.5 |
| Complement C3 | C3 | P01024 | <0.0001 | 0.3 | 0.1 | 0.2 |
| Very large A-kinase anchor protein | CRYBG3 | Q68DQ2 | 0.0004 | 1.5 | 1.3 | 0.2 |
| Acid phosphatase-like protein 2 | ACPL2 | Q8TE99-1 | 0.0010 | 0.9 | 2.0 | −1.1 |
| Serine/threonine-protein kinase PLK1 | PLK1 | P53350 | 0.0010 | 1.2 | 1.4 | −0.2 |
| Protein phosphatase 1J | PPM1J | Q5JR12-1 | 0.0013 | 1.4 | 1.3 | 0.1 |
| AF4/FMR2 family member 4 | AFF4 | Q9UHB7-1 | 0.0041 | 0.6 | 1.5 | −0.8 |
| PDZ domain-containing RING finger protein 4 | PDZRN4 | Q6ZMN7-1 | 0.0044 | 2.1 | 1.6 | 0.5 |
| Actin | ACTB | P60709 | 0.0044 | 1.5 | 0.4 | 1.1 |
| Disks large-associated protein 1 | DLGAP1 | O14490-1 | 0.0050 | 1.3 | 0.3 | 0.9 |
| Tripartite motif-containing protein 43B | TRIM43B | A6NCK2 | 0.0050 | 1.2 | 0.8 | 0.5 |
| ALK tyrosine kinase receptor | ALK | Q9UM73 | 0.0056 | 1.4 | 1.2 | 0.2 |
| Protein Daple | CCDC88C | Q9P219-1 | 0.0056 | 1.1 | 0.7 | 0.5 |
| SMG5 | SMG5 | Q9UPR3 | 0.0056 | 1.0 | 0.8 | 0.2 |
| V-set and immunoglobulin domain-containing protein 4 | VSIG4 | Q9Y279-1 | 0.0066 | 1.2 | 0.7 | 0.5 |
| Tafazzin | TAZ | Q16635-1 | 0.0066 | 0.9 | 0.7 | 0.2 |
| Novel protein XXbac-BCX360G3.2-001 | BCX360G3.2 | B0V386 | 0.0088 | 1.1 | 0.9 | 0.2 |
| OTU domain-containing protein 7A | OTUD7A | Q8TE49-1 | 0.0105 | 0.8 | 1.2 | −0.3 |
| Hyaluronan-binding protein 2 | HABP2 | Q14520 | 0.0107 | 1.1 | 0.9 | 0.2 |
| DECREASED ABUNDANCE | ||||||
|---|---|---|---|---|---|---|
| Protein | Gene Name | Uniprot Accession | q | FD sALS-HC | FD sALS-OND | FD OND-HC |
| Multiple epidermal growth factor-like domains protein 8 | MEGF8 | Q7Z7M0-1 | 0.0004 | −1.1 | −0.3 | −0.8 |
| Cystatin-C | CST3 | P01034 | 0.0004 | −0.1 | −0.3 | 0.1 |
| Golgi membrane protein 1 | GOLM1 | Q8NBJ4-1 | 0.0005 | −1.4 | −0.1 | −1.2 |
| Cell adhesion molecule 3 | CADM3 | Q8N126-1 | 0.0013 | −0.9 | −0.9 | 0.0 |
| Semaphorin-7A | SEMA7A | O75326 | 0.0038 | −0.8 | −0.5 | −0.3 |
| Semaphorin-3G | SEMA3G | Q9NS98 | 0.0040 | −0.6 | 1.0 | −1.6 |
| Secretogranin-2 | SCG2 | P13521 | 0.0040 | −0.6 | −0.2 | −0.4 |
| Neurexin-3-alpha | NRXN3 | Q9Y4C0-1 | 0.0044 | −0.7 | 0.2 | −1.0 |
| Putative PRAME family member 24 | PRAMEF24 | A6NMC2 | 0.0050 | −1.5 | −1.1 | −0.4 |
| Cartilage acidic protein 1 | CRTAC1 | Q9NQ79-1 | 0.0050 | −0.3 | 0.6 | −0.9 |
| Oligodendrocyte-myelin glycoprotein | OMG | P23515 | 0.0058 | −0.9 | −0.8 | −0.2 |
| Disks large homolog 5 | DLG5 | Q8TDM6-1 | 0.0064 | −1.4 | −0.8 | −0.6 |
| Testican-2 | SPOCK2 | Q92563 | 0.0114 | −0.9 | 0.2 | −1.2 |
| Cathepsin D | CTSD | P07339 | 0.0142 | −0.2 | −0.7 | 0.5 |
| Agrin | AGRN | O00468 | 0.0158 | −0.7 | −0.4 | −0.3 |
| Gelsolin | GSN | P06396-1 | 0.0165 | −0.1 | −0.2 | 0.1 |
| Follistatin-related protein 4 | FSTL4 | Q6MZW2-1 | 0.0176 | −0.6 | 0.9 | −1.5 |
| Di-N-acetylchitobiase | CTBS | Q01459 | 0.0183 | −1.3 | −1.2 | −0.1 |
| Delta and Notch-like epidermal growth factor-related receptor | DNER | Q8NFT8 | 0.0194 | −1.4 | −0.6 | −0.8 |
| Ephrin type-A receptor 4 | EPHA4 | P54764 | 0.0202 | −0.6 | −0.1 | −0.5 |
Ontological Enrichment Analysis
To identify biological pathways associated with our list of differentially abundant CSF proteins, we performed enrichment analysis in the Gene Ontology (GO) Biological Process domain. We found 27 enriched GO terms that were over-represented in our list of statistically significant proteins. These results are shown in Figure 3. Several themes emerged from our analysis of overrepresented biological processes. We identified many neuron-specific processes, including “synapse organization”, “regulation of axonogenesis”, “regulation of synaptic plasticity”, and “fasciculation of sensory neuron axon”. Of note, all proteins comprising the term “fasciculation of sensory neuron axon” (ephrin type A receptors 3 and 4 and multiple epidermal growth factor-like domains protein) were significantly altered in sALS samples compared to healthy control samples. Other major processes identified from the analysis included “regulation of extracellular matrix”, “acute inflammatory response”, and “glial cell differentiation”, each of which has clear relevance to ALS.
Figure 3.

GO Biological Process enrichment analysis. Proteins whose levels were significantly different between sALS, HC, and OND groups were used to identify over-represented GO Biological Process terms. The results are shown in a network view where node size corresponds to the term’s p value and edge thickness corresponds to kappa score value as indicated in the legend at right. Nodes are positioned for ease of interpretation and edge length is arbitrary. Leading terms, GO terms with the highest number of included proteins, are shown in a larger, colored font.
Taking those biological processes with the highest number of associated proteins, we next visualized these terms and their associated proteins together in a network view (Figure 4). A protein’s association with a term is indicated by an edge connecting the two. The relative contributions of proteins of increased and decreased abundance in sALS can be seen in this view. For example, the identification of the terms “acute inflammatory response” and “regulation of inflammatory response” is mainly due to increased levels of proteins associated with these terms in sALS CSF samples, particularly those proteins of the complement pathway. Likewise, the enrichment of the terms “synapse organization” and “extracellular matrix organization” stems primarily from the decreased levels of proteins associated with these terms in sALS samples. Collectively, this network view underscores the notion that the ALS disease process is associated with a concomitant decrease in synaptic and ECM proteins and increase in inflammation-related proteins within the CSF. We also note that proteins with a high degree of connectivity in the network of Figure 4 (i.e., those associated with several terms) tended to be ECM-associated proteins, such as tenascin R and laminin subunit alpha 2 (LAMA2), providing further evidence that ECM alterations are a preponderant pathological phenomenon in sALS (Figure 4).
Figure 4.

Leading terms from Figure 3 are shown with their associated proteins. Each two-group log2 fold difference (sALS/HC, sALS/OND, OND/HC) is visualized using a red to green gradient. Proteins with a log2 fold difference > 0.58 for sALS relative to both HC and OND groups are emphasized as indicated, as are externally validated proteins.
To provide functional context and a pathway-level understanding of the observed ECM alterations, we linked ECM proteins using STRING action scores to create a network of the “regulation of extracellular matrix” GO term. We note that not all proteins from the term are shown to enhance the interpretability of the figure. The final network is shown in Figure 5. Several findings emerge from this analysis. First, we provide clear evidence of the power of LC-MS/MS CSF proteomic profiling to identify ECM-associated proteins. Of the 102 proteins shown in Figure 5, 85 could be detected in at least one of our pooled CSF samples (those that could not are bracketed with parentheses in Figure 5). Second, proteins whose levels are significantly altered in sALS CSF converge on few common targets, suggesting that pathological ECM protein and signaling alterations are widespread in ALS. Lastly, we again note that the majority of altered ECM proteins are decreased in sALS samples. The network view thus emphasizes that these decrements may have widespread signaling effects, particularly for proteins such as gelsolin (GSN) that act on numerous ECM proteins.
Figure 5.

Enrichment of “Regulation of Extracellular Matrix” GO Term. Statistically significant proteins from the GO Biological Process term “Regulation of Extracellular Matrix” were visualized as circular nodes, with log2 fold difference (on a red to green gradient) shown in the three squares above each node. Proteins with a log2 fold difference > 0.58 for sALS relative to both HC and OND groups are emphasized as indicated, as are externally validated proteins. The network was enriched using STRING action scores (activation, inhibition, expression, and post-translational modification; colored as indicated) to add associated proteins to the network. Statistically significant protein names from the LC-MS/MS data are shown in red font for emphasis. Names of proteins not detected in our LC-MS/MS analysis are bracketed by parentheses. Edge width reflects the strength of the STRING action score as indicated in the legend and edge length is arbitrary.
Validation of Known ALS Biomarkers
We observed significant differences in a number of proteins previously identified as candidate ALS CSF biomarkers by LC-MS/MS. To further evaluate the utility of these proteins as CSF biomarkers, we performed ELISAs and Western blots on individual CSF samples from subjects comprising our ALS, HC, and OND pooled samples. The results of these experiments are shown in Figure 6. Complement C3 levels were measured by ELISA in 23 sALS, 26 HC, and 12 OND CSF samples. Statistically significant increases in CSF C3 levels were observed when comparing sALS or OND samples to HC samples (mean sALS = 3.42 ± 0.29 µg/mL, mean OND = 3.40 ± 0.37 µg/mL, and mean HC = 2.22 ± 0.12 µg/mL, p < 0.001 for the sALS/HC comparison, p < 0.01 for the OND/HC comparison). We measured cystatin C levels by ELISA in 20 sALS samples, 8 HC samples, and 11 OND samples. A statistically significant decrease in cystatin c levels was observed in sALS CSF relative to HC (means = 3.27 ± 0.34 µg/mL and 4.98 ± 0.36 µg/mL, respectively, p < 0.01). A non-significant decrease in cystatin C levels was seen when comparing sALS samples to OND samples (means = 3.27 ± 0.34 µg/mL and 4.26 ± 0.35 µg/mL, respectively, p > 0.05). Levels of secretogranin I were measured by Western blotting of 14 sALS, 10 HC, and 10 OND CSF samples. Secretogranin I was significantly decreased in sALS compared to HC (p < 0.01) and OND (p < 0.01) samples.
Figure 6.

Validation of Known ALS Biomarkers. A. Complement C3 levels in CSF from sALS, HC, and OND subjects were measured by ELISA in triplicate. The concentration of Complement C3 (µg/mL ± SEM) is indicated on the y axis. B. Cystatin C levels in CSF from sALS, HC, and OND subjects were measured by ELISA. The concentration of cystatin C (µg/mL ± SEM) is indicated on the y axis. C. Relative levels of secretogranin I in CSF from sALS, HC, and OND subjects were measured by Western blot. The mean normalized integrated density value ± SEM is indicated on the y axis. For A–C. * = p < 0.001 for the indicated comparison, # = p < 0.01 for the indicated comparison.
Validation of Protein Alterations in ALS Spinal Cord Tissue
We previously demonstrated that altered levels of CSF proteins in sALS can be used to identify pathological alterations in ALS motor neurons72. To extend this approach to the current study, we validated select proteins from our list of differentially abundant proteins using immunohistochemistry and immmunofluorescence. Because decreases in ECM proteins were a consistent theme in our results, we stained 4 sALS and 4 HC lumbar spinal cord tissue sections with anti-tenascin R antibody. Tenascin R is a component of perineuronal nets, the densely organized extracellular matrix surrounding neurons. We observed a clear loss of tenascin R immunoreactivity surrounding motor neurons in sALS lumbar spinal cord that was not seen in HC subjects (Figure S-1). Thus, the ECM of the ALS-afflicted motor neurons shows perturbations consistent with the results of LC-MS/MS proteomic profiling of CSF.
LC-MS/MS also identified a significant increase in levels of the eIF 4e transporter (4e-T) in the CSF of sALS patients when compared to HC. 4e-T is a component of stress granules74 and we therefore performed tissue staining to determine if 4e-T is a component of inclusions in sALS spinal cord motor neurons, as has been observed for other stress granule-associated proteins75. We observed filamentous and granular nuclear 4e-T staining and cytoplasmic 4e-T-positive inclusions in lumbar spinal cord motor neurons in the 4 sALS cases examined (Figure S-2). By contrast, the 4e-T staining in motor neurons of all 4 HC subjects was diffuse, non-filamentous, and nuclear. Immunofluorescence microscopy was then used to determine if 4e-T inclusions were p62 positive. We observed considerable accumulation of autofluorescent cytoplasmic lipofuscin in motor neurons (Figure S-2; arrowheads) that obfuscated the detection of cytoplasmic 4e-T. This accumulation was not present in the nucleus, however, and numerous nuclear, p62-positive 4e-T granules in sALS spinal cord motor neurons not seen in motor neurons of HC subjects are evident (Figure S-2; arrows).
Classifier Construction and Machine Learning
In the final phase of the study, we used our pooled sample CSF proteomic profiles from the training set to build a support vector machine (SVM) classifier capable of distinguishing ALS samples from non-ALS samples in an independent test set. We first used filtering to remove proteins for which any class mean spectral count was 0, as such proteins could lead to an overfitted classifier and, consequently, poor validation performance on separate test sets. Moreover, low CSF peptide counts may reflect low protein levels that can lead to an inability to validate protein levels via other methodologies.
Feature selection was used to identify proteins that exhibited large alterations between ALS and HC/OND (collectively, NON) samples. Four proteins were selected for training of the classifier: WD repeat-containing protein 63 (WDR63), amyloid-like protein 1 (APLP1), SPARC-like protein 1 (SPARCL1), and cell adhesion molecule 3 (CADM3). WDR63 was increased in the CSF of ALS samples, while the remaining three proteins were decreased in sALS samples relative to NON samples.
These four proteins were used as features for building a linear SVM classifier using the training set samples. For the initial evaluation of the classifier, we used stratified 10-fold cross validation. All training set samples were correctly classified in the cross validation. An independent test set consisting of individual CSF samples analyzed by LC-MS/MS was used to further validate the classifier. Several familial ALS (fALS) samples were included to increase the size of the test set, as indicated in Table 1. While etiologically distinct from sALS subjects, we postulated that motor neuron death may nevertheless produce changes in CSF protein levels that are common to both sALS and fALS. The performance metrics of the test set evaluation and an ROC curve are shown in Figure 7. The 4 protein classifier achieved 83% sensitivity and 100% specificity with the test set, misclassifying one sALS sample and two fALS samples. Inspection of the misclassified samples showed that relative levels of WDR63 were lower and relative levels of APLP1 were higher in these samples than in the other ALS test set samples.
Figure 7.

Classifier Performance. A. ROC curve showing the performance of the support vector machines classifier on an independent test set. The various levels of the decision threshold are shown as diamonds along the curve. B. Confusion matrix, classifier errors, and the indicated performance metrics are shown for the application of the classifier to an independent test set.
We then validated the levels of our four classifier proteins by Western blot (WB) in select individual CSF samples from the training set samples. The results of these experiments are shown in Figure 8. WB experiments were performed on sALS (n=15) samples, HC samples (n=12), and OND (n=10) samples. Relative levels of WDR63 were increased in sALS CSF compared to HC and OND samples (p < 0.001 for both comparisons). Two adjacent bands for WDR63 were observed and the results reflect levels of total WDR63 in the CSF. Relative levels of APLP1 were decreased in the CSF of sALS patients relative to HC (p < 0.001) and OND (p < 0.01) samples. Relative levels of SPARCL1 were decreased in the CSF of sALS patients relative to HC (p < 0.01) and OND (p < 0.05) samples. Relative levels of CADM3 were decreased in the CSF of sALS patients relative to HC and OND samples (p < 0.001 for both comparisons).
Figure 8.

Validation of Classifier Proteins. Relative levels of classifier proteins in CSF from training set sALS, HC, and OND subjects were measured by Western blot. The mean normalized integrated density value ± SEM is indicated on the y axis. A. WDR63. B. APLP1. C. SPARCL1. D. CADM3. For A–D, * = p < 0.001 for the indicated comparison, # = p < 0.01 for the indicated comparison, and § = p < 0.05 for the indicated comparison.
DISCUSSION
The goals of this study were two-fold. First, we sought to use LC-MS/MS to construct comprehensive CSF proteomic profiles of sALS, HC, and OND samples to identify ALS protein/pathway alterations. Second, we sought to build a classifier capable of distinguishing ALS from HC and OND samples using our CSF proteomic profiles. With regard to our first aim, we identified 1,712 proteins in the CSF across all groups. This number is consistent with recent studies characterizing the normal CSF proteome36,37. Similarly, our data sets show strong concordance in the proportion of all identified proteins assigned to the various Biological Process, Cellular Complex, and Molecular Function Gene Ontology domains, suggesting that the overall composition of the CSF proteome is relatively stable, despite multiple daily turnovers of the total CSF volume76, 77. This, together with CSF’s proximity to the CNS tissue microenvironment, makes it an ideal biomarker source for neurological disorders such as ALS. The results also illustrate the considerable sensitivity that is achieved by pooling samples and using label-free relative quantitation, a finding that has been shown in other studies characterizing the CSF proteome36,37.
The sensitivity of our LC-MS/MS method enabled the detection of differences in relative levels of many proteins between sALS and non-sALS samples. Several of these proteins have documented associations with ALS. For example, we detected and validated alterations in the previously described candidate ALS CSF biomarkers complement C370, cystatin C63,78, and secretogranin I79. We also demonstrate decreases in the known ALS disease modifier80, ephrin type A receptor 4 (EphA4) in the CSF of ALS subjects. Reducing EphA4 expression or signaling prolongs survival in ALS model systems80, so the decrease we observe in ALS CSF may reflect a compensatory response by the CNS to the ALS disease process.
We used enrichment analysis to identify biological processes and pathways altered in ALS. The majority of over-represented processes were related to inflammation, synaptic activity, cell growth, or extracellular matrix (ECM) regulation. The latter three processes are similar to those recently identified using microarray analysis of gene expression in oculomotor and spinal motor neurons81, while elevations in inflammation-associated proteins, specifically those of the complement pathway, have been previously associated with human ALS70, 82–84 and ALS model systems85, 86. We detect elevations in several proteins of the complement pathway, confirming previously-described elevations of CSF C370,82 and providing new evidence for an increase in C5 (which is upregulated in animal models of ALS85, 87) and C2, as well as decreased complement factor I. Our results support a role of elevated complement pathway activation as a contributing factor to motor neuron death and a potential therapeutic target. These complement pathway proteins may also be useful biomarkers to evaluate the effectiveness of drugs that target this pathway.
Aberrant synaptic changes are also well-described in human ALS and ALS model systems. Axonal dying-back is recognized both as a pathologic feature and hypothesized causal mechanism in ALS88,89 and degenerative structural changes are observed at synapses of motor neurons and neuromuscular junctions (NMJ) in ALS spinal cord tissue90,91. We now identify candidate synaptic proteins that contribute to these pathological changes. For example, decreases in semaphorins 7A and 3G were observed in sALS CSF. The semaphorins act as axonal guidance molecules and have previously been linked to ALS92,93. They are expressed in a variety of cell types, including neurons, glia, regulatory T-cells, and vascular epithelial cells. Probing these cell types for altered levels of semaphorins and other synaptic proteins in ALS tissues or model systems may provide insights into how cell type-specific altered synaptic protein expression leads to changes in synapse structure and function that lead to or contribute to motor neuron degeneration in ALS.
Many of the synaptic proteins that were altered in sALS samples are also components of the extracellular matrix (ECM). Pathological ECM alterations have been described for ALS94 and ALS model systems95. Our results showed consistent decreases in levels of ECM proteins, including tenascin R, agrin, and cell adhesion molecule 3. These observations point to a loss of integrity of perineuronal nets (PNN), the highly specialized ECM surrounding neurons. The functions of PNNs are diverse and include physically surrounding neurons, protecting against harmful external agents96, influencing synaptic transmission97, and buffering against oxidative stress98. Validation of the decrease in tenascin R seen in CSF by immunohistochemistry of spinal cord tissues further establishes altered morphology and protein composition of PNNs as a pathological phenomenon in ALS, consistent with findings on TNR in ALS animal models95. As the alterations we observed were localized to motor neurons, we propose that pathological PNN alterations contribute to selective MN vulnerability in ALS.
An implicit and overarching assumption of CSF proteomic profiling is the idea that protein alterations detected in CSF can provide evidence of intracellular changes resulting from the ALS disease process42. We showed previously that RBM45, an RNA binding protein whose levels are increased in the CSF of ALS patients72, forms cytoplasmic inclusions in motor neurons and glia of ALS patients. Similarly, we now show that increased levels of the stress-granule associated74 eIF4E transporter protein (4e-T) in the CSF of sALS patients correlate with its presence in p62-positive nuclear granules and cytoplasmic inclusions (Figure S-2). Intranuclear inclusions are a pathological feature of sALS99,100 and we demonstrate the presence of a transport protein, 4e-T, in these inclusions. Moreover, while p62-positive intranuclear inclusions have been described in c9ORF72-linked familial ALS tissue101, we demonstrate the presence of such inclusions for the first time in sporadic ALS patients.
Our second major objective was to build a discriminant classifier capable of distinguishing ALS patients from healthy controls and other neurodegenerative disease patients on the basis of the CSF proteomic profiles of each group. We70 and others102 have shown that the CSF protein levels and machine learning can be used to distinguish sALS and healthy control subjects. Whether this approach is also feasible for the simultaneous separation of sALS from HC and OND samples was unclear. As is typical for high-dimensional –omics data sets, we were able to build a classifier capable of correctly classifying all training set samples. Validation on an independent test set composed of sALS, fALS, HC, and OND samples demonstrated that the classifier generalized well, achieving 83% sensitivity and 100% specificity.
Given the considerable clinical and pathological heterogeneity of ALS9–12, no biomarker (or panel of biomarkers) is likely to achieve 100% sensitivity and specificity when separating ALS from both HC and OND samples. Because ALS is a relatively rare disorder, the specificity of a classifier is of paramount importance. In this regard, our set of classifier proteins shows considerable promise, correctly classifying all HC and OND samples. The misclassified ALS samples had lower WDR63 and higher APLP1 levels than the other ALS samples profiled. Determining the relationship between WDR63 and APLP1 CSF levels and ALS disease mechanisms and clinical parameters, thus, is an important area of future research. Similar to other LC-MS/MS studies66, the sample size of both the training and test sets is small relative to the number of proteins identified. Future studies are thus needed to confirm the predictive ability of this biomarker panel with a larger set of samples.
Previously identified CSF protein biomarkers for ALS have often been of increased abundance in ALS, such as complement C3 and neurofilament proteins70. Markers of inflammation or neuronal injury will correctly separate ALS from HC samples. They are, however, less likely to correctly distinguish ALS from OND samples (Figure 6a), which is also important for biomarker-based disease classification. To account for this, we grouped HC and OND samples together as NON (i.e., non-ALS) samples prior to feature selection. Proteins identified by this approach may include more specific markers of ALS-associated loss of motor neuron synaptic integrity or degeneration. The roles of APLP1 and CADM3 in neuromuscular junction (NMJ) function discussed below provide support for this notion.
Classification based on decreased protein abundance creates the potential for misclassification in subsequent studies due to protein instability or differences in analytical sensitivity. For this reason, future studies are required to evaluate the longitudinal stability of the decreases we observed in our classifier proteins. Likewise, evaluating the clinical stage at which these alterations become apparent has considerable implications for the diagnostic/prognostic value of these markers. From an analytical perspective, our ability to detect all proteins of the classifier in all of our individual samples profiled by Western blot suggests that these markers are readily detectable in CSF. They are thus likely amenable to future measurement by quantitative approaches, such as ELISA, which may further enhance measurement sensitivity and classification accuracy.
The four proteins used in our classifier have plausible connections to motor neuron degeneration. Three of the proteins used in the classifier, amyloid-like protein 1 (APLP1), SPARC-like protein 1 (SPARCL1), and cell adhesion molecule 3 (CADM3) were decreased in the CSF of ALS patients. Each protein has documented associations with neurons and synaptic activity, making them promising candidate biomarkers for ALS. APLP1 associates with NMDA receptors and regulates surface expression of this family of glutamatergic receptors103. This regulation is crucial for maintaining cellular homeostasis and synaptic activity. Knockout of APLP1 and APLP2 (also significantly reduced in our ALS samples) results in reduced pre- and post-synaptic compartment size at the NMJ104. Reduced levels of APLP1 in ALS, therefore, may contribute to muscle de-innervation and axonal die-back by altering the integrity of the NMJ.
SPARCL1 belongs to the BL-40 family of ECM proteins105. The protein is secreted by astrocytes and promotes synapse formation106. Knockout of the SPARCL1 gene in mice resulted in a decrease in the number of excitatory synapses in the superior colliculus107. In addition to synapse formation, the protein may also be essential for synaptic maintenance. If so, reduced levels of SPARCL1 could result in decreases in synaptic activity that ultimately contributes to motor neuron degeneration. SPARCL1 also binds extracellular calcium108. Reduced astrocytic or neuronal SPARCL1 may then also promote calcium dyshomeostasis, which could likewise contribute to motor neuron vulnerability.
CADM3 (or nectin-like molecule 1 or synCAM3) is a cell junction protein that localizes to synapses110. The protein is an immunoglobulin-like molecule that is enriched in the nervous system and regulates cell-cell contacts and synapse formation109. In keeping with this role, developmental patterns of CADM3 expression are observed in the nervous system of multiple organisms109. The protein also has a role in the formation of functional NMJs110. Decreased levels of CADM3, thus, are predicted to impair synaptic maintenance, produce neuromuscular junction impairments, and reduce ECM integrity. Cumulatively, CADM3-induced alteration of any or all of these processes could make motor neurons susceptible to degeneration.
At present, studies characterizing the function of WDR63, the last of our classifier proteins, have not been performed. Unlike APLP1, SPARCL1, and CADM3, levels of WDR63 were elevated in ALS samples relative to HC and OND. This specificity for ALS makes it a promising biomarker though a hypothesized role in motor neuron degeneration or ALS more generally is difficult to predict. The WD-repeat is a common structural motif and many diverse functions, including signal transduction, mRNA synthesis, and cytoskeletal assembly, among others, can be assigned to proteins containing WD repeats111,112. Thus, further research is necessary to determine a functional connection between WDR63 and ALS.
In conclusion, we constructed LC-MS/MS proteomic profiles of sALS, HC, and OND CSF samples. We used these profiles to identify proteins whose levels are significantly altered in sALS samples relative to HC and OND samples. In doing so, we identified several proteins with documented associations with ALS, as well as several new candidate biomarkers with clear biological relevance to motor neuron degeneration. Using ontological analysis, we described several biological pathways that are altered in ALS. Lastly, we used an SVM learning algorithm to build a classifier capable of separating ALS samples from HC and OND samples.
Collectively, our results illustrate the utility of label-free LC-MS/MS proteomic methods, the promise of CSF as a biomarker source, and the applicability of machine learning methods to classifying samples based on mass spectrometric-based proteomic profiles.
Supplementary Material
Figure S-1. Tenascin R Validation Data. Lumbar spinal cord sections from sALS and HC patients were stained using a polyclonal anti-tenascin R antibody. Top Panel. Motor neurons from HC subjects show strong tenascin R immunoreactivity around the cell body. Bottom panel. Motor neurons from sALS cases show an absence of this staining pattern. All images were acquired with a 40× objective and the scale bar = 10 µm.
Figure S-2. eIF 4e Transporter (4e-T) Validation Data. Lumbar spinal cord sections from sALS and HC patients were stained using a polyclonal 4e-T antibody. Top panels. Light microscopy was used to visualize 4e-T staining in the lumbar spinal cord of sALS and HC subjects. Staining in HC subjects is diffuse throughout the nucleus. In contrast, sALS cases show nuclear and cytoplasmic (arrows) 4e-T inclusions and a loss of diffuse staining. All images were acquired with a 40× objective and the scale bar = 10 µm. Bottom panels. Immunofluorescence was used to further characterize 4e-T alterations in sALS. sALS 4e-T nuclear inclusion staining overlaps with p62 staining (arrows). Nuclear 4e-T staining in HC is diffuse and no nuclear p62 is observed (arrows). The presence of cytoplasmic autofluorescent lipofuscin is prominent in both cases and is indicated by arrowheads. All images were acquired with a 63× objective and the scale bar = 10 µm.
Table S-1. Global Results. The raw, unfiltered data set comprising all spectral counts for all groups prior to normalization is shown. Protein name and Uniprot accession number is shown and protein isoform is indicated in the accession number. HC = healthy control, OND = other neurological disease, MS = multiple sclerosis, UMND = upper motor neuron disease, LMND = lower motor neuron disease, AD = Alzheimer’s disease.
Table S-2. All Differentially Abundant Proteins. All proteins of significantly increased or decreased relative abundance in sALS samples are shown by q value rank (lowest to highest). Protein name, gene name, and Uniprot accession number is shown and protein isoform is indicated in the accession number. Log2 fold difference (FD) for each two group comparison is shown.
Acknowledgments
Funding Sources
This work was supported by National Institutes of Health/National Institutes of Neurological Disorders and Stroke grants NS068179 to RB, National Institutes of Health/National Institutes of Neurological Disorders and Stroke grant F31NS080614-01 to MC, and by an award from the Achievement Rewards for College Scientists Foundation, Inc. Pittsburgh Chapter to MC.
The authors wish to thank the patients and their families for participation in this study. CSF samples were provided by the Northeast ALS Consortium (NEALS) Biorepository.
ABBREVIATIONS
- ALS
amyotrophic lateral sclerosis
- sALS
sporadic amyotrophic lateral sclerosis
- fALS
familial amyotrophic lateral sclerosis
- HC
healthy control
- OND
other neurological disease
- MS
multiple sclerosis
- LMND
lower motor neuron disease
- UMND
upper motor neuron disease
- AD
Alzheimer’s disease
- ROC AUC
Area Under Receiver Operating Characteristic Curve
Footnotes
Supporting Information. Figures S1, 2; Tables S1, 2. This material is available free of charge via the Internet at http://pubs.acs.org.
Author Contributions
The manuscript was written through contributions of all authors. All authors have given approval to the final version of the manuscript.
References
- 1.Logroscino G, Traynor BJ, Hardiman O, Chio A, Mitchell D, Swingler RJ, Millul A, Benn E, Beghi E, Eurals I. Incidence of Amyotrophic Lateral Sclerosis in Europe. J. Neurol. Neurosurg. Psychiatry. 2010;81:385–90. doi: 10.1136/jnnp.2009.183525. [DOI] [PMC free article] [PubMed] [Google Scholar]
- 2.Wolf J, Wohrle JC, Palm F, Nix WA, Maschke M, Safer A, Becher H, Grau AJ. Incidence of Amyotrophic Lateral Sclerosis in Rhineland-Palatinate, Germany. Amyotroph Lateral Scler Frontotemporal Degener. 2014;15:269–74. doi: 10.3109/21678421.2014.887733. [DOI] [PubMed] [Google Scholar]
- 3.Kiernan MC, Vucic S, Cheah BC, Turner MR, Eisen A, Hardiman O, Burrell JR, Zoing MC. Amyotrophic Lateral Sclerosis. Lancet. 2011;377:942–55. doi: 10.1016/S0140-6736(10)61156-7. [DOI] [PubMed] [Google Scholar]
- 4.Thijs V, Peeters E, Theys P, Matthijs G, Robberecht W. Demographic Characteristics and Prognosis in a Flemish Amyotrophic Lateral Sclerosis Population. Acta Neurol. Belg. 2000;100:84–90. [PubMed] [Google Scholar]
- 5.Stambler N, Charatan M, Cedarbaum JM. Prognostic Indicators of Survival in ALS. ALS CNTF Treatment Study Group. Neurology. 1998;50:66–72. doi: 10.1212/wnl.50.1.66. [DOI] [PubMed] [Google Scholar]
- 6.Alcaz S, Jarebinski M, Pekmezovic T, Stevic-Marinkovic Z, Pavlovic S, Apostolski S. Epidemiological and Clinical Characteristics of ALS in Belgrade, Yugoslavia. Acta Neurol. Scand. 1996;94:264–8. doi: 10.1111/j.1600-0404.1996.tb07063.x. [DOI] [PubMed] [Google Scholar]
- 7.Martinez HR, Molina-Lopez JF, Cantu-Martinez L, Gonzalez-Garza MT, Moreno-Cuevas JE, Couret-Alcaraz P, Trevino SA, Webb-Vargas Y, Caro E, Gil-Valadez A, Santos-Guzman J, Hernandez-Torre M. Survival and Clinical Features in Hispanic Amyotrophic Lateral Sclerosis Patients. Amyotroph. Lateral. Scler. 2011;12:199–205. doi: 10.3109/17482968.2010.550302. [DOI] [PubMed] [Google Scholar]
- 8.Bensimon G, Lacomblez L, Meininger V. A Controlled Trial of Riluzole in Amyotrophic Lateral Sclerosis. ALS/Riluzole Study Group. N. Engl. J. Med. 1994;330:585–91. doi: 10.1056/NEJM199403033300901. [DOI] [PubMed] [Google Scholar]
- 9.Sabatelli M, Conte A, Zollino M. Clinical and Genetic Heterogeneity of Amyotrophic Lateral Sclerosis. Clin. Genet. 2013;83:408–16. doi: 10.1111/cge.12117. [DOI] [PubMed] [Google Scholar]
- 10.Iguchi Y, Katsuno M, Ikenaka K, Ishigaki S, Sobue G. Amyotrophic Lateral Sclerosis: An Update on Recent Genetic Insights. J. Neurol. 2013;260:2917–27. doi: 10.1007/s00415-013-7112-y. [DOI] [PubMed] [Google Scholar]
- 11.Turner MR, Hardiman O, Benatar M, Brooks BR, Chio A, de Carvalho M, Ince PG, Lin C, Miller RG, Mitsumoto H, Nicholson G, Ravits J, Shaw PJ, Swash M, Talbot K, Traynor BJ, Van den Berg LH, Veldink JH, Vucic S, Kiernan MC. Controversies and Priorities in Amyotrophic Lateral Sclerosis. Lancet Neurol. 2013;12:310–22. doi: 10.1016/S1474-4422(13)70036-X. [DOI] [PMC free article] [PubMed] [Google Scholar]
- 12.Rossi L, Valle C, Carri MT. Altered Gene Expression, Mitochondrial Damage and Oxidative Stress: Converging Routes in Motor Neuron Degeneration. Int. J. Cell Biol. 2012;2012:908724. doi: 10.1155/2012/908724. [DOI] [PMC free article] [PubMed] [Google Scholar]
- 13.Turner MR, Swash M. The Expanding Syndrome of Amyotrophic Lateral Sclerosis: A Clinical and Molecular Odyssey. J. Neurol. Neurosurg. Psychiatry. 2015;86:667–73. doi: 10.1136/jnnp-2014-308946. [DOI] [PMC free article] [PubMed] [Google Scholar]
- 14.Neumann M. Frontotemporal Lobar Degeneration and Amyotrophic Lateral Sclerosis: Molecular Similarities and Differences. Rev. Neurol. 2013;169:793–8. doi: 10.1016/j.neurol.2013.07.019. [DOI] [PubMed] [Google Scholar]
- 15.Teng PN, Bateman NW, Hood BL, Conrads TP. Advances in Proximal Fluid Proteomics for Disease Biomarker Discovery. J. Proteome Res. 2010;9:6091–100. doi: 10.1021/pr100904q. [DOI] [PubMed] [Google Scholar]
- 16.Ogata Y, Charlesworth MC, Muddiman DC. Evaluation of Protein Depletion Methods for the Analysis of Total-, Phospho- and Glycoproteins in Lumbar Cerebrospinal Fluid. J. Proteome Res. 2005;4:837–45. doi: 10.1021/pr049750o. [DOI] [PubMed] [Google Scholar]
- 17.Ramstrom M, Zuberovic A, Gronwall C, Hanrieder J, Bergquist J, Hober S. Development of Affinity Columns for the Removal of High-Abundance Proteins in Cerebrospinal Fluid. Biotechnol. Appl. Biochem. 2009;52:159–66. doi: 10.1042/BA20080015. [DOI] [PubMed] [Google Scholar]
- 18.Hosokawa M, Arai T, Yamashita M, Tsuji H, Nonaka T, Masuda-Suzukake M, Tamaoka A, Hasegawa M, Akiyama H. Differential Diagnosis of Amyotrophic Lateral Sclerosis from Guillain-Barre Syndrome by Quantitative Determination of TDP-43 in Cerebrospinal Fluid. Int. J. Neurosci. 2014;124:344–9. doi: 10.3109/00207454.2013.848440. [DOI] [PubMed] [Google Scholar]
- 19.Kasai T, Tokuda T, Ishigami N, Sasayama H, Foulds P, Mitchell DJ, Mann DM, Allsop D, Nakagawa M. Increased TDP-43 Protein in Cerebrospinal Fluid of Patients with Amyotrophic Lateral Sclerosis. Acta Neuropathol. 2009;117:55–62. doi: 10.1007/s00401-008-0456-1. [DOI] [PubMed] [Google Scholar]
- 20.Noto Y, Shibuya K, Sato Y, Kanai K, Misawa S, Sawai S, Mori M, Uchiyama T, Isose S, Nasu S, Sekiguchi Y, Fujimaki Y, Kasai T, Tokuda T, Nakagawa M, Kuwabara S. Elevated CSF TDP-43 Levels in Amyotrophic Lateral Sclerosis: Specificity, Sensitivity, and a Possible Prognostic Value. Amyotroph. Lateral. Scler. 2011;12:140–3. doi: 10.3109/17482968.2010.541263. [DOI] [PubMed] [Google Scholar]
- 21.Harari O, Cruchaga C, Kauwe JS, Ainscough BJ, Bales K, Pickering EH, Bertelsen S, Fagan AM, Holtzman DM, Morris JC, Goate AM. Phosphorylated Tau-Abeta Ratio as a Continuous Trait for Biomarker Discovery for Early-Stage Alzheimer's Disease in Multiplex Immunoassay Panels of Cerebrospinal Fluid. Biol. Psychiatry. 2014;75:723–31. doi: 10.1016/j.biopsych.2013.11.032. [DOI] [PMC free article] [PubMed] [Google Scholar]
- 22.Parnetti L, Castrioto A, Chiasserini D, Persichetti E, Tambasco N, El-Agnaf O, Calabresi P. Cerebrospinal Fluid Biomarkers in Parkinson Disease. Nat. Rev. Neurol. 2013;9:131–40. doi: 10.1038/nrneurol.2013.10. [DOI] [PubMed] [Google Scholar]
- 23.Awad A, Hemmer B, Hartung HP, Kieseier B, Bennett JL, Stuve O. Analyses of Cerebrospinal Fluid in the Diagnosis and Monitoring of Multiple Sclerosis. J. Neuroimmunol. 2010;219:1–7. doi: 10.1016/j.jneuroim.2009.09.002. [DOI] [PubMed] [Google Scholar]
- 24.Bowser R, Turner MR, Shefner J. Biomarkers in Amyotrophic Lateral Sclerosis: Opportunities and Limitations. Nat. Rev. Neurol. 2011;7:631–8. doi: 10.1038/nrneurol.2011.151. [DOI] [PubMed] [Google Scholar]
- 25.Lange DJ, Andersen PM, Remanan R, Marklund S, Benjamin D. Pyrimethamine Decreases Levels of SOD1 in Leukocytes and Cerebrospinal Fluid of ALS Patients: A Phase I Pilot Study. Amyotroph. Lateral. Scler. Frontotemporal. Degener. 2013;14:199–204. doi: 10.3109/17482968.2012.724074. [DOI] [PubMed] [Google Scholar]
- 26.Liu H, Sadygov RG, Yates JR., 3rd A Model for Random Sampling and Estimation of Relative Protein Abundance in Shotgun Proteomics. Anal. Chem. 2004;76:4193–201. doi: 10.1021/ac0498563. [DOI] [PubMed] [Google Scholar]
- 27.Gokce E, Shuford CM, Franck WL, Dean RA, Muddiman DC. Evaluation of Normalization Methods on GeLC-MS/MS Label-Free Spectral Counting Data to Correct for Variation During Proteomic Workflows. J. Am. Soc. Mass Spectrom. 2011;22:2199–208. doi: 10.1007/s13361-011-0237-2. [DOI] [PubMed] [Google Scholar]
- 28.Eng JK, McCormack AL, Yates JR. An Approach to Correlate Tandem Mass Spectral Data of Peptides with Amino Acid Sequences in a Protein Database. J. Am. Soc. Mass Spectrom. 1994;5:976–89. doi: 10.1016/1044-0305(94)80016-2. [DOI] [PubMed] [Google Scholar]
- 29.Old WM, Meyer-Arendt K, Aveline-Wolf L, Pierce KG, Mendoza A, Sevinsky JR, Resing KA, Ahn NG. Comparison of Label-Free Methods for Quantifying Human Proteins by Shotgun Proteomics. Mol. Cell. Proteomics. 2005;4:1487–502. doi: 10.1074/mcp.M500084-MCP200. [DOI] [PubMed] [Google Scholar]
- 30.Ashburner M, Ball CA, Blake JA, Botstein D, Butler H, Cherry JM, Davis AP, Dolinski K, Dwight SS, Eppig JT, Harris MA, Hill DP, Issel-Tarver L, Kasarskis A, Lewis S, Matese JC, Richardson JE, Ringwald M, Rubin GM, Sherlock G. Gene Ontology: Tool for the Unification of Biology. The Gene Ontology Consortium. Nat. Genet. 2000;25:25–9. doi: 10.1038/75556. [DOI] [PMC free article] [PubMed] [Google Scholar]
- 31.Saeys Y, Inza I, Larranaga P. A Review of Feature Selection Techniques in Bioinformatics. Bioinformatics. 2007;23:2507–17. doi: 10.1093/bioinformatics/btm344. [DOI] [PubMed] [Google Scholar]
- 32.Han M, Dai J, Zhang Y, Lin Q, Jiang M, Xu X, Liu Q, Jia J. Support Vector Machines Coupled with Proteomics Approaches for Detecting Biomarkers Predicting Chemotherapy Resistance in Small Cell Lung Cancer. Oncol. Rep. 2012;28:2233–8. doi: 10.3892/or.2012.2037. [DOI] [PubMed] [Google Scholar]
- 33.Gollapalli K, Ray S, Srivastava R, Renu D, Singh P, Dhali S, Bajpai Dikshit J, Srikanth R, Moiyadi A, Srivastava S. Investigation of Serum Proteome Alterations in Human Glioblastoma Multiforme. Proteomics. 2012;12:2378–90. doi: 10.1002/pmic.201200002. [DOI] [PubMed] [Google Scholar]
- 34.Cima I, Schiess R, Wild P, Kaelin M, Schuffler P, Lange V, Picotti P, Ossola R, Templeton A, Schubert O, Fuchs T, Leippold T, Wyler S, Zehetner J, Jochum W, Buhmann J, Cerny T, Moch H, Gillessen S, Aebersold R, Krek W. Cancer Genetics-Guided Discovery of Serum Biomarker Signatures for Diagnosis and Prognosis of Prostate Cancer. Proc. Natl. Acad. Sci. U. S. A. 2011;108:3342–7. doi: 10.1073/pnas.1013699108. [DOI] [PMC free article] [PubMed] [Google Scholar]
- 35.Di Silvestre D, Zoppis I, Brambilla F, Bellettato V, Mauri G, Mauri P. Availability of Mudpit Data for Classification of Biological Samples. J. Clin. Bioinforma. 2013;3:1. doi: 10.1186/2043-9113-3-1. [DOI] [PMC free article] [PubMed] [Google Scholar]
- 36.Schutzer SE, Liu T, Natelson BH, Angel TE, Schepmoes AA, Purvine SO, Hixson KK, Lipton MS, Camp DG, Coyle PK, Smith RD, Bergquist J. Establishing the Proteome of Normal Human Cerebrospinal Fluid. PLoS One. 2010;5:e10980. doi: 10.1371/journal.pone.0010980. [DOI] [PMC free article] [PubMed] [Google Scholar]
- 37.Perrin RJ, Payton JE, Malone JP, Gilmore P, Davis AE, Xiong C, Fagan AM, Townsend RR, Holtzman DM. Quantitative Label-Free Proteomics for Discovery of Biomarkers in Cerebrospinal Fluid: Assessment of Technical and Inter-Individual Variation. PLoS One. 2013;8:e64314. doi: 10.1371/journal.pone.0064314. [DOI] [PMC free article] [PubMed] [Google Scholar]
- 38.Ranganathan S, Williams E, Ganchev P, Gopalakrishnan V, Lacomis D, Urbinelli L, Newhall K, Cudkowicz ME, Brown RH, Jr, Bowser R. Proteomic Profiling of Cerebrospinal Fluid Identifies Biomarkers for Amyotrophic Lateral Sclerosis. J. Neurochem. 2005;95:1461–71. doi: 10.1111/j.1471-4159.2005.03478.x. [DOI] [PMC free article] [PubMed] [Google Scholar]
- 39.Pasinetti GM, Ungar LH, Lange DJ, Yemul S, Deng H, Yuan X, Brown RH, Cudkowicz ME, Newhall K, Peskind E, Marcus S, Ho L. Identification of Potential CSF Biomarkers in ALS. Neurology. 2006;66:1218–22. doi: 10.1212/01.wnl.0000203129.82104.07. [DOI] [PubMed] [Google Scholar]
- 40.Ramstrom M, Ivonin I, Johansson A, Askmark H, Markides KE, Zubarev R, Hakansson P, Aquilonius SM, Bergquist J. Cerebrospinal Fluid Protein Patterns in Neurodegenerative Disease Revealed by Liquid Chromatography-Fourier Transform Ion Cyclotron Resonance Mass Spectrometry. Proteomics. 2004;4:4010–8. doi: 10.1002/pmic.200400871. [DOI] [PubMed] [Google Scholar]
- 41.Brettschneider J, Lehmensiek V, Mogel H, Pfeifle M, Dorst J, Hendrich C, Ludolph AC, Tumani H. Proteome Analysis Reveals Candidate Markers of Disease Progression in Amyotrophic Lateral Sclerosis (ALS) Neurosci. Lett. 2010;468:23–7. doi: 10.1016/j.neulet.2009.10.053. [DOI] [PubMed] [Google Scholar]
- 42.von Neuhoff N, Oumeraci T, Wolf T, Kollewe K, Bewerunge P, Neumann B, Brors B, Bufler J, Wurster U, Schlegelberger B, Dengler R, Zapatka M, Petri S. Monitoring CSF Proteome Alterations in Amyotrophic Lateral Sclerosis: Obstacles and Perspectives in Translating a Novel Marker Panel to the Clinic. PLoS One. 2012;7:e44401. doi: 10.1371/journal.pone.0044401. [DOI] [PMC free article] [PubMed] [Google Scholar]
- 43.You JS, Gelfanova V, Knierman MD, Witzmann FA, Wang M, Hale JE. The Impact of Blood Contamination on the Proteome of Cerebrospinal Fluid. Proteomics. 2005;5:290–6. doi: 10.1002/pmic.200400889. [DOI] [PubMed] [Google Scholar]
- 44.Elias JE, Gygi SP. Target-Decoy Search Strategy for Increased Confidence in Large-Scale Protein Identifications by Mass Spectrometry. Nat Methods. 2007;4:207–14. doi: 10.1038/nmeth1019. [DOI] [PubMed] [Google Scholar]
- 45.Gregori J, Villarreal L, Sanchez A, Baselga J, Villanueva J. An Effect Size Filter Improves the Reproducibility in Spectral Counting-Based Comparative Proteomics. J. Proteomics. 2013;95:55–65. doi: 10.1016/j.jprot.2013.05.030. [DOI] [PubMed] [Google Scholar]
- 46.Pham TV, Piersma SR, Warmoes M, Jimenez CR. On the Beta-Binomial Model for Analysis of Spectral Count Data in Label-Free Tandem Mass Spectrometry-Based Proteomics. Bioinformatics. 2010;26:363–9. doi: 10.1093/bioinformatics/btp677. [DOI] [PubMed] [Google Scholar]
- 47.Benjamini Y, Hochberg Y. Controlling the False Discovery Rate: A Practical and Powerful Approach to Multiple Testing. J. ournal of the Royal Statistical Society. 1995;1:289–300. [Google Scholar]
- 48.Storey JD, Tibshirani R. Statistical Significance for Genomewide Studies. Proc. Natl. Acad. Sci. U. S. A. 2003;100:9440–5. doi: 10.1073/pnas.1530509100. [DOI] [PMC free article] [PubMed] [Google Scholar]
- 49.Storey JD, Taylor JE, Siegmund D. Strong Control, Conservative Point Estimation, and Simultaneous Conservative Consistency of False Discovery Rates: A Unified Approach. Journal of the Royal Statistical Society. 2004;66:187–205. [Google Scholar]
- 50.Storey JD. A Direct Approach to False Discovery Rates. Journal of the Royal Statistical Society. 2002;64:479–498. [Google Scholar]
- 51.Tusher VG, Tibshirani R, Chu G. Significance Analysis of Microarrays Applied to the Ionizing Radiation Response. Proc. Natl. Acad. Sci. U. S. A. 2001;98(9):5116–21. doi: 10.1073/pnas.091062498. [DOI] [PMC free article] [PubMed] [Google Scholar]
- 52.Karp NA, McCormick PS, Russell MR, Lilley KS. Experimental and Statistical Considerations to Avoid False Conclusions in Proteomics Studies Using Differential In-Gel Electrophoresis. Mol. Cell. Proteomics. 2007;6:1354–64. doi: 10.1074/mcp.M600274-MCP200. [DOI] [PubMed] [Google Scholar]
- 53.Hendrickson EL, Xia Q, Wang T, Leigh JA, Hackett M. Comparison of Spectral Counting and Metabolic Stable Isotope Labeling for Use with Quantitative Microbial Proteomics. Analyst. 2006;131:1335–41. doi: 10.1039/b610957h. [DOI] [PMC free article] [PubMed] [Google Scholar]
- 54.Bhatia VN, Perlman DH, Costello CE, McComb ME. Software Tool for Researching Annotations of Proteins: Open-Source Protein Annotation Software with Data Visualization. Anal. Chem. 2009;81:9819–23. doi: 10.1021/ac901335x. [DOI] [PMC free article] [PubMed] [Google Scholar]
- 55.Bhatia VN, Perlman DH, Costello CE, McComb ME. Software Tool for Researching Annotations of Proteins: Open-Source Protein Annotation Software with Data Visualization. Anal. Chem. 2009;81:9819–23. doi: 10.1021/ac901335x. [DOI] [PMC free article] [PubMed] [Google Scholar]
- 56.Shannon P, Markiel A, Ozier O, Baliga NS, Wang JT, Ramage D, Amin N, Schwikowski B, Ideker T. Cytoscape: A Software Environment for Integrated Models of Biomolecular Interaction Networks. Genome Res. 2003;13:2498–504. doi: 10.1101/gr.1239303. [DOI] [PMC free article] [PubMed] [Google Scholar]
- 57.Bindea G, Mlecnik B, Hackl H, Charoentong P, Tosolini M, Kirilovsky A, Fridman WH, Pages F, Trajanoski Z, Galon J. Cluego: A Cytoscape Plug-in to Decipher Functionally Grouped Gene Ontology and Pathway Annotation Networks. Bioinformatics. 2009;25:1091–3. doi: 10.1093/bioinformatics/btp101. [DOI] [PMC free article] [PubMed] [Google Scholar]
- 58.Rivals I, Personnaz L, Taing L, Potier MC. Enrichment or Depletion of a Go Category within a Class of Genes: Which Test? Bioinformatics. 2007;23:401–7. doi: 10.1093/bioinformatics/btl633. [DOI] [PubMed] [Google Scholar]
- 59.Khatri P, Draghici S. Ontological Analysis of Gene Expression Data: Current Tools, Limitations, and Open Problems. Bioinformatics. 2005;21:3587–95. doi: 10.1093/bioinformatics/bti565. [DOI] [PMC free article] [PubMed] [Google Scholar]
- 60.Tilford CA, Siemers NO. Gene Set Enrichment Analysis. Methods Mol. Biol. 2009;563:99–121. doi: 10.1007/978-1-60761-175-2_6. [DOI] [PubMed] [Google Scholar]
- 61.Bindea G, Galon J, Mlecnik B. Cluepedia Cytoscape Plugin: Pathway Insights Using Integrated Experimental and in Silico Data. Bioinformatics. 2013;29:661–3. doi: 10.1093/bioinformatics/btt019. [DOI] [PMC free article] [PubMed] [Google Scholar]
- 62.Snel B, Lehmann G, Bork P, Huynen MA. String: A Web-Server to Retrieve and Display the Repeatedly Occurring Neighbourhood of a Gene. Nucleic Acids Res. 2000;28:3442–4. doi: 10.1093/nar/28.18.3442. [DOI] [PMC free article] [PubMed] [Google Scholar]
- 63.von Mering C, Huynen M, Jaeggi D, Schmidt S, Bork P, Snel B. String: A Database of Predicted Functional Associations between Proteins. Nucleic Acids Res. 2003;31:258–61. doi: 10.1093/nar/gkg034. [DOI] [PMC free article] [PubMed] [Google Scholar]
- 64.Hall M, Frank E, Holmes G, Pfahringer B, Reutemann P, Witten IH. The Weka Data Mining Software: An Update. SIGKDD Explorations. 2009;11:10–18. [Google Scholar]
- 65.Golub TR, Slonim DK, Tamayo P, Huard C, Gaasenbeek M, Mesirov JP, Coller H, Loh ML, Downing JR, Caligiuri MA, Bloomfield CD, Lander ES. Molecular Classification of Cancer: Class Discovery and Class Prediction by Gene Expression Monitoring. Science. 1999;286:531–7. doi: 10.1126/science.286.5439.531. [DOI] [PubMed] [Google Scholar]
- 66.Carvalho PC, Hewel J, Barbosa VC, Yates JR. Identifying Differences in Protein Expression Levels by Spectral Counting and Feature Selection. Genet. Mol. Res. 2008;7:342–56. doi: 10.4238/vol7-2gmr426. [DOI] [PMC free article] [PubMed] [Google Scholar]
- 67.Guyon I, Weston J, Barnhill S, Vapnik V. Gene Selection for Cancer Classification Using Support Vector Machines. Machine Learning. 2002;46:389–422. [Google Scholar]
- 68.Collins MA, An J, Peller D, Bowser R. Total Protein Is an Effective Loading Control for Cerebrospinal Fluid Western Blots. J. Neurosci. Methods. 2015;251:72–82. doi: 10.1016/j.jneumeth.2015.05.011. [DOI] [PMC free article] [PubMed] [Google Scholar]
- 69.Degasperi A, Birtwistle MR, Volinsky N, Rauch J, Kolch W, Kholodenko BN. Evaluating Strategies to Normalise Biological Replicates of Western Blot Data. PloS One. 2014;9:e87293. doi: 10.1371/journal.pone.0087293. [DOI] [PMC free article] [PubMed] [Google Scholar]
- 70.Ganesalingam J, An J, Shaw CE, Shaw G, Lacomis D, Bowser R. Combination of Neurofilament Heavy Chain and Complement C3 as CSF Biomarkers for ALS. J. Neurochem. 2011;117:528–37. doi: 10.1111/j.1471-4159.2011.07224.x. [DOI] [PMC free article] [PubMed] [Google Scholar]
- 71.Wilson ME, Boumaza I, Lacomis D, Bowser R. Cystatin C: A Candidate Biomarker for Amyotrophic Lateral Sclerosis. PLoS One. 2010;5:e15133. doi: 10.1371/journal.pone.0015133. [DOI] [PMC free article] [PubMed] [Google Scholar]
- 72.Collins M, Riascos D, Kovalik T, An J, Krupa K, Krupa K, Hood BL, Conrads TP, Renton AE, Traynor BJ, Bowser R. The RNA-Binding Motif 45 (RBM45) Protein Accumulates in Inclusion Bodies in Amyotrophic Lateral Sclerosis (ALS) and Frontotemporal Lobar Degeneration with TDP-43 Inclusions (FTLD-TDP) Patients. Acta Neuropathol. 2012;124:717–32. doi: 10.1007/s00401-012-1045-x. [DOI] [PMC free article] [PubMed] [Google Scholar]
- 74.Suzuki Y, Minami M, Suzuki M, Abe K, Zenno S, Tsujimoto M, Matsumoto K, Minami Y. The Hsp90 Inhibitor Geldanamycin Abrogates Colocalization of Eif4e and Eif4e-Transporter into Stress Granules and Association of Eif4e with Eif4g. J. Biol. Chem. 2009;284:35597–604. doi: 10.1074/jbc.M109.036285. [DOI] [PMC free article] [PubMed] [Google Scholar]
- 75.Liu-Yesucevitz L, Bilgutay A, Zhang YJ, Vanderweyde T, Citro A, Mehta T, Zaarur N, McKee A, Bowser R, Sherman M, Petrucelli L, Wolozin B. Tar DNA Binding Protein-43 (TDP-43) Associates with Stress Granules: Analysis of Cultured Cells and Pathological Brain Tissue. PloS One. 2010;5:e13250. doi: 10.1371/journal.pone.0013250. [DOI] [PMC free article] [PubMed] [Google Scholar]
- 76.Cushing H. Studies on the Cerebro-Spinal Fluid : I. Introduction. J. Med. Res. 1914;31:1–19. [PMC free article] [PubMed] [Google Scholar]
- 77.Conly JM, Ronald AR. Cerebrospinal Fluid as a Diagnostic Body Fluid. Am. J. Med. 1983;75:102–8. doi: 10.1016/0002-9343(83)90080-3. [DOI] [PubMed] [Google Scholar]
- 78.Tsuji-Akimoto S, Yabe I, Niino M, Kikuchi S, Sasaki H. Cystatin C in Cerebrospinal Fluid as a Biomarker of ALS. Neurosci. Lett. 2009;452:52–5. doi: 10.1016/j.neulet.2009.01.026. [DOI] [PubMed] [Google Scholar]
- 79.Bartolomucci A, Pasinetti GM, Salton SR. Granins as Disease-Biomarkers: Translational Potential for Psychiatric and Neurological Disorders. Neuroscience. 2010;170:289–97. doi: 10.1016/j.neuroscience.2010.06.057. [DOI] [PubMed] [Google Scholar]
- 80.Van Hoecke A, Schoonaert L, Lemmens R, Timmers M, Staats KA, Laird AS, Peeters E, Philips T, Goris A, Dubois B, Andersen PM, Al-Chalabi A, Thijs V, Turnley AM, van Vught PW, Veldink JH, Hardiman O, Van Den Bosch L, Gonzalez-Perez P, Van Damme P, Brown RH, Jr, van den Berg LH, Robberecht W. Epha4 Is a Disease Modifier of Amyotrophic Lateral Sclerosis in Animal Models and in Humans. Nat. Med. 2012;18:1418–22. doi: 10.1038/nm.2901. [DOI] [PubMed] [Google Scholar]
- 81.Brockington A, Ning K, Heath PR, Wood E, Kirby J, Fusi N, Lawrence N, Wharton SB, Ince PG, Shaw PJ. Unravelling the Enigma of Selective Vulnerability in Neurodegeneration: Motor Neurons Resistant to Degeneration in Als Show Distinct Gene Expression Characteristics and Decreased Susceptibility to Excitotoxicity. Acta Neuropathol. 2013;125:95–109. doi: 10.1007/s00401-012-1058-5. [DOI] [PMC free article] [PubMed] [Google Scholar]
- 82.Annunziata P, Volpi N. High Levels of C3c in the Cerebrospinal Fluid from Amyotrophic Lateral Sclerosis Patients. Acta. Neurol. Scand. 1985;72:61–4. doi: 10.1111/j.1600-0404.1985.tb01548.x. [DOI] [PubMed] [Google Scholar]
- 83.Mantovani S, Gordon R, Macmaw JK, Pfluger CM, Henderson RD, Noakes PG, McCombe PA, Woodruff TM. Elevation of the Terminal Complement Activation Products C5a and C5b-9 in ALS Patient Blood. J. Neuroimmunol. 2014;276:213–8. doi: 10.1016/j.jneuroim.2014.09.005. [DOI] [PubMed] [Google Scholar]
- 84.Goldknopf IL, Sheta EA, Bryson J, Folsom B, Wilson C, Duty J, Yen AA, Appel SH. Complement C3c and Related Protein Biomarkers in Amyotrophic Lateral Sclerosis and Parkinson's Disease. Biochem. Biophys. Res. Commun. 2006;342:1034–9. doi: 10.1016/j.bbrc.2006.02.051. [DOI] [PubMed] [Google Scholar]
- 85.Lee JD, Kamaruzaman NA, Fung JN, Taylor SM, Turner BJ, Atkin JD, Woodruff TM, Noakes PG. Dysregulation of the Complement Cascade in the Hsod1g93a Transgenic Mouse Model of Amyotrophic Lateral Sclerosis. J. Neuroinflammation. 2013;10:110–9. doi: 10.1186/1742-2094-10-119. [DOI] [PMC free article] [PubMed] [Google Scholar]
- 86.Heurich B, El Idrissi NB, Donev RM, Petri S, Claus P, Neal J, Morgan BP, Ramaglia V. Complement Upregulation and Activation on Motor Neurons and Neuromuscular Junction in the SOD1 G93A Mouse Model of Familial Amyotrophic Lateral Sclerosis. J. Neuroimmunol. 2011;235:104–9. doi: 10.1016/j.jneuroim.2011.03.011. [DOI] [PubMed] [Google Scholar]
- 87.Woodruff TM, Costantini KJ, Taylor SM, Noakes PG. Role of Complement in Motor Neuron Disease: Animal Models and Therapeutic Potential of Complement Inhibitors. Adv. Exp. Med. Biol. 2008;632:143–58. [PubMed] [Google Scholar]
- 88.Dadon-Nachum M, Melamed E, Offen D. The "Dying-Back" Phenomenon of Motor Neurons in Als. J. Mol. Neurosci. 2011;43:470–7. doi: 10.1007/s12031-010-9467-1. [DOI] [PubMed] [Google Scholar]
- 89.Fischer LR, Glass JD. Axonal Degeneration in Motor Neuron Disease. Neurodegener. Dis. 2007;4:431–42. doi: 10.1159/000107704. [DOI] [PubMed] [Google Scholar]
- 90.Sasaki S, Iwata M. Dendritic Synapses of Anterior Horn Neurons in Amyotrophic Lateral Sclerosis: An Ultrastructural Study. Acta. Neuropathol. 1996;91:278–83. doi: 10.1007/s004010050426. [DOI] [PubMed] [Google Scholar]
- 91.Sasaki S, Iwata M. Ultrastructural Study of Synapses in the Anterior Horn Neurons of Patients with Amyotrophic Lateral Sclerosis. Neurosci. Lett. 1996;204:53–6. doi: 10.1016/0304-3940(96)12314-4. [DOI] [PubMed] [Google Scholar]
- 92.Venkova K, Christov A, Kamaluddin Z, Kobalka P, Siddiqui S, Hensley K. Semaphorin 3a Signaling through Neuropilin-1 Is an Early Trigger for Distal Axonopathy in the SOD1G93A Mouse Model of Amyotrophic Lateral Sclerosis. J. Neuropathol. Exp. Neurol. 2014;73:702–13. doi: 10.1097/NEN.0000000000000086. [DOI] [PMC free article] [PubMed] [Google Scholar]
- 93.De Winter F, Vo T, Stam FJ, Wisman LA, Bar PR, Niclou SP, van Muiswinkel FL, Verhaagen J. The Expression of the Chemorepellent Semaphorin 3a Is Selectively Induced in Terminal Schwann Cells of a Subset of Neuromuscular Synapses That Display Limited Anatomical Plasticity and Enhanced Vulnerability in Motor Neuron Disease. Mol. Cell. Neurosci. 2006;32:102–17. doi: 10.1016/j.mcn.2006.03.002. [DOI] [PubMed] [Google Scholar]
- 94.Rabin SJ, Kim JM, Baughn M, Libby RT, Kim YJ, Fan Y, Libby RT, La Spada A, Stone B, Ravits J. Sporadic ALS Has Compartment-Specific Aberrant Exon Splicing and Altered Cell-Matrix Adhesion Biology. Hum. Mol. Genet. 2010;19:313–28. doi: 10.1093/hmg/ddp498. [DOI] [PMC free article] [PubMed] [Google Scholar]
- 95.Forostyak S, Homola A, Turnovcova K, Svitil P, Jendelova P, Sykova E. Intrathecal Delivery of Mesenchymal Stromal Cells Protects the Structure of Altered Perineuronal Nets in SOD1 Rats and Amends the Course of ALS. Stem Cells. 2014;32:3163–72. doi: 10.1002/stem.1812. [DOI] [PMC free article] [PubMed] [Google Scholar]
- 96.Karetko M, Skangiel-Kramska J. Diverse Functions of Perineuronal Nets. Acta Neurobiol. Exp. 2009;69:564–77. doi: 10.55782/ane-2009-1766. [DOI] [PubMed] [Google Scholar]
- 97.Wang D, Fawcett J. The Perineuronal Net and the Control of CNS Plasticity. Cell Tissue Res. 2012;349:147–60. doi: 10.1007/s00441-012-1375-y. [DOI] [PubMed] [Google Scholar]
- 98.Suttkus A, Rohn S, Weigel S, Glockner P, Arendt T, Morawski M. Aggrecan, Link Protein and Tenascin-R Are Essential Components of the Perineuronal Net to Protect Neurons against Iron-Induced Oxidative Stress. Cell Death Dis. 2014;5:e1119. doi: 10.1038/cddis.2014.25. [DOI] [PMC free article] [PubMed] [Google Scholar]
- 99.Lin WL, Dickson DW. Ultrastructural Localization of TDP-43 in Filamentous Neuronal Inclusions in Various Neurodegenerative Diseases. Acta Neuropathol. 2008;116:205–13. doi: 10.1007/s00401-008-0408-9. [DOI] [PMC free article] [PubMed] [Google Scholar]
- 100.Robinson JL, Geser F, Stieber A, Umoh M, Kwong LK, Van Deerlin VM, Lee VM, Trojanowski JQ. TDP-43 Skeins Show Properties of Amyloid in a Subset of ALS Cases. Acta Neuropathol. 2013;125:121–31. doi: 10.1007/s00401-012-1055-8. [DOI] [PMC free article] [PubMed] [Google Scholar]
- 101.Al-Sarraj S, King A, Troakes C, Smith B, Maekawa S, Bodi I, Rogelj B, Al-Chalabi A, Hortobagyi T, Shaw CE. P62 Positive, TDP-43 Negative, Neuronal Cytoplasmic and Intranuclear Inclusions in the Cerebellum and Hippocampus Define the Pathology of C9orf72-Linked FTLD and MND/ALS. Acta Neuropathol. 2011;122:691–702. doi: 10.1007/s00401-011-0911-2. [DOI] [PubMed] [Google Scholar]
- 102.Komori M, Matsuyama Y, Nirasawa T, Thiele H, Becker M, Alexandrov T, Saida T, Tanaka M, Matsuo H, Tomimoto H, Takahashi R, Tashiro K, Ikegawa M, Kondo T. Proteomic Pattern Analysis Discriminates among Multiple Sclerosis-Related Disorders. Ann. Neurol. 2012;71:614–23. doi: 10.1002/ana.22633. [DOI] [PubMed] [Google Scholar]
- 103.Cousins SL, Dai W, Stephenson FA. APLP1 and APLP2, Members of the APP Family of Proteins, Behave Similarly to APP in That They Associate with NMDA Receptors and Enhance NMDA Receptor Surface Expression. J. Neurochem. 2015;133:879–85. doi: 10.1111/jnc.13063. [DOI] [PubMed] [Google Scholar]
- 104.Klevanski M, Saar M, Baumkotter F, Weyer SW, Kins S, Muller UC. Differential Role of APP and APLPs for Neuromuscular Synaptic Morphology and Function. Mol. Cell. Neurosci. 2014;61:201–10. doi: 10.1016/j.mcn.2014.06.004. [DOI] [PubMed] [Google Scholar]
- 105.Hambrock HO, Nitsche DP, Hansen U, Bruckner P, Paulsson M, Maurer P, Hartmann U. SC1/Hevin. An Extracellular Calcium-Modulated Protein That Binds Collagen I. J. Biol. Chem. 2003;278:11351–8. doi: 10.1074/jbc.M212291200. [DOI] [PubMed] [Google Scholar]
- 106.Kucukdereli H, Allen NJ, Lee AT, Feng A, Ozlu MI, Conatser LM, Chakraborty C, Workman G, Weaver M, Sage EH, Barres BA, Eroglu C. Control of Excitatory CNS Synaptogenesis by Astrocyte-Secreted Proteins Hevin and SPARC. Proc. Natl. Acad. Sci. USA. 2011;108:E440–9. doi: 10.1073/pnas.1104977108. [DOI] [PMC free article] [PubMed] [Google Scholar]
- 107.Kakunaga S, Ikeda W, Itoh S, Deguchi-Tawarada M, Ohtsuka T, Mizoguchi A, Takai Y. Nectin-Like Molecule-1/TSLL1/SynCAM3: A Neural Tissue-Specific Immunoglobulin-Like Cell-Cell Adhesion Molecule Localizing at Non-Junctional Contact Sites of Presynaptic Nerve Terminals, Axons and Glia Cell Processes. J. Cell. Sci. 2005;118:1267–77. doi: 10.1242/jcs.01656. [DOI] [PubMed] [Google Scholar]
- 108.Gao J, Chen T, Hu G, Gong Y, Qiang B, Yuan J, Peng X. Nectin-Like Molecule 1 Is a Glycoprotein with a Single N-Glycosylation Site at N290KS Which Influences Its Adhesion Activity. Biochim. Biophys. Acta. 2008;1778:1429–35. doi: 10.1016/j.bbamem.2008.03.013. [DOI] [PubMed] [Google Scholar]
- 109.Hunter PR, Nikolaou N, Odermatt B, Williams PR, Drescher U, Meyer MP. Localization of CADM2a and CADM3 Proteins During Development of the Zebrafish Nervous System. J. Comp. Neurol. 2011;519:2252–70. doi: 10.1002/cne.22627. [DOI] [PubMed] [Google Scholar]
- 110.Tanabe Y, Fujita E, Hayashi YK, Zhu X, Lubbert H, Mezaki Y, Senoo H, Momoi T. Synaptic Adhesion Molecules in CADM Family at the Neuromuscular Junction. Cell Biol. Int. 2013;37:731–6. doi: 10.1002/cbin.10092. [DOI] [PubMed] [Google Scholar]
- 111.Yu L, Gaitatzes C, Neer E, Smith TF. Thirty-Plus Functional Families from a Single Motif. Protein Sci. 2000;9:2470–6. doi: 10.1110/ps.9.12.2470. [DOI] [PMC free article] [PubMed] [Google Scholar]
- 112.Smith TF. Diversity of WD-Repeat Proteins. Subcell. Biochem. 2008;48:20–30. doi: 10.1007/978-0-387-09595-0_3. [DOI] [PubMed] [Google Scholar]
Associated Data
This section collects any data citations, data availability statements, or supplementary materials included in this article.
Supplementary Materials
Figure S-1. Tenascin R Validation Data. Lumbar spinal cord sections from sALS and HC patients were stained using a polyclonal anti-tenascin R antibody. Top Panel. Motor neurons from HC subjects show strong tenascin R immunoreactivity around the cell body. Bottom panel. Motor neurons from sALS cases show an absence of this staining pattern. All images were acquired with a 40× objective and the scale bar = 10 µm.
Figure S-2. eIF 4e Transporter (4e-T) Validation Data. Lumbar spinal cord sections from sALS and HC patients were stained using a polyclonal 4e-T antibody. Top panels. Light microscopy was used to visualize 4e-T staining in the lumbar spinal cord of sALS and HC subjects. Staining in HC subjects is diffuse throughout the nucleus. In contrast, sALS cases show nuclear and cytoplasmic (arrows) 4e-T inclusions and a loss of diffuse staining. All images were acquired with a 40× objective and the scale bar = 10 µm. Bottom panels. Immunofluorescence was used to further characterize 4e-T alterations in sALS. sALS 4e-T nuclear inclusion staining overlaps with p62 staining (arrows). Nuclear 4e-T staining in HC is diffuse and no nuclear p62 is observed (arrows). The presence of cytoplasmic autofluorescent lipofuscin is prominent in both cases and is indicated by arrowheads. All images were acquired with a 63× objective and the scale bar = 10 µm.
Table S-1. Global Results. The raw, unfiltered data set comprising all spectral counts for all groups prior to normalization is shown. Protein name and Uniprot accession number is shown and protein isoform is indicated in the accession number. HC = healthy control, OND = other neurological disease, MS = multiple sclerosis, UMND = upper motor neuron disease, LMND = lower motor neuron disease, AD = Alzheimer’s disease.
Table S-2. All Differentially Abundant Proteins. All proteins of significantly increased or decreased relative abundance in sALS samples are shown by q value rank (lowest to highest). Protein name, gene name, and Uniprot accession number is shown and protein isoform is indicated in the accession number. Log2 fold difference (FD) for each two group comparison is shown.