Abstract
We present a joint experimental and computational study of the dynamic interactions of dialanine (Ala–Ala) with water, comparing the results of ultrafast 2D IR and infrared transient absorption spectroscopy of its amide I vibration with spectra modeled from molecular dynamics (MD) simulations. The experimental data are analyzed to describe vibrational frequency fluctuations, vibrational energy relaxation, and chemical exchange processes. The origin of these processes in the same underlying fluctuating forces allows a common description in terms of the fluctuations and conformational dynamics of the peptide and associated solvent. By comparing computational spectroscopy from MD simulations with multiple force fields and water models, we describe how the dynamics of water hydrogen bond fluctuations and switching processes act as a source of friction that governs the dephasing and vibrational relaxation, and provide a description of coupled water and peptide motions that give rise to spectroscopic exchange processes.
I. INTRODUCTION
Protein-water interactions mediate protein conformational changes in processes such as folding,1–4 protein-protein recognition,5–7 ligand and drug binding,8,9 and enzymatic catalysis.10–12 Although water’s role in such processes commonly manifest themselves as large scale collective solvation effects, protein-water interactions are ultimately rooted in numerous local hydrogen bond interactions and the local structural rearrangements of the solvent around exposed residues. The interplay of local solvent dynamics with protein conformational changes is highly coupled, and even simple conformational transitions can involve non-intuitive water dynamics on a complex energy landscape. For instance, even a small peptide such as alanine dipeptide executes conformational transitions by moving along a solvent coordinate that has little correlation with rotating backbone dihedral angles.13,14
Currently, molecular dynamics (MD) simulations offer a detailed atomistic picture of protein-water interactions, and have served as our primary source of understanding of molecular scale protein solvation.15–17 However, experiments that access this level of information have lagged behind, in part because of the fast ps–ns time scales of these processes, and partially because experiments typically offer indirect information on the water. Dielectric relaxation spectroscopy,18 ultrafast fluorescence spectroscopy,19 and terahertz spectroscopy20,21 have provided information on the dynamics of protein-water interactions and thickness of hydration layer, but often it is difficult to build molecular interpretations from the spectra. NMR relaxation methods provide perhaps the most detailed site-specific information on picosecond-nanosecond water interactions.22–24 Despite the success of extracting site-specific information from these experiments, the time scale of hydrogen bond fluctuations of water usually lies in fs–ps time scale,25 which cannot be captured by these experiments. Ultrafast infrared spectroscopy serves as a unique tool with structural sensitivity and fs–ps temporal resolution.25,26
Of growing interest are methods in computational spectroscopy of amide I vibrations that allow for direct comparison of the infrared spectroscopy of proteins and peptides with structure and trajectories from MD simulations.27 Amide I vibrational modes are primarily C=O stretching motion, and sense hydrogen bonding interactions to the amide oxygen and hydrogen. To identify the molecular origin of amide I spectral features, spectroscopic frequency maps have been developed to translate local electrostatics from MD simulation such as electrostatic potential, electric field, and gradient into an amide I frequency.28–34 Maps for vibrational coupling between different amide I oscillators or between different amide modes are used to calculate the interaction of multiple backbone amide groups in peptides and proteins.35–39 These methods are now reaching a point of quantitative accuracy at which MD simulation data can be used to analyze experimental observables in terms of detailed solvation structure and dynamics, and comparison of experimental and simulated spectra can help assess the accuracy of force fields and water models.
At the most basic level, such studies have the ability to reveal the dynamical interaction of water with the individual peptide groups of the protein backbone. The influence of water on amide I vibrations has been extensively investigated with IR spectroscopy of N–methylacetamide (NMA), one of the simplest molecules with a single amide group.26,40–42 Computational spectroscopy of NMA has shown that water dynamics plays a key role in vibrational dephasing of the amide I mode.29,42–46 In particular, time-resolved IR spectroscopy experiments have been successfully described in terms of the time-dependent shifts in the electrostatic potential or electric field that results from water hydrogen bonding dynamics.32,47,48 Experimental and computational studies have demonstrated that vibrational relaxation of NMA in D2O is also influenced by hydrogen bond breaking and reforming dynamics. Relaxation proceeds in a biphasic manner with a fast sub-picosecond intra-molecular component and a picosecond intermolecular relaxation process mediated by the solvent.41,42,49–52
These extensive studies of NMA have provided considerable physical insight into the role of water interactions on amide I vibrational spectroscopy. The current study is motivated to build on this foundation and the recent advances in amide I computational modeling to develop a detailed molecular picture of the structure and dynamics of water associating with peptide linkages that form a protein backbone. What are the hydrogen bonding patterns present? What are the time scales for water hydrogen-bond fluctuations and hydrogen bond exchange? How are water hydrogen-bonding dynamics coupled with the local peptide conformational dynamics? With an accurate spectroscopic model, this information can be experimentally addressed with the help of MD simulations. At the same time, the correspondence between experimental observables and computational predictions allows a way of testing the influence of the specific force fields and water models used in simulating the experiments.
In this work, we present a joint experimental-computational study of the relationship between the amide I vibrational dynamics and the solvation of the amide unit in dialanine (NH3+–AA–COOH, Ala–Ala). Ala–Ala was chosen as a simple peptide with one amide group (rather than the amide terminated alanine dipeptide53–55), with linkages to charged terminal groups that are more representative of a solvent-exposed protein environment than NMA. We perform 2D IR spectroscopy and transient absorption experiments, and compare these with MD simulation and spectral modeling to help us elucidate the molecular origin of the observed dynamics such as spectral diffusion, variation of vibrational lifetime, and water hydrogen-bond exchange times in Ala–Ala.
II. METHODS
Ala–Ala was purchased from Sigma-Aldrich and used without further purification. The peptide was dissolved to a concentration of 200 mM (30 mg/ml) in 1M DCl in D2O to avoid spectral overlap between the amide I vibration and the water bend vibration, and to protonate the carboxyl-terminus to shift its carbonyl vibration to ∼1720 cm−1. Although we report amide I’ spectra, for simplicity we use the terms amide I and amide I’ interchangeably throughout this study. For all of the IR measurements, the sample was held between two CaF2 windows spaced by a 50 μm Teflon spacer to have OD ∼0.4.
FTIR spectra were collected at room temperature using a Bruker Tensor 27 FTIR spectrometer with 64 averages at 2 cm−1 resolution. A background spectrum of 1M DCl in D2O was measured for subtracting the solvent vibrational profile from the sample spectrum. A linear baseline correction from 1550 cm−1 to 1800 cm−1 was applied to flatten the baseline of the subtracted sample spectrum.
IR transient absorption spectra and 2D IR spectra were acquired in a pump-probe geometry 2D IR spectrometer at room temperature described elsewhere.56 The waiting time was scanned from −0.1 ps to 5.0 ps for transient absorption spectra, and from 0.15 ps to 5.0 ps for 2D IR spectra. The 2D IR spectra were collected with both parallel (ZZZZ) polarization and perpendicular (ZZYY) polarization. The magic angle spectra were reconstructed from the parallel-polarized spectra and the perpendicular-polarized spectra by .
MD simulations of protonated Ala–Ala in water box were performed using GROMACS 4.6.7 package.57 Force fields used in this study were CHARMM2758,59 (C27), CHARMM3660 (C36), and CHARMM36m61 (C36m). Water models used in C27 and C36 were SPC/E and TIP3P while in C36m we used SPC, SPC/E, TIP3P, TIP4P, TIP5P, and the deuterated SPC/E model modified by changing the mass of hydrogen to the mass of deuterium. The simulation boxes were set to a dodecahedron geometry, with the walls set at least 1 nm away from the peptide. One chloride ion was added to balance the charge of the Ala–Ala. The energy of the protein and solvent configuration was minimized to guarantee a reasonable starting structure for further equilibrations. A 100 ps temperature equilibration of solvent and ions around the position-restrained peptide at 300 K with the Berendsen thermostat62 was performed. After the temperature equilibration, the density of the box was adjusted by a 1 ns NPT equilibration at 1 bar with the Berendsen thermostat and barostat.62 The subsequent 10 ns preparation runs on the unrestrained peptide were performed using the Nosé–Hoover thermostat63,64 under NVT conditions, and the 100 ns production runs were simulated with 1 fs integration step, and 20 fs/frame sampling rate for spectral simulations. The MD data analysis such as backbone dihedral angles was performed using PLUMED 2.65
Spectroscopic simulations were carried out by a mixed quantum/classical mapping approach described elsewhere.27,34 Briefly this method maps a time-dependent collective variable (such as the electric field acting on the amide carbonyl oxygen) from a classical MD simulation to a time-dependent quantum mechanical transition energy trajectory or transition dipole moment trajectory, which is then used for time-domain calculations of IR spectra. Amide I spectral parameters were computed along the MD trajectories using g_amide, which is an open source program available on GitHub.66 The spectroscopic maps used in this study were the one-site field map (1F) that has been parametrized against experimental dipeptide FTIR data,34 and the four-site potential map (4P) optimized against experimental spectra of the isotope-labeled NuG2b protein.34 This 1F map uses modified glycine charge and TIP3P water model charges instead of SPC/E charges, different from our previous 1F map.33 Note that all of these mapping approaches do not include the carbonyl stretch of the carboxyl-terminus into spectral simulations.
The exciton Hamiltonian trajectories and corresponding dipole moment trajectories were used to compute linear IR and 2D IR spectra by the dynamic wave function propagation method,67 using the home-built spectral simulation program, g_spec.68 The window time for calculating response functions was set to 11 ps, which is equivalent to 3 cm−1 frequency resolution. For calculating time-averaged response functions, starting structures were separated by 2 ps, resulting in 50 000 realizations for a 100 ns trajectory. The model includes a vibrational lifetime for the amide I mode, set to the 1.0 ps value measured in our transient absorption experiment.
To better sample the solvation environment around Ala–Ala at particular backbone dihedrals, 2D umbrella sampling is performed using PLUMED 2 and Gromacs. The starting structures are chosen at , , and . The force constant of the harmonic biased potential is set to 327.5 kJ/mol on both and , corresponding to 5° standard deviation at 300 K. Both the equilibration run and the production run are 1 ns long, with the same parameters used in the unbiased MD simulations except for the biased potential applied.
III. RESULTS
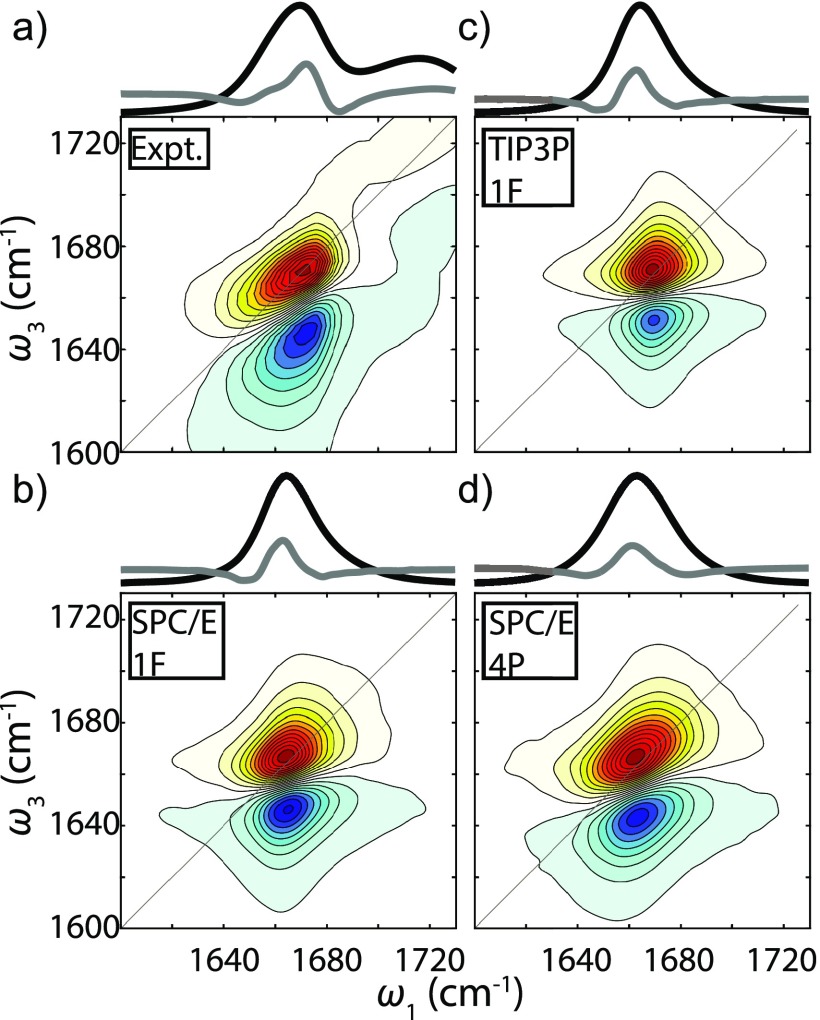
In Fig. 1(a), the experimental FTIR spectrum of Ala–Ala in D2O shows an amide I peak frequency centered at 1670 cm−1, and an asymmetric line shape with a width of 31 cm−1 FWHM. The frequency is 50 cm−1 higher than the resonance frequency for the commonly studied NMA in D2O,42 which suggests a significant difference in the solvation environment for Ala–Ala primarily due to the protonated terminal amino group.27,30–32,43 The 2D IR spectrum at early waiting time () is peaked at the same frequency and has an asymmetric line shape that is diagonally elongated, characteristic of inhomogeneous broadening. The less intense but broader peak at 1720 cm−1 originates from the terminal carboxylic acid C=O stretch. The 2D spectrum reveals a weak cross-peak between the two carbonyl resonances at the lowest contours of our spectrum. However, the coupling from Fig. 1(a) is estimated to be only ∼1 cm−1,69 which we interpret to mean that the coupling is weak enough that they do not need to be explicitly included in our amide I spectral modeling.
FIG. 1.
Amide I FTIR spectrum (black curve), second derivative of the FTIR spectrum (gray, scaled by −25), and ZZZZ polarized 2D IR spectrum of Ala–Ala. The waiting time of these 2D spectra is 0.15 ps. (a) Experimental spectrum. (b) Simulated spectrum from C36 SPC/E trajectory and the 1F map. (c) Simulated spectrum from C36 TIP3P trajectory and the 1F map. (d) Simulated spectrum from C36 SPC/E trajectory and the 4P map.
For comparison, simulated FTIR and 2D IR amide I spectra using the same C36 force field but different water models and spectral maps are shown in Figs. 1(b)–1(d). Almost identical FTIR line shapes are found between SPC/E and TIP3P simulations, but different peak frequencies and subtle line shape changes can be observed in the 2D spectra [Figs. 1(b) and 1(c)]. However, none of these simulations reproduce the asymmetry of the FTIR experiment, and the experimental 2D line shape. The simulated spectra from the 1F map consistently show less elongation along the diagonal than the experimental spectra (similar to another study70), while the simulated spectra from the 4P map have comparable diagonal width to the experimental 2D spectrum [Fig. 1(d)]. Recognizing that solvation configurations near the amide group vary for different force fields and water models, it is possible that simulations overestimate the population of more hydrogen-bonded species. The amide I FTIR peak frequencies and FWHM from experiment and C36 simulations are summarized in Table I.
TABLE I.
FTIR Peak frequency and FWHM from the experiment and the C36 simulations.
| Expt. | 1670 | 31 |
| SPC/E, 4P | 1663 | 30 |
| TIP3P, 4P | 1666 | 28 |
| SPC/E, 1F | 1665 | 26 |
| TIP3P, 1F | 1671 | 21 |
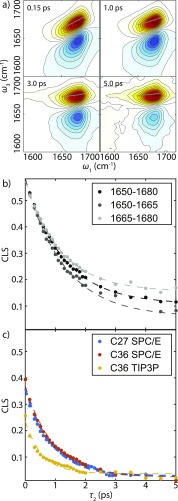
Examples of the waiting time dependence of experimental 2D IR spectra are shown in Fig. 2. The 2D line shape changes between and 5 ps show a characteristic evolution of the line shape from diagonally elongated to symmetric, and a rotation of the node between positive and negative features. These characteristics are commonly associated with vibrational spectral diffusion and can be extracted using the center line slope (CLS) method.71,72 The results of this analysis are shown in Fig. 2, and exhibit single exponential decay with a 1.3 ps time scale. Experimental CLS decays of different frequency regions show similar dynamics, and nonlinearity of the center lines across the waiting time series is not significant (Fig. S1 of the supplementary material). The experimental CLS decay is compared with the CLS decays from simulated spectra in Fig. 2(b). The simulation decays are much faster than the experimental CLS, and we find that TIP3P water decays with a 0.55 ps time scale, even faster than SPC/E water, with a 0.9 ps time scale. The time scale of CLS decays are summarized in Table S1 of the supplementary material.
FIG. 2.
(a) Selected experimental waiting time series of magic angle 2D IR spectra from 0.15 ps to 5 ps. Center line derived from slices are shown in gray dots. [(b)–(c)] CLS decays for varying frequency ranges (dots) and the corresponding fit curves (dashed lines) from (b) the experiment, and (c) from the simulations using the 1F map.
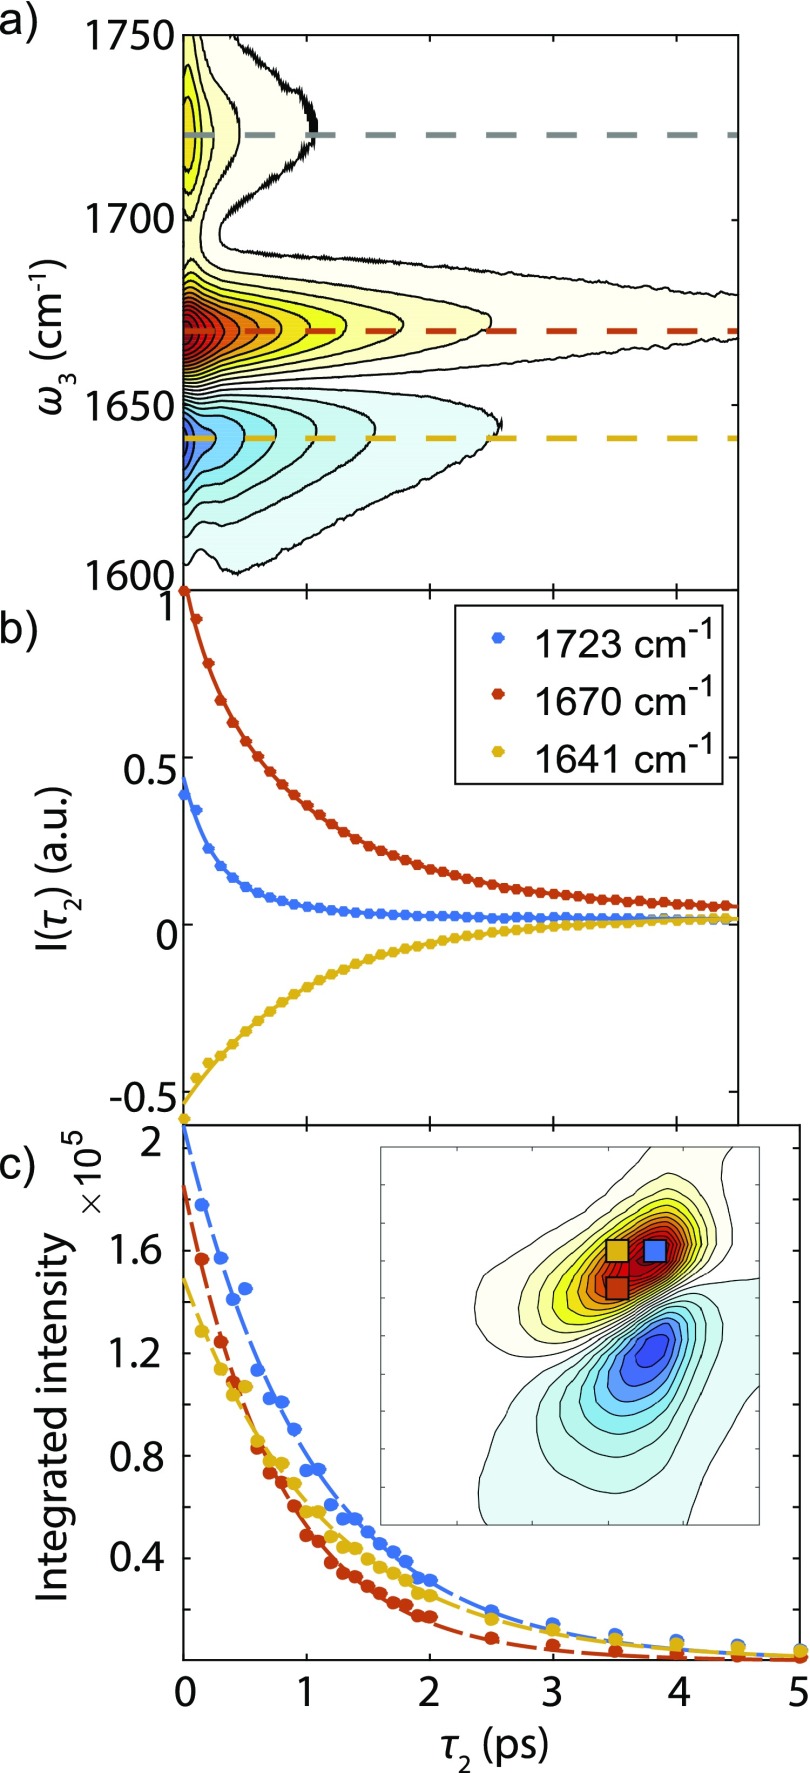
Vibrational lifetime measurements using transient absorption are shown in Fig. 3. From the bleach and induced absorption of the pump-probe measurements, the amide I intensity decay of Ala–Ala is observed to be bi-exponential with time scales of 0.23 ps and 1.1 ps, comparable with the reported 1.2 ps from Hamm et al.26 As a comparison, the relaxation time scales of N-methylacetamide-d7 in D2O have been found to be 0.38 ps and 2.1 ps, and the time scales were attributed to energy exchange between anharmonically coupled amide I and II vibrations followed by solvent-mediated dissipation of vibrational energy.49 The decay times of the carboxylic acid C=O stretch are about 0.23 and 0.78 ps [Fig. 3(b)].
FIG. 3.
(a) Transient absorption spectrum of Ala–Ala. Dashed lines indicate the frequency slices for fitting in (b). (b) Intensity decays (colored dots) and fit curves (solid colored lines) with respect to waiting time τ2. (c) Integrated peak intensities as a function of . Integrated areas are represented by the colored rectangles.
As a comparison, we integrated spectral regions of the waiting time series of 2D IR spectra [Fig. 3(c)], choosing two frequency windows that correspond to the peaks in the experimental second derivative spectrum [Fig. 1(a)]. Integrating the upper diagonal at 1670–1675 cm−1 gives a 1.0 ps exponential decay, while the decay time of the peak integration at 1660–1665 cm−1 is 0.8 ps. This difference suggests a vibrational lifetime that varies with frequency, but the comparison must account for the influence of line shape changes due to spectral diffusion, or chemical exchange. In addition, the integrated peak intensity of the off-diagonal region in Fig. 3(c), which might reveal exchange processes has the decay time scale of 1.14 ps longer than the two diagonal blocks. Since there is no intermolecular energy transfer between the dilute amide groups in our experiment, this indicates that a chemical exchange between different hydrogen bonding solvation environments may also be present. Thus, vibrational lifetime, vibrational dephasing, and chemical exchange processes should all be considered in explaining the 2D waiting time dependence.
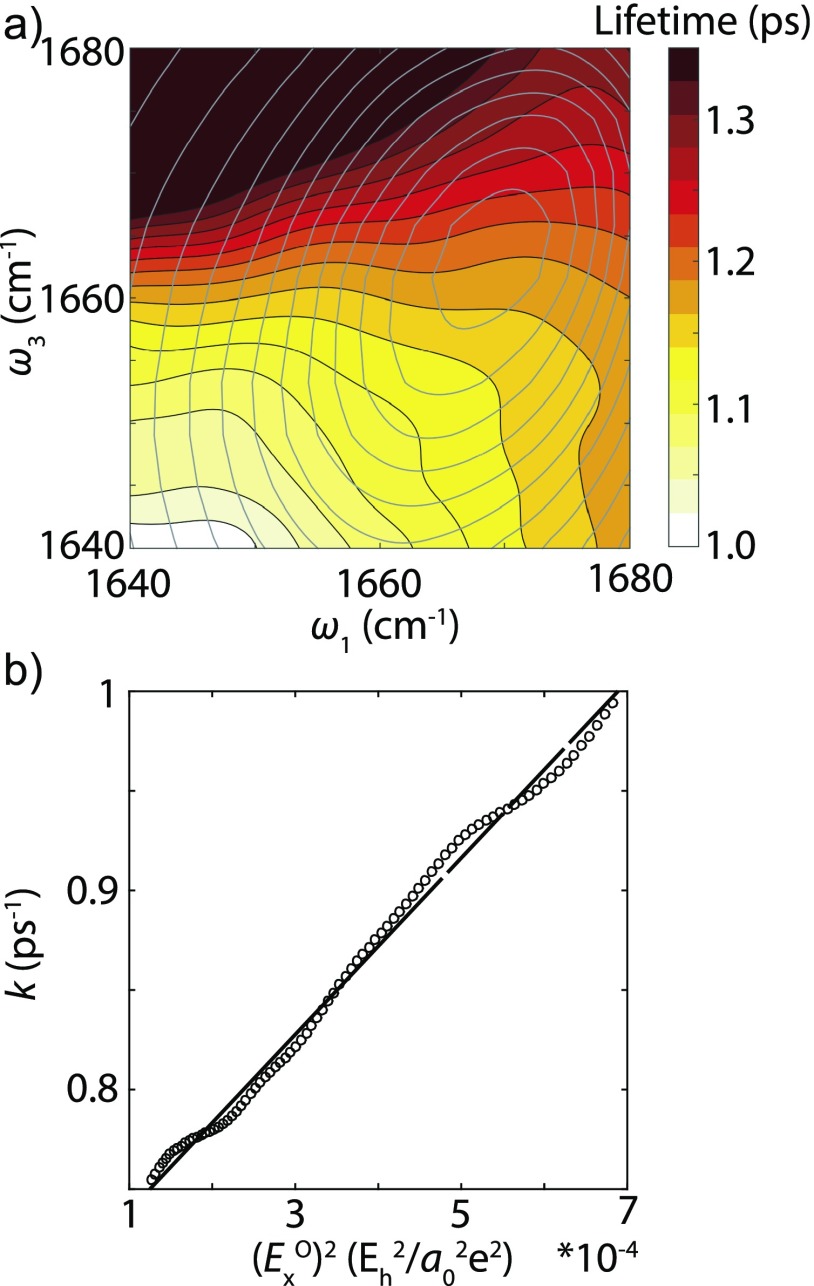
To better isolate the frequency dependence of amide I vibrational lifetime, vibrational lifetime decays were obtained from single exponential fits to each point of the waiting time series of absolute value magic angle 2D IR spectra. The resulting fits are presented as a 2D lifetime heatmap in Fig. 4(a). Looking along the diagonal, the heatmap indicates a clear trend of increasing vibrational lifetime with frequency, with a variation from ∼1.0 to 1.3 ps (∼25%) over the amide I resonance.
FIG. 4.
(a) Amide I lifetime heat map (solid contours) of Ala–Ala from magic angle absolute value surface (gray contours). Each colored contour line is space by 25 fs. (b) Scatter plot of relaxation rate and squared electric field exerted on amide oxygen atom along the C=O axis. Black line is the least square fit, , .
The time scale of chemical exchange can be estimated from the slow chemical exchange model,73,74 using data from Fig. 4. We selected frequency ranges for the two states involved in the chemical exchange process using the peaks at 1672 cm−1 (U) and 1659 cm−1 (L) in the second derivative FTIR spectrum [Fig. 1(a)]. From Fig. 4, we found the vibrational relaxation rates at these frequencies are and . The decay rate of the cross-peak intensity will depend both on vibrational relaxation and chemical exchange rates as
| (1) |
Here is the chemical exchange rate from state to state , and vice versa. Using the experimental values of and , and enforcing detailed balance result in an upper bound of the chemical exchange rate .
IV. DISCUSSION
The time-resolved IR spectroscopy of the amide I vibration of dialanine indicates that a variety of spectrally varying dynamical processes are present, including spectral diffusion, chemical exchange, and vibrational relaxation. Each of these has similar time scales and has closely related molecular origins, which we can investigate with the help of MD simulations and amide I spectral modeling. Spectral diffusion originates from vibrational frequency fluctuations that are likely due to the fluctuating hydrogen bond environment in the vicinity of the amide carbonyl, while chemical exchange would reflect the coupled changes in peptide and water hydrogen bonding configurations. From a classical perspective, both vibrational frequency fluctuations and the vibrational lifetime can be described in the context of time correlation function of fluctuating forces experienced by the amide oscillator . In this case, the fluctuating forces are predominantly of electrostatic origin and depend intimately on hydrogen bonding to the amide group.
A. Vibrational frequency fluctuations
The frequency fluctuations characterized by the CLS are proportional to the amide I vibration frequency correlation function, that depends on the time-dependent interaction potential of the amide I vibration with its environment.27,30–32,43 The amide I spectral models used here assume a linear relationship between vibrational frequency and local electrostatic parameters such as field or potential. For Ala–Ala in water, we expect that the amide group is highly solvated, and therefore the frequency fluctuations would be most influenced by interactions with surrounding water molecules.
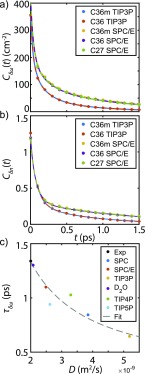
We investigated the role of water dynamics on the amide I vibrational dynamics using amide I spectral simulations with different water models. As shown in Fig. 5(a), the decays of the simulated directly computed from the amide I frequency trajectories indicate that they are influenced by the water model and do not appear dependent on the force field used. The time scales are faster than the experiment, but this is also likely a reflection of the water model. For instance, similar effects are observed in simulations of vibrational dephasing of the O–H stretching vibration of HOD in D2O, with the finding that polarizable water models tend to predict longer, more-accurate frequency correlation functions than fixed charge models, such as the water models we have employed here.75,76
FIG. 5.
(a) computed from the frequency trajectories computed by the 1F map. The raw data points are presented as solid circles, whereas the fits are represented as solid curves. The fit function is tri-exponentials with constant offset. (b) computed from MD trajectories. The raw data points are presented as solid circles whereas the fits are represented as solid curves. The fit function is tri-exponentials with constant offset. (c) Scatter plot of the frequency correlation time, , against the water/D2O self-diffusion coefficient from the experiment and C36m simulations. Gray curve: the fit curve of the three-site water models by . The experimental diffusion coefficient of D2O is taken from Ref. 78.
The key role of the dynamics of water hydrogen bonds to the amide carbonyl is also shown in Fig. 5(b). We analyzed hydrogen bonding dynamics using geometric criteria to define the number of hydrogen bonds between water and the C, O, N, and H atoms of the amide group, . When the distance between hydrogen bond donor and acceptor is ≤3.5 Å, and the donor-hydrogen-acceptor angle is ≥150°, the donor-acceptor pair is considered hydrogen-bonded. We found that the time correlation function for the hydrogen bond number, , drops in amplitude by ∼2/3 in the first 200 fs as a result of fast fluctuations in water hydrogen bonding configurations. has a long time decay of 1.3 ps that matches the slow time scale of the decay [Fig. 5(b)]. This indicates that the frequency fluctuations depend on the hydrogen bond fluctuation dynamics around the amide group, similar to prior observations.45,46 The fit results are summarized in Tables S2 and S3 of the supplementary material.
Since TIP3P water is known to have a higher diffusion coefficient than the SPC/E water,77 it allows us to test for a correlation between the frequency correlation time and the diffusion coefficients D of various water models. The diffusion coefficients of several different water models and the corresponding correlation time for the decay of are plotted in Fig. 5(c). We find that obeys a dependence on the water model diffusion coefficient, with a trend that also describes the experimental data. In combination with our previous observations, this indicates that experimental observations of spectral diffusion are tracking the same hydrogen bond reorganization about the amide group that governs self-diffusion in water. TIP4P and TIP5P water models deviate somewhat from the curve, probably due to different treatment of electrostatic interactions between the amide group and water.
B. Vibrational lifetime
Since the IR spectroscopy of the amide I vibration can be effectively described through a fluctuating electric field generated by the environment, and recognizing that the electric field is an electrostatic force acting on the vibration, the vibrational dephasing described by should be proportional to a time correlation function for the fluctuating force acting on the amide I coordinate: . In a classical representation, the same correlation function can be related to the amide I vibrational relaxation rate as follows:79,80
| (2) |
Here is the vibrational energy gap defining the relaxation between initial and final states. The vibrational relaxation rate is proportional to the Fourier component of the fluctuating force time correlation function evaluated at the vibrational energy gap, or equivalently proportional to the spectral density at in the high temperature limit. Note that the vibrational population relaxation of the amide I band will have contributions from many relaxation channels beyond simple v = 1 → 0 relaxation, such as amide I to II intramolecular vibrational energy transfer, solvent-mediated dissipation, and other anharmonic relaxation channels.42,49,81
Assuming the electric field experienced by the carbonyl oxygen of the amide group is the dominant source of the fluctuating force, then the relaxation rate would also be proportional to the corresponding electric field time correlation function: . If the correlation time also does not vary much with amide I frequency, a reasonable assumption from our experiments, then the rate is approximately proportional to the magnitude of the squared electric field strength. To investigate the relationship between the experimental vibrational relaxation rate and the electric field strength exerted on the amide oxygen along the C=O axis , instead of directly evaluating from the simulation and estimating the relaxation rate, we estimate the corresponding at each experimental frequency in the heatmap [Fig. 4(a)] using the 1F map, and correlate with the relaxation rate shown in Fig. 4(b). These values are strongly linearly correlated, suggesting that the electrostatic interactions can account for the vibrational relaxation of the amide I mode. Increasing force exerted along the C=O axis effectively reduces the vibrational lifetime. Note that the 4P map has an equivalent translation to the field-based 3F map.34 Although translating experimental frequency back to electric field by the 3F map would be ambiguous, the 3F map samples similar fluctuation dynamics around the amide group as the 1F map (Fig. S2 of the supplementary material). The assumption that electric field experienced by the carbonyl oxygen of the amide group is the dominant source of the fluctuating force should still be reasonable.
For the classical description of vibrational relaxation and vibrational dephasing, this fluctuating force can be thought of as effective friction acting on the amide vibration. From the fluctuation-dissipation theorem, the friction coefficient for such processes is related to the force-force correlation function as that is proportional to the zero-frequency component in Eq. (2). The friction coefficient can be expressed in terms of the diffusion coefficient in water through . In the simplest picture, the direct proportionality of these quantities predicts that the amide I frequency correlation function should be inversely related to water’s diffusion coefficient, as observed in Fig. 5(c). Therefore, we conclude that fluctuating forces originating in water’s hydrogen bond fluctuations and switching appear to be the primary origin of both the experimental relaxation processes we observe.
C. Peptide solvation environment and chemical exchange
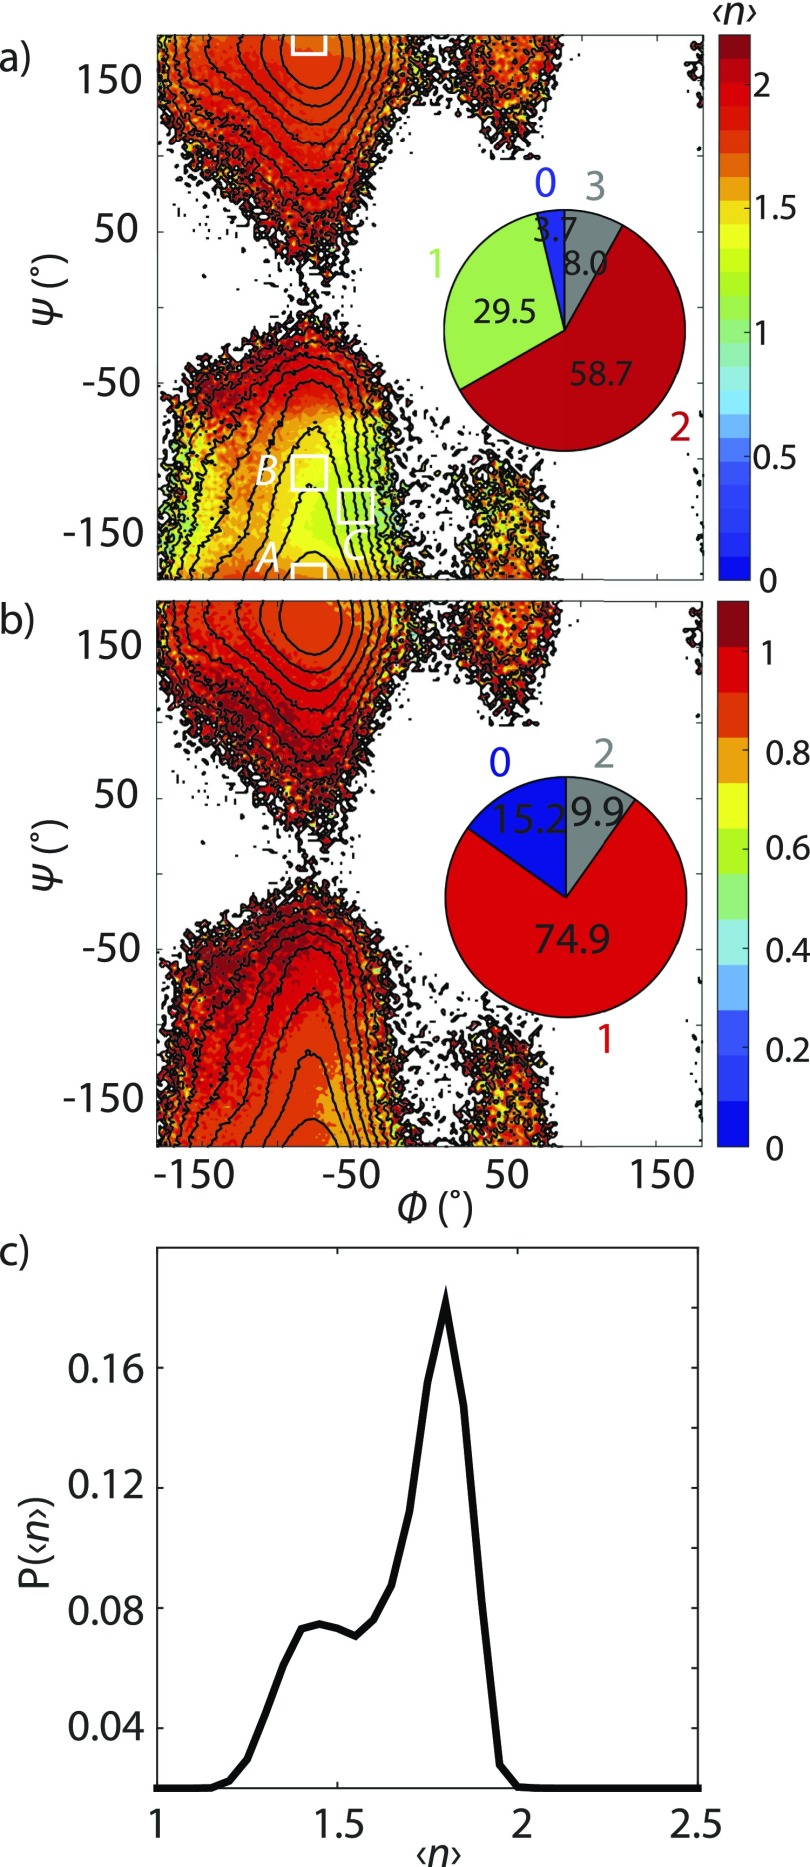
To characterize the relationship between peptide conformation and amide group solvation patterns, we calculated the probability distribution for the average hydrogen bond number as a function of the backbone dihedral angles . This is presented as a color-coded potential of mean force (PMF) in Fig. 6(a). It shows clear variation of with peptide backbone conformation between values of 1 and 2, indicating that the solvation structure around the amide group is coupled to the peptide configuration. A similar, though less prominent, hydrogen bond number distribution is observed when only counting those water hydrogen bonds made to the amide oxygen atom [Fig. 6(b)]. Although Figs. 6(a) and 6(b) appear to have only one free energy basin, it is well established that the dihedral angles are not effective coordinates for describing peptide conformational dynamics such as alanine dipeptide.13,14 Therefore, one cannot use it to discern dynamical behavior, for instance, whether changes of are due to fast fluctuations in solvent hydrogen bonding configurations or slower global conformational changes. Similar considerations apply to distinguish solvation structures, as seen when we plot the probability distribution as a function of [Fig. 6(c)]. The Ala–Ala conformational distribution has two peaks corresponding to solvent configurations with = 1.4 and 1.8.
FIG. 6.
(a) Colored contours: as a function of backbone dihedrals ϕ and ψ from C36 SPC/E trajectory. Black contour lines: PMF spaced by kBT up to 10 kBT at 300 K. PMF is computed by , where is the probability of observing Ala–Ala at . Inset: Population of different hydrogen bonding configurations from SPC/E water to the amide group. The black rectangular boxes represent the states for estimating the first passage time in Fig. 8. (b) Colored contours: average hydrogen bond number to the amide carbonyl as a function of ϕ and ψ. (c) Probability distribution as a function of .
To investigate the relationship between peptide configuration and solvation structure, we investigated the structure and dynamics about three Ala-Ala configurations chosen on the basis of their dihedral angle and water hydrogen bond count. State A is the low energy configuration on the PMF in Fig. 6(a) at , and is characterized by . At an energy of ∼2kBT above state A, state B was chosen as to correspond to the lower value of observed for the minor peak in Fig. 6(c). State C, at , corresponds to the lowest average value of the hydrogen bond counts, , and lies ∼4kBT in energy above state A.
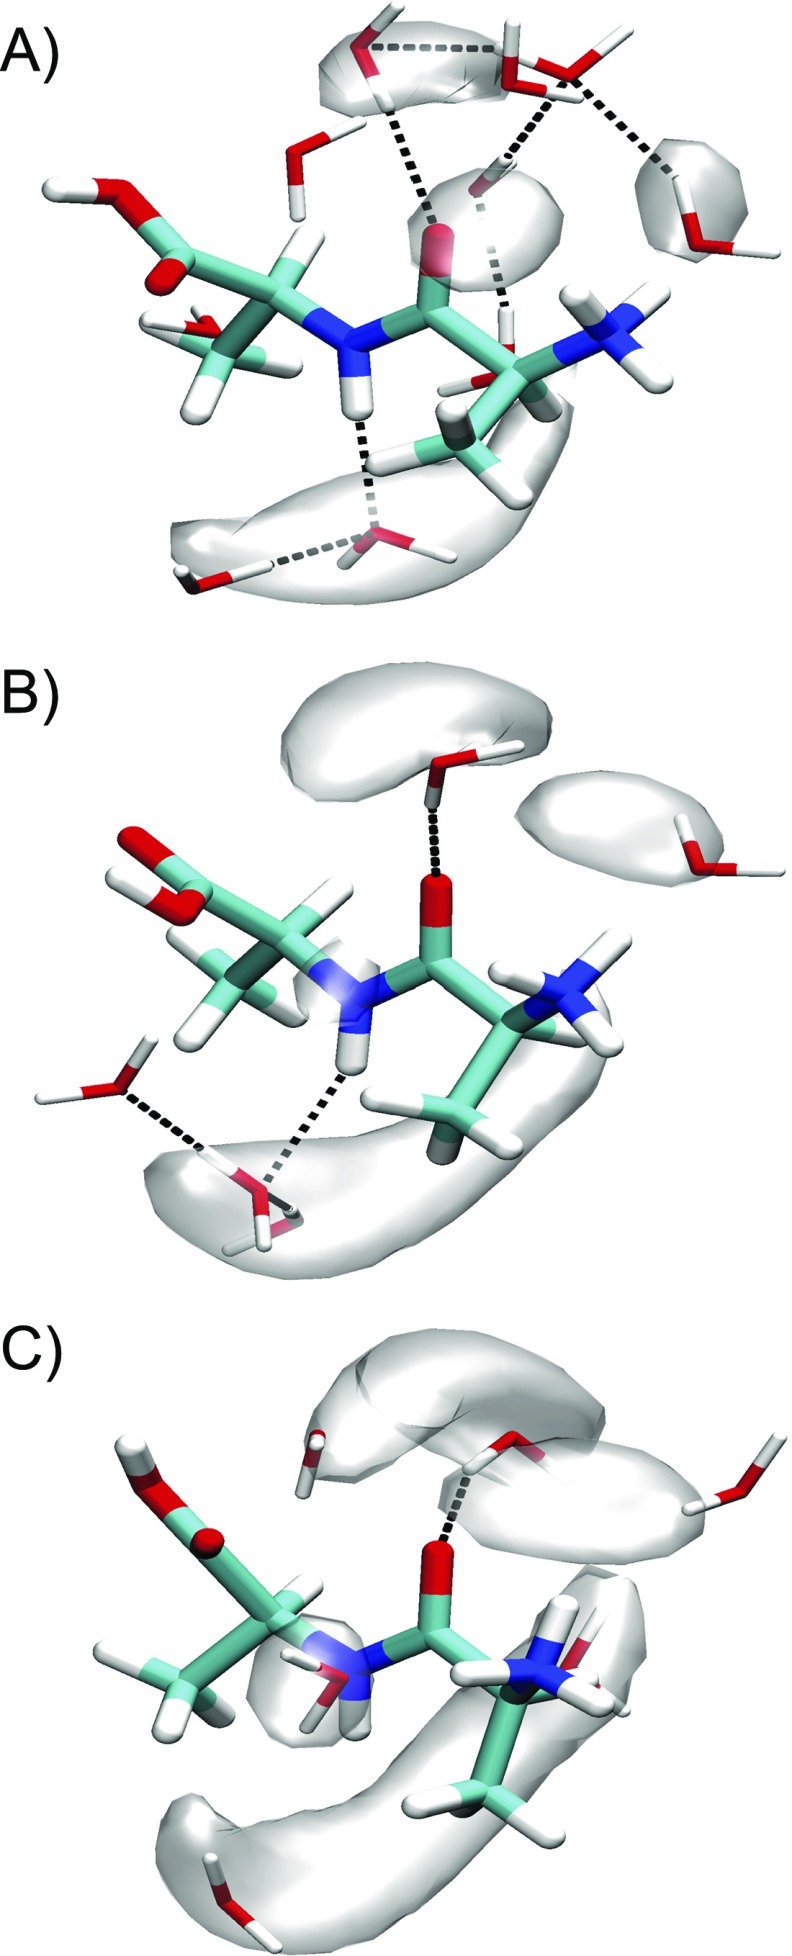
In Fig. 7, we present visualizations of solvation structures of water around the Ala–Ala amide unit for states A, B, and C. Although the dihedral angles vary little between states, there are noticeable effects on hydrogen bonding to water. While A and B have on average ∼1 water hydrogen bond to the oxygen of the amide carbonyl, we find that A differs from B on average by the presence of more hydrogen bonds from the amide hydrogen to a water oxygen [Figs. 6(a) and 6(b)]. Although the solvent accessible surface area of the amide group across the entire PMF is uniform (Fig. S3 of the supplementary material), we find a clear correlation between the hydrogen bond number from the amide hydrogen to water , and the distance between the carbon of the N-terminal methyl side-chain and the amide hydrogen (Figs. S4a and S4c of the supplementary material). This indicates that the configuration of the methyl side chain influences if water can hydrogen bond to the amide hydrogen. State C differs from A and B by rotating ψ, resulting in a shorter distance between the COOH group and amide carbonyl, (Fig. S4b of the supplementary material). A decrease in leads to lower hydrogen bond number to the amide carbonyl (Fig. S4d of the supplementary material), indicating that the configuration of the COOH group can also act to influence the water hydrogen bonded to the amide carbonyl. The differences in solvent configurations between the states are also observed as the water density becoming more diffuse with decreasing . We conclude that water hydrogen bonding patterns to the amide group are intimately coupled to the peptide conformation generally, and the configuration of the methyl sidechain and the COOH group, in particular.
FIG. 7.
Solvation structures and water probability density (transparent isosurface) of Ala–Ala at states A, B, and C from 2D umbrella sampling. (a) , . (b) , , and (c) , . Representative solvent configurations are plotted on top of mass-weighted isosurfaces for water that are within 3.5 Å of the amide group. The isosurfaces are plotted with isovalue at 40% of the maximum. Black dashed lines correspond to hydrogen bonds.
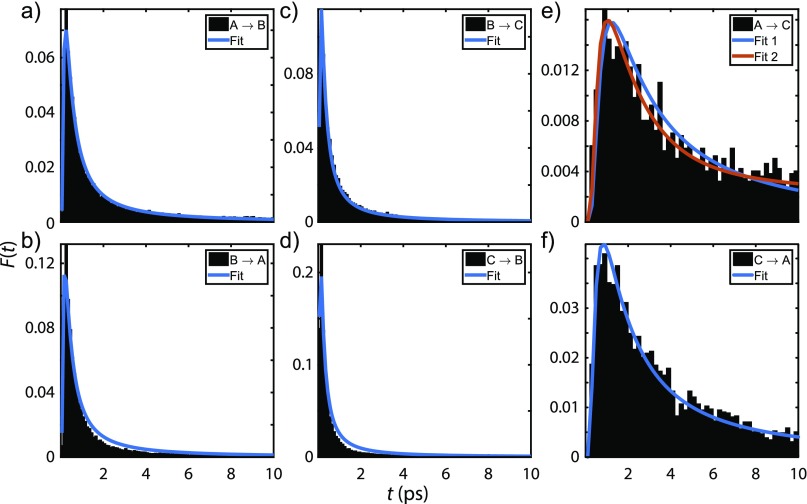
Turning to dynamics, to estimate the chemical exchange time scale from the simulations, we computed the first passage time (FPT) distributions between states A, B, and C (Fig. 8). We find that the FPT distributions are well described by the asymmetric form with a tail expected for random walk diffusion. The mean FPTs between pairs of states are summarized as follows:
All mean FPTs are found to lie between 1 and 50 ps, which are long compared to the time scales of local hydrogen bonding fluctuations. The longest time scales are associated with the  equilibrium, and are of similar time scale to the estimated chemical exchange rate from 2D IR experiments. Given the correlation we find between solvation structures and peptide dihedral angles, these exchange processes are expected to involve peptide conformational changes coupled with solvent reorganization. We also observe that the most probable FPT for all transitions involving state B are <1 ps, indicating that configurational changes associating with this state may in some cases involve fast fluctuations in solvent structure and peptide conformation, without an irreversible conformational exchange.
FIG. 8.
First passage time distribution (a) from state A to state B, (b) from B to A, (c) from B to C, (d) from C to B, (e) from A to C, (f) from C to A. The model used for the fits is . Fit and Fit 1 refer to single component (i = 1) whereas Fit 2 corresponds to two components (i = 1, 2).
D. Spectroscopic model and water model
As found in Fig. 1 and Table I, all of the simulations calculate a redshift in peak frequency relative to the experiment. This suggests that either the frequency map predicts incorrect frequencies, the water models give a distribution of solvation structures that do not correspond to experiment, or both models have problems. Additionally, the spectral line shapes differ between experiment and simulations that similarly could have roots in the spectral model, or in the dynamics used to calculate the spectra. Since both models have issues of concern, identifying the origin of the mismatch between experiment and simulations is difficult; however, with the help of testing by spectroscopic modeling, we can estimate the effects and rule out some potential origins.
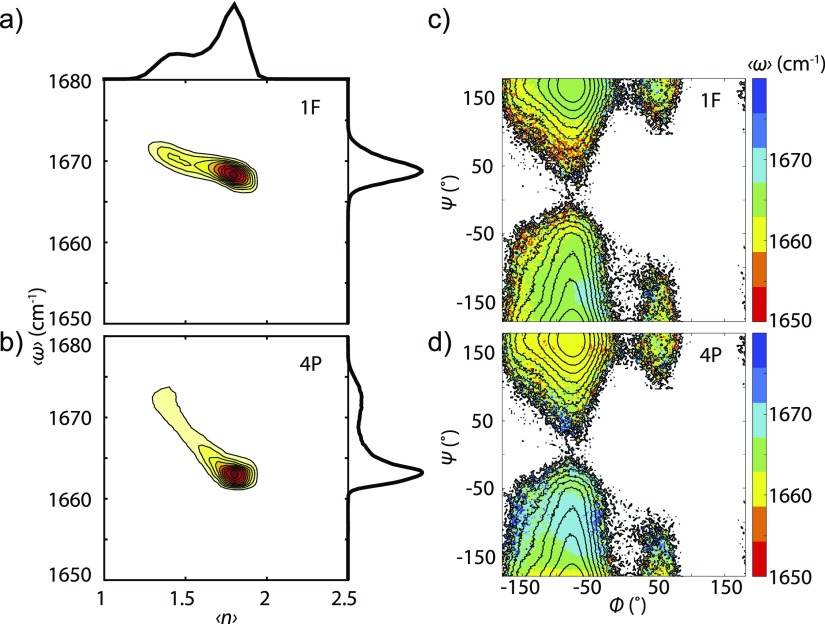
To investigate the correlation between amide I frequency and the structure of peptide and associated solvent, we computed the joint probability distribution between and for the 1F and 4P spectral models [Figs. 9(a) and 9(b)]. We find a correlation between and , indicating that frequency changes do provide a means to probe the hydrogen-bonding environment around the amide group. However, the slope of varying with indicates that it is uncertain to assign a set of structure based only on a given amide I frequency. Similarly, when viewing the distribution of as a function of backbone dihedrals [Figs. 9(c) and 9(d)], inferring peptide structures from given frequencies can lead to different conclusions.
FIG. 9.
Probability distribution as a function of taken from the distribution in Fig. 6, and along (a) from the 1F map shown in Fig. 9(c), and (b) from the 4P map shown in Fig. 9(d). Tiny populated data points were removed, but the remaining data points still reach 90% of the entire data points. The 1D projections along and are next to the 2D contour map. (c) Colored contours: as a function of and from C36 SPC/E trajectory and the 1F map. Black contour lines: PMF spaced by kBT up to 10 kBT at 300 K. (d) Colored contours: as a function of and from C36 SPC/E trajectory and the 4P map. Black contour lines: PMF spaced by kBT up to 10 kBT at 300 K.
However, this analysis does not account for possible differences between the experiment and the simulations due to the water model. While state B is predicted to be 1670 cm−1 by both maps, the more dominant state A has lower frequency regardless of the maps, resulting in a different asymmetry of the frequency distribution from the experimental spectra. Given the error bar estimate of these maps as ±2 cm−1,33,34 it remains possible that the redshift in peak frequency stems from the water model overpopulating more hydrogen-bonded environments rather than originating from the uncertainty of the frequency maps. We also find that different water models can predict some variation of hydrogen bond populations (Fig. S5 of the supplementary material), also seen in other studies regarding peptide solvation structures.82,83 The effect of state C would be little due to Boltzmann weighting. Meaningful conclusions on this question would be better addressed with a higher level of theory and a water model more appropriate for IR spectroscopy simulations than the fixed charged models examined in this study such as ab initio MD,45,84 MB-pol,85–87 etc.
To estimate the effect of the variation of vibrational lifetime on the spectral line shape, we incorporated a fluctuating vibrational relaxation rate given in Fig. 4 into our spectral simulation by adding an additional population decay factor to the transition dipole correlation function of the form . We found that the only noticeable effect is a change of intensity (Fig. S6 of the supplementary material), and concluded that the variation of vibrational lifetime contributes little to the difference of vibrational line shape. We also simulated the 2D spectrum with slower spectral diffusion rate by deuterating the SPC/E water molecules shown in Fig. S7 of the supplementary material. The effect is also subtle on the intensity while the spectral line shape remains similar. Therefore, we can rule out variation of vibrational lifetime and faster spectral diffusion as the origin.
V. CONCLUSIONS
In this study, we performed a detailed analysis of peptide-water interactions by ultrafast amide I vibrational spectroscopy and computational spectroscopy based on MD simulations. We observed spectral diffusion, variation of vibrational relaxation time scale, and chemical exchange processes in Ala–Ala. We found that the spectral diffusion of the amide I vibration is dictated by water solvation dynamics. This effect can be explained classically as friction experienced by the amide I vibration, or hydrogen bond fluctuation dynamics around the amide group microscopically. For vibrational relaxation, we observed strong linear correlation between relaxation time and squared electric field strength exerted along the amide carbonyl, showing that the electric field from the local solvation environment serves as an effective friction force in response to amide I vibration. On the basis of simulations, we conclude that the origin of chemical exchange observed in the experiment requires solvent reorganization coupled with peptide conformational motions. Specifically, we found that the configuration of peptide side chain and protonated COOH group influences the access of water to the N–H and C=O of the amide group. In a more general sense, we hope that this study illustrates the high level of atomistic information that can be gleaned on solvation structure and dynamics from head-to-head comparisons between advanced vibrational spectroscopy and structure-based spectral modeling rooted in MD simulations.
SUPPLEMENTARY MATERIAL
See supplementary material for the fit parameters in the main text, comparison of frequency time correlation function between different maps, various histograms along backbone dihedral angles, and effects of varying vibrational lifetime or changing the spectral diffusion rates on the simulated spectra.
ACKNOWLEDGMENTS
We thank Ann Fitzpatrick and Paul Sanstead for their technical assistance on 2D IR spectroscopy, and thank Paul Stevenson for inspiring discussions. This work was supported by the National Institutes of Health (No. R01-GM118774). This work was completed in part with resources provided by the University of Chicago Research Computing Center.
REFERENCES
- 1.Cheung M. S., Garcia A. E., and Onuchic J. N., Proc. Natl. Acad. Sci. U. S. A. 99, 685 (2002). 10.1073/pnas.022387699 [DOI] [PMC free article] [PubMed] [Google Scholar]
- 2.Head-Gordon T. and Brown S., Curr. Opin. Struct. Biol. 13, 160 (2003). 10.1016/S0959-440X(03)00030-7 [DOI] [PubMed] [Google Scholar]
- 3.Papoian G. A., Ulander J., Eastwood M. P., Luthey-Schulten Z., and Wolynes P. G., Proc. Natl. Acad. Sci. U. S. A. 101, 3352 (2004). 10.1073/pnas.0307851100 [DOI] [PMC free article] [PubMed] [Google Scholar]
- 4.Bagchi B., Water in Biological and Chemical Processes (Cambridge University Press, Cambridge, 2013). [Google Scholar]
- 5.Papoian G. A., Ulander J., and Wolynes P. G., J. Am. Chem. Soc. 125, 9170 (2003). 10.1021/ja034729u [DOI] [PubMed] [Google Scholar]
- 6.Levy Y. and Onuchic J. N., Annu. Rev. Biophys. Biomol. Struct. 35, 389 (2006). 10.1146/annurev.biophys.35.040405.102134 [DOI] [PubMed] [Google Scholar]
- 7.Lim V. I., Curran J. F., and Garber M. B., J. Theor. Biol. 301, 42 (2012). 10.1016/j.jtbi.2012.02.008 [DOI] [PMC free article] [PubMed] [Google Scholar]
- 8.Levinson N. M. and Boxer S. G., Nat. Chem. Biol. 10, 127 (2013). 10.1038/nchembio.1404 [DOI] [PMC free article] [PubMed] [Google Scholar]
- 9.Poornima C. S. and Dean P. M., J. Comput.-Aided Mol. Des. 9, 521 (1995). 10.1007/bf00124323 [DOI] [PubMed] [Google Scholar]
- 10.Pocker Y., Cell. Mol. Life Sci. 57, 1008 (2000). 10.1007/pl00000741 [DOI] [PMC free article] [PubMed] [Google Scholar]
- 11.Garcia-Viloca M., Science 303, 186 (2004). 10.1126/science.1088172 [DOI] [PubMed] [Google Scholar]
- 12.Adkar B. V., Jana B., and Bagchi B., J. Phys. Chem. A 115, 3691 (2011). 10.1021/jp104787s [DOI] [PubMed] [Google Scholar]
- 13.Bolhuis P. G., Dellago C., and Chandler D., Proc. Natl. Acad. Sci. U. S. A. 97, 5877 (2000). 10.1073/pnas.100127697 [DOI] [PMC free article] [PubMed] [Google Scholar]
- 14.Ma A. and Dinner A. R., J. Phys. Chem. B 109, 6769 (2005). 10.1021/jp045546c [DOI] [PubMed] [Google Scholar]
- 15.Fogarty A. C. and Laage D., J. Phys. Chem. B 118, 7715 (2014). 10.1021/jp409805p [DOI] [PMC free article] [PubMed] [Google Scholar]
- 16.Sterpone F., Stirnemann G., and Laage D., J. Am. Chem. Soc. 134, 4116 (2012). 10.1021/ja3007897 [DOI] [PubMed] [Google Scholar]
- 17.Nerukh D. and Karabasov S., J. Phys. Chem. Lett. 4, 815 (2013). 10.1021/jz400051p [DOI] [PubMed] [Google Scholar]
- 18.Oleinikova A., Sasisanker P., and Weingärtner H., J. Phys. Chem. B 108, 8467 (2004). 10.1021/jp049618b [DOI] [Google Scholar]
- 19.Yang J., Wang Y., Wang L., and Zhong D., J. Am. Chem. Soc. 139, 4399 (2017). 10.1021/jacs.6b12463 [DOI] [PubMed] [Google Scholar]
- 20.Born B., Kim S. J., Ebbinghaus S., Gruebele M., and Havenith M., Faraday Discuss. 141, 161 (2009). 10.1039/b804734k [DOI] [PubMed] [Google Scholar]
- 21.Born B., Weingärtner H., Bründermann E., and Havenith M., J. Am. Chem. Soc. 131, 3752 (2009). 10.1021/ja808997y [DOI] [PubMed] [Google Scholar]
- 22.Armstrong B. D., Choi J., López C., Wesener D. A., Hubbell W., Cavagnero S., and Han S., J. Am. Chem. Soc. 133, 5987 (2011). 10.1021/ja111515s [DOI] [PMC free article] [PubMed] [Google Scholar]
- 23.Nucci N. V., Pometun M. S., and Wand A. J., Nat. Struct. Mol. Biol. 18, 245 (2011). 10.1038/nsmb.1955 [DOI] [PMC free article] [PubMed] [Google Scholar]
- 24.Lewandowski J. R., Halse M. E., Blackledge M., and Emsley L., Science 348, 578 (2015). 10.1126/science.aaa6111 [DOI] [PubMed] [Google Scholar]
- 25.Fecko C. J., Eaves J. D., Loparo J. J., Tokmakoff A., and Geissler P. L., Science 301, 1698 (2003). 10.1126/science.1087251 [DOI] [PubMed] [Google Scholar]
- 26.Hamm P., Lim M., and Hochstrasser R. M., J. Phys. Chem. B 102, 6123 (1998). 10.1021/jp9813286 [DOI] [Google Scholar]
- 27.Reppert M. and Tokmakoff A., Annu. Rev. Phys. Chem. 67, 359 (2016). 10.1146/annurev-physchem-040215-112055 [DOI] [PubMed] [Google Scholar]
- 28.Bouř P. and Keiderling T. A., J. Chem. Phys. 119, 11253 (2003). 10.1063/1.1622384 [DOI] [Google Scholar]
- 29.Ham S., Kim J.-H., Lee H., and Cho M., J. Chem. Phys. 118, 3491 (2003). 10.1063/1.1536980 [DOI] [Google Scholar]
- 30.Hayashi T., Zhuang W., and Mukamel S., J. Phys. Chem. A 109, 9747 (2005). 10.1021/jp052324l [DOI] [PubMed] [Google Scholar]
- 31.la Cour Jansen T. and Knoester J., J. Chem. Phys. 124, 044502 (2006). 10.1063/1.2148409 [DOI] [PubMed] [Google Scholar]
- 32.Wang L., Middleton C. T., Zanni M. T., and Skinner J. L., J. Phys. Chem. B 115, 3713 (2011). 10.1021/jp200745r [DOI] [PMC free article] [PubMed] [Google Scholar]
- 33.Reppert M. and Tokmakoff A., J. Chem. Phys. 138, 134116 (2013). 10.1063/1.4798938 [DOI] [PMC free article] [PubMed] [Google Scholar]
- 34.Reppert M. and Tokmakoff A., J. Chem. Phys. 143, 061102 (2015). 10.1063/1.4928637 [DOI] [PubMed] [Google Scholar]
- 35.Torii H. and Tasumi M., J. Raman Spectrosc. 29, 81 (1998). [DOI] [Google Scholar]
- 36.Ham S., Cha S., Choi J.-H., and Cho M., J. Chem. Phys. 119, 1451 (2003). 10.1063/1.1581855 [DOI] [Google Scholar]
- 37.la Cour Jansen T., Dijkstra A. G., Watson T. M., Hirst J. D., and Knoester J., J. Chem. Phys. 125, 044312 (2006). 10.1063/1.2218516 [DOI] [PubMed] [Google Scholar]
- 38.Hayashi T. and Mukamel S., J. Phys. Chem. B 111, 11032 (2007). 10.1021/jp070369b [DOI] [PubMed] [Google Scholar]
- 39.Maekawa H., De Poli M., Moretto A., Toniolo C., and Ge N.-H., J. Phys. Chem. B 113, 11775 (2009). 10.1021/jp9045879 [DOI] [PubMed] [Google Scholar]
- 40.Woutersen S., Mu Y., Stock G., and Hamm P., Chem. Phys. 266, 137 (2001). 10.1016/s0301-0104(01)00224-5 [DOI] [PMC free article] [PubMed] [Google Scholar]
- 41.Zanni M. T., Asplund M. C., and Hochstrasser R. M., J. Chem. Phys. 114, 4579 (2001). 10.1063/1.1346647 [DOI] [Google Scholar]
- 42.DeCamp M. F., DeFlores L., McCracken J. M., Tokmakoff A., Kwac K., and Cho M., J. Phys. Chem. B 109, 11016 (2005). 10.1021/jp050257p [DOI] [PubMed] [Google Scholar]
- 43.Cho M., J. Chem. Phys. 118, 3480 (2003). 10.1063/1.1536979 [DOI] [Google Scholar]
- 44.Cazade P.-A., Bereau T., and Meuwly M., J. Phys. Chem. B 118, 8135 (2014). 10.1021/jp5011692 [DOI] [PubMed] [Google Scholar]
- 45.Yadav V. K. and Chandra A., J. Phys. Chem. B 119, 9858 (2015). 10.1021/acs.jpcb.5b03836 [DOI] [PubMed] [Google Scholar]
- 46.Woutersen S., Pfister R., Hamm P., Mu Y., Kosov D. S., and Stock G., J. Chem. Phys. 117, 6833 (2002). 10.1063/1.1506151 [DOI] [Google Scholar]
- 47.Kwac K. and Cho M., J. Chem. Phys. 119, 2247 (2003). 10.1063/1.1580807 [DOI] [Google Scholar]
- 48.Kwac K. and Cho M., J. Chem. Phys. 119, 2256 (2003). 10.1063/1.1580808 [DOI] [Google Scholar]
- 49.DeFlores L. P., Ganim Z., Ackley S. F., Chung H. S., and Tokmakoff A., J. Phys. Chem. B 110, 18973 (2006). 10.1021/jp0603334 [DOI] [PubMed] [Google Scholar]
- 50.Bastida A., Soler M. A., Zúñiga J., Requena A., Kalstein A., and Fernández-Alberti S., J. Chem. Phys. 132, 224501 (2010). 10.1063/1.3435212 [DOI] [PubMed] [Google Scholar]
- 51.Jeon J., Cho M., Jeon J., and Cho M., J. Chem. Phys. 135, 214504 (2011). 10.1063/1.3658876 [DOI] [PubMed] [Google Scholar]
- 52.Farag M. H., Bastida A., Ruiz-López M. F., Monard G., and Ingrosso F., J. Phys. Chem. B 118, 6186 (2014). 10.1021/jp500304z [DOI] [PubMed] [Google Scholar]
- 53.Kim Y. S. and Hochstrasser R. M., J. Phys. Chem. B 109, 6884 (2005). 10.1021/jp0449511 [DOI] [PubMed] [Google Scholar]
- 54.Kim Y. S., Wang J., and Hochstrasser R. M., J. Phys. Chem. B 109, 7511 (2005). 10.1021/jp044989d [DOI] [PubMed] [Google Scholar]
- 55.Jansen T. L. C. and Knoester J., J. Phys. Chem. B 110, 22910 (2006). 10.1021/jp064795t [DOI] [PubMed] [Google Scholar]
- 56.DeFlores L. P., Nicodemus R. A., and Tokmakoff A., Opt. Lett. 32, 2966 (2007). 10.1364/ol.32.002966 [DOI] [PubMed] [Google Scholar]
- 57.Pronk S., Páll S., Schulz R., Larsson P., Bjelkmar P., Apostolov R., Shirts M. R., Smith J. C., Kasson P. M., van der Spoel D., Hess B., and Lindahl E., Bioinformatics 29, 845 (2013). 10.1093/bioinformatics/btt055 [DOI] [PMC free article] [PubMed] [Google Scholar]
- 58.Mackerell A. D., Feig M., and Brooks C. L., J. Comput. Chem. 25, 1400 (2004). 10.1002/jcc.20065 [DOI] [PubMed] [Google Scholar]
- 59.Bjelkmar P. P., Larsson P., Cuendet M. A., Hess B., Lindahl E., Bjelkmar P. P., Larsson P., Cuendet M. A., and Hess B., J. Chem. Theory Comput. 6, 459 (2010). 10.1021/ct900549r [DOI] [PubMed] [Google Scholar]
- 60.Huang J. and Mackerell A. D., J. Comput. Chem. 34, 2135 (2013). 10.1002/jcc.23354 [DOI] [PMC free article] [PubMed] [Google Scholar]
- 61.Huang J., Rauscher S., Nawrocki G., Ran T., Feig M., de Groot B. L., Grubmüller H., and MacKerell A. D., Nat. Methods 14, 71 (2016). 10.1038/nmeth.4067 [DOI] [PMC free article] [PubMed] [Google Scholar]
- 62.Berendsen H. J. C., Postma J. P. M., van Gunsteren W. F., DiNola A., and Haak J. R., J. Chem. Phys. 81, 3684 (1984). 10.1063/1.448118 [DOI] [Google Scholar]
- 63.Nosé S., J. Chem. Phys. 81, 511 (1984). 10.1063/1.447334 [DOI] [Google Scholar]
- 64.Hoover W. G., Phys. Rev. A 31, 1695 (1985). 10.1103/physreva.31.1695 [DOI] [PubMed] [Google Scholar]
- 65.Tribello G. A., Bonomi M., Branduardi D., Camilloni C., and Bussi G., Comput. Phys. Commun. 185, 604 (2014). 10.1016/j.cpc.2013.09.018 [DOI] [Google Scholar]
- 66.Reppert M., g_amide, https://github.com/mreppert/g_amide/tree/v1.0.0.
- 67.Torii H., J. Phys. Chem. A 110, 4822 (2006). 10.1021/jp060014c [DOI] [PubMed] [Google Scholar]
- 68.Reppert M. and Feng C.-J., g_spec, https://github.com/mreppert/g_spec/tree/v1.0.0.
- 69.Hamm P., Lim M., DeGrado W. F., and Hochstrasser R. M., Proc. Natl. Acad. Sci. U. S. A. 96, 2036 (1999). 10.1073/pnas.96.5.2036 [DOI] [PMC free article] [PubMed] [Google Scholar]
- 70.Bondarenko A. S. and Jansen T. L. C., J. Chem. Phys. 142, 212437(2015). 10.1063/1.4919716 [DOI] [PubMed] [Google Scholar]
- 71.Kwak K., Park S., Finkelstein I. J., and Fayer M. D., J. Chem. Phys. 127, 124503 (2007). 10.1063/1.2772269 [DOI] [PubMed] [Google Scholar]
- 72.Fenn E. E. and Fayer M. D., J. Chem. Phys. 135, 074502 (2011). 10.1063/1.3625278 [DOI] [PubMed] [Google Scholar]
- 73.Kim Y. S. and Hochstrasser R. M., Proc. Natl. Acad. Sci. U. S. A. 102, 11185 (2005). 10.1073/pnas.0504865102 [DOI] [PMC free article] [PubMed] [Google Scholar]
- 74.Kwak K., Zheng J., Cang H., and Fayer M. D., J. Phys. Chem. B 110, 19998 (2006). 10.1021/jp0624808 [DOI] [PubMed] [Google Scholar]
- 75.Harder E., Eaves J. D., Tokmakoff A., and Berne B. J., Proc. Natl. Acad. Sci. U. S. A. 102, 11611 (2005). 10.1073/pnas.0505206102 [DOI] [PMC free article] [PubMed] [Google Scholar]
- 76.Schmidt J. R., Roberts S. T., Loparo J. J., Tokmakoff A., Fayer M. D., and Skinner J. L., Chem. Phys. 341, 143 (2007). 10.1016/j.chemphys.2007.06.043 [DOI] [Google Scholar]
- 77.Mahoney M. W. and Jorgensen W. L., J. Chem. Phys. 114, 363 (2001). 10.1063/1.1329346 [DOI] [Google Scholar]
- 78.Drost-Hansen W., Science 166, 861 (1969). 10.1126/science.166.3907.861 [DOI] [Google Scholar]
- 79.Oxtoby D. W., Advances in Chemical Physics (John Wiley & Sons, Inc., 1981), pp. 487–519. [Google Scholar]
- 80.Egorov S. A. and Skinner J. L., J. Chem. Phys. 105, 7047 (1996). 10.1063/1.472506 [DOI] [Google Scholar]
- 81.Bloem R., Dijkstra A. G., Jansen T. L. C., and Knoester J., J. Chem. Phys. 129, 055101 (2008). 10.1063/1.2961020 [DOI] [PubMed] [Google Scholar]
- 82.Hajari T. and Bandyopadhyay S., J. Chem. Phys. 146, 225104 (2017). 10.1063/1.4985671 [DOI] [PubMed] [Google Scholar]
- 83.Florová P., Sklenovský P., Banáš P., and Otyepka M., J. Chem. Theory Comput. 6, 3569 (2010). 10.1021/ct1003687 [DOI] [PubMed] [Google Scholar]
- 84.Gaigeot M. P., Vuilleumier R., Sprik M., and Borgis D., J. Chem. Theory Comput. 1, 772 (2005). 10.1021/ct050029z [DOI] [PubMed] [Google Scholar]
- 85.Babin V., Leforestier C., and Paesani F., J. Chem. Theory Comput. 9, 5395 (2013). 10.1021/ct400863t [DOI] [PubMed] [Google Scholar]
- 86.Babin V., Medders G. R., and Paesani F., J. Chem. Theory Comput. 10, 1599 (2014). 10.1021/ct500079y [DOI] [PubMed] [Google Scholar]
- 87.Medders G. R., Babin V., and Paesani F., J. Chem. Theory Comput. 10, 2906 (2014). 10.1021/ct5004115 [DOI] [PubMed] [Google Scholar]
Associated Data
This section collects any data citations, data availability statements, or supplementary materials included in this article.
Supplementary Materials
See supplementary material for the fit parameters in the main text, comparison of frequency time correlation function between different maps, various histograms along backbone dihedral angles, and effects of varying vibrational lifetime or changing the spectral diffusion rates on the simulated spectra.


